Abstract
Background
Obesity and chronic kidney disease (CKD) are highly prevalent worldwide and result in substantial health care costs. Obesity is a predictor of incident CKD and progression to kidney failure. Whether weight loss interventions are safe and effective to impact on disease progression and clinical outcomes, such as death remains unclear.
Objectives
This review aimed to evaluate the safety and efficacy of intentional weight loss interventions in overweight and obese adults with CKD; including those with end‐stage kidney disease (ESKD) being treated with dialysis, kidney transplantation, or supportive care.
Search methods
We searched the Cochrane Kidney and Transplant Register of Studies up to 14 December 2020 through contact with the Information Specialist using search terms relevant to this review. Studies in the Register are identified through searches of CENTRAL, MEDLINE, EMBASE, conference proceedings, the International Clinical Trials Register (ICTRP) Search Portal and ClinicalTrials.gov.
Selection criteria
Randomised controlled trials (RCTs) and quasi‐RCTs of more than four weeks duration, reporting on intentional weight loss interventions, in individuals with any stage of CKD, designed to promote weight loss as one of their primary stated goals, in any health care setting.
Data collection and analysis
Two authors independently assessed study eligibility and extracted data. We applied the Cochrane 'Risk of Bias' tool and used the GRADE process to assess the certainty of evidence. We estimated treatment effects using random‐effects meta‐analysis. Results were expressed as risk ratios (RR) for dichotomous outcomes together with 95% confidence intervals (CI) or mean differences (MD) or standardised mean difference (SMD) for continuous outcomes or in descriptive format when meta‐analysis was not possible.
Main results
We included 17 RCTs enrolling 988 overweight or obese adults with CKD. The weight loss interventions and comparators across studies varied. We categorised comparisons into three groups: any weight loss intervention versus usual care or control; any weight loss intervention versus dietary intervention; and surgical intervention versus non‐surgical intervention. Methodological quality was varied, with many studies providing insufficient information to accurately judge the risk of bias. Death (any cause), cardiovascular events, successful kidney transplantation, nutritional status, cost effectiveness and economic analysis were not measured in any of the included studies. Across all 17 studies many clinical parameters, patient‐centred outcomes, and adverse events were not measured limiting comparisons for these outcomes.
In studies comparing any weight loss intervention to usual care or control, weight loss interventions may lead to weight loss or reduction in body weight post intervention (6 studies, 180 participants: MD ‐3.69 kg, 95% CI ‐5.82 to ‐1.57; follow‐up: 5 weeks to 12 months, very low‐certainty evidence). In very low certainty evidence any weight loss intervention had uncertain effects on body mass index (BMI) (4 studies, 100 participants: MD ‐2.18 kg/m², 95% CI ‐4.90 to 0.54), waist circumference (2 studies, 53 participants: MD 0.68 cm, 95% CI ‐7.6 to 6.24), proteinuria (4 studies, 84 participants: 0.29 g/day, 95% CI ‐0.76 to 0.18), systolic (4 studies, 139 participants: ‐3.45 mmHg, 95% CI ‐9.99 to 3.09) and diastolic blood pressure (4 studies, 139 participants: ‐2.02 mmHg, 95% CI ‐3.79 to 0.24). Any weight loss intervention made little or no difference to total cholesterol, high density lipoprotein cholesterol, and inflammation, but may lower low density lipoprotein cholesterol.
There was little or no difference between any weight loss interventions (lifestyle or pharmacological) compared to dietary‐only weight loss interventions for weight loss, BMI, waist circumference, proteinuria, and systolic blood pressure, however diastolic blood pressure was probably reduced. Furthermore, studies comparing the efficacy of different types of dietary interventions failed to find a specific dietary intervention to be superior for weight loss or a reduction in BMI.
Surgical interventions probably reduced body weight (1 study, 11 participants: MD ‐29.50 kg, 95% CI ‐36.4 to ‐23.35), BMI (2 studies, 17 participants: MD ‐10.43 kg/m², 95% CI ‐13.58 to ‐7.29), and waist circumference (MD ‐30.00 cm, 95% CI ‐39.93 to ‐20.07) when compared to non‐surgical weight loss interventions after 12 months of follow‐up. Proteinuria and blood pressure were not reported.
All results across all comparators should be interpreted with caution due to the small number of studies, very low quality of evidence and heterogeneity across interventions and comparators.
Authors' conclusions
All types of weight loss interventions had uncertain effects on death and cardiovascular events among overweight and obese adults with CKD as no studies reported these outcome measures. Non‐surgical weight loss interventions (predominately lifestyle) appear to be an effective treatment to reduce body weight, and LDL cholesterol. Surgical interventions probably reduce body weight, waist circumference, and fat mass. The current evidence is limited by the small number of included studies, as well as the significant heterogeneity and a high risk of bias in most studies.
Plain language summary
Weight loss interventions for people with chronic kidney disease who are overweight or obese
What is the issue?
People who are overweight or obese with chronic kidney disease (CKD) may experience a faster progression to kidney failure than those who are a healthy weight. Some people with more advanced kidney disease may require treatment such as dialysis or a kidney transplant. Being obese can make these treatments difficult and may increase a person's risk of health complications. There is limited research looking at whether weight loss interventions are safe and beneficial to help people with CKD lose weight, improve their kidney function, and live longer.
What did we do?
We conducted a review of the literature to examine the benefits of weight loss interventions for people with CKD who are overweight or obese.
What did we find?
We identified 17 studies involving 988 overweight or obese adults with CKD looking at whether weight loss interventions improved their health. Studies included adults with CKD stages 1 to 4 or kidney transplant recipients. None of the studies included participants who were undergoing dialysis or supportive care. Weight loss interventions included weight loss diets, physical activity programs, drugs to suppress appetite, and weight loss surgery. The main outcomes we were interested in were death, cardiovascular events, weight loss, body mass index (BMI), waist circumference, protein in the urine (proteinuria), and blood pressure (BP).
After combining the available studies, its uncertain whether weight loss interventions helped people live longer or prevented cardiovascular events such as heart complications or stroke as none of the included studies measured these outcomes. We found when compared to no weight loss interventions, weight loss interventions may lead to more weight loss. There were little or no differences seen in BMI, waist circumference, proteinuria, or BP. We found that weight loss surgery achieved more weight loss than non‐surgical interventions. However, many of the studies included in this review were limited by small participant numbers, high risk of bias and inconsistent reporting of outcome measures leading to the overall quality of the evidence to be very low. This means that we cannot be sure that future studies would find similar results.
Conclusions
The evidence is not very certain but suggests that compared with usual care or control those who participated in weight loss interventions may experience some health benefits including improvements in body weight. Whether these benefits help reduce cardiovascular outcomes and the risk of death remains uncertain and require further study.
Summary of findings
Summary of findings 1. Any weight loss intervention compared to usual care or control.
| Any weight loss intervention versus usual care/control for weight loss in people with chronic kidney disease (CKD) who are overweight or obese | ||||||
| Patient or population: people with CKD who are overweight or obese Setting: various (hospital outpatient clinic, research organisation) Intervention: any weight loss intervention Comparison: usual care or control | ||||||
| Outcomes | Anticipated absolute effects* (95% CI) | Relative effect (95% CI) | No. of participants (studies) | Certainty of the evidence (GRADE) | Comments | |
| Risk with usual care/control | Risk with weight loss intervention | |||||
| Death (any cause) | This outcome was not reported by any of the included studies | ‐ | ‐ | ‐ | ‐ | ‐ |
| Cardiovascular events | This outcome was not reported by any of the included studies | ‐ | ‐ | ‐ | ‐ | ‐ |
| Weight loss Follow up: range 5 weeks to 12 months | Mean weight loss ranged across control groups from 0.3 to 0.7 kg; mean post intervention body weight ranged from 86 to 136 kg The mean weight loss in the intervention group was 3.69 kg lower than the control group (5.82 lower to 1.57 lower) |
‐ | 180 (6) | ⊕⊝⊝⊝ VERY LOW 1 2 3 4 | Majority of studies from lifestyle interventions No studies involving surgical interventions |
|
| Body mass index (BMI) Follow up: range 3 to 12 months | The mean BMI across control groups ranged from 28 to 38 kg/m² The mean BMI in the intervention group was 2.18 kg/m² lower than the control group (4.90 lower to 0.54 higher) |
‐ | 100 (4) | ⊕⊝⊝⊝ VERY LOW 1 2 3 4 | All of studies from lifestyle interventions No studies involving pharmacological or surgical interventions |
|
| Waist circumference Follow up: range 3 to 12 months | The mean waist circumference across control groups ranged from 96 to 103 cm The mean weight circumference in the intervention group was 0.68 cm lower than the control group (7.6 lower to 6.24 higher) |
‐ | 53 (2) | ⊕⊝⊝⊝ VERY LOW 1 2 3 4 | All of studies from lifestyle interventions No studies involving pharmacological or surgical interventions |
|
| Proteinuria Follow up: range 3 to 12 months | The mean proteinuria across control groups ranged from 0.5 to 3.5 g/day The mean proteinuria in the intervention group was 0.29 g/day lower than the control group (0.76 lower to 0.18 higher) |
‐ | 84 (4) | ⊕⊝⊝⊝ VERY LOW 1 2 3 4 | All of studies from lifestyle interventions No studies involving pharmacological or surgical interventions |
|
|
Systolic blood pressure (SBP)
Follow up: range 3 to 6 months Diastolic blood pressure (DBP) Follow up: range 3 to 6 months |
The mean SBP across control groups ranged from 123 to 140 mmHg The mean SBP in the intervention group was ‐3.45 mmHg lower than the control group (‐9.99 lower to 3.09 higher) The mean DBP across control groups ranged from 75 to 89 mmHg The mean DBP in the intervention group was ‐2.02 mmHg lower than the control group (‐3.79 lower to 0.24 higher) |
‐ | 139 (4) | ⊕⊝⊝⊝ VERY LOW 1 2 3 4 | All of studies from lifestyle interventions No studies involving pharmacological or surgical interventions |
|
| CI: confidence interval; MD: mean difference | ||||||
| GRADE Working Group grades of evidence High certainty: We are very confident that the true effect lies close to that of the estimate of the effect Moderate certainty: We are moderately confident in the effect estimate: The true effect is likely to be close to the estimate of the effect, but there is a possibility that it is substantially different Low certainty: Our confidence in the effect estimate is limited: The true effect may be substantially different from the estimate of the effect Very low certainty: We have very little confidence in the effect estimate: The true effect is likely to be substantially different from the estimate of effect | ||||||
1 Evidence certainty downgraded one level for indirectness
2 Evidence certainty downgraded one level for imprecision
3 Evidence certainty downgraded one level for uncertain or high risk of bias
4 Evidence certainty downgraded one level for moderate heterogeneity
Background
Description of the condition
Obesity and chronic kidney disease (CKD) are highly prevalent worldwide and result in substantial healthcare burdens. Overweight and obesity are defined as ''abnormal or excessive fat accumulation that presents a risk to health'' and are commonly defined by a measure of body mass index (BMI) (WHO 2017). A BMI of > 25 kg/m² is considered overweight and a BMI > 30 kg/m² is considered obese. Since 1980, worldwide obesity has almost doubled and approximately 39% of adults are now overweight and 13% are obese (WHO 2017). In 2015, an increased BMI accounted for around 4 million deaths and 120 million disability‐adjusted life years (DALYs) worldwide (Afshin 2017).
CKD is defined as “kidney damage for ≥ 3 months, as defined by structural or functional abnormalities of the kidney, with or without decreased glomerular filtration rate (GFR) or GFR < 60 mL/min/1.73 m² for ≥ 3 months, with or without kidney damage” (KDIGO 2013). CKD is categorised into five stages, with the fifth stage, end‐stage kidney disease (ESKD) requiring kidney replacement therapy (KRT) for survival (KDIGO 2013). An estimated 11% to 13% of adults worldwide have CKD with the prevalence steadily increasing (Hill 2016). All stages of CKD have an increased risk of cardiovascular disease (CVD), increased death and poorer quality of life (van der Velde 2011; Weiner 2004). Global death rates for CKD rose by 41% between the years 1990 to 2016 (GBD 2016) and CKD is now the 13th leading male and 11th leading female risk of DALYs (GBD 2017) and accounts for 25% of all BMI‐related DALYs (Afshin 2017).
Obesity is considered a strong predictor of new onset of CKD and progression to ESKD (Kovesdy 2017; Tsujimoto 2014). In the general population, compared to those of a healthy weight (BMI of 20to 25 kg/m²), obese adults with a BMI ≥ 35 kg/m² are at a 122% increased risk of developing of ESKD (Herrington 2017). Obesity increases the risk of developing diabetes and hypertension, which are the two leading causes of CKD. Furthermore, in obese individuals, a compensatory hyperfiltration occurs to meet the increased metabolic demands of the higher body weight (Darouich 2011). The ensuing increase in intraglomerular pressure can damage the kidneys and raise the risk of developing CKD in the long term. For those who reach ESKD, obesity adversely affects eligibility for kidney transplantation (Ladhani 2017), with morbidly obese patients 44% less likely to receive a donor kidney (Segev 2008).
A recent systematic review exploring the association between obesity and cardiovascular morbidity and death in CKD (Ladhani 2017), highlighted that obesity (defined by BMI) may be protective for death (any cause) in the predialysis and haemodialysis (HD) populations, but not in peritoneal dialysis (PD) or transplant recipients. This relationship however is unlikely to be linear, with the highest risk of death occurring at extreme BMI categories. The biological rationale for the obesity paradox across different CKD stages remains unclear. It is proposed that obesity may lead to improved stem cell mobilisation, better bone strength, improved haemodynamic tolerance, and preserved energy stores (Stenvinkel 2008). However the relationship remains complex and is likely confounded by a number of factors including muscle mass, life expectancy, co‐morbidities, nutritional status, and measurement of obesity (Ladhani 2017; Stenvinkel 2008). These conflicting data demonstrate gaps in our current understanding of the links between obesity, kidney disease and clinical outcomes. Accordingly, this places emphasis on evaluating the safety and efficacy of weight loss interventions in obese or overweight patients with CKD (of various stages).
Description of the intervention
This review focused on interventions designed to promote intentional weight loss to improve patient outcomes. Weight loss interventions are typically aimed towards reducing an individual’s energy intake and/or increasing daily energy expenditure in order to induce weight loss, and can be broadly classified into lifestyle, pharmacological and surgical interventions. Lifestyle interventions included those exploring diet, physical activity, exercise, or behavioural strategies used in isolation or in combination to reduce energy intake and/or increase energy expenditure. Pharmacological interventions included interventions using drugs, which reduce absorption or suppress appetite. Surgical interventions included restrictive surgery designed to limit food intake (i.e. gastric banding or sleeve gastrectomy) or cause malabsorption (i.e. intestinal bypass) or both (i.e. gastric bypass). This review included these interventions used alone or in combination.
How the intervention might work
Both surgical and non‐surgical weight loss interventions have been explored in CKD patients, and may play an important role in slowing the progression of CKD and its associated risk factors; diabetes, hypertension, dyslipidaemia, and CVD (Ash 2006). While both weight loss interventions result in reductions in BMI, the magnitude is greater in those receiving surgical intervention (Bolignano 2013; Navaneethan 2009). Non‐surgical interventions have proven to be a successful and cost effective therapy in the CKD population; demonstrating short‐term weight reduction and corresponding improvements in systolic blood pressure (SBP), lipid profile and proteinuria (Bolignano 2013; Navaneethan 2009). However in practice many people are unable to maintain lifestyle change and regain lost body weight. Consequently these interventions may fail to achieve sustained weight loss, reductions in cardiorenal and metabolic risks and induce sufficient weight loss for transplant consideration in many obese patients (Weiner 2004). Bariatric surgery is currently considered the most effective weight loss intervention to achieve long‐term weight loss in morbidly obese individuals (Colquitt 2014); and has been evaluated in obese individuals with CKD as an approach to achieve sustained weight loss and examine kidney function (Chang 2017). Evidence from observational studies have shown that weight loss achieved through bariatric surgery can reduce the effects of CKD by reducing glomerular hyperfiltration, proteinuria, albuminuria, blood pressure (BP), hyperglycaemia and may induce diabetes remission (Bolignano 2013; Chang 2017). This may have important clinical applications as early bariatric surgery may assist with reversal of diabetes, hypertension and glomerular hyperfiltration possibly preventing further kidney injury. This may delay the need for KRT, open up opportunities for kidney transplantation and decrease the significant health burden associated with obesity and CKD.
Why it is important to do this review
The incidences of obesity and CKD continue to escalate and are contributing to more global death, morbidity, disability, and healthcare cost than ever before (Hill 2016). Whether weight loss can reverse these impacts however remains unclear and few practice guidelines exist regarding appropriate strategies for weight management in people with CKD (Lambert 2017). Reducing and managing obesity may reverse or slow CKD progression and enable transplantation as a treatment option for more individuals (Chang 2017; Lassalle 2017). However, weight loss interventions in people with CKD are not without risk. Lifestyle interventions such as very low energy diets may cause electrolyte disturbances, fluid overload, constipation, uraemia, and blood glucose disturbances in those with diabetes (Lambert 2017). Weight loss medication such as lipase inhibitors may cause steatorrhoea, abdominal pain, flatulence, and increase the risk of oxalate nephropathy and kidney stones (Navaneethan 2009). Surgical interventions may be associated with higher rates of complications, such as band erosion, gastric leak and acute kidney injury (AKI) when compared with the non‐CKD population and surgeries featuring malabsorption appear to increase the risk of nephrolithiasis and oxalate nephropathy (Chang 2017; Weiner 2004). Furthermore highly restrictive diets post bariatric surgery can lead to dietary intakes well below recommended daily nutrient targets increasing risk of long‐term nutrient deficiencies (Colquitt 2014). This systematic review aimed to provide a current and comprehensive review of weight reduction interventions in CKD by including both overweight and obese adults at all stages of CKD (including pre dialysis, dialysis, supportive care, or kidney transplantation). This will provide a better understanding of the balance of benefits and harms of weight loss in CKD which will help better inform clinical decision‐making by clinicians, patients, and their caregivers.
Objectives
This review aimed to evaluate the safety and efficacy of intentional weight loss interventions in overweight and obese adults with CKD; including those with ESKD being treated with dialysis, kidney transplantation, or supportive care.
Methods
Criteria for considering studies for this review
Types of studies
We included randomised controlled trials (RCTs) and quasi RCTs (RCTs in which allocation to treatment was obtained by alternation, use of alternate medical records, date of birth or other predictable methods) looking at the efficacy of intentional weight loss interventions in adults with CKD.
Types of participants
Inclusion criteria
Adults who were overweight (as defined by BMI 25 kg/m² to 29.9 kg/m²) or obese (as defined by BMI ≥ 30 kg/m²) (WHO 2017) with pre‐existing CKD defined by the Kidney Disease: Improving Global Outcomes (KDIGO 2013) "kidney damage for ≥ 3 months, as defined by structural or functional abnormalities of the kidney, with or without decreased GFR, or GFR < 60 mL/min/1.73m² for ≥ 3 months, with or without kidney damage". The review included individuals with CKD or ESKD treated with dialysis (both HD and PD), kidney transplantation, or supportive care.
Subgroup data from studies who had participants meeting our inclusion criteria were included in the review if data were available for those who met the inclusion criteria. In studies where subgroup data for those who met the inclusion was not available, if > 75% of participants met the inclusion criteria then the study with the whole group analysis were included in the review.
Exclusion criteria
The review excluded studies involving pregnant women, children (younger than 18 years) and people with an AKI.
Types of interventions
We investigated studies reporting on intentional weight loss interventions of at least four weeks in duration, designed to promote weight loss as one of their primary stated goals, in any health care setting.
These studies included:
Lifestyle interventions, including dietary interventions (i.e. energy restricted diet, very low energy dense diet), physical activity interventions (i.e. aerobic exercise, resistance exercise, group exercise programs), behavioural change interventions (strategies to assist with lifestyle modification i.e. self‐monitoring of eating habits, stress management), and combination lifestyle interventions (using any combination of diet, exercise and/or behavioural interventions)
Pharmacological interventions, including appetite suppressants, drugs that cause fat malabsorption of any dose and route, pharmacological plus lifestyle interventions.
Surgical interventions, including sleeve gastrectomy, gastric banding, or bypass procedure
We planned to compare any of these interventions with any other intervention, placebo, or usual care. The comparisons separated by intervention type were as follows:
Any weight loss intervention versus usual care or control (main comparison)
Any weight loss intervention versus dietary intervention and
Surgical intervention versus non‐surgical intervention
Types of outcome measures
Primary outcomes
Death (any cause)
Cardiovascular events
Anthropometric measures (weight loss, body weight, BMI, waist circumference, waist‐to‐hip ratio, and body composition)
Secondary outcomes
1. Clinical parameters
Kidney function measures: measured GFR, creatinine clearance (CrCl), serum creatinine (SCr), proteinuria, albuminuria, glomerular hyperfiltration (as defined and measured by study investigators). These parameters were assessed in participants with CKD stages 1 to 4 and those who have had a kidney transplant. These parameters were not assessed in participants undergoing dialysis.
BP: SBP and diastolic (DBP), anti‐hypertensive medication changes
Blood glucose: glycosylated haemoglobin (HbA1c), fasting blood glucose, hypoglycaemic medication changes
Lipid profile: total cholesterol, low density lipoprotein (LDL) cholesterol, high density lipoprotein (HDL) cholesterol, triglycerides, lipid lowering medication changes
Successful kidney transplantation
Inflammation (C‐reactive protein).
2. Patient‐centred outcomes using validated tools or self‐reported data
Adherence to treatment
Health‐related quality of life (HRQoL)
Nutritional status
Dietary intake
Physical activity behaviours.
3. Cost effectiveness and economic analysis
Cost per DALYs or quality‐adjusted life year (QALY)
Cost associated with weight loss intervention.
4. Adverse events and potential harms
Hospitalisation
Adverse patient outcomes associated with each weight loss intervention
Biochemical adverse effects such as hyperkalaemia or hyperphosphataemia.
Search methods for identification of studies
Electronic searches
We searched the Cochrane Kidney and Transplant Specialised Register up to 14 December 2020 through contact with the Information Specialist using search terms relevant to this review. The Cochrane Kidney and Transplant Specialised Register contains studies identified from several sources.
Monthly searches of the Cochrane Central Register of Controlled Trials (CENTRAL)
Weekly searches of MEDLINE OVID SP
Searches of kidney and transplant journals, and the proceedings and abstracts from major kidney and transplant conferences
Searching of the current year of EMBASE OVID SP
Weekly current awareness alerts for selected kidney and transplant journals
Searches of the International Clinical Trials Register (ICTRP) Search Portal and ClinicalTrials.gov.
Studies contained in the Register are identified through searches of CENTRAL, MEDLINE, and EMBASE based on the scope of Cochrane Kidney and Transplant. Details of search strategies, as well as a list of handsearched journals, conference proceedings and current awareness alerts, are available on the Cochrane Kidney and Transplant website.
See Appendix 1 for search terms used in strategies for this review.
Searching other resources
Reference lists of review articles, relevant studies, and clinical practice guidelines.
Letters seeking information about unpublished or incomplete studies to investigators known to be involved in previous studies.
Data collection and analysis
Selection of studies
We used the search strategy described to obtain titles and abstracts of studies that may be relevant to the review. The titles and abstracts were screened independently by two authors. Studies that were not relevant were discarded. However studies and reviews thought to include relevant data or information on studies were retained initially. Two authors independently assessed retrieved abstracts, and when necessary the full text of these studies to determine which studies satisfied the inclusion criteria. Any differences were resolved by discussion and, when necessary, by consultation with a third author.
Data extraction and management
For the studies that fulfilled the inclusion criteria, data extraction was carried out by two independent authors using standard data extraction forms. Studies reported in non‐English language were translated before assessment. Where more than one publication from the same study was found, reports were grouped together and the publication with the most complete data was used in the analyses. Where relevant outcomes were only published in earlier versions, these data were used. Any discrepancy between published versions were highlighted and any disagreements that were not resolved through discussion between the two authors were resolved in consultation with a third author.
Assessment of risk of bias in included studies
The following items were independently assessed by two authors using the risk of bias assessment tool (Higgins 2011) (see Appendix 2).
Was there adequate sequence generation (selection bias)?
Was allocation adequately concealed (selection bias)?
-
Was knowledge of the allocated interventions adequately prevented during the study?
Participants and personnel (performance bias)
Outcome assessors (detection bias)
Were incomplete outcome data adequately addressed (attrition bias)?
Are reports of the study free of suggestion of selective outcome reporting (reporting bias)?
Was the study apparently free of other problems that could put it at a risk of bias?
Measures of treatment effect
For dichotomous outcomes (e.g. death, CVD), results were expressed as risk ratio (RR) with 95% confidence intervals (CI). Where continuous scales of measurement were used to assess the effects of treatment (anthropometric and biochemical markers), the mean difference (MD) was used, or the standardised mean difference (SMD) was used if different scales were used.
Unit of analysis issues
Cluster‐randomised studies
There were no cluster‐randomised studies included in this meta‐analysis.
Cross‐over studies
Cross‐over studies were analysed using only the data from the first period.
Studies with more than two treatment arms
Studies with multiple intervention groups were included. When considering these studies we tried to combine all relevant experimental intervention groups of the study into a single group and combined all relevant control intervention groups into a single group to enable single pair wise comparison.
Dealing with missing data
Any further information required from the original authors was requested by written correspondence (emailing corresponding author) and any relevant information obtained in this manner was included in the review. Evaluation of important numerical data, such as number of patients screened, randomised patients as well as intention‐to‐treat, as‐treated and per‐protocol populations, was performed. Attrition rates, for example drop‐outs, losses to follow‐up and withdrawals were investigated. Issues of missing data and imputation methods (for example, last‐observation‐carried‐forward) were critically appraised (Higgins 2011).
Assessment of heterogeneity
We first assessed the heterogeneity by visual inspection of the forest plot. Heterogeneity was then analysed using the I² statistic, which describes the percentage of total variation across studies that is due to heterogeneity rather than sampling error (Higgins 2003). A guide to the interpretation of I² values was as follows.
0% to 40%: might not be important
30% to 60%: may represent moderate heterogeneity
50% to 90%: may represent substantial heterogeneity
75% to 100%: considerable heterogeneity
The importance of the observed value of I² depends on the magnitude and direction of treatment effects and the strength of evidence for heterogeneity (e.g. P‐value from the Chi² test, or a confidence interval for I²) (Higgins 2011).
Assessment of reporting biases
Due to the small number of studies we were unable to assess for the existence of small study bias using funnel plots.
Data synthesis
We classified our studies by type of intervention lifestyle: including dietary, physical activity, behaviour change, pharmacological and surgical interventions. Data were summarised using the random‐effects model although the fixed‐effects model was also analysed to ensure robustness of the model chosen and susceptibility to outliers. When evidence of sizeable clinical, methodological, and statistical heterogeneity across included studies was evident across studies we were not able to pool results to from a meta‐analysis and instead a reported a narrative approach to this data synthesis.
Subgroup analysis and investigation of heterogeneity
To explore for possible sources of heterogeneity in our protocol we stated we would conduct the following subgroup analyses if adequate data were available.
BMI (overweight versus obese)
Stage of CKD and modality (HD, PD, transplantation, supportive care)
Duration of intervention (≤ 3 months versus > 3 months)
Chief causes of CKD, (diabetes, hypertension, glomerulonephritis, polycystic kidney disease, reflux kidney disease)
Presence or absence of proteinuria
Sensitivity analysis
Where sufficient studies were available, we investigated the following:
Repeating the analysis excluding unpublished studies;
Repeating the analysis taking account of risk of bias, as specified;
Repeating the analysis excluding any very long or large studies to establish how much they dominate the results; and
Repeating the analysis excluding studies using the following filters: diagnostic criteria, language of publication, source of funding (industry versus other), country.
Summary of findings and assessment of the certainty of the evidence
We presented the main results of the review in 'Summary of findings' tables. These tables present key information concerning the quality of the evidence, the magnitude of the effects of the interventions examined, and the sum of the available data for the main outcomes (Schunemann 2011a). The 'Summary of findings' tables also include an overall grading of the evidence related to each of the main outcomes using the GRADE (Grades of Recommendation, Assessment, Development and Evaluation) approach (GRADE 2008; GRADE 2011). The GRADE approach defines the quality of a body of evidence as the extent to which one can be confident that an estimate of effect or association is close to the true quantity of specific interest. The quality of a body of evidence involves consideration of within‐trial risk of bias (methodological quality), directness of evidence, heterogeneity, precision of effect estimates and risk of publication bias (Schunemann 2011b).
The key outcomes presented in the Summary of findings Table 1 include:
Death (any cause)
Cardiovascular events
Weight loss/post intervention body weight
BMI
Waist circumference
Proteinuria
BP: SBP and DBP.
Results
Description of studies
For a detailed description of studies, see Characteristics of included studies; Characteristics of excluded studies and Characteristics of ongoing studies sections.
Results of the search
The electronic search of the Cochrane Kidney and Transplant Specialised Register (up to 14 December 2020) identified 154 records. An additional 39 records were found when we searched the reference lists of included studies and relevant reviews, resulting in a total of 193 unique records.
We screened the titles and abstracts of these 193 records and a further 84 records were excluded (not randomised, wrong population and/or interventions). We obtained and reviewed the remaining 109 full‐text records (33 studies). A further 55 records were excluded (not intentional weight intervention studies, ≤ 4 weeks duration). Two ongoing studies were identified (HHK 2018; Spaggiari 2020); these studies will be assessed in a future update of this review. Thirty‐three records from 17 studies met the inclusion criteria (see Figure 1).
1.
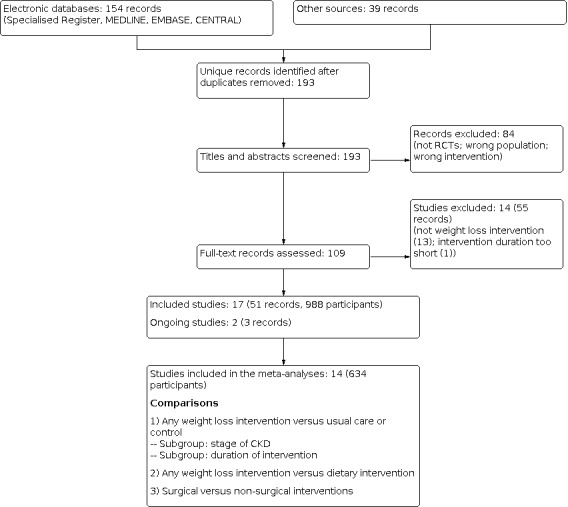
Study flow diagram.
Included studies
The Characteristics of included studies table provides details of the included studies. The following gives a brief overview.
Included studies were published between 1975 and 2019. Data were obtained from both published literature, supplementary unpublished data, and trial registers. Additional data were requested for 11 studies via correspondence with study authors (see Appendix 3). One study was translated from Czech to English (Teplan 2006).
Study design
This review included 17 studies (51 reports; 988 randomised participants). Sixteen studies had a parallel design and one study (Tomlinson 1975) had a cross‐over design. The majority (11) were single centre studies (Baria 2014; DIRECT 2013; Jesudason 2013; Kittiskulnam 2014; LANDMARK 3 2013; Leehey 2009; Leehey 2016; Morales 2003a; Orazio 2011; Praga 1995; Tomlinson 1975) and were carried out in hospital outpatient clinics (Baria 2014; Ikizler 2018; Kittiskulnam 2014; LANDMARK 3 2013; Leehey 2009; Leehey 2016; MacLaughlin 2014; Morales 2003a; Orazio 2011; Praga 1995; Tomlinson 1975).
Location of studies
Five of the 17 included studies were conducted in the USA (Ikizler 2018; Leehey 2009; Leehey 2016; Tzvetanov 2015; Woolf 2017), three were in Australia (Jesudason 2013; LANDMARK 3 2013; Orazio 2011), two each in Spain (Morales 2003a; Praga 1995), the UK (MacLaughlin 2014; Tomlinson 1975) and Czech Republic (Teplan 2002; Teplan 2006), and one study each in Thailand (Kittiskulnam 2014), Israel (DIRECT 2013) and Brazil (Baria 2014).
Participants
The included studies involved a total of 988 overweight or obese participants with CKD. The number of participants in included studies ranged from 6 to 258. The mean age of participants was 42.5 ± 4.5 to 65.9 ± 9.7 years. Thirteen studies (620 participants) investigated the effects of weight loss in people with CKD stages 1 to 4 and four studies (368 participants) were conducted with transplant recipients (Orazio 2011; Teplan 2002; Tomlinson 1975; Tzvetanov 2015). None of the included studies involved participants undergoing dialysis (HD or PD) nor supportive care.
Comparisons
We identified three comparisons for analysis, separated by intervention type.
1) Any weight loss intervention versus usual care or control (main comparison)
Lifestyle versus usual care
-
Dietary versus usual care or control
Morales 2003a evaluated a daily energy restriction of 2100 kJ versus usual dietary intake
Kittiskulnam 2014 compared a daily energy restriction of 2100 kJ with a daily protein target of 0.6 to 0.8 g/kg/day versus no energy restriction and a daily protein target of 0.6 to 0.8g/kg/day
Praga 1995 evaluated a daily energy intake of 4200 to 5900 kJ/day versus usual diet habits plus captopril treatment.
-
Physical activity versus usual care or control
Baria 2014 evaluated the effects of in‐centre and home‐based aerobic exercise performed 3 times/week for 12 weeks versus control
Leehey 2009 compared the effects of 3 times/week aerobic exercise training for 6 weeks in centre followed by 18 weeks of supervised home exercise versus usual care.
-
Behavioural versus usual care or control
Woolf 2017 compared the differences in weight between an intensive Social Cognitive Theory–based lifestyle intervention to a standard behaviour treatment over 6 months.
-
Mixed lifestyle versus usual care or control
The effects of lifestyle intervention consisting of dietary modifications and increasing physical activity on metabolic outcomes compared to usual care was examined in CKD recipients in two studies (Ikizler 2018; LANDMARK 3 2013) and in transplant recipients in one study (Orazio 2011).
Pharmacological versus usual care or control
-
Appetite suppressant versus dietary
Tomlinson 1975 (trial 2) evaluated the effects of fenfluramine compared to placebo over 6 weeks among transplant recipients.
Mixed intervention versus usual care or control
-
Lifestyle (dietary) plus pharmacological (appetite suppressant) versus usual care or control
Teplan 2002 assessed the effects of a hypo‐energetic and hypolipidaemic diet supplemented with orlistat compared to usual care over 3 years.
2) Any weight loss intervention versus dietary intervention
Lifestyle (dietary) versus lifestyle (dietary)
DIRECT 2013 explored the effects of 3 different diets; a low fat energy restricted diet (6300 kJ for women and 7500 kJ for men with a goal of 30% energy coming from fat); a Mediterranean energy restricted diet (6300 kJ for women and 7500 kJ for men, goal no more than 35% of energy from fat, main sources of fat were 30 to 45 g of olive oil and a handful of nuts per day) and a low carbohydrate non‐energy restricted diet (modified Atkins diet ‐ goal for 20 g of carbohydrates per day for the 2‐month induction phase gradual increase to a maximum of 120 g/day ‐ the intake of total energy, protein, and fat were not limited).
Teplan 2006 investigated the effects of a low protein (0.6 g/kg/day) and energy restricted diet (120 to 125 kJ/kg/day for the first 6 months then 125 to 130 kJ/kg/day thereafter for 3 years) supplemented twice with either keto acid supplementation or placebo.
Jesudason 2013 evaluated the effects of a moderate versus standard protein weight loss diet 6000 kJ/day for women, or 7000 kJ/day for men with either a protein intake goal of 90 to 120 g/day (moderate protein) or 55 to 70 g/day (standard protein).
Lifestyle (dietary and exercise) versus lifestyle (dietary)
Leehey 2016 examined the effects of an exercise and diet intervention (12 weeks of 3 times/week exercise training followed by 40 weeks of supervised home exercise plus daily 800 to 1000 kJ energy restriction) versus usual medical care.
Lifestyle (dietary) versus lifestyle (dietary)
DIRECT 2013, Jesudason 2013 and Teplan 2006 examined the effects of various energy restricted diets on weight loss and kidney function.
Pharmacological (appetite suppressant) versus dietary
Tomlinson 1975 (trial 1) evaluated the effects of fenfluramine compared to placebo over 6 weeks.
3) Surgical intervention versus non‐surgical intervention
Surgical (sleeve gastrectomy) versus lifestyle (standard weight loss program)
Tzvetanov 2015 explored the effectiveness of combined robotic kidney transplantation and sleeve gastrectomy versus robotic kidney transplantation and standard weight loss program.
Surgical (sleeve gastrectomy) versus pharmacological (lipase inhibitor) and lifestyle (dietary)
MacLaughlin 2014 explored the effect of sleeve gastrectomy compared to best medical care (individualised dietary and physical activity prescription plus orlistat).
A summary of included studies and the types of weight loss interventions and the main comparators used can be found in Appendix 4. Most (13 studies) explored the effects of lifestyle weight loss. Of these, eight compared lifestyle interventions against usual care or control (Baria 2014; Kittiskulnam 2014; LANDMARK 3 2013; Leehey 2009; Morales 2003a; Orazio 2011; Praga 1995; Woolf 2017), four compared lifestyle interventions to other lifestyle interventions (DIRECT 2013; Jesudason 2013; Leehey 2016; Teplan 2006) and one study (Ikizler 2018) compared the effects of three different lifestyle interventions to usual activity and diet. Two studies explored the efficacy of pharmacological interventions (Teplan 2002; Tomlinson 1975) and two studies compared mixed interventions not involving bariatric surgery to bariatric surgery (MacLaughlin 2014; Tzvetanov 2015).
Excluded studies
During the full text screening a total of 55 records (14 studies) were excluded. The main reasons for exclusion were not a weight loss intervention or study duration < 4 weeks. See Characteristics of excluded studies table for reasons for excluding each study.
Risk of bias in included studies
For details on risk of bias of included studies, see Characteristics of included studies. Methodological quality was quite varied, with many studies providing insufficient information to accurately judge the risk of bias. A summary of authors' judgements of the risk of bias for all included studies are shown in Figure 2; and risk of bias in each individual study is shown in Figure 3.
2.
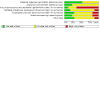
Risk of bias graph: review authors' judgements about each risk of bias item presented as percentages across all included studies.
3.
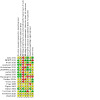
Risk of bias summary: review authors' judgements about each risk of bias item for each included study.
Allocation
Random sequence generation
Random sequence generation was judged as low risk of bias in nine studies (DIRECT 2013; Ikizler 2018; Jesudason 2013; Kittiskulnam 2014; LANDMARK 3 2013; Leehey 2009; Leehey 2016; MacLaughlin 2014; Teplan 2006) and unclear in the remaining eight studies.
Allocation concealment
Four studies (Jesudason 2013; Leehey 2016; MacLaughlin 2014; Tomlinson 1975) described allocation concealment methods and all were assessed as low risk of bias. In the remaining 13 studies the risk of bias was unclear as the method of concealment was not adequately described to permit judgement.
Blinding
Performance bias: participants
We judged two studies (Teplan 2006; Tomlinson 1975) to have a low risk of performance bias as participants were blinded to treatment allocation. We judged 11 studies as being at high risk of performance bias (Baria 2014; DIRECT 2013; Ikizler 2018; Jesudason 2013; Kittiskulnam 2014; LANDMARK 3 2013; Leehey 2009; Leehey 2016; MacLaughlin 2014; Morales 2003a; Orazio 2011) and four studies as having unclear risk of performance bias (Praga 1995; Teplan 2002; Tzvetanov 2015; Woolf 2017).
Performance bias: personnel
The risk of performance bias was assessed as being low in three studies (DIRECT 2013; Teplan 2006; Tomlinson 1975) high in five studies (Ikizler 2018; Kittiskulnam 2014; LANDMARK 3 2013; Leehey 2016; Morales 2003a) and unclear in nine studies (Baria 2014; Jesudason 2013; Leehey 2009; MacLaughlin 2014; Orazio 2011; Praga 1995; Teplan 2002; Tzvetanov 2015; Woolf 2017).
Detection bias
We assessed the risk of detection bias for objective outcomes as low for all studies regardless of whether or not outcome assessors were blinded.
In the seven studies that included subjective outcomes measures we judged detection bias to be low in two studies (DIRECT 2013; Leehey 2016), high in one study (Kittiskulnam 2014) as they did not undertake blinding of outcome assessors, and unclear in four studies (Baria 2014; Jesudason 2013; LANDMARK 3 2013; MacLaughlin 2014) because blinding was not adequately reported.
Incomplete outcome data
Only five studies (Baria 2014; DIRECT 2013; Ikizler 2018; Kittiskulnam 2014; LANDMARK 3 2013) were considered to be at low risk of attrition bias. Three studies (Jesudason 2013; MacLaughlin 2014; Tomlinson 1975) were assessed to be at high risk of bias as more than 20% of participants were lost to follow‐up. Attrition bias in the remaining nine studies was judged unclear due to insufficient information.
Selective reporting
We judged studies to be at high risk of reporting bias if planned outcomes were not adequately reported. Four studies (DIRECT 2013; LANDMARK 3 2013; Leehey 2009; Teplan 2002) were judged to be at low risk of selective reporting bias. Three studies (Jesudason 2013; MacLaughlin 2014; Praga 1995) were judged to be at high risk of selective reporting bias, and 10 studies were judged unclear risk due to insufficient information available to permit judgement.
Other potential sources of bias
Two studies were assessed as high risk of other bias: MacLaughlin 2014 used blocked randomisation in an unblinded RCT and the study had a very low recruitment uptake of 10%, and DIRECT 2013 used post hoc reporting of sub‐groups with CKD stages 3 to 4. Five studies (Baria 2014; Ikizler 2018; Morales 2003a; Orazio 2011; Tomlinson 1975) appeared to be free of other sources of bias and were judged low risk. The remaining 10 studies were assessed to have unclear risk of bias due to insufficient information to permit judgement.
Effects of interventions
See: Table 1
See Table 1 for the main comparison weight loss interventions (lifestyle, pharmacological, bariatric surgery) compared to usual care or placebo in CKD populations.
The studies were analysed using both random effects and fixed effects models and found no difference between the two models. The results below therefore refer to those obtained using a random‐effects model.
Primary outcomes
Death (any cause) and cardiovascular events
None of the included studies evaluated the effects of weight loss on death or cardiovascular events.
Weight loss
Weight loss interventions compared to usual care or control may lead to weight loss and reduced post intervention body weight (Analysis 1.1 (6 studies, 180 participants): MD ‐3.69 kg, 95% CI ‐5.82 to ‐1.57; I² = 59%). The certainty of the evidence was very low due to high or uncertain risk of bias, moderate heterogeneity, imprecision, and indirectness. Three additional studies (Ikizler 2018; Tomlinson 1975; Woolf 2017) had data which could not be statistically pooled, however were consistent with the meta‐analysis, with all three reporting significant improvements in body weight in the weight loss intervention groups compared to their respective control.
1.1. Analysis.
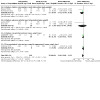
Comparison 1: Any weight loss intervention versus usual care or control, Outcome 1: Mean weight loss [kg] or post intervention body weight
There was little or no difference between any weight loss intervention compared to dietary interventions for weight loss (Analysis 2.1 (3 studies, 155 participants): MD 0.76 kg, 95% CI ‐2.125 to 3.66; I² = 0%). Ikizler 2018 could not be pooled however reported similar findings to the meta‐analysis. DIRECT 2013, which had three different dietary arms, remained robust to the primary finding when each intervention comparison was rotated through Analysis 2.1.
2.1. Analysis.
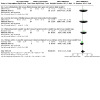
Comparison 2: Any weight loss intervention versus dietary intervention, Outcome 1: Mean weight loss [kg] or post intervention body weight
MacLaughlin 2014 reported surgical intervention participants (sleeve gastrectomy) lost 29.50 kg (95% CI 23.35 to 35.65 kg) more weight compared to control participants who received a combined diet and pharmacological treatment.
Stage of chronic kidney disease
There was no little or no difference in total weight loss following any weight loss intervention compared to usual care or control in CKD stages 1 to 4 (Analysis 4.1.1) or in transplant recipients (Analysis 4.1.2).
4.1. Analysis.
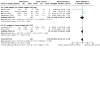
Comparison 4: Weight loss intervention versus usual care or control: stage of CKD, Outcome 1: Mean weight loss [kg or %]
Intervention duration
There was little or no difference in total weight loss for any weight loss intervention given for 3 months or less (Analysis 5.1.1) or interventions given for more than 3 months (Analysis 5.1.2). The test for subgroup differences showed no difference between the two time frames (test for subgroup differences: Chi² = 0.02, df = 1 (P = 0.88), I² = 0%).
5.1. Analysis.
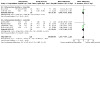
Comparison 5: Weight loss intervention versus usual care or control: duration of intervention, Outcome 1: Mean weight loss: post intervention body weight
Body mass index
Weight loss interventions had uncertain effects on BMI (Analysis 1.2 (4 studies, 100 participants): MD ‐2.18 kg/m², 95% CI ‐4.90 to 0.54; I²= 60%). The certainty of the evidence was very low due to high or uncertain risk of bias, moderate heterogeneity, imprecision, and indirectness. Five studies were unable to be meta‐analysed; all found any weight loss interventions led to significantly lower BMI when compared to usual care or control (Ikizler 2018; LANDMARK 3 2013; Orazio 2011; Teplan 2002; Tzvetanov 2015).
1.2. Analysis.
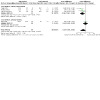
Comparison 1: Any weight loss intervention versus usual care or control, Outcome 2: Body mass index
In studies involving any weight loss intervention compared to dietary intervention there was little or no difference to post‐intervention BMI (Analysis 2.2 (3 studies, 262 participants): MD ‐1.27 kg/m², 95% CI ‐4.43 to 1.89; I² = 87%).
2.2. Analysis.
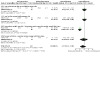
Comparison 2: Any weight loss intervention versus dietary intervention, Outcome 2: Body mass index
In studies involving surgical interventions BMI was probably reduced in sleeve gastrectomy when compared to non‐surgical interventions (Analysis 3.2 (2 studies, 17 participants): MD ‐10.43 kg/m², 95% CI ‐13.58 to ‐7.29: I² = 42%).
3.2. Analysis.
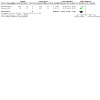
Comparison 3: Surgical versus non‐surgical weight loss intervention, Outcome 2: Body mass index
Intervention duration
Weight loss interventions given for more than 3 months probably reduced BMI (Analysis 5.2.3 (3 studies, 73 participants): MD ‐3.36 kg/m², 95% CI ‐5.68 to ‐1.04; I² = 9%), whereas interventions given for 3 months or less possibly made little of no difference to BMI (Analysis 5.2.1).
5.2. Analysis.
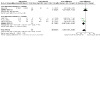
Comparison 5: Weight loss intervention versus usual care or control: duration of intervention, Outcome 2: Body mass index
Waist circumference
Two studies using dietary intervention (Kittiskulnam 2014) and exercise (Baria 2014) showed little or no difference to waist circumference when compared to usual care (Analysis 1.3 (2 studies, 53 participants) MD ‐0.68 cm, 95% CI ‐7.6 to 6.24; I² = 40%). The certainty of evidence was very low due to high or uncertain risk of bias, moderate heterogeneity, imprecision, and indirectness. Two studies (LANDMARK 3 2013; Orazio 2011) could not be pooled into the meta‐analysis. Orazio 2011 also found no difference between the two groups, while LANDMARK 3 2013 reported significant reductions in waist circumference following a combined diet and exercise intervention compared to usual care.
1.3. Analysis.
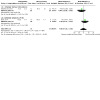
Comparison 1: Any weight loss intervention versus usual care or control, Outcome 3: Waist circumference
DIRECT 2013 compared weight loss interventions to dietary interventions and reported no effect on waist circumference across three different dietary interventions (low‐fat, low‐carbohydrate, and Mediterranean diet) in CKD participants.
MacLaughlin 2014 compared surgical to non‐surgical interventions and reported waist circumference was reduced following sleeve gastrectomy surgery compared to a combined pharmacological and diet intervention in CKD participants (Analysis 3.1 (1 study, 11 participants): MD ‐30.00 cm, 95% CI ‐39.93 to ‐20.07).
3.1. Analysis.
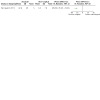
Comparison 3: Surgical versus non‐surgical weight loss intervention, Outcome 1: Mean weight loss (change score)
Waist‐to‐hip ratio
Two studies comparing weight loss intervention to usual care or control had uncertain effects on waist‐to‐hip ratio. Orazio 2011 reported no difference in waist‐to‐hip ratio between the two groups following a 6‐month dietary and exercise intervention (MD ‐1.05, 95% CI ‐5.92 to 3.82). Ikizler 2018 reported a reduction in waist‐to‐hip ratio in the dietary energy restricted group compared to the usual diet group (P = 0.03), but not in the exercise‐only intervention (P = 0.72).
In studies comparing any weight loss intervention to diet intervention, Teplan 2006 reported waist‐to‐hip ratio reduced by ‐0.05 units (95% CI ‐0.07 to ‐0.03) in participants following an energy restricted diet with concurrent keto‐amino acid supplementation compared to those following a low protein and energy restricted diet with placebo supplementation.
Body composition measures (fat mass, lean body mass and muscle mass)
Four studies comparing weight loss intervention to usual care or control, had uncertain effects on fat mass and lean body mass.
Kittiskulnam 2014 reported a reduced body fat (24.8% compared to 26.2%, measured by bioelectrical impedance analysis (BIA)) and no change in muscle mass, in a diet‐only intervention compared to usual care. In contrast, Leehey 2009 found no effect on body fat or lean body mass (measured by air displacement plethysmography) following 24 weeks of aerobic exercise.
Baria 2014 had mixed results, finding an exercise‐only intervention to have no effect on total body fat (measured by dual‐energy X‐ray absorptiometry (DEXA) scan) following either in‐centre exercise or home‐based exercise. However, exercise intervention groups had reductions in visceral fat when compared to control. After 12 weeks of aerobic exercise the in‐centre exercise group saw improvements in total lean body mass (kg) due to an increase in leg lean mass however these benefits were not achieved in the home exercise group nor control group.
Ikizler 2018 reported a reduction in body fat (measured by DEXA) with a combined diet and exercise intervention compared to usual care (MD ‐0.5%, 95% CI ‐1.9 to 0.8) as well as in the diet‐alone intervention reduced body fat compared to usual care (MD ‐1.6%, 95% CI ‐2.9 to ‐0.3). However the exercise‐alone intervention compared to usual care did not show a reduction in body fat.
Comparing any weight loss intervention to dietary interventions had uncertain effects on body composition.
Jesudason 2013 compared energy restricted diets with different levels of protein and reported weight loss resulted in a fat mass loss (measured by DEXA scan in 42 participants) of 6.2 ± 7.7 kg in the moderate protein group and 4.9 ± 5.1 kg in the standard protein group. Similar lean fat mass changes were also reported amongst groups: 1.7 ± 2.7 kg in the moderate protein group and 1.8 ± 2.9 kg in the standard protein group.
Leehey 2016 reported no change in fat mass (kg), percentage body fat, or lean weight (kg) (measured by air displacement plethysmography) in either the exercise and diet group or diet alone group.
Teplan 2006 reported a greater reduction in visceral fat (measured by magnetic resonance spectroscopy) in those following an energy restricted lower protein diet supplemented with keto‐amino acid supplementation then those following an energy restricted lower protein diet with placebo supplementation.
MacLaughlin 2014 reported surgical intervention participants lost 24.1 kg (95% CI 32.5 to 15.7) more fat mass (measured by BIA) compared to best medical care control participants who received combined lifestyle and pharmacological treatment.
Secondary outcomes
Creatinine clearance
Weight loss interventions had uncertain effects on CrCl when compared to usual care or control (Analysis 1.5 (3 studies, 58 participants): SMD 0.29, 95% CI ‐0.34 to 0.91: I² = 20%). Teplan 2002, reported a significant reduction in CrCl in transplant recipients following a combined diet and pharmacological intervention (from 1.2 mL/s at baseline to 0.9 mL/s at 3‐year follow‐up), however no comparison data for the usual care arm was reported.
1.5. Analysis.
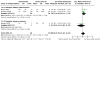
Comparison 1: Any weight loss intervention versus usual care or control, Outcome 5: Creatinine clearance [points]
Teplan 2006 reported a significant reduction post intervention in CrCl in the weight loss intervention (low protein and energy restricted diet with concurrent keto‐amino acid supplementation) of 33.5 mL/min/1.73 m² compared to 25.8 mL/min/1.73 m² in the low protein and energy restricted diet group with placebo supplementation.
Serum creatinine
Weight loss interventions compared to usual care or control had uncertain effects on SCr (Analysis 1.6 (4 studies, 84 CKD participants): MD ‐0.15 mg/dL, 95% CI ‐0.52 to 0.22); I² = 23%). The quality of evidence was considered to be low due to high or uncertain risk of bias, and imprecision (small sample size).
1.6. Analysis.
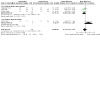
Comparison 1: Any weight loss intervention versus usual care or control, Outcome 6: Serum creatinine
MacLaughlin 2014 reported no statistically significant change in SCr in CKD participants following a surgical (sleeve gastrectomy) intervention compared to a combined pharmacological and diet therapy.
Proteinuria
Weight loss interventions compared to usual care or control had uncertain effects on proteinuria (Analysis 1.7 (4 studies, 84 participants): MD ‐0.29 g/day, 95% CI ‐0.76 to 0.18: I² = 33%). The certainty of evidence was very low due to high or uncertain risk of bias, imprecision, and indirectness. Teplan 2002 reported a reduction in proteinuria in transplant recipients following a combined diet and pharmacological intervention, however no data for the control arm was reported.
1.7. Analysis.
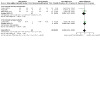
Comparison 1: Any weight loss intervention versus usual care or control, Outcome 7: Proteinuria
Leehey 2016 reported a combined diet and exercise intervention in CKD participants reduced proteinuria compared to a diet‐only intervention (405 mg/g compared to 618 mg/g), respectively.
Albuminuria
Three studies conducted in CKD participants reported on albuminuria and all reported no effect following an exercise intervention compared to usual care (Leehey 2009), standard protein energy restricted diet compared to a moderate protein energy restricted diet (Jesudason 2013), and diet and exercise intervention versus diet alone (Leehey 2016).
Measured GFR
Weight loss interventions versus dietary intervention and had uncertain effects on measured GFR. Teplan 2006 reported a change in measured GFR with an energy restricted diet supplemented with keto‐amino acids compared to an energy restricted low protein diet, and Jesudason 2013 reported a change in measured GFR with a moderate protein energy restricted diet compared to a standard protein energy restricted diet (Analysis 2.7 (2 studies, 176 CKD participants): SMD 0.63, 95% CI 0.25 to 1.02: I² = 29%).
2.7. Analysis.
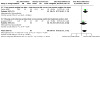
Comparison 2: Any weight loss intervention versus dietary intervention, Outcome 7: Measured GFR
Glomerular hyperfiltration
Jesudason 2013 reported weight loss in both the energy restricted moderate protein and standard protein diets resulted in a decline in eGFR of 15 mL/min in participants with hyperfiltration (defined by a GFR > 120 mL/min).
Blood pressure
Weight loss interventions had an uncertain effect on SBP (Analysis 1.8 (4 studies, 139 CKD participants): MD ‐5.90 mmHg, 95% CI –13.75 to 1.96: I² = 64%) and DBP (Analysis 1.9 (4 studies, 139 CKD participants): MD ‐5.49 mmHg, 95% CI –11.13 to 0.14: I² = 63%) when compared to usual care or control. The certainty of evidence was very low due to high or uncertain risk of bias, imprecision, and indirectness. Ikizler 2018 reported median data which could not be pooled, however commensurate with our meta‐analysis, they found no significant reduction in SBP or DBP following a combined diet and exercise intervention, or in diet‐ or exercise‐alone interventions, compared to usual care.
1.8. Analysis.
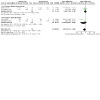
Comparison 1: Any weight loss intervention versus usual care or control, Outcome 8: Systolic blood pressure
1.9. Analysis.
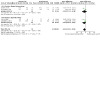
Comparison 1: Any weight loss intervention versus usual care or control, Outcome 9: Diastolic blood pressure
Any weight loss interventions made little or no difference to SBP compared to dietary interventions (Analysis 2.8 (3 studies, 262 CKD participants): MD ‐2.33 mmHg, 95% CI ‐8.32 to 3.67: I² = 71%), which remained robust with substitution as each of the three dietary arms were rotated through the meta‐analysis from DIRECT 2013. Jesudason 2013 similarly reported no change in SBP following a standard protein energy restricted diet compared to a moderate protein energy restricted diet, however, did not report the outcome data to allow for data pooling.
2.8. Analysis.
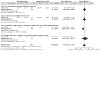
Comparison 2: Any weight loss intervention versus dietary intervention, Outcome 8: Systolic blood pressure
In contrast, DBP was probably reduced with any weight loss intervention when compared to diet‐alone comparators (Analysis 2.9 (3 studies, 246 CKD participants): MD ‐1.87 mmHg, 95% CI ‐3.59 to ‐0.14: I² = 0%).
2.9. Analysis.
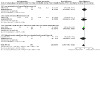
Comparison 2: Any weight loss intervention versus dietary intervention, Outcome 9: Diastolic blood pressure
Anti‐hypertensive medication changes
Morales 2003a reported that the numbers, classes, and doses of antihypertensive drugs administered to both the dietary intervention group and control group were similar.
Glycosylated haemoglobin
Weight loss interventions had uncertain effect on HbA1c versus usual care or control (Analysis 1.10 (2 studies, 83 CKD participants): MD ‐0.48%, 95% CI ‐1.15 to 0.18: I2 = 0%).
1.10. Analysis.
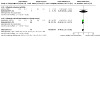
Comparison 1: Any weight loss intervention versus usual care or control, Outcome 10: HbA1c
Weight loss interventions made little or no difference to HbA1c when compared to diet comparators (Analysis 2.10 (2 studies, 163 CKD participants): MD ‐1.62%, 95% CI ‐3.87 to 0.63: I² = 89%). Jesudason 2013 reported HbA1c reduced by 0.3% (equivalent to 2 mmol/mol) across both diet study groups, with no difference observed between the two diet groups.
2.10. Analysis.
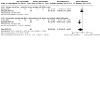
Comparison 2: Any weight loss intervention versus dietary intervention, Outcome 10: HbA1c
Fasting blood glucose
Weight loss interventions had an uncertain effects on fasting blood glucose levels compared to usual care or control (Analysis 1.11 (2 studies, 98 CKD participants): MD ‐1.27 mg/dL, 95% CI ‐2.66 to 0.11: I² = 0%). Teplan 2002 reported a combined diet and pharmacological intervention years in transplant recipients significantly reduced fasting blood glucose from 7.6 mmol/L to 5.2 mmol/L at three years, however comparison data was not reported to allow for data pooling.
1.11. Analysis.
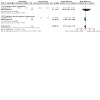
Comparison 1: Any weight loss intervention versus usual care or control, Outcome 11: Fasting glucose
Data from Jesudason 2013 and DIRECT 2013 comparing weight loss interventions to dietary intervention could not be pooled however, both found no difference in fasting blood glucose between the two groups.
Hypoglycaemic medication changes
Three studies reported on hypoglycaemic medication changes with uncertain effects.
Orazio 2011 reported no difference between any weight loss intervention compared to usual care or control with regard to the use of metformin and insulin after a 2‐year follow‐up however, more participants in the lifestyle intervention group compared with control group were on a thiazolidinedione (25% versus 0%).
Jesudason 2013 reported a variety of changes in hypoglycaemic medication use between two dietary study arms.
MacLaughlin 2014 reported daily mean insulin dose differed by ‐36 units (95% CI ‐69 to 23) in the surgical versus non‐surgical group who received individualised diet and exercise program with concurrent prescription of orlistat.
Total cholesterol
Weight loss interventions made little or no difference to total cholesterol compared with usual care (Analysis 1.12 (6 studies, 169 participants): MD ‐9.07 mg/dL, 95% CI ‐20.31 to 2.18: I² = 0%). Teplan 2002 reported a significant reduction in total cholesterol at 3 years in transplant recipients from 6.9 mmol/L to 5.2 mmol/L, however comparison data was not reported to allow for data pooling.
1.12. Analysis.
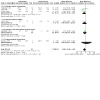
Comparison 1: Any weight loss intervention versus usual care or control, Outcome 12: Total cholesterol
Any weight loss intervention made little or no difference to total cholesterol compared with dietary interventions (Analysis 2.13 (4 studies, 272 participants): MD ‐2.01 mg/dL, 95% CI ‐21.38 to 17.35: I² = 73%). This finding was robust despite which of the 3 different dietary arms were rotated through the meta‐analysis from DIRECT 2013.
2.13. Analysis.
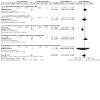
Comparison 2: Any weight loss intervention versus dietary intervention, Outcome 13: Total cholesterol
Stage of chronic kidney disease
There was little of no difference in total cholesterol following any weight loss intervention compared to usual care in either participants with CKD stages 1 to 4 or in transplant recipients (Analysis 4.2).
4.2. Analysis.
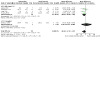
Comparison 4: Weight loss intervention versus usual care or control: stage of CKD, Outcome 2: Total cholesterol
Intervention duration
Weight loss interventions given for either less than 3 months or 3 months or more made little or no difference to total cholesterol (Analysis 5.3).
5.3. Analysis.
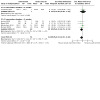
Comparison 5: Weight loss intervention versus usual care or control: duration of intervention, Outcome 3: Total cholesterol
Low density lipoprotein cholesterol
Weight loss intervention probably leads to a reduction in LDL cholesterol compared with usual care or control (Analysis 1.13 (4 studies, 139 participants): MD ‐10.30 mg/dL, 95% CI ‐16.70 to ‐3.90: I² = 0%). Teplan 2002 reported a reduction in total cholesterol at 3 years in transplant recipients from 4.1 mmol/L to 3.0 mmol/L, however comparison data was not reported to allow data pooling.
1.13. Analysis.
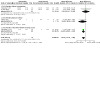
Comparison 1: Any weight loss intervention versus usual care or control, Outcome 13: LDL cholesterol
Any weight loss intervention made little or no difference to LDL cholesterol compared with dietary interventions (Analysis 2.14 (4 studies, 272 participants): MD 1.39 mg/dL, 95% CI ‐16.66 to 19.45: I² = 72%). This finding was robust despite which of the 3 different dietary arms were rotated through the meta‐analysis from DIRECT 2013.
2.14. Analysis.
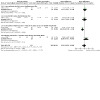
Comparison 2: Any weight loss intervention versus dietary intervention, Outcome 14: LDL cholesterol
High density lipoprotein cholesterol
There was no effect little or no difference in HDL cholesterol with any weight loss intervention compared to usual care or control (Analysis 1.14 (4 studies, 139 participants): MD 2.20 mg/dL, 95% CI ‐2.64 to 7.04: I² = 41%).
1.14. Analysis.
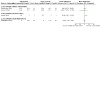
Comparison 1: Any weight loss intervention versus usual care or control, Outcome 14: HDL cholesterol
Any weight loss intervention may reduce HDL cholesterol compared with dietary interventions (Analysis 2.15 (2 studies, 131 participants): MD ‐4.80 mg/dL, 95% CI ‐8.71 to ‐0.89; I² = 0%).
2.15. Analysis.
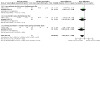
Comparison 2: Any weight loss intervention versus dietary intervention, Outcome 15: HDL cholesterol
Triglycerides
Any weight loss intervention compared to usual care or control had uncertain effects on serum triglycerides (Analysis 1.15 (5 studies, 156 CKD participants): MD ‐24.61 mg/dL, 95% CI ‐49.53 to 0.31: I² = 43%). Two other studies in transplant recipients reported mixed results however, they did not report appropriate data for pooling. Teplan 2002 reported a reduction in triglycerides at 3 years from 3.8 mmol/L to 2.3 mmol/L. In contrast, Tomlinson 1975 did not report any change in triglycerides following a pharmacological intervention compared to placebo.
1.15. Analysis.
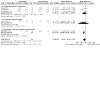
Comparison 1: Any weight loss intervention versus usual care or control, Outcome 15: Triglycerides
In studies comparing any weight loss intervention to dietary interventions, any weight loss intervention made little or no difference to triglycerides (Analysis 2.16 (4 studies, 272 participants): MD ‐3.22 mg/dL, 95% CI ‐31.50 to 25.06: I² = 47%). DIRECT 2013 reported no difference in triglycerides when comparing the effects of low‐carbohydrate, low‐fat and the Mediterranean diet. Leehey 2016 also reported no difference in triglycerides when comparing a combined energy‐restricted and exercise intervention to an energy‐restricted diet alone (Analysis 2.16). Teplan 2006 did however report the potential efficacy of one particular diet compared to another, showing a low protein and energy restricted diet with concurrent keto‐amino acid supplementation reduced serum triglycerides compared to low protein and energy restricted diet alone in CKD participants (Analysis 2.16).
2.16. Analysis.
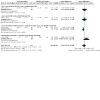
Comparison 2: Any weight loss intervention versus dietary intervention, Outcome 16: Triglycerides
Lipid lowering medication changes
Orazio 2011 reported that after a 2‐year follow‐up, more patients in the lifestyle intervention group were on a statin than those in the control group, 96% versus 80% respectively.
Successful kidney transplantation
None of the included studies reported successful kidney transplantation.
Inflammation (C‐reactive protein)
Baria 2014 and Leehey 2009 both reported no effect of any weight loss intervention on C‐reactive protein compared to usual care.
Leehey 2016 found no effect of combined diet and exercise weight loss intervention on C‐reactive protein compared to a diet‐only intervention.
MacLaughlin 2014 reported no effect of a surgical intervention (sleeve gastrectomy) on C‐reactive protein compared to best medical care (individualised dietary and physical activity prescription combined with orlistat prescription) in obese patients with CKD stages 3 to 4.
Adherence to treatment
Jesudason 2013 reported the moderate protein group increased their protein intake to 1.22 g/kg/day and the standard protein group decreased their protein intake to 0.93 g/kg/day.
Ikizler 2018 reported all participants except one were within 20% of their assigned daily energy intake, and 70% of participants achieved an energy restriction lower than their assigned daily target.
LANDMARK 3 2013 reported an adherence of 70% to supervised gym training sessions in the intervention group. Leehey 2016 reported an attendance of 42% and 34% for lifestyle modification classes in the dietary group and exercise + diet group, respectively.
In surgical interventions versus non‐surgical interventions MacLaughlin 2014 reported a similar level of adherence with the best medical care group reporting four of the six patients (67%) attended over 90% of lifestyle program visits and all four were compliant, one was partially compliant and one non‐compliant with both the dietary and exercise interventions up to six months. MacLaughlin 2014 reported adherence with the initial liquid diet post‐surgery was 80% and 100% of patients continued to eat in accordance with the prescribed texture modification for three months and prescribed energy restriction up to 12 months.
Health‐related quality of life
Leehey 2016 did not find a combined diet and exercise weight loss intervention to improve overall QoL (as measured by The Short Form (36) Health Survey (SF‐36) compared to CKD participants receiving a diet‐only intervention.
MacLaughlin 2014 found significant improvements in the physical domain of the SF‐36 questionnaire in CKD participants who received a sleeve gastrectomy compared to patients receiving an individualised diet and exercise program with concurrent prescription of orlistat.
Nutritional status
None of the included studies reported the nutritional status of participants.
Dietary intake
Compared to usual care or control, weight loss interventions made little or no difference to changes in dietary energy intake (Analysis 1.17 (4 studies, 100 CKD participants): SMD ‐0.55, 95% CI ‐1.35 to 0.25: I² = 70%).
1.17. Analysis.
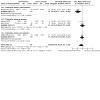
Comparison 1: Any weight loss intervention versus usual care or control, Outcome 17: Dietary energy intake
Two of these studies (Baria 2014; Leehey 2009) were exercise‐only interventions with no changes to dietary energy intake prescribed.
LANDMARK 3 2013 involved a combined dietary and exercise intervention found no difference in energy intake between groups post intervention
Kittiskulnam 2014 study which involved an energy restricted dietary only intervention reported a significant reduction in energy intake post intervention in the intervention group compared to the control group.
Orazio 2011 reported median end‐of study values in transplant recipients which could not be pooled, reported a combined diet and exercise intervention to reduced overall daily energy intake by 1293 kJ compared to usual care.
Jesudason 2013 reported a non‐significant difference in overall energy intake following a standard protein energy restricted diet compared to a moderate protein energy restricted diet, with overall energy intakes of 6200 kJ and 6500 kJ at the end of the 12 month study, respectively.
Intervention duration
Weight loss interventions given for either less than 3 months or 3 months or more made little or no difference to dietary intake (Analysis 5.4).
5.4. Analysis.
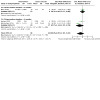
Comparison 5: Weight loss intervention versus usual care or control: duration of intervention, Outcome 4: Dietary energy intake
Physical activity behaviours
Orazio 2011 reported simple provision of advice and regular encouragement to increase levels of physical activity as part of a lifestyle intervention did not lead to improved physical activity behaviours compared to usual care. They reported no change in physical activity time for the intervention compared to the usual care group nor any difference between the two groups ability to meet Australian physical activity guidelines of 150 minutes of moderate intensity activity per week.
Cost per disability‐adjusted life years or quality‐adjusted life years
None of the included studies reported cost per DALYs or QALYs events.
Cost associated with weight loss intervention
None of the included studies reported on cost associated with weight loss interventions.
Adverse events and potential harms
Five studies reported on adverse outcomes associated with their weight loss intervention. Adverse effects reported included depression and diarrhoea, hypotension, musculoskeletal injuries, and hospitalisations. No studies reported on biochemical adverse effects such as hyperkalaemia or hyperphosphataemia.
Leehey 2016 reported no study‐related adverse events in lifestyle (combined exercise and diet) group nor the diet only group.
Ikizler 2018 reported seven study‐related adverse events with six of those happening in the aerobic exercise and caloric restriction group (atrial fibrillation requiring hospitalisation (1), hypotension due to weight loss (2), chest pain during exercise (1), musculoskeletal injuries (2)). A further episode of hypotension due to weight loss was reported in the usual activity and caloric restriction group. No study‐related adverse events were reported in the usual activity and usual diet group or in the aerobic exercise and usual diet group.
-
Pharmacological interventions
Tomlinson 1975 reported fenfluramine had no effect of allograft function however some participants experienced diarrhoea and depression.
MacLaughlin 2014 reported orlistat was well tolerated in amongst participants, with few episodes of diarrhoea occurring during the first one to two months only and reported no incidence of AKI or oxalate nephropathy.
-
Surgical interventions
Tzvetanov 2015 reported no surgical or medical complications related to the combined bariatric surgery and kidney transplantation. Participants in the intervention arm presented with no difficulties in maintaining immunosuppression, as well as no episodes of acute cellular or antibody mediated rejection.
MacLaughlin 2014 reported two hospital re‐admissions with dehydration within 30 days post‐surgery amongst participants who underwent sleeve gastrectomy.
Subgroup analyses
We did not perform subgroups analyses for BMI (overweight versus obese), chief causes of CKD, (diabetes, hypertension, glomerulonephritis, polycystic kidney disease, reflux kidney disease) and presence or absence of proteinuria because there were not enough studies to estimate effects in these subgroups.
Sensitivity analyses
We did not perform any sensitivity analyses because there were not enough studies included in the analyses.
Assessment of reporting bias
We did not draw funnel plots due to limited number of studies per outcome.
Discussion
Summary of main results
This systematic review summarises 17 studies (988 participants) examining the effect of weight loss interventions (lifestyle, pharmacological and surgical) for the treatment of overweight and obesity in adults with CKD. Included studies had a median study duration of 12 months (range 5 weeks to 3 years). Majority of studies (13) examined lifestyle weight loss interventions (dietary, exercise and or dietary and exercise combined) compared to usual standard care or other dietary weight loss interventions. Only two small studies (17 participants) included surgical weight loss interventions. The included studies involved people with CKD stages 1 to 4 (n = 620) and kidney transplant recipients (n = 368). There were no studies that investigated weight loss interventions for people with ESKD requiring dialysis or those choosing supportive care management. Interventions and comparators varied across the included studies. The studies were separated into three main groups for comparison: Any weight loss interventions versus usual care or control (main comparator), any weight loss intervention versus dietary intervention, and surgical intervention versus non‐surgical intervention. The risk of bias in the included studies were often unclear or high, and when combined with considerable heterogeneity in weight loss interventions and imprecision in effect estimates, led to low or very low confidence in the results.
None of the included studies were designed to evaluate the effects of weight loss interventions on death or cardiovascular events. As a result, whether weight loss interventions can lower the risk of death or cardiovascular events remains unanswered. This finding has important implications as people with all stages of CKD experience high levels of death and morbidity from CVD.
Overall, weight loss interventions (involving predominately lifestyle interventions) were more successful than the usual care or control comparators in reducing body weight, however had uncertain effects for other anthropometric measures including BMI, waist circumference, waist‐to‐hip ratio, and measures of fat mass. The effect of any weight loss interventions (all studies were non‐surgical interventions) was not superior to dietary only intervention comparators for weight loss. One study looking at surgical intervention compared to non‐surgical intervention found a greater reduction in weight loss, BMI, waist circumference and fat mass than the combined lifestyle and pharmacological comparator.
The effects of weight loss interventions on clinical measures across all comparators were infrequently measured limiting the ability of studies to be combined and reducing the overall quality of the evidence. Compared to usual standard care or control there were improvements in some, but not all clinical parameters. Improvements were found in LDL cholesterol; uncertain effects were found on CrCl, SCr, proteinuria, SBP, DBP, fasting blood glucose, HbA1c, and triglycerides; and no significant effect was found on total cholesterol, HDL cholesterol, and C‐reactive protein. There was limited reporting of adherence to treatment, adverse events, and potential harms across all three comparisons. The interventions that did report on these measures reported no major medical complications or serious adverse events with lifestyle, pharmacological or surgical weight loss interventions. A number of other secondary outcomes including successful kidney transplantation, nutritional status, biochemical adverse effects such as hyperkalaemia or hyperphosphataemia, cost associated with weight loss intervention, and cost effectiveness (per DALYs or QALY) were not measured in any of the included studies. Overall, the data from this review suggests that current evidence for weight loss interventions in overweight and obese individuals with CKD is limited and of very low to low quality and may be insufficient to guide clinical practice.
Overall completeness and applicability of evidence
This review examined 17 studies assessing the effects of lifestyle, pharmacological and surgical weight loss interventions in overweight and obese people with CKD. The strengths of the review include a comprehensive review of all types of weight loss interventions in CKD in both overweight and obese adults in all stages of CKD and limiting our review to RCTs and quasi‐RCTs. The majority of included studies involved lifestyle interventions with small numbers, with heterogeneous interventions and outcome measures, making comparison difficult. We could not assess the effect of weight loss interventions on important endpoints such as death or cardiovascular events, as none of the included studies in this review were designed to measure these outcomes. While all included studies reported on at least one anthropometric measure, there was inconsistent reporting for most clinical parameters, and limited to no reporting of patient‐centred outcomes, economic analysis and adverse events and potential harms. Due to within study heterogeneity we could not determine the effect of weight loss interventions on SCr and CrCl. There were four studies with mixed populations of CKD stages 1 to 4 (Jesudason 2013; Kittiskulnam 2014; Morales 2003a; Praga 1995) that included participants with hyperfiltration and reduced kidney function (eGFR) at baseline in the same treatment groups. These studies did not account for the different direction of change in which CrCl and SCr with weight loss in those with hyperfiltration (improvement via a reduction) versus those with a reduced eGFR (improvement via an increase). We found no differences in daily energy intake post intervention in lifestyle interventions versus usual care or control, as the majority of studies included in this sub‐analysis were exercise based interventions and did not prescribe a reduction in energy intake. Subgroup analyses were not able to be performed for many outcomes as often less than two studies reported the same outcome measures. Reporting on a set of core outcome measures for weight loss interventions in people with CKD would be helpful in future research studies to improve the quality of evidence.
Only two studies with very small sample sizes reported on surgical interventions with limited reporting on our outcomes of interest. Therefore, the benefits reported in these surgical intervention studies must be confirmed in larger studies to improve the quality and certainty of evidence to better guide clinical practice. None of the included studies involved participants undergoing dialysis treatment or supportive care management. Therefore, the results from this review may not be generalisable to these population groups. Further studies are therefore warranted to examine the effects of weight loss interventions in these population groups.
Quality of the evidence
The overall certainty of evidence for reported outcomes was very low. We downgraded the evidence for uncertain or high risk of bias, inconsistency, indirectness, and imprecision. Meta‐analysis was also difficult due to inconsistent reporting of outcome measures and significant heterogeneity in the characteristics of interventions. Key methodological limitations including risk of bias led to downgrading of all evidence by one level (high to moderate). Methods for interventions were insufficiently reported by most studies. The relative impact of lifestyle intervention on most outcomes (aside from waist circumference) was downgraded due to moderate to high statistical heterogeneity, leading to low certainty of evidence. Weight management interventions varied widely, including diet, diet and physical activity, physical activity alone, diet and pharmacotherapy, and weight loss surgery. Furthermore the control or comparator interventions were also varied, making direct comparisons difficult. Finally, due to the small sample size and often small number of included studies the results were imprecise, further compounding the uncertainty of evidence.
Potential biases in the review process
Potential biases in this review relate to the data availability in the individual studies, and heterogeneity in treatment intervention and comparisons. Additionally, sensitivity analyses could not be performed and reporting bias could not be assessed due to the limited number of included studies. Finally, treatment endpoints were surrogate markers of health (proteinuria, SBP and DBP) and the effects of weight loss interventions on longer term outcomes such as death and cardiovascular events remains uncertain. Study authors were contacted to provide additional information in an attempt to reduce potential bias (see Appendix 3 for additional information requested and provided by authors).
The strength of this review is that it included an up‐to‐date and comprehensive review of previous publications through a thorough MEDLINE, EMBASE and CENTRAL search and only included RCTs or quasi RCTs, as pre‐specified. Data extraction, data analysis and quality assessment were performed by two independent investigators, and any differences in consensus were checked with an additional author. It should be noted that there is potential conflict of interest as author HM was the principal investigator and co‐author of MacLaughlin 2014 study and KC is a co‐author of LANDMARK 3 2013 study both studies were included in this review. Authors MC, DJ, and KC work at the same facility where Orazio 2011 and LANDMARK 3 2013 were undertaken.
Agreements and disagreements with other studies or reviews
Our finding of a decrease in BMI with dietary interventions compared to control or usual care agree with a previous systematic review reporting pooled results from studies of non‐dialysis CKD and in participants with hyperfiltration (Navaneethan 2009). Other systematic reviews of outcomes of weight loss interventions in CKD populations did not report pooled effects, however all included studies demonstrated significant decreases in body mass or BMI within intervention groups but did not compare weight or BMI differences between groups (Afshinnia 2010; Bolignano 2013).
The effect of weight loss interventions on proteinuria was uncertain in lifestyle interventions and was not reported in studies of surgical interventions. This contrasts with previous findings reported by Navaneethan 2009, and Afshinnia 2010, with significant reductions in proteinuria. However both studies pooled only within group differences for intervention groups from observational studies and controlled studies and did not include comparisons with controls. This indicates that contrary to findings from observational studies, weight loss may not induce a reduction in proteinuria with moderate weight loss achieved with lifestyle interventions. However, one study included in the meta‐analysis compared diet induced weight loss with captopril, and found both equally effective at reducing proteinuria, which increases the bias towards a null finding. We found no change in albuminuria, and this is supported by the findings of Bolignano 2013 who reported two RCTs with no change in albuminuria, and a reduction in proteinuria or albuminuria in observational studies.
Measures of creatinine did not change with weight loss in either lifestyle or surgical interventions. This is similar to the findings of Navaneethan 2009 and Van Huffel 2014, also reporting no change in these measures with weight loss. We were unable to evaluate the effect of weight loss on measured GFR. Measured GFR was examined in two studies with low protein diet treatment arms, and showed a small improvement, however one of these studies did not achieve weight loss, limiting the applicability of the findings to the effects of intentional weight loss. Low density lipoprotein cholesterol decreased and the effect of weight loss on total cholesterol and triglycerides was uncertain. Navaneethan 2009 reported a decrease in total cholesterol with weight loss, and no change in HDL cholesterol or triglycerides within weight loss treatment groups.
Authors' conclusions
Implications for practice.
In the context of mild to moderate CKD, and post kidney transplantation, lifestyle‐based weight loss interventions may result in weight loss and may have positive effects on DBP and LDL cholesterol. No particular dietary intervention was superior to another; therefore it is likely that energy deficit remains key, and dietary interventions or mixed lifestyle interventions demonstrated more positive effects that exercise interventions alone. Evidence from RCTs for interventions using surgical interventions is lacking. We are unable to say whether weight loss interventions have an effect on proteinuria, CrCl or measured GFR.
Presently, it is recommended that the selection of weight loss interventions should be individualised, based not only on an assessment of the risks and benefits of individual weight loss intervention procedures and the level of kidney function, but also in combination with thorough consideration of patient preferences, motivations, confidence, and previous experience with weight loss interventions.
Implications for research.
Long‐term RCTs assessing the effect of intentional weight loss interventions (lifestyle, pharmacological and surgical) on death, cardiovascular events and on kidney outcomes such as measured GFR, CKD progression, development of ESKD, and successful transplantation in people with all stages of kidney disease are needed. It is also important that all future studies in this area are designed to and report on a standardised set of clinical, patient‐centred, economic and safety outcome measures including reporting on mean difference of these outcome measures so that future meta‐analysis can be conducted with a higher level and certainty of evidence.
History
Protocol first published: Issue 9, 2018 Review first published: Issue 3, 2021
Acknowledgements
The authors wish to acknowledge the assistance of the Cochrane Kidney and Transplant’s Group editors and referees, and the information specialist. The authors are grateful to the following peer reviewers for their time and comments: Davide Bolignano (Magna Graecia University of Catanzaro, Italy), Frederick Kaskel, MD, PhD (Chief Emeritus Nephrology, Children's Hospital at Montefiore, Albert Einstein College of Medicine, Bronx, New York USA), and Shahabul Arfeen, MD.
Appendices
Appendix 1. Electronic search strategies
| Database | Search terms |
| CENTRAL |
|
| MEDLINE |
|
| EMBASE |
|
Appendix 2. Risk of bias assessment tool
| Potential source of bias | Assessment criteria |
|
Random sequence generation Selection bias (biased allocation to interventions) due to inadequate generation of a randomised sequence |
Low risk of bias: Random number table; computer random number generator; coin tossing; shuffling cards or envelopes; throwing dice; drawing of lots; minimisation (minimisation may be implemented without a random element, and this is considered to be equivalent to being random). |
| High risk of bias: Sequence generated by odd or even date of birth; date (or day) of admission; sequence generated by hospital or clinic record number; allocation by judgement of the clinician; by preference of the participant; based on the results of a laboratory test or a series of tests; by availability of the intervention. | |
| Unclear: Insufficient information about the sequence generation process to permit judgement. | |
|
Allocation concealment Selection bias (biased allocation to interventions) due to inadequate concealment of allocations prior to assignment |
Low risk of bias: Randomisation method described that would not allow investigator/participant to know or influence intervention group before eligible participant entered in the study (e.g. central allocation, including telephone, web‐based, and pharmacy‐controlled, randomisation; sequentially numbered drug containers of identical appearance; sequentially numbered, opaque, sealed envelopes). |
| High risk of bias: Using an open random allocation schedule (e.g. a list of random numbers); assignment envelopes were used without appropriate safeguards (e.g. if envelopes were unsealed or non‐opaque or not sequentially numbered); alternation or rotation; date of birth; case record number; any other explicitly unconcealed procedure. | |
| Unclear: Randomisation stated but no information on method used is available. | |
|
Blinding of participants and personnel Performance bias due to knowledge of the allocated interventions by participants and personnel during the study |
Low risk of bias: No blinding or incomplete blinding, but the review authors judge that the outcome is not likely to be influenced by lack of blinding; blinding of participants and key study personnel ensured, and unlikely that the blinding could have been broken. |
| High risk of bias: No blinding or incomplete blinding, and the outcome is likely to be influenced by lack of blinding; blinding of key study participants and personnel attempted, but likely that the blinding could have been broken, and the outcome is likely to be influenced by lack of blinding. | |
| Unclear: Insufficient information to permit judgement | |
|
Blinding of outcome assessment Detection bias due to knowledge of the allocated interventions by outcome assessors. |
Low risk of bias: No blinding of outcome assessment, but the review authors judge that the outcome measurement is not likely to be influenced by lack of blinding; blinding of outcome assessment ensured, and unlikely that the blinding could have been broken. |
| High risk of bias: No blinding of outcome assessment, and the outcome measurement is likely to be influenced by lack of blinding; blinding of outcome assessment, but likely that the blinding could have been broken, and the outcome measurement is likely to be influenced by lack of blinding. | |
| Unclear: Insufficient information to permit judgement | |
|
Incomplete outcome data Attrition bias due to amount, nature or handling of incomplete outcome data. |
Low risk of bias: No missing outcome data; reasons for missing outcome data unlikely to be related to true outcome (for survival data, censoring unlikely to be introducing bias); missing outcome data balanced in numbers across intervention groups, with similar reasons for missing data across groups; for dichotomous outcome data, the proportion of missing outcomes compared with observed event risk not enough to have a clinically relevant impact on the intervention effect estimate; for continuous outcome data, plausible effect size (difference in means or standardised difference in means) among missing outcomes not enough to have a clinically relevant impact on observed effect size; missing data have been imputed using appropriate methods. |
| High risk of bias: Reason for missing outcome data likely to be related to true outcome, with either imbalance in numbers or reasons for missing data across intervention groups; for dichotomous outcome data, the proportion of missing outcomes compared with observed event risk enough to induce clinically relevant bias in intervention effect estimate; for continuous outcome data, plausible effect size (difference in means or standardized difference in means) among missing outcomes enough to induce clinically relevant bias in observed effect size; ‘as‐treated’ analysis done with substantial departure of the intervention received from that assigned at randomisation; potentially inappropriate application of simple imputation. | |
| Unclear: Insufficient information to permit judgement | |
|
Selective reporting Reporting bias due to selective outcome reporting |
Low risk of bias: The study protocol is available and all of the study’s pre‐specified (primary and secondary) outcomes that are of interest in the review have been reported in the pre‐specified way; the study protocol is not available but it is clear that the published reports include all expected outcomes, including those that were pre‐specified (convincing text of this nature may be uncommon). |
| High risk of bias: Not all of the study’s pre‐specified primary outcomes have been reported; one or more primary outcomes is reported using measurements, analysis methods or subsets of the data (e.g. sub‐scales) that were not pre‐specified; one or more reported primary outcomes were not pre‐specified (unless clear justification for their reporting is provided, such as an unexpected adverse effect); one or more outcomes of interest in the review are reported incompletely so that they cannot be entered in a meta‐analysis; the study report fails to include results for a key outcome that would be expected to have been reported for such a study. | |
| Unclear: Insufficient information to permit judgement | |
|
Other bias Bias due to problems not covered elsewhere in the table |
Low risk of bias: The study appears to be free of other sources of bias. |
| High risk of bias: Had a potential source of bias related to the specific study design used; stopped early due to some data‐dependent process (including a formal‐stopping rule); had extreme baseline imbalance; has been claimed to have been fraudulent; had some other problem. | |
| Unclear: Insufficient information to assess whether an important risk of bias exists; insufficient rationale or evidence that an identified problem will introduce bias. |
Appendix 3. Survey of authors providing information on included trials
| Characteristic | Study author contacted | Study author replied | Study author asked for additional information | Study author provided data |
| Date | Date | Short summary | Short summary | |
| Baria 2014 | Yes 07/01/2020 & 14/01/2020 |
No | Study start and finish dates and asked if outcome assessors for all outcome measures blinded | No response received |
| DIRECT 2013 | Yes 07/0/2020 & 20/01/2020 |
Yes 20/01/20 |
Requested subgroup baseline and post intervention mean and SD for those only with stage 3 CKD eGFR 30 to 60 mL/min/1.73 m² | Baseline and post intervention mean and SD values for body weight, BMI, waist circumference, SBP and DBP, total cholesterol, LDL cholesterol, HDL cholesterol, triglycerides, and fasting plasma glucose levels for all 3 dietary intervention groups were provided |
| Jesudason 2013 | Yes 14/01/2020 |
Yes 15/01/20 |
Requested post intervention mean and SD body weight baseline daily energy intake, post intervention albuminuria, baseline and post intervention SBP, post intervention HbA1C, and baseline and post intervention body fat mass and lean mass for both dietary groups | Requested data provided |
| Kittiskulnam 2014 | Yes 14/01/2020 |
No | Enquired as to whether baseline and post intervention energy intakes were calculated from participants seven day food records and if so asked if this data could be sent | No response received |
| LANDMARK 3 2013 | Yes 16/01/20 |
Yes | Requested sub‐study data for those in study who were overweight or obese | Author responded was unable to provide sub‐study data |
| Leehey 2009 | Yes 14/01/2020 & 28/01/2020 |
No | Post intervention (12 weeks and 52 weeks) body weight (kg) mean and SD for all groups | No response received |
| MacLaughlin 2014 | Yes 07/01/2020 |
Yes 21/01/20 |
Requested post intervention body weight, BMI, waist circumference, serum creatinine, proteinuria, SBP, DBP, and C‐reactive protein | Requested data provided |
| Orazio 2011 | Yes 16/01/20 |
Yes | Requested sub‐study data for those in study who were overweight or obese | Author responded was unable to provide sub‐study data |
| Tzvetanov 2014 | Yes 27/12/2019 & 19/01/2020 |
No | Asked author if they had published any further data with more numbers as report included was an abstract only | No response received |
|
Teplan 2006 Teplan 2002 |
Yes 29/12/2019 20/01/2020 |
No | Whether multiple reports were from the same study. Asked to describe randomisation and allocation processes that were used to allocated participants to groups | No response received |
| Woolf 2017 | Yes 22/02/20 |
No | Requested more detailed information on inclusion, exclusion criteria, information on study procedures, whether more data is published elsewhere and whether study is part of a large trial | No response received |
Appendix 4. Summary of included studies
| Intervention Study ID | Intervention | Comparator | CKD stage | Mean age (years) | Men (%) | Mean BMI (kg/m²) | Length of intervention | Description of intervention and comparator | Primary outcome/s |
| Comparison 1. Lifestyle Interventions versus usual care or control | |||||||||
| Lifestyle Interventions versus usual care or control | |||||||||
| Baria 2014 | Exercise | Usual care | Stages 3 to 4 | 52 | 100 | 30.4 ± 3.8 | 12 weeks |
Intervention (n =8) Centre based aerobic exercise: 3 x 30 minute walking sessions/week on in centre treadmill, increasing intensity and duration Home based aerobic exercise: 3 x 30 minute walking sessions/week at home, increasing intensity and duration Comparison (n = 9) Usual care: no exercise intervention |
Body composition (weight loss, BMI, waist circumference, visceral fat, subcutaneous fat) |
| Ikizler 2018 | Dietary and aerobic exercise | Usual care Dietary Exercise |
Stages 3 to 4 | 60 | 68 | ‐ | 4 months |
Intervention x 3 (n = 71) Aerobic exercise + energy restriction (n = 24): supervised aerobic exercise x 3; 30 to 45 minute sessions/week + daily dietary restriction of 300 to 500 kcal OR Usual activity + energy restriction (n = 25): usual activity + daily energy restriction of 300 to 500 kcal OR Aerobic exercise + usual diet (n = 22): supervised aerobic exercise x 3; 30 to 45 minute sessions/week + usual diet Comparison (n = 21) Usual activity + usual diet: advised to continue with usual diet and usual activity |
Metabolic risk profile (oxidative stress, inflammation, and body composition (BMI, waist circumference, body fat) |
| Kittiskulnam 2014 | Dietary | Usual care | Stages 1 to 4 | 45 | 85 | Diet‐group 28.5 ± 4.8 Usual care 28.7 ± 4.8 |
6 months |
Intervention(n = 13) Daily energy restriction of 500 kcal + daily protein target of 0.6 to 0.8 g/kg/day Comparison(n = 13) No energy restriction Usual care: dietary advice to retard CKD progression with goal for protein target of 0.6 to 0.8g/kg/day |
Proteinuria, adipokine level, renal function (eGFR, serum creatinine) |
| LANDMARK 3 2013 | Mixed (dietary and exercise and behavioural) | Usual care | Stages 3 to 4 | Intervention 60 Control 62 |
63 | Intervention 32.5 ± 6.8 Control 33.0 ± 8.0 |
12 months |
Intervention (n = 36) Lifestyle intervention included multidisciplinary care (including a CKD nurse practitioner, dietitian, exercise physiologist, diabetic educator, psychologist, and social worker), a lifestyle program, and aerobic and resistance exercise training Comparison (n = 36) Usual standard nephrologist care and referral to an allied health professional on an ad hoc basis. |
Cardiorespiratory fitness ( peak V02) |
| Leehey 2009 | Exercise | Usual care | Stages 2 to 4 | 66 | 100 | ‐ | 24 weeks |
Intervention (n = 7) Aerobic exercise: 3 x 30 minute walking sessions/week, (6 weeks in‐centre, then 18 weeks at home) increasing intensity and duration Comparison (n = 4) Standard medical care including education for treatment of diabetes and CKD |
Proteinuria |
| Morales 2003a | Dietary | Usual care | CKD stages 1 to 4 | 56 | 60 | Diet‐group 33 ± 3.5 Usual care 34.3 ± 5.7 |
5 months |
Intervention (n = 20) Daily energy restriction of 500 kcal + daily protein target of 1 to 1.2g/kg/day Comparison (n = 10) No energy restriction. Usual dietary intake with a protein goal of 1 to 1.2g/kg/day |
Urinary protein excretion |
| Orazio 2011 | Lifestyle | Usual care | Transplant recipients | 55 | 61 | Intervention group 29 ± 5 Control group 29 ± 6 |
2 years |
Intervention (n = 56) Mediterranean style, low glycaemic index diet with a 500 kcal/day energy restriction and encouraged to achieve 150 minutes of accumulated physical activity each week with Health Behaviour Change or stage of Change Model underpinning the lifestyle intervention Comparison (n = 46) Standard usual care |
Dietary factors, physical activity, cardiorespiratory fitness, anthropometry, biochemical and clinical factors |
| Praga 1995 | Dietary | Usual care | CKD | 48 | 35 | 37.9 ± 4.1 | 12 months |
Intervention (n = 9) Energy restricted diet. 1000 to 1400 kcal/day without protein restrictions Comparison (n = 8) No energy restriction, maintained current dietary habits. Commenced captopril treatment (25 to 150 mg/day) |
Weight loss, proteinuria |
| Woolf 2017 | Behavioural ‐ Social Cognitive Theory (SCT) based counselling | Usual care | CKD | 66 | 71 | 34.8 ± 5.4 | 6 months |
Intervention (n = 7) SCT‐based live WebEx sessions with a registered dietitian, access to online tool to log dietary intake, exercise, and body weight and email feedback from a registered dietitian weekly for the first month and then biweekly for 6 months Comparison (n = 7) Standard behaviour management group. No further information on what the group received was reported |
Weight loss and self efficacy |
| Pharmacological Interventions versus usual care or control | |||||||||
| Tomlinson 1975 (Trial 2) | Appetite suppressant | Control | Transplant recipients | ‐ | 57 | ‐ | 5 to 6 weeks |
Intervention (n = 8) Received 80 mg/day fenfluramine for 5 to 6 weeks, then placebo medication for a period of 3 weeks and finally given placebo medication for 5 to 6 weeks Comparison (n = 6) Received placebo for 5 to 6 weeks, then placebo medication for a period of 3 weeks, and finally given 80 mg/day fenfluramine for 5 to 6 weeks |
Body weight, plasma lipids |
| Mixed Interventions versus usual care or control | |||||||||
| Teplan 2002 | Dietary and appetite suppressant | Control | Transplant recipients | Range 22 to 78 | 42 | ‐ | 3 years |
Intervention (n = 128) Individualised low energy and low fat diet + corticoids withdrawal. After 3 months participants were given orlistat at a dose of up to 3 x 120 mg/day and statins for 3 years Comparison (n = 130) Usual care for up to 3 years |
BMI, total cholesterol, triglycerides, LDL cholesterol, fasting blood sugar level, creatinine clearance, proteinuria |
| Comparison 2. Any weight loss intervention versus diet intervention | |||||||||
| DIRECT 2013 | Dietary | Dietary | Subset data of those with stage 3 to 4 CKD obtained from authors | ‐ | ‐ | Low fat diet 30.8 ± 2.89 Mediterranean diet 30.6 ± 4.0 low carbohydrate diet 31.3 ± 3.24 |
2 years |
Intervention 1 (n = 34) Low fat diet: 1500 kcal/day for women and 1800 kcal/day for men, 30% from total fat, 10% from saturated fat Intervention 2 (n = 36) Mediterranean energy restricted: 1500 kcal/day for women and 1800 kcal/day for men, goal no more than 35% of energy from fat, main sources of fat were 30 to 45 g of olive oil and a handful of nuts per day Intervention3 (n = 29) Low carbohydrate, non‐energy restricted: 20 g of carbohydrate/day for 2 months and then gradual increase to a max of 120 g/day |
Weight loss |
| Jesudason 2013 | Dietary | Dietary | CKD stage 1, 2 and those with stage 3 with an eGFR > 40 | 59.4 | 78 | ‐ | 12 months |
Intervention 1 (n = 24) Standard protein weight loss diet: 6000 kJ for women and 7000 kJ/day for men, daily protein goal of 90 to 120 g Intervention 2 (n = 21) Moderate protein weight loss diet: 6000 kJ/day for women and 7000 kJ/day for men, daily protein goal of 90 to 120 g |
Kidney function (measured GFR) |
| Leehey 2016 | Exercise + dietary | Dietary | CKD stage 2 to 4 | 66 | 100 | 37.0 ± 4.5 | 12 months |
Intervention 1 (n = 18) Exercise + dietary: 12 weeks of thrice weekly exercise training followed by 40 weeks of supervised home exercise + daily 200 to 250 kcal energy restriction and usual medical care Intervention 2 (n = 18) Diet only :daily 200 to 250 kcal energy restriction + usual medical care |
Urine protein:creatinine ratio |
| Teplan 2006 | Dietary | Dietary | CKD stage 3 to 4 | 52 | 49 | Group 1 32.0 ± 3.3 Group 2 31.6 ± 3.9 |
3 years |
Intervention 1 (n = 66) Low protein + energy restriction + keto‐amino acid supplementation: low protein diet 0.6 g/kg/day, energy intake 120 to 125 kJ/kg/day for first 6 months and 125 to 130 kJ/kg/day thereafter. Diet was supplemented with Ketosteril (Fresenius Kabi) at a dose of 100 mg/kg/day Intervention 2 (n = 65) Low protein + energy restriction + placebo: low protein diet 0.6 g/kg/day, energy intake 120 to 125 kJ/kg/day for first 6 months and 125 to 130 kJ/kg/day thereafter. Diet was supplemented with placebo |
Plasma asymmetric dimethylarginine levels, body composition (BMI, visceral fat mass) |
| Tomlinson 1975 (Trial 1) | Appetite suppressant |
Dietary | Transplant recipients | ‐ | 55 | ‐ | 12 to 15 weeks |
Intervention 1 (n = 6) Received placebo medication for 2 to 3 weeks as a run‐in period, then continued on placebo medication for 5 to 6 weeks followed by 120 mg/day fenfluramine for 5 to 6 weeks. Received dietary advice at the beginning and during the run in phase Intervention 2 (n = 5) Received placebo medication for 2 to 3 weeks as a run‐in period, then received 120 mg/day fenfluramine for 5 to 6 weeks followed by placebo medication for 5 to 6 weeks. Received dietary advice at the beginning and during the run in phase |
Body weight, plasma lipids |
| Comparison 3. Surgical intervention versus non‐surgical intervention | |||||||||
| MacLaughlin 2014 | Surgical (sleeve gastrectomy) | Dietary + pharmacological |
CKD 3 to 4 | Median age 52 | 18 | Median 39.5 | 12 months |
Intervention (n = 5) Laparoscopic sleeve gastrectomy surgery + dietary energy restriction to ~ 1000 kcal/day post surgery Comparison (n = 6) Best medical care including an individualised dietary and physical activity prescription + orlistat |
eGFR, proteinuria, quality of life, insulin resistance, inflammation, adipokine response |
| Tzvetanov 2015 | Surgical (sleeve gastrectomy) | Standard weight loss program | Transplant recipients | Surgical group 45 Standard weight loss group 43 |
‐ | Surgical group 39.9 ± 1.4 Standard weight loss group 40.5 ± 0.2 |
12 months |
Intervention (n = 4) Simultaneous robotic kidney transplant and sleeve gastrectomy Comparison (n = 2) Standard weight loss program after a robotic kidney transplant |
BMI, eGFR |
Data and analyses
Comparison 1. Any weight loss intervention versus usual care or control.
| Outcome or subgroup title | No. of studies | No. of participants | Statistical method | Effect size |
|---|---|---|---|---|
| 1.1 Mean weight loss [kg] or post intervention body weight | 6 | 180 | Mean Difference (IV, Random, 95% CI) | ‐3.69 [‐5.82, ‐1.57] |
| 1.1.1 Lifestyle: dietary interventions (post intervention body weight) | 2 | 56 | Mean Difference (IV, Random, 95% CI) | ‐7.73 [‐16.06, 0.59] |
| 1.1.2 Lifestyle: physical activity (post intervention body weight) | 2 | 38 | Mean Difference (IV, Random, 95% CI) | ‐6.32 [‐27.45, 14.81] |
| 1.1.3 Lifestyle: mixed interventions (mean weight loss) | 1 | 72 | Mean Difference (IV, Random, 95% CI) | ‐2.50 [‐4.33, ‐0.67] |
| 1.1.4 Pharmacological interventions: appetite suppressant (mean weight loss) | 1 | 14 | Mean Difference (IV, Random, 95% CI) | ‐2.53 [‐5.33, 0.27] |
| 1.2 Body mass index | 4 | 100 | Mean Difference (IV, Random, 95% CI) | ‐2.18 [‐4.90, 0.54] |
| 1.2.1 Lifestyle: dietary interventions | 3 | 73 | Mean Difference (IV, Random, 95% CI) | ‐3.36 [‐5.68, ‐1.04] |
| 1.2.2 Lifestyle: physical activity | 1 | 27 | Mean Difference (IV, Random, 95% CI) | 0.56 [‐1.90, 3.02] |
| 1.3 Waist circumference | 2 | 53 | Mean Difference (IV, Random, 95% CI) | ‐0.68 [‐7.60, 6.24] |
| 1.3.1 Lifestyle: dietary interventions | 1 | 26 | Mean Difference (IV, Random, 95% CI) | ‐4.60 [‐12.88, 3.68] |
| 1.3.2 Lifestyle: physical activity | 1 | 27 | Mean Difference (IV, Random, 95% CI) | 2.50 [‐4.45, 9.45] |
| 1.4 Waist‐to‐hip ratio | 1 | Mean Difference (IV, Random, 95% CI) | Totals not selected | |
| 1.4.1 Lifestyle: mixed interventions (change score) | 1 | Mean Difference (IV, Random, 95% CI) | Totals not selected | |
| 1.5 Creatinine clearance [points] | 3 | 58 | Std. Mean Difference (IV, Random, 95% CI) | 0.29 [‐0.34, 0.91] |
| 1.5.1 Lifestyle: dietary interventions | 2 | 47 | Std. Mean Difference (IV, Random, 95% CI) | 0.50 [‐0.11, 1.11] |
| 1.5.2 Lifestyle: physical activity | 1 | 11 | Std. Mean Difference (IV, Random, 95% CI) | ‐0.54 [‐1.80, 0.72] |
| 1.6 Serum creatinine | 4 | 84 | Mean Difference (IV, Random, 95% CI) | ‐0.15 [‐0.52, 0.22] |
| 1.6.1 Lifestyle: dietary interventions | 3 | 73 | Mean Difference (IV, Random, 95% CI) | ‐0.28 [‐0.62, 0.06] |
| 1.6.2 Lifestyle: physical activity | 1 | 11 | Mean Difference (IV, Random, 95% CI) | 0.70 [‐0.27, 1.67] |
| 1.7 Proteinuria | 4 | 84 | Mean Difference (IV, Random, 95% CI) | ‐0.29 [‐0.76, 0.18] |
| 1.7.1 Lifestyle: dietary interventions | 3 | 73 | Mean Difference (IV, Random, 95% CI) | ‐0.52 [‐1.15, 0.12] |
| 1.7.2 Lifestyle: physical activity | 1 | 11 | Mean Difference (IV, Random, 95% CI) | 0.00 [‐0.46, 0.46] |
| 1.8 Systolic blood pressure | 4 | 139 | Mean Difference (IV, Random, 95% CI) | ‐5.90 [‐13.75, 1.96] |
| 1.8.1 Lifestyle: dietary interventions | 2 | 56 | Mean Difference (IV, Random, 95% CI) | ‐2.06 [‐7.90, 3.78] |
| 1.8.2 Lifestyle: physical activity | 2 | 83 | Mean Difference (IV, Random, 95% CI) | ‐11.28 [‐30.93, 8.38] |
| 1.9 Diastolic blood pressure | 4 | 139 | Mean Difference (IV, Random, 95% CI) | ‐5.49 [‐11.13, 0.14] |
| 1.9.1 Lifestyle: dietary interventions | 2 | 56 | Mean Difference (IV, Random, 95% CI) | ‐5.59 [‐17.43, 6.26] |
| 1.9.2 Lifestyle: physical activity | 2 | 83 | Mean Difference (IV, Random, 95% CI) | ‐5.95 [‐14.78, 2.87] |
| 1.10 HbA1c | 2 | 83 | Mean Difference (IV, Random, 95% CI) | ‐0.48 [‐1.15, 0.18] |
| 1.10.1 Lifestyle: physical activity | 1 | 11 | Mean Difference (IV, Random, 95% CI) | 0.20 [‐3.84, 4.24] |
| 1.10.2 Lifestyle: mixed interventions (change score) | 1 | 72 | Mean Difference (IV, Random, 95% CI) | ‐0.50 [‐1.17, 0.17] |
| 1.11 Fasting glucose | 2 | 98 | Mean Difference (IV, Random, 95% CI) | ‐1.27 [‐2.66, 0.11] |
| 1.11.1 Lifestyle: dietary interventions | 1 | 26 | Mean Difference (IV, Random, 95% CI) | 5.20 [‐17.04, 27.44] |
| 1.11.2 Lifestyle: mixed interventions (change score) | 1 | 72 | Mean Difference (IV, Random, 95% CI) | ‐1.30 [‐2.69, 0.09] |
| 1.12 Total cholesterol | 6 | 169 | Mean Difference (IV, Random, 95% CI) | ‐9.06 [‐20.30, 2.19] |
| 1.12.1 Lifestyle: dietary interventions | 3 | 73 | Mean Difference (IV, Random, 95% CI) | ‐12.99 [‐31.29, 5.30] |
| 1.12.2 Lifestyle: physical activity | 1 | 11 | Mean Difference (IV, Random, 95% CI) | ‐8.00 [‐34.97, 18.97] |
| 1.12.3 Lifestyle: mixed interventions (change score) | 1 | 72 | Mean Difference (IV, Random, 95% CI) | ‐7.70 [‐25.58, 10.18] |
| 1.12.4 Pharmacological interventions | 1 | 13 | Mean Difference (IV, Random, 95% CI) | 14.10 [‐45.10, 73.30] |
| 1.13 LDL cholesterol | 4 | 139 | Mean Difference (IV, Random, 95% CI) | ‐10.30 [‐16.70, ‐3.90] |
| 1.13.1 Lifestyle: dietary interventions | 2 | 56 | Mean Difference (IV, Random, 95% CI) | 3.28 [‐16.47, 23.03] |
| 1.13.2 Lifestyle: physical activity | 1 | 11 | Mean Difference (IV, Random, 95% CI) | ‐15.00 [‐38.05, 8.05] |
| 1.13.3 Lifestyle: mixed interventions (change score) | 1 | 72 | Mean Difference (IV, Random, 95% CI) | ‐11.60 [‐18.68, ‐4.52] |
| 1.14 HDL cholesterol | 4 | Mean Difference (IV, Random, 95% CI) | Totals not selected | |
| 1.14.1 Lifestyle: dietary interventions | 2 | Mean Difference (IV, Random, 95% CI) | Totals not selected | |
| 1.14.2 Lifestyle: physical activity | 1 | Mean Difference (IV, Random, 95% CI) | Totals not selected | |
| 1.14.3 Lifestyle: mixed interventions | 1 | Mean Difference (IV, Random, 95% CI) | Totals not selected | |
| 1.15 Triglycerides | 5 | 156 | Mean Difference (IV, Random, 95% CI) | ‐24.61 [‐49.53, 0.31] |
| 1.15.1 Lifestyle: dietary interventions | 3 | 73 | Mean Difference (IV, Random, 95% CI) | ‐16.29 [‐65.23, 32.66] |
| 1.15.2 Lifestyle: physical activity | 1 | 11 | Mean Difference (IV, Random, 95% CI) | ‐46.00 [‐163.90, 71.90] |
| 1.15.3 Lifestyle: mixed interventions (change score) | 1 | 72 | Mean Difference (IV, Random, 95% CI) | ‐32.40 [‐39.58, ‐25.22] |
| 1.16 C‐reactive protein | 1 | Mean Difference (IV, Random, 95% CI) | Totals not selected | |
| 1.16.1 Lifestyle: physical activity | 1 | Mean Difference (IV, Random, 95% CI) | Totals not selected | |
| 1.17 Dietary energy intake | 4 | 100 | Std. Mean Difference (IV, Random, 95% CI) | ‐0.55 [‐1.35, 0.25] |
| 1.17.1 Lifestyle: dietary interventions | 1 | 26 | Std. Mean Difference (IV, Random, 95% CI) | ‐1.77 [‐2.70, ‐0.84] |
| 1.17.2 Lifestyle: physical activity | 2 | 38 | Std. Mean Difference (IV, Random, 95% CI) | ‐0.06 [‐0.73, 0.62] |
| 1.17.3 Lifestyle: mixed interventions | 1 | 36 | Std. Mean Difference (IV, Random, 95% CI) | ‐0.21 [‐0.86, 0.45] |
1.4. Analysis.
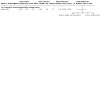
Comparison 1: Any weight loss intervention versus usual care or control, Outcome 4: Waist‐to‐hip ratio
1.16. Analysis.
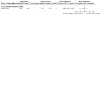
Comparison 1: Any weight loss intervention versus usual care or control, Outcome 16: C‐reactive protein
Comparison 2. Any weight loss intervention versus dietary intervention.
| Outcome or subgroup title | No. of studies | No. of participants | Statistical method | Effect size |
|---|---|---|---|---|
| 2.1 Mean weight loss [kg] or post intervention body weight | 3 | 155 | Mean Difference (IV, Random, 95% CI) | 0.76 [‐2.12, 3.64] |
| 2.1.1 Low carbohydrate diet versus Mediterranean diet (post intervention body weight) | 1 | 47 | Mean Difference (IV, Random, 95% CI) | 2.05 [‐6.23, 10.33] |
| 2.1.2 Low fat diet versus Mediterranean diet (post intervention body weight) | 1 | 52 | Mean Difference (IV, Random, 95% CI) | 2.88 [‐5.69, 11.45] |
| 2.1.3 Moderate‐protein weight loss diet versus Standard‐protein weight loss diet (mean weight loss) | 1 | 45 | Mean Difference (IV, Random, 95% CI) | 3.10 [‐3.30, 9.50] |
| 2.1.4 Dietary advice + appetite suppressant (pharmacological) versus dietary advice alone (mean weight loss) | 1 | 11 | Mean Difference (IV, Random, 95% CI) | ‐0.78 [‐4.61, 3.05] |
| 2.2 Body mass index | 3 | 262 | Mean Difference (IV, Random, 95% CI) | ‐1.27 [‐4.43, 1.89] |
| 2.2.1 Low carbohydrate diet versus Mediterranean diet | 1 | 47 | Mean Difference (IV, Random, 95% CI) | 0.25 [‐1.97, 2.47] |
| 2.2.2 Low fat diet versus Mediterranean diet | 1 | 52 | Mean Difference (IV, Random, 95% CI) | 0.39 [‐1.86, 2.64] |
| 2.2.3 Low protein weight loss diet + keto‐amino acids versus low protein weight diet alone | 1 | 131 | Mean Difference (IV, Random, 95% CI) | ‐4.80 [‐6.22, ‐3.38] |
| 2.2.4 Energy restriction + exercise versus energy restriction alone | 1 | 32 | Mean Difference (IV, Random, 95% CI) | ‐0.40 [‐4.65, 3.85] |
| 2.3 Waist circumference | 1 | Mean Difference (IV, Random, 95% CI) | Totals not selected | |
| 2.3.1 Low carbohydrate diet versus Mediterranean diet | 1 | Mean Difference (IV, Random, 95% CI) | Totals not selected | |
| 2.3.2 Low fat diet versus Mediterranean diet | 1 | Mean Difference (IV, Random, 95% CI) | Totals not selected | |
| 2.4 Waist‐to‐hip ratio | 1 | Mean Difference (IV, Random, 95% CI) | Totals not selected | |
| 2.4.1 Low protein weight loss diet + keto‐amino acids versus low protein weight diet alone | 1 | Mean Difference (IV, Random, 95% CI) | Totals not selected | |
| 2.5 Creatinine clearance [mL/min/1.732] | 1 | Mean Difference (IV, Random, 95% CI) | Totals not selected | |
| 2.5.1 Low protein weight loss diet + keto‐amino acids versus low protein weight diet alone | 1 | Mean Difference (IV, Random, 95% CI) | Totals not selected | |
| 2.6 Proteinuria | 1 | Mean Difference (IV, Random, 95% CI) | Totals not selected | |
| 2.6.1 Low protein weight loss diet + keto‐amino acids versus low protein weight diet alone | 1 | Mean Difference (IV, Random, 95% CI) | Totals not selected | |
| 2.7 Measured GFR | 2 | 176 | Std. Mean Difference (IV, Random, 95% CI) | 0.63 [0.25, 1.02] |
| 2.7.1 Low protein weight loss diet + keto‐amino acids versus Low protein weight diet alone | 1 | 131 | Std. Mean Difference (IV, Random, 95% CI) | 0.77 [0.42, 1.13] |
| 2.7.2 Energy restricted low protein diet versus energy restricted moderate protein diet | 1 | 45 | Std. Mean Difference (IV, Random, 95% CI) | 0.35 [‐0.24, 0.94] |
| 2.8 Systolic blood pressure | 3 | 262 | Mean Difference (IV, Random, 95% CI) | ‐2.33 [‐8.32, 3.67] |
| 2.8.1 Low carbohydrate diet versus Mediterranean diet | 1 | 47 | Mean Difference (IV, Random, 95% CI) | 1.03 [‐5.94, 8.00] |
| 2.8.2 Low fat diet versus Mediterranean diet | 1 | 52 | Mean Difference (IV, Random, 95% CI) | ‐1.23 [‐8.25, 5.79] |
| 2.8.3 Low protein weight loss diet + keto‐amino acids versus low protein weight diet alone | 1 | 131 | Mean Difference (IV, Random, 95% CI) | ‐8.00 [‐10.57, ‐5.43] |
| 2.8.4 Energy restriction + exercise versus dietary energy restriction alone | 1 | 32 | Mean Difference (IV, Random, 95% CI) | 4.00 [‐8.57, 16.57] |
| 2.9 Diastolic blood pressure | 3 | 275 | Mean Difference (IV, Random, 95% CI) | ‐1.87 [‐3.59, ‐0.14] |
| 2.9.1 Low carbohydrate diet versus Mediterranean diet | 1 | 47 | Mean Difference (IV, Random, 95% CI) | ‐0.42 [‐5.61, 4.77] |
| 2.9.2 Low fat diet versus Mediterranean diet | 1 | 52 | Mean Difference (IV, Random, 95% CI) | ‐1.49 [‐6.72, 3.74] |
| 2.9.3 Low protein weight loss diet + keto‐amino acids versus low protein weight diet alone | 1 | 131 | Mean Difference (IV, Random, 95% CI) | ‐2.00 [‐4.09, 0.09] |
| 2.9.4 Moderate protein weight loss diet versus standard protein weight loss diet | 1 | 45 | Mean Difference (IV, Random, 95% CI) | ‐3.00 [‐8.55, 2.55] |
| 2.10 HbA1c | 2 | 163 | Mean Difference (IV, Random, 95% CI) | ‐1.62 [‐3.87, 0.63] |
| 2.10.1 Energy restriction + exercise versus energy restriction alone | 1 | 32 | Mean Difference (IV, Random, 95% CI) | ‐0.40 [‐1.73, 0.93] |
| 2.10.2 Low protein weight loss diet + keto‐amino acids versus low protein weight diet alone | 1 | 131 | Mean Difference (IV, Random, 95% CI) | ‐2.70 [‐3.45, ‐1.95] |
| 2.11 Fasting blood glucose | 1 | 99 | Mean Difference (IV, Random, 95% CI) | ‐2.56 [‐10.21, 5.08] |
| 2.11.1 Low carbohydrate diet versus Mediterranean diet | 1 | 47 | Mean Difference (IV, Random, 95% CI) | ‐0.28 [‐11.27, 10.71] |
| 2.11.2 Low fat diet versus Mediterranean diet | 1 | 52 | Mean Difference (IV, Random, 95% CI) | ‐4.71 [‐15.35, 5.93] |
| 2.12 C‐reactive protein | 1 | Mean Difference (IV, Random, 95% CI) | Totals not selected | |
| 2.12.1 Energy restriction + exercise versus energy restriction alone | 1 | Mean Difference (IV, Random, 95% CI) | Totals not selected | |
| 2.13 Total cholesterol | 4 | 272 | Mean Difference (IV, Random, 95% CI) | ‐2.01 [‐21.38, 17.35] |
| 2.13.1 Low carbohydrate diet versus Mediterranean diet | 1 | 47 | Mean Difference (IV, Random, 95% CI) | 9.49 [‐11.10, 30.08] |
| 2.13.2 Low fat diet versus Mediterranean diet | 1 | 52 | Mean Difference (IV, Random, 95% CI) | ‐0.61 [‐24.13, 22.91] |
| 2.13.3 Low protein weight loss diet + keto‐amino acids versus low protein weight diet alone | 1 | 131 | Mean Difference (IV, Random, 95% CI) | ‐23.20 [‐33.95, ‐12.45] |
| 2.13.4 Energy restriction + exercise versus energy restriction alone | 1 | 32 | Mean Difference (IV, Random, 95% CI) | 16.00 [‐6.75, 38.75] |
| 2.13.5 Dietary advice + appetite suppressant (pharmacological) versus dietary advice alone | 1 | 10 | Mean Difference (IV, Random, 95% CI) | ‐18.00 [‐94.25, 58.25] |
| 2.14 LDL cholesterol | 3 | 262 | Mean Difference (IV, Random, 95% CI) | 1.39 [‐16.66, 19.45] |
| 2.14.1 Low carbohydrate diet versus Mediterranean diet | 1 | 47 | Mean Difference (IV, Random, 95% CI) | 7.31 [‐12.91, 27.53] |
| 2.14.2 Low fat diet versus Mediterranean diet | 1 | 52 | Mean Difference (IV, Random, 95% CI) | 4.60 [‐15.88, 25.08] |
| 2.14.3 Low protein weight loss diet + keto‐amino acids versus low protein weight diet | 1 | 131 | Mean Difference (IV, Random, 95% CI) | ‐19.34 [‐32.58, ‐6.10] |
| 2.14.4 Energy restriction + exercise versus energy restriction alone | 1 | 32 | Mean Difference (IV, Random, 95% CI) | 20.00 [‐4.87, 44.87] |
| 2.15 HDL cholesterol | 2 | 131 | Mean Difference (IV, Random, 95% CI) | ‐4.80 [‐8.71, ‐0.89] |
| 2.15.1 Low carbohydrate diet versus Mediterranean diet | 1 | 47 | Mean Difference (IV, Random, 95% CI) | ‐2.69 [‐9.11, 3.73] |
| 2.15.2 Low fat diet versus Mediterranean diet | 1 | 52 | Mean Difference (IV, Random, 95% CI) | ‐5.09 [‐12.04, 1.86] |
| 2.15.3 Energy restriction + exercise versus energy restriction alone | 1 | 32 | Mean Difference (IV, Random, 95% CI) | ‐7.00 [‐13.98, ‐0.02] |
| 2.16 Triglycerides | 3 | 262 | Mean Difference (IV, Random, 95% CI) | ‐3.22 [‐31.50, 25.06] |
| 2.16.1 Low carbohydrate diet versus Mediterranean diet | 1 | 47 | Mean Difference (IV, Random, 95% CI) | 5.87 [‐49.06, 60.80] |
| 2.16.2 Low fat diet versus Mediterranean diet | 1 | 52 | Mean Difference (IV, Random, 95% CI) | 0.20 [‐46.75, 47.15] |
| 2.16.3 Low protein weight loss diet + keto‐amino acids versus low protein weight diet | 1 | 131 | Mean Difference (IV, Random, 95% CI) | ‐23.20 [‐37.84, ‐8.56] |
| 2.16.4 Energy restriction + exercise versus energy restriction | 1 | 32 | Mean Difference (IV, Random, 95% CI) | 49.00 [‐17.63, 115.63] |
| 2.17 Dietary energy intake | 1 | Mean Difference (IV, Random, 95% CI) | Totals not selected | |
| 2.17.1 Energyrestricted low protein versus energy restricted moderate protein | 1 | Mean Difference (IV, Random, 95% CI) | Totals not selected | |
| 2.18 Quality of life: SF36 physical domain | 1 | Mean Difference (IV, Random, 95% CI) | Totals not selected | |
| 2.18.1 Energy restriction + exercise versus energy restriction | 1 | Mean Difference (IV, Random, 95% CI) | Totals not selected | |
| 2.19 Quality of life: SF36 mental domain | 1 | Mean Difference (IV, Random, 95% CI) | Totals not selected | |
| 2.19.1 Energy restriction + exercise versus energy restriction | 1 | Mean Difference (IV, Random, 95% CI) | Totals not selected | |
| 2.20 Quality of life: CES‐D | 1 | Mean Difference (IV, Random, 95% CI) | Totals not selected | |
| 2.20.1 Energy restriction + exercise versus energy restriction | 1 | Mean Difference (IV, Random, 95% CI) | Totals not selected |
2.3. Analysis.
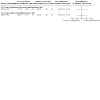
Comparison 2: Any weight loss intervention versus dietary intervention, Outcome 3: Waist circumference
2.4. Analysis.
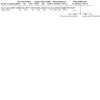
Comparison 2: Any weight loss intervention versus dietary intervention, Outcome 4: Waist‐to‐hip ratio
2.5. Analysis.
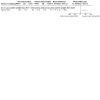
Comparison 2: Any weight loss intervention versus dietary intervention, Outcome 5: Creatinine clearance [mL/min/1.732]
2.6. Analysis.

Comparison 2: Any weight loss intervention versus dietary intervention, Outcome 6: Proteinuria
2.11. Analysis.
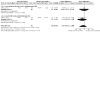
Comparison 2: Any weight loss intervention versus dietary intervention, Outcome 11: Fasting blood glucose
2.12. Analysis.
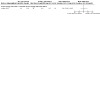
Comparison 2: Any weight loss intervention versus dietary intervention, Outcome 12: C‐reactive protein
2.17. Analysis.
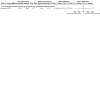
Comparison 2: Any weight loss intervention versus dietary intervention, Outcome 17: Dietary energy intake
2.18. Analysis.
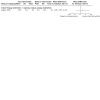
Comparison 2: Any weight loss intervention versus dietary intervention, Outcome 18: Quality of life: SF36 physical domain
2.19. Analysis.
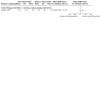
Comparison 2: Any weight loss intervention versus dietary intervention, Outcome 19: Quality of life: SF36 mental domain
2.20. Analysis.
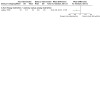
Comparison 2: Any weight loss intervention versus dietary intervention, Outcome 20: Quality of life: CES‐D
Comparison 3. Surgical versus non‐surgical weight loss intervention.
| Outcome or subgroup title | No. of studies | No. of participants | Statistical method | Effect size |
|---|---|---|---|---|
| 3.1 Mean weight loss (change score) | 1 | Mean Difference (IV, Random, 95% CI) | Totals not selected | |
| 3.2 Body mass index | 2 | 17 | Mean Difference (IV, Random, 95% CI) | ‐10.43 [‐13.58, ‐7.29] |
| 3.3 Waist circumference (change score) | 1 | Mean Difference (IV, Random, 95% CI) | Totals not selected | |
| 3.4 Body composition: fat mass (change score) | 1 | Mean Difference (IV, Random, 95% CI) | Totals not selected | |
| 3.5 Proteinuria (change score) | 1 | Mean Difference (IV, Random, 95% CI) | Totals not selected | |
| 3.6 Serum creatinine (change score) | 1 | Mean Difference (IV, Random, 95% CI) | Totals not selected | |
| 3.7 C‐reactive protein (change score) | 1 | Mean Difference (IV, Random, 95% CI) | Totals not selected | |
| 3.8 Quality of life: SF36 physical domain (change score) | 1 | Mean Difference (IV, Random, 95% CI) | Totals not selected | |
| 3.9 Quality of life: SF36 mental domain (change score) | 1 | Mean Difference (IV, Random, 95% CI) | Totals not selected |
3.3. Analysis.
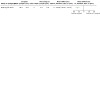
Comparison 3: Surgical versus non‐surgical weight loss intervention, Outcome 3: Waist circumference (change score)
3.4. Analysis.
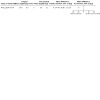
Comparison 3: Surgical versus non‐surgical weight loss intervention, Outcome 4: Body composition: fat mass (change score)
3.5. Analysis.

Comparison 3: Surgical versus non‐surgical weight loss intervention, Outcome 5: Proteinuria (change score)
3.6. Analysis.
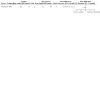
Comparison 3: Surgical versus non‐surgical weight loss intervention, Outcome 6: Serum creatinine (change score)
3.7. Analysis.

Comparison 3: Surgical versus non‐surgical weight loss intervention, Outcome 7: C‐reactive protein (change score)
3.8. Analysis.
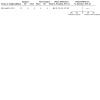
Comparison 3: Surgical versus non‐surgical weight loss intervention, Outcome 8: Quality of life: SF36 physical domain (change score)
3.9. Analysis.
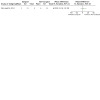
Comparison 3: Surgical versus non‐surgical weight loss intervention, Outcome 9: Quality of life: SF36 mental domain (change score)
Comparison 4. Weight loss intervention versus usual care or control: stage of CKD.
| Outcome or subgroup title | No. of studies | No. of participants | Statistical method | Effect size |
|---|---|---|---|---|
| 4.1 Mean weight loss [kg or %] | 6 | 278 | Mean Difference (IV, Random, 95% CI) | ‐1.40 [‐4.53, 1.74] |
| 4.1.1 CKD stages 1‐5: (mean weight loss) [kg] | 4 | 162 | Mean Difference (IV, Random, 95% CI) | ‐0.93 [‐8.79, 6.93] |
| 4.1.2 Transplant: (mean weight loss) [%] | 2 | 116 | Mean Difference (IV, Random, 95% CI) | ‐1.70 [‐4.42, 1.02] |
| 4.2 Total cholesterol | 5 | 98 | Mean Difference (IV, Random, 95% CI) | ‐11.92 [‐27.31, 3.47] |
| 4.2.1 CKD stages 1‐5 | 4 | 84 | Mean Difference (IV, Random, 95% CI) | ‐14.02 [‐30.02, 1.99] |
| 4.2.2 Transplant | 1 | 14 | Mean Difference (IV, Random, 95% CI) | 14.10 [‐42.26, 70.46] |
Comparison 5. Weight loss intervention versus usual care or control: duration of intervention.
| Outcome or subgroup title | No. of studies | No. of participants | Statistical method | Effect size |
|---|---|---|---|---|
| 5.1 Mean weight loss: post intervention body weight | 6 | 248 | Mean Difference (IV, Random, 95% CI) | ‐1.65 [‐4.54, 1.25] |
| 5.1.1 Intervention duration ≤ 3 months | 2 | 109 | Mean Difference (IV, Random, 95% CI) | ‐2.06 [‐4.73, 0.62] |
| 5.1.2 Intervention duration > 3 months | 4 | 139 | Mean Difference (IV, Random, 95% CI) | ‐1.70 [‐5.66, 2.27] |
| 5.2 Body mass index | 4 | 100 | Mean Difference (IV, Random, 95% CI) | ‐2.49 [‐4.97, 0.00] |
| 5.2.1 Intervention duration ≤ 3 months | 1 | 27 | Mean Difference (IV, Random, 95% CI) | 0.57 [‐3.59, 4.72] |
| 5.2.2 Intervention duration > 3 months | 3 | 73 | Mean Difference (IV, Random, 95% CI) | ‐3.36 [‐5.68, ‐1.04] |
| 5.3 Total cholesterol | 5 | 97 | Std. Mean Difference (IV, Random, 95% CI) | ‐0.23 [‐0.65, 0.18] |
| 5.3.1 Intervention duration ≤ 3 months | 1 | 13 | Std. Mean Difference (IV, Random, 95% CI) | 0.25 [‐0.85, 1.34] |
| 5.3.2 Intervention duration > 3 months | 4 | 84 | Std. Mean Difference (IV, Random, 95% CI) | ‐0.31 [‐0.76, 0.13] |
| 5.4 Dietary energy intake | 3 | 64 | Std. Mean Difference (IV, Random, 95% CI) | ‐0.69 [‐1.88, 0.50] |
| 5.4.1 Intervention duration ≤ 3 months | 1 | 27 | Std. Mean Difference (IV, Random, 95% CI) | 0.08 [‐0.72, 0.88] |
| 5.4.2 Intervention duration > 3 months | 2 | 37 | Std. Mean Difference (IV, Random, 95% CI) | ‐1.14 [‐2.50, 0.23] |
Characteristics of studies
Characteristics of included studies [ordered by study ID]
Baria 2014.
| Study characteristics | ||
| Methods |
|
|
| Participants |
|
|
| Interventions |
Home‐based exercise group
In‐centre based exercise group
Control group
Co‐interventions
|
|
| Outcomes |
|
|
| Notes |
|
|
| Risk of bias | ||
| Bias | Authors' judgement | Support for judgement |
| Random sequence generation (selection bias) | Unclear risk | Insufficient information to permit judgement |
| Allocation concealment (selection bias) | Unclear risk | Insufficient information to permit judgement |
| Blinding of participants and personnel (performance bias) All outcomes | High risk | Blinding of participants or study personnel was not described. Participants were randomised to a one of two exercise groups or control group. Therefore study participants were unlikely to be blinded |
| Blinding of outcome assessment (detection bias) All outcomes | Unclear risk | A blinded assessor was used to report abdominal computed tomography. It is not reported if assessors reporting on all other outcome measures were blinded, therefore there was insufficient information to permit judgement |
| Incomplete outcome data (attrition bias) All outcomes | Low risk | Data available for 93% of study participants. Similar dropout rates in both treatment and control group |
| Selective reporting (reporting bias) | Unclear risk | Protocol not published; however authors appear to report on what they intended to report on as described in the study aims |
| Other bias | Low risk | Study appears free of other biases |
DIRECT 2013.
| Study characteristics | ||
| Methods |
|
|
| Participants |
|
|
| Interventions |
Intervention group 1 (low fat, restricted energy)
Intervention group 2: (Mediterranean restricted energy)
Intervention group 3 (low carbohydrate, non‐restricted energy)
Co‐interventions
|
|
| Outcomes |
|
|
| Notes |
|
|
| Risk of bias | ||
| Bias | Authors' judgement | Support for judgement |
| Random sequence generation (selection bias) | Low risk | Participants were randomised by strata of sex, age, BMI, history of coronary heart disease, type 2 diabetes, and current use of statins |
| Allocation concealment (selection bias) | Unclear risk | Insufficient information about the sequence generation process to permit judgment |
| Blinding of participants and personnel (performance bias) All outcomes | High risk | Masking of patients or study personnel not reported in the study report. Participants were randomised to either one of three different dietary groups. Therefore, participants and investigators (dietitians) were unlikely to be blinded to treatment allocation |
| Blinding of outcome assessment (detection bias) All outcomes | Low risk | Quote: "The clinic and laboratory staff members were unaware of the treatment assignments and the study coordinators were unaware of all outcome data until the end of the intervention" |
| Incomplete outcome data (attrition bias) All outcomes | Low risk | Low and balanced attrition rates across each groups with similar reasons for withdrawal |
| Selective reporting (reporting bias) | Low risk | Authors appear to report on what they intended to report on as described in the study aims |
| Other bias | High risk | Post hoc reporting of sub‐groups with CKD stages 3 to 4 |
Ikizler 2018.
| Study characteristics | ||
| Methods |
|
|
| Participants |
|
|
| Interventions |
Aerobic exercise + energy restriction group
Usual activity + energy restriction group
Aerobic exercise + usual diet group
Usual activity + usual diet group
Co‐interventions
|
|
| Outcomes |
|
|
| Notes |
|
|
| Risk of bias | ||
| Bias | Authors' judgement | Support for judgement |
| Random sequence generation (selection bias) | Low risk | Quote: "Participants were assigned to one of the study arms using a permuted block randomisation strategy 1:1 ratio" |
| Allocation concealment (selection bias) | Unclear risk | Insufficient information about the sequence generation process to permit judgment |
| Blinding of participants and personnel (performance bias) All outcomes | High risk | Quote: "Because of the nature of the intervention, the study was unblinded" |
| Blinding of outcome assessment (detection bias) All outcomes | Unclear risk | Insufficient information about the blinding of outcome assessments to permit judgment |
| Incomplete outcome data (attrition bias) All outcomes | Low risk | 11.5% attrition rate with balanced dropouts across each groups with similar reasons across groups for withdrawal |
| Selective reporting (reporting bias) | Unclear risk | No study protocol paper published. Authors appear to report on what they intended to report on as described in the study aims |
| Other bias | Low risk | The study appears to be free of other sources of bias |
Jesudason 2013.
| Study characteristics | ||
| Methods |
|
|
| Participants |
|
|
| Interventions |
Moderate protein group
Standard protein group
Co‐interventions
|
|
| Outcomes |
|
|
| Notes |
|
|
| Risk of bias | ||
| Bias | Authors' judgement | Support for judgement |
| Random sequence generation (selection bias) | Low risk | Quote: "Random assignment was carried out before inclusion on the basis of computer‐generated random‐number list" |
| Allocation concealment (selection bias) | Low risk | Quote: "The allocation sequence was concealed in sealed envelopes from the researcher who enrolled and assessed participants" |
| Blinding of participants and personnel (performance bias) All outcomes | High risk | Blinding of participants or study personnel was not described. Participants were randomised to one of two dietary intervention therefore study participants were unlikely to be blinded |
| Blinding of outcome assessment (detection bias) All outcomes | Unclear risk | Insufficient information to permit judgement |
| Incomplete outcome data (attrition bias) All outcomes | High risk | High levels of attrition in both groups: moderate protein group (38%); standard protein group (23%) |
| Selective reporting (reporting bias) | High risk | Selective reporting of some outcome measures after baseline |
| Other bias | Unclear risk | Insufficient information to permit judgement. Some imbalances at baseline in albuminuria. Also wide ranging baseline kidney function |
Kittiskulnam 2014.
| Study characteristics | ||
| Methods |
|
|
| Participants |
|
|
| Interventions |
Intervention group (low‐energy diet group)
Control group (usual dietary intake group)
Co‐interventions
|
|
| Outcomes |
|
|
| Notes |
|
|
| Risk of bias | ||
| Bias | Authors' judgement | Support for judgement |
| Random sequence generation (selection bias) | Low risk | Quote: "patients were randomised by block randomisation using varying blocks into two groups" |
| Allocation concealment (selection bias) | Unclear risk | Insufficient information to permit judgement |
| Blinding of participants and personnel (performance bias) All outcomes | High risk | Neither participants nor personnel were blinded |
| Blinding of outcome assessment (detection bias) All outcomes | High risk | Quote: "The clinician and nutritionist who gave dietary advice were not blinded". These same clinicians were responsible for measuring and recording a number of outcome data including body weight |
| Incomplete outcome data (attrition bias) All outcomes | Low risk | No study dropouts and no missing data |
| Selective reporting (reporting bias) | Unclear risk | Insufficient information to permit judgement. Not study protocol published. Dietary compliance information collected but not reported |
| Other bias | Unclear risk | Study appears free of other biases. Quote: "The study statistician was blinded throughout the study" |
LANDMARK 3 2013.
| Study characteristics | ||
| Methods |
|
|
| Participants |
|
|
| Interventions |
Lifestyle intervention group
Standard care (control group)
Co‐interventions
|
|
| Outcomes |
|
|
| Notes |
|
|
| Risk of bias | ||
| Bias | Authors' judgement | Support for judgement |
| Random sequence generation (selection bias) | Low risk | Quote "Patients were assigned to either the lifestyle intervention group or to the usual care control group in a 1:1 ratio using a computer random assignment program." |
| Allocation concealment (selection bias) | Unclear risk | Insufficient information provided to permit judgement |
| Blinding of participants and personnel (performance bias) All outcomes | High risk | The study was an open label study ‐ participants and personnel were not blinded |
| Blinding of outcome assessment (detection bias) All outcomes | Unclear risk | Insufficient information provided to permit judgement |
| Incomplete outcome data (attrition bias) All outcomes | Low risk | < 15% attrition rates across each groups with similar reasons for withdrawal |
| Selective reporting (reporting bias) | Low risk | Authors appear to report on what they intended to report on as described in the study aims |
| Other bias | Unclear risk | The study appears to be free of other sources of bias |
Leehey 2009.
| Study characteristics | ||
| Methods |
|
|
| Participants |
|
|
| Interventions |
Intervention group
Control group
Co‐interventions
|
|
| Outcomes |
|
|
| Notes |
|
|
| Risk of bias | ||
| Bias | Authors' judgement | Support for judgement |
| Random sequence generation (selection bias) | Low risk | Block randomisation used to allocate to treatment or control group |
| Allocation concealment (selection bias) | Unclear risk | Insufficient information to permit judgement |
| Blinding of participants and personnel (performance bias) All outcomes | High risk | Blinding of participants or study personnel was not described. Participants were randomised to one of two intervention groups therefore study participants were unlikely to be blinded |
| Blinding of outcome assessment (detection bias) All outcomes | Unclear risk | Insufficient information to permit judgement |
| Incomplete outcome data (attrition bias) All outcomes | Unclear risk | Insufficient information to permit judgement |
| Selective reporting (reporting bias) | Low risk | Authors report on what they intended to report on as described in the study aims |
| Other bias | Unclear risk | Insufficient information to permit judgement, no indication of adherence to intervention or whether the control group changed their exercise habits during the study |
Leehey 2016.
| Study characteristics | ||
| Methods |
|
|
| Participants |
|
|
| Interventions |
Intervention group (exercise + diet)
Control group (diet alone)
Co‐interventions
|
|
| Outcomes |
|
|
| Notes |
|
|
| Risk of bias | ||
| Bias | Authors' judgement | Support for judgement |
| Random sequence generation (selection bias) | Low risk | Quote: "Patients were randomised using a computer generated permuted block scheme" |
| Allocation concealment (selection bias) | Low risk | Insufficient information to permit judgement ‐ not reported if allocation was concealed |
| Blinding of participants and personnel (performance bias) All outcomes | High risk | Participants not blinded, personnel undertaking intervention not blinded |
| Blinding of outcome assessment (detection bias) All outcomes | Low risk | Quote: "Study personnel supervising testing were blinded to group assignment." |
| Incomplete outcome data (attrition bias) All outcomes | Unclear risk | Insufficient information to permit judgement |
| Selective reporting (reporting bias) | Unclear risk | Insufficient information to permit judgement |
| Other bias | Unclear risk | Study appears free of other biases. Study underpowered ‐ didn't reach target sample size to detect treatment effect looking for |
MacLaughlin 2014.
| Study characteristics | ||
| Methods |
|
|
| Participants |
|
|
| Interventions |
Intervention group: laparoscopic sleeve gastrectomy + dietary + physical activity support
Comparator group: behavioural: weight management program
Co‐interventions
|
|
| Outcomes |
|
|
| Notes |
|
|
| Risk of bias | ||
| Bias | Authors' judgement | Support for judgement |
| Random sequence generation (selection bias) | Low risk | Quote: "A computer‐generated random allocation sequence, with blocked permutations of 2‐4" |
| Allocation concealment (selection bias) | Low risk | Participant allocation was generated and held by an independent professional external to the study sites |
| Blinding of participants and personnel (performance bias) All outcomes | High risk | Blinding of participants or study personnel was not described. Participants were randomised to bariatric surgery or usual medical care. Therefore study participants were unblinded |
| Blinding of outcome assessment (detection bias) All outcomes | Unclear risk | Not reported if outcome assessors were blinded. Insufficient information to permit judgement |
| Incomplete outcome data (attrition bias) All outcomes | High risk | High 30% dropout rate |
| Selective reporting (reporting bias) | High risk | Compliance with diet and physical activity and medication change were prespecified but not reported on |
| Other bias | High risk | Blocked randomisation in an unblinded RCT Very low recruitment update 10% |
Morales 2003a.
| Study characteristics | ||
| Methods |
|
|
| Participants |
|
|
| Interventions |
Intervention group (diet group)
Control group
Co‐interventions
|
|
| Outcomes |
|
|
| Notes |
|
|
| Risk of bias | ||
| Bias | Authors' judgement | Support for judgement |
| Random sequence generation (selection bias) | Unclear risk | Insufficient information to permit judgement |
| Allocation concealment (selection bias) | Unclear risk | Insufficient information to permit judgement |
| Blinding of participants and personnel (performance bias) All outcomes | High risk | Same physicians saw all patients and assessed food diaries ‐ which indicated they were not blinded to the intervention group allocation |
| Blinding of outcome assessment (detection bias) All outcomes | High risk | Outcomes assessed by physicians involved in the intervention delivery |
| Incomplete outcome data (attrition bias) All outcomes | Unclear risk | Insufficient information to permit judgement. Attrition rate and reasons for drop‐out were not reported |
| Selective reporting (reporting bias) | Unclear risk | Some lab evaluations measures listed in the methods were not reported in the results, Intervention adherence not reported |
| Other bias | Low risk | Funding source and any possible conflicts of interest not reported. No baseline imbalance evident. Stopping antiproteinuric drugs no longer likely able to be done in a study such as this due to their established protective effects |
Orazio 2011.
| Study characteristics | ||
| Methods |
|
|
| Participants |
|
|
| Interventions |
Intervention group (lifestyle group)
Control group
Co‐interventions
|
|
| Outcomes |
|
|
| Notes |
|
|
| Risk of bias | ||
| Bias | Authors' judgement | Support for judgement |
| Random sequence generation (selection bias) | Unclear risk | Insufficient information to permit judgement |
| Allocation concealment (selection bias) | Unclear risk | Insufficient information to permit judgement |
| Blinding of participants and personnel (performance bias) All outcomes | High risk | Insufficient information to permit judgement ‐ participants unlikely to be not blinded |
| Blinding of outcome assessment (detection bias) All outcomes | Unclear risk | Insufficient information to permit judgement |
| Incomplete outcome data (attrition bias) All outcomes | Unclear risk | Number of participants who completed the study were not reported |
| Selective reporting (reporting bias) | Unclear risk | No protocol published. Insufficient information detailing whether treatment outcomes are reported as planned |
| Other bias | Low risk | Study appears free of other biases |
Praga 1995.
| Study characteristics | ||
| Methods |
|
|
| Participants |
|
|
| Interventions |
Intervention group (hypocaloric diet)
Control group (captopril without dietary change)
Co‐interventions
|
|
| Outcomes |
|
|
| Notes |
|
|
| Risk of bias | ||
| Bias | Authors' judgement | Support for judgement |
| Random sequence generation (selection bias) | Unclear risk | Insufficient information to permit judgement ‐ no description of randomisation sequence |
| Allocation concealment (selection bias) | Unclear risk | Insufficient information to permit judgement ‐ no description of allocation concealment |
| Blinding of participants and personnel (performance bias) All outcomes | Unclear risk | Insufficient information to permit judgement |
| Blinding of outcome assessment (detection bias) All outcomes | Unclear risk | Insufficient information to permit judgement ‐ no details on if assessors were blinded or not |
| Incomplete outcome data (attrition bias) All outcomes | Unclear risk | Insufficient information to permit judgement |
| Selective reporting (reporting bias) | High risk | Many reported outcome measures have not been reported adequately |
| Other bias | Unclear risk | Insufficient information to permit judgement |
Teplan 2002.
| Study characteristics | ||
| Methods |
|
|
| Participants |
|
|
| Interventions |
Intervention group (diet group)
Control group
Co‐interventions
|
|
| Outcomes |
|
|
| Notes |
|
|
| Risk of bias | ||
| Bias | Authors' judgement | Support for judgement |
| Random sequence generation (selection bias) | Unclear risk | Insufficient information to permit judgement |
| Allocation concealment (selection bias) | Unclear risk | Insufficient information to permit judgement |
| Blinding of participants and personnel (performance bias) All outcomes | Unclear risk | Insufficient information to permit judgement |
| Blinding of outcome assessment (detection bias) All outcomes | Unclear risk | Insufficient information to permit judgement |
| Incomplete outcome data (attrition bias) All outcomes | Unclear risk | Insufficient information to permit judgement |
| Selective reporting (reporting bias) | Unclear risk | Insufficient information to permit judgement |
| Other bias | Unclear risk | Insufficient information to permit judgement |
Teplan 2006.
| Study characteristics | ||
| Methods |
|
|
| Participants |
|
|
| Interventions |
Intervention group (diet group + keto‐amino acid supplementation)
Control group (diet group + placebo)
Co‐interventions
|
|
| Outcomes |
|
|
| Notes |
* Number of reported males and females (111) does not agree with number randomised (131) |
|
| Risk of bias | ||
| Bias | Authors' judgement | Support for judgement |
| Random sequence generation (selection bias) | Low risk | Double blind RCT |
| Allocation concealment (selection bias) | Unclear risk | Insufficient information to permit judgement. Double blind RCT however no information on allocation concealment reported |
| Blinding of participants and personnel (performance bias) All outcomes | Low risk | Double blind RCT |
| Blinding of outcome assessment (detection bias) All outcomes | Unclear risk | Insufficient information to permit judgement. It was not reported if the outcome assessors were blind to group allocation |
| Incomplete outcome data (attrition bias) All outcomes | Unclear risk | Insufficient information to permit judgement ‐ no information on completion rates |
| Selective reporting (reporting bias) | Low risk | No study protocol however appear to report on all stated outcomes |
| Other bias | Unclear risk | Insufficient information to permit judgement |
Tomlinson 1975.
| Study characteristics | ||
| Methods |
|
|
| Participants |
|
|
| Interventions |
Trial 1
Trial 2
|
|
| Outcomes |
|
|
| Notes |
|
|
| Risk of bias | ||
| Bias | Authors' judgement | Support for judgement |
| Random sequence generation (selection bias) | Unclear risk | Insufficient information to permit judgement ‐ not reported how participants were randomised |
| Allocation concealment (selection bias) | Low risk | Allocation not revealed until un‐blinding |
| Blinding of participants and personnel (performance bias) All outcomes | Low risk | Placebo randomised controlled double blind trial |
| Blinding of outcome assessment (detection bias) All outcomes | Low risk | Blinded outcome assessors |
| Incomplete outcome data (attrition bias) All outcomes | High risk | Missing data not well reported, 22% attrition rate |
| Selective reporting (reporting bias) | Unclear risk | Insufficient information to permit judgement ‐ some outcome measures not well reported |
| Other bias | Low risk | Nil other potential sources of bias identified |
Tzvetanov 2015.
| Study characteristics | ||
| Methods |
|
|
| Participants |
|
|
| Interventions |
Intervention group
Comparator group
Co‐interventions
|
|
| Outcomes |
|
|
| Notes |
|
|
| Risk of bias | ||
| Bias | Authors' judgement | Support for judgement |
| Random sequence generation (selection bias) | Unclear risk | Insufficient information to permit judgement |
| Allocation concealment (selection bias) | Unclear risk | Insufficient information to permit judgement |
| Blinding of participants and personnel (performance bias) All outcomes | Unclear risk | Insufficient information to permit judgement |
| Blinding of outcome assessment (detection bias) All outcomes | Unclear risk | Insufficient information to permit judgement |
| Incomplete outcome data (attrition bias) All outcomes | Unclear risk | Insufficient information to permit judgement |
| Selective reporting (reporting bias) | Unclear risk | Insufficient information to permit judgement |
| Other bias | Unclear risk | Insufficient information to permit judgement |
Woolf 2017.
| Study characteristics | ||
| Methods |
|
|
| Participants |
|
|
| Interventions |
Intervention group
Control group
Co‐interventions
|
|
| Outcomes |
|
|
| Notes |
|
|
| Risk of bias | ||
| Bias | Authors' judgement | Support for judgement |
| Random sequence generation (selection bias) | Unclear risk | Insufficient information to permit judgement |
| Allocation concealment (selection bias) | Unclear risk | Insufficient information to permit judgement |
| Blinding of participants and personnel (performance bias) All outcomes | Unclear risk | Insufficient information to permit judgement |
| Blinding of outcome assessment (detection bias) All outcomes | Unclear risk | Insufficient information to permit judgement |
| Incomplete outcome data (attrition bias) All outcomes | Unclear risk | Insufficient information to permit judgement |
| Selective reporting (reporting bias) | Unclear risk | Insufficient information to permit judgement |
| Other bias | Unclear risk | Insufficient information to permit judgement |
ACEi ‐ angiotensin‐converting enzyme inhibitors; ACR ‐ albumin‐to‐creatinine ratio; ALT ‐ alanine aminotransferase; ARB ‐ angiotensin receptor blocker; AST ‐ aspartate aminotransferase; BMI ‐ body mass index; BP ‐ blood pressure; CKD ‐ chronic kidney disease; CrCl ‐ creatinine clearance; CVD ‐ cardiovascular disease; DBP ‐ diastolic blood pressure; (e)GFR ‐ (estimated) glomerular filtration rate; Hb ‐ haemoglobin; HbA1c ‐ haemoglobin A1c; HD ‐ haemodialysis; HDL ‐ high‐density lipoprotein; HRQoL ‐ health‐related quality of life; IGAN ‐ Ig A nephropathy; IQR ‐ interquartile range; LDL ‐ low‐density lipoprotein; NSAID ‐ nonsteroidal anti‐inflammatory drug; NYHA ‐ New York Heart Association; PCR ‐ protein:creatinine ratio; RCT ‐ randomised controlled trial; SBP ‐ systolic blood pressure; SCr ‐ serum creatinine
Characteristics of excluded studies [ordered by study ID]
| Study | Reason for exclusion |
|---|---|
| ACT 2017 | Wrong intervention: not weight loss Intervention |
| Aliasgharpour 2012 | Intervention duration too short (intervention delivered before and after dialysis sessions over a 2‐week period) |
| BEACON 2013 | Wrong intervention: not weight loss Intervention |
| BEAM 2011 | Wrong intervention: not weight loss Intervention |
| ESPECIAL 2014 | Wrong intervention: not weight loss Intervention |
| INTENT 2014 | Wrong intervention: not weight loss Intervention |
| Jasiak‐Panek 2019 | Wrong intervention: not weight loss Intervention |
| Kincaid‐Smith 2002 | Wrong intervention: not weight loss Intervention |
| Teplan 2000 | Wrong intervention: not weight loss Intervention |
| Teplan 2003b | Wrong intervention: not weight loss Intervention |
| Teplan 2004 | Wrong intervention: not weight loss Intervention |
| Teplan 2007 | Wrong intervention: not weight loss Intervention |
| Tzvetanov 2014 | Wrong intervention: not weight loss Intervention |
| Zingerman 2015 | Wrong intervention: not weight loss Intervention |
Characteristics of ongoing studies [ordered by study ID]
HHK 2018.
| Study name | Lifestyle management of CKD in obese diabetic patients: The Healthy Hearts and Kidneys (HHK) study |
| Methods | Design of a 2 x 2 factorial RCT of technology‐supported self‐monitoring and social cognitive theory‐based counselling to engage overweight people with diabetes and CKD in multiple lifestyle changes |
| Participants | Individuals with type 2 diabetes mellitus and evidence of CKD aged ≥ 40 years, who are overweight/obese BMI ≥ 27.0 kg/m² |
| Interventions | Participants will be randomised to 1 of 4 groups
|
| Outcomes | Primary outcomes
Secondary outcomes
Measurements will occur at baseline, 6 and 12 months |
| Starting date | October 2014 |
| Contact information | Mary Ann Sevick mary.sevick@nyumc.org |
| Notes | Clinical trials last updated on 14 July 2020. Recruitment completed |
Spaggiari 2020.
| Study name | Simultaneous robotic kidney transplantation and bariatric surgery for morbidly obese patients with end‐stage renal failure |
| Methods | Single centre, open label, prospective, RCT |
| Participants | Kidney transplant recipients, with a BMI ≥ 35 kg/m² |
| Interventions | Intervention group
Control group
|
| Outcomes |
|
| Starting date | Not reported |
| Contact information | Not reported |
| Notes | Abstract‐only publication |
BMI ‐ body mass index; BP ‐ blood pressure; CKD ‐ chronic kidney disease; GFR ‐ glomerular filtration rate; RCT ‐ randomised controlled trial
Differences between protocol and review
Measured GFR was included as an outcome measure.
Contributions of authors
Draft the protocol: MC, CM, KC, HM, DJ
Study selection: MC, CM
Extract data from studies: MC, HM, CM
Enter data into RevMan: MC, JK
Carry out the analysis: MC, JK,
Interpret the analysis: MC, JK, CM, KC, HM, DJ
Draft the final review: MC, JK, CM, KC, HM, DJ
Disagreement resolution: KC
Update the review: MC
Sources of support
Internal sources
Nil sources of support provided, Other
External sources
No sources of support supplied
Declarations of interest
Marguerite Conley: none known
Catherine McFarlane: none known
David Johnson: none known
Katrina Campbell: none known
Helen MacLaughlin: has received consultancy fees, lecturing fees and support for travel expenses from Abbott Nutrition, Nestle
Jaimon Kelly: none known
New
References
References to studies included in this review
Baria 2014 {published data only}
- Aoike DT, Baria F, Kamimura MA, Ammirati A, Cuppari L. Home-based versus center-based aerobic exercise on cardiopulmonary performance, physical function, quality of life and quality of sleep of overweight patients with chronic kidney disease. Clinical & Experimental Nephrology 2018;22(1):87-98. [MEDLINE: ] [DOI] [PubMed] [Google Scholar]
- Aoike DT, Baria F, Kamimura MA, Ammirati A, Mello MT, Cuppari L. Impact of home-based aerobic exercise on the physical capacity of overweight patients with chronic kidney disease. International Urology & Nephrology 2015;47(2):359-67. [MEDLINE: ] [DOI] [PubMed] [Google Scholar]
- Aoike DT, Baria F, Rocha ML, Kamimura MA. Home-based vs in center aerobic exercise: Impact on cardiorespiratory (CR) and functional capacities (FC) of nondialysis dependent overweight CKD patients [abstract]. Kidney Research & Clinical Practice 2012;31(2):A27. [EMBASE: 70814753] [Google Scholar]
- Baria F, Kamimura MA, Aoike DT, Ammirati A, Leister RM, Mello MT, et al. Randomized controlled trial to evaluate the impact of aerobic exercise on visceral fat in overweight chronic kidney disease patients. Nephrology Dialysis Transplantation 2014;29(4):857-64. [MEDLINE: ] [DOI] [PubMed] [Google Scholar]
- Gomes TS, Aoike DT, Baria F, Graciolli FG, Moyses RMA, Cuppari L. Effect of aerobic exercise on markers of bone metabolism of overweight and obese patients with chronic kidney disease. Journal of Renal Nutrition 2017;27(5):364-71. [MEDLINE: ] [DOI] [PubMed] [Google Scholar]
DIRECT 2013 {published data only}
- Shai I. The effect of low-carb, Mediterranean and low-fat diets on renal function: a 2-year dietary intervention randomized controlled trial (DIRECT) [abstract]. Obesity Facts 2012;5(Suppl 1):19. [CENTRAL: CN-00868666] [EMBASE: 70781690] [Google Scholar]
- Tirosh A, Golan R, Harman-Boehm I, Henkin Y, Schwarzfuchs D, Rudich A, et al. Renal function following three distinct weight loss dietary strategies during 2 years of a randomized controlled trial. Diabetes Care 2013;36(8):2225-32. [MEDLINE: ] [DOI] [PMC free article] [PubMed] [Google Scholar]
Ikizler 2018 {published data only}
- Alsouqi A, Taylor JM, Ellis CD, Bian A, Stewart TG, Robinson-Cohen C, et al. Effects of diet and exercise on adipocytokine levels in patients with moderate to severe CKD [abstract no: TH-PO444]. Journal of the American Society of Nephrology 2017;28(Abstract Suppl):214. [EMBASE: 633698382] [Google Scholar]
- Aydemir N, Pike MM, Alsouqi A, Headley SA, Tuttle K, Evans EE, et al. Effects of diet and exercise on adipocytokine levels in patients with moderate to severe chronic kidney disease. Nutrition Metabolism & Cardiovascular Diseases 2020;30(8):1375-81. [MEDLINE: ] [DOI] [PMC free article] [PubMed] [Google Scholar]
- Ikizler TA, Robinson-Cohen C, Ellis C, Headley SAE, Tuttle K, Wood RJ, et al. Metabolic effects of diet and exercise in patients with moderate to severe CKD: a randomized clinical trial. Journal of the American Society of Nephrology 2018;29(1):250-9. [MEDLINE: ] [DOI] [PMC free article] [PubMed] [Google Scholar]
- Pike MM, Alsouqi A, Headley SA, Tuttle K, Evans EE, Milch CM, et al. Supervised exercise intervention and overall activity in CKD. KI Reports 2020;5(8):1261-70. [MEDLINE: ] [DOI] [PMC free article] [PubMed] [Google Scholar]
- Taylor JM, Alsouqi A, Robinson-Cohen C, Ellis CD, Headley SA, Tuttle KR, et al. Supervised exercise intervention and overall physical activity in individuals with moderate to severe CKD [abstract no: TH-PO520]. Journal of the American Society of Nephrology 2017;28(Abstract Suppl):234. [EMBASE: 633697678] [Google Scholar]
Jesudason 2013 {published data only}
- Jesudason DR, Pedersen E, Clifton PM. Weight-loss diets in people with type 2 diabetes and renal disease: a randomized controlled trial of the effect of different dietary protein amounts. American Journal of Clinical Nutrition 2013;98(2):494-501. [MEDLINE: ] [DOI] [PubMed] [Google Scholar]
Kittiskulnam 2014 {published data only}
- Kittiskulnam P, Kanjanabuch T, Chancharoenthana W, Praditpornsilpa K, Eiam-ong S, Tungsanga K. The beneficial effects of body weight reduction in overweight patients with proteinuric immunoglobulin A nephropathy: a randomized controlled trial [abstract no: FR-PO787]. Journal of the American Society of Nephrology 2013;24(Abstracts):544A. [CENTRAL: CN-01657790] [DOI] [PubMed] [Google Scholar]
- Kittiskulnam P, Kanjanabuch T, Tangmanjitjaroen K, Chancharoenthana W, Praditpornsilpa K, Eiam-Ong S. The beneficial effects of weight reduction in overweight patients with chronic proteinuric immunoglobulin A nephropathy: a randomized controlled trial. Journal of Renal Nutrition 2014;24(3):200-7. [MEDLINE: ] [DOI] [PubMed] [Google Scholar]
LANDMARK 3 2013 {published data only}
- Beetham KS, Howden EJ, Isbel NM, Coombes JS. Agreement between cystatin-C and creatinine based eGFR estimates after a 12-month exercise intervention in patients with chronic kidney disease. BMC Nephrology 2018;19(1):366. [MEDLINE: ] [DOI] [PMC free article] [PubMed] [Google Scholar]
- Beetham KS, Howden EJ, Krishnasamy R, Isbel NM, Coombes JS. Effects of a 3-year lifestyle intervention on cardiorespiratory fitness and exercise capacity in patients with chronic kidney disease [abstract no: 017]. Nephrology 2015;30(Suppl 3):21. [EMBASE: 71995806] [Google Scholar]
- Beetham KS, Howden EJ, Krishnasamy R, Isbel NM, Coombes JS. Feasibility of higher intensity exercise in patients with chronic kidney disease. Journal of Sports Medicine & Physical Fitness 2018;58(1-2):127-34. [MEDLINE: ] [DOI] [PubMed] [Google Scholar]
- Fadaee SB, Beetham KS, Howden EJ, Stanton T, Isbel NM, Coombes JS. Oxidative stress is associated with decreased heart rate variability in patients with chronic kidney disease. Redox Report 2017;22(5):197-204. [MEDLINE: ] [DOI] [PMC free article] [PubMed] [Google Scholar]
- Howden EJ, Coombes J, Leano R, Isbel N, Marwick T. Effect of exercise and lifestyle intervention on LV and vascular function in patients with chronic kidney disease: a randomized controlled trial [abstract no: 3119]. European Heart Journal 2012;33(Suppl 1):515. [Google Scholar]
- Howden EJ, Coombes J, Petchey W, Isbel N. A one-year lifestyle intervention improves myocardial function and exercise capacity in patients with chronic kidney disease [abstract no: SA-OR376]. Journal of the American Society of Nephrology 2011;22(Abstracts):90A. [Google Scholar]
- Howden EJ, Coombes JS, Strand H, Douglas B, Campbell KL, Isbel NM. Exercise training in CKD: efficacy, adherence, and safety. American Journal of Kidney Diseases 2015;65(4):583-91. [MEDLINE: 25458662] [DOI] [PubMed] [Google Scholar]
- Howden EJ, Leano R, Petchey W, Coombes JS, Isbel NM, Marwick TH. Effects of exercise and lifestyle intervention on cardiovascular function in CKD. Clinical Journal of the American Society of Nephrology: CJASN 2013;8(9):1494-501. [MEDLINE: ] [DOI] [PMC free article] [PubMed] [Google Scholar]
- Howden EJ, Leano R, Petchey W, Isbel NM, Coombes JS, Marwick TH. A one-year lifestyle intervention improves myocardial function and exercise capacity in patients with chronic kidney disease [abstract no: 062]. Nephrology 2011;16(Suppl 1):39-40. [EMBASE: 70532410] [Google Scholar]
- Small DM, Beetham KS, Howden EJ, Briskey DR, Johnson DW, Isbel NM, et al. Effects of exercise and lifestyle intervention on oxidative stress in chronic kidney disease. Redox Report 2017;22(3):127-36. [MEDLINE: ] [DOI] [PMC free article] [PubMed] [Google Scholar]
- Small DM, Beetham KS, Howden EJ, Brisky DR, Johnson DW, Isbel NM, et al. Effect of exercise and lifestyle intervention on oxidative stress in chronic kidney disease [abstract no: 049]. Nephrology 2015;30(Suppl 3):30-1. [EMBASE: 71995838] [DOI] [PMC free article] [PubMed] [Google Scholar]
Leehey 2009 {published data only}
- Bast J, Qureshi S, Moinuddin I, Collins E, Jelinek C, Cooper C, et al. A randomized controlled trial of aerobic exercise in obese diabetic patients with chronic kidney disease [abstract no: PUB652]. Journal of the American Society of Nephrology 2008;19(Abstracts Issue):960A. [CENTRAL: CN-00740547] [Google Scholar]
- Leehey D, Moinuddin I, Bast J, Qureshi S, Jelinek C, Cooper C, et al. Aerobic exercise in obese diabetic patients with chronic kidney disease: a randomized and controlled pilot study. Cardiovascular Diabetology 2009;8:62. [MEDLINE: ] [DOI] [PMC free article] [PubMed] [Google Scholar]
- Leehey DJ, Moinuddin I, Bast JP, Qureshi S, Jelinek CS, Cooper C, et al. Aerobic exercise in obese diabetic patients with chronic kidney disease: a randomized, controlled feasibility study [abstract no: F-PO1328]. Journal of the American Society of Nephrology 2009;20(Abstract Suppl):417A. [Google Scholar]
Leehey 2016 {published data only}
- Kanneganti VK, Collins E, Butler J, O'Connell S, Jelinek C, McBurney C, et al. Impaired physical fitness in obese diabetic patients with chronic kidney disease [abstract no: SA-PO368]. Journal of the American Society of Nephrology 2013;24(Abstract Suppl):710A. [Google Scholar]
- Leehey DJ, Collins E, Kramer HJ, Cooper C, Butler J, McBurney C, et al. Structured exercise in obese diabetic patients with chronic kidney disease: a randomized controlled trial. American Journal of Nephrology 2016;44(1):54-62. [MEDLINE: ] [DOI] [PubMed] [Google Scholar]
- Leehey DJ, Collins E, Kramer HJ, Cooper C, Butler J, McBurney C, et al. Structured exercise in obese diabetic patients with chronic kidney disease: a randomized controlled trial (NCT01036490) [abstract no: 194]. American Journal of Kidney Diseases 2016;67(5):A67. [EMBASE: 72313497] [DOI] [PubMed] [Google Scholar]
- Leehey DJ, Collins E, Kramer HJ, Cooper C, Butler J, McBurney C, et al. Structured exercise in obese diabetic patients with chronic kidney disease: a randomized controlled trial (NCT01036490) [abstract no: FR-PO771]. Journal of the American Society of Nephrology 2014;25(Abstract Suppl):545A. [DOI] [PubMed] [Google Scholar]
- Leehey DJ, Collins E, Kramer HJ, Cooper C, Butler J, McBurney C, et al. Structured exercise in obese diabetic patients with chronic kidney disease: a randomized controlled trial (NCT01036490) [abstract no: TH-PO675]. Journal of the American Society of Nephrology 2015;26(Abstract Suppl):244A. [DOI] [PubMed] [Google Scholar]
- Leehey DJ, Collins E, Kramer HJ, Cooper C, Butler J, McBurney C, et al. Structured exercise in obese diabetic patients with chronic kidney disease: a randomized controlled trial [abstract no: FR-PO830]. Journal of the American Society of Nephrology 2016;27(Abstract Suppl):558A. [DOI] [PubMed] [Google Scholar]
MacLaughlin 2014 {published data only}
- Maclaughin HL, Hall WL, Patel AG, Blacklock RM, Phanish M, Swift P, et al. Kidney function, adipokines, and quality of life after weight loss surgery in obese patients with stages 3-4 CKD: a randomised controlled pilot study [abstract no: O16]. In: UK Kidney Week; 2014 Apr 29-2 May; Glasgow, UK. 2014. [DOI] [PubMed]
- Maclaughlin HL, Hall WL, Patel AG, Blacklock RM, Macdougall IC. Kidney function, adipokines, and quality of life after weight loss surgery in obese patients with stages 3-4 chronic kidney disease: a randomized controlled pilot study [abstract no: FR-PO785]. Journal of the American Society of Nephrology 2013;24(Abstract Suppl):543A. [DOI] [PubMed] [Google Scholar]
- MacLaughlin HL, Hall WL, Patel AG, Blacklock RM, Swift PA, Phanish MK, et al. Weight loss, adipokines, and quality of life after sleeve gastrectomy in obese patients with stages 3-4 CKD: a randomized controlled pilot study. American Journal of Kidney Diseases 2014;64(4):660-3. [MEDLINE: ] [DOI] [PubMed] [Google Scholar]
Morales 2003a {published data only}
- Morales E, Valero M, Leon M, Diaz O, Lopez-Pardo C, Vargas C, et al. Anitproteinuric effect of weight loss in obese patients with chronic proteinuric nephropathies [abstract]. Journal of the American Society of Nephrology 2001;12(Program & Abstracts):231A. [CENTRAL: CN-00446824] [Google Scholar]
- Morales E, Valero MA, Hernandez E, Leon M, Praga M. Antiproteinuric effect of weight loss in obese patients with chronic proteinuric nephropathies [abstract no: M243]. Nephrology Dialysis Transplantation 2002;17(Abstracts Suppl 1):117. [CENTRAL: CN-00550621] [Google Scholar]
- Morales E, Valero MA, Leon M, Hernandez E, Praga M. Beneficial effects of weight loss in overweight patients with chronic proteinuric nephropathies. American Journal of Kidney Diseases 2003;41(2):319-27. [MEDLINE: ] [DOI] [PubMed] [Google Scholar]
Orazio 2011 {published data only}
- Orazio LK, Isbel NM, Armstrong KA, Tarnarskyj J, Johnson DW, Hale RE, et al. Evaluation of dietetic advice for modification of cardiovascular disease risk factors in renal transplant recipients. Journal of Renal Nutrition 2011;21(6):462-71. [MEDLINE: ] [DOI] [PubMed] [Google Scholar]
Praga 1995 {published data only}
- Praga M, Hernandez E, Andres A, Leon M, Ruilope LM, Rodicio JL. Effects of body-weight loss and captopril treatment on proteinuria associated with obesity. Nephron 1995;70(1):35-41. [MEDLINE: ] [DOI] [PubMed] [Google Scholar]
Teplan 2002 {published data only}
- Teplan V, Schuck O, Poledne R, Vitko S. Effective treatment of obesity reduces the risk after renal transplantation [abstract no: O134]. Nephrology Dialysis Transplantation 2002;17(Suppl 1):40. [CENTRAL: CN-00509504] [Google Scholar]
Teplan 2006 {published data only}
- Teplan V, Mareckova O, Vyhnankova I, Valkovsky I, Lopatnik M, Racek J, et al. Asymmetric dimethylarginine and pentosidin in patients with chronic kidney disease and obesity: a randomized controlled trial. Aktuality v Nefrologii 2008;14(4):185-90. [CENTRAL: CN-00791071] [Google Scholar]
- Teplan V, Racek J, Siroka R, Stollova M, Hanzal V, C Keto Group. Asymmetric dimethylarginine (ADMA) in chronic renal failure patients with obesity: Czech multicenter study [abstract no: S-PO-0424]. In: 4th World Congress of Nephrology.19th International Congress of the International Society of Nephrology (ISN); 2007 Apr 21-25; Rio de Janeiro, Brazil. 2007:163.
- Teplan V, Schuck O, Hanzal V, Hajny J, Horackova M, Ryba M, et al. Obesity and progression of chronic renal insufficiency: a Czech long term prospective double-blind randomised multicentre study [Obezita a progrese chronicke renalni insuficience: ceska dlouhodoba prospektivni randomizovana dvojite slepa multicentricka studie]. Vnitrni Lekarstvi 2006;52(6):571-6. [MEDLINE: ] [PubMed] [Google Scholar]
- Teplan V, Schuck O, Racek J, Mareckova O, Stollova M, Hanzal V, et al. Reduction of plasma asymmetric dimethylarginine in obese patients with chronic kidney disease after three years of a low-protein diet supplemented with keto-amino acids: a randomized controlled trial. Wiener Klinische Wochenschrift 2008;120(15-16):478-85. [MEDLINE: ] [DOI] [PubMed] [Google Scholar]
Tomlinson 1975 {published data only}
- Tomlinson SA, Lines JG, Greenfield MA. The effect of fenfluramine on obesity and plasma lipids of patients with renal allografts. Postgraduate Medical Journal 1975;51 Suppl 1:166-70. [MEDLINE: ] [PMC free article] [PubMed] [Google Scholar]
Tzvetanov 2015 {published data only}
- Tzvetanov I, D'Amico G, Georgiev G, Jeon H, Garcia-Roca R, Benedetti E, et al. Combined robotic kidney transplantation and sleeve gastrectomy in obese recipients: Initial results from prospective randomized study [abstract]. American Journal of Transplantation 2015;15(Suppl 3). [EMBASE: 71953189] [Google Scholar]
Woolf 2017 {published data only}
- Woolf K, Ganguzza L, Pompeii ML, Hu L, St-Jules DE, Jagannathan R, et al. Weight loss and self-efficacy in obese/overweight patients with type 2 diabetes and chronic kidney disease in a lifestyle intervention pilot study [abstract]. FASEB journal 2017;31(1 Suppl 1). [EMBASE: 616960059] [Google Scholar]
References to studies excluded from this review
ACT 2017 {published data only}
- Corpeleijn E, Klaassen G, Zelle DM, Dijkema D, Van Vliet I, Bemelman FJ, et al. Lifestyle intervention in renal transplant recipients: A multicenter, randomized clinical trial [abstract]. American Journal of Transplantation 2019;19(Suppl 3):365. [EMBASE: 628454289] [Google Scholar]
- Klaassen G, Zelle DM, Navis GJ, Dijkema D, Bemelman FJ, Bakker SJ, et al. Lifestyle intervention to improve quality of life and prevent weight gain after renal transplantation: Design of the Active Care after Transplantation ACT randomized controlled. BMC Nephrology 2017;18(1):296. [MEDLINE: ] [DOI] [PMC free article] [PubMed] [Google Scholar]
- Zelle D, Corpeleijn E, Klaassen G, Navis G, Bakker S. The effect of lifestyle management on obesity and metabolic risk after kidney transplantation: a pragmatic randomised controlled trial [abstract no: P224]. In: British Transplantation Society & Nederlandse Transplantatie Vereniging Joint Congress; 2015 Mar 11-13; Bournemouth, UK. 2015.
Aliasgharpour 2012 {published data only}
- Aliasgharpour M, Shomali M, Moghaddam MZ, Faghihzadeh S. Effect of a self-efficacy promotion training programme on the body weight changes in patients undergoing haemodialysis. Journal of Renal Care 2012;38(3):155-61. [MEDLINE: ] [DOI] [PubMed] [Google Scholar]
BEACON 2013 {published data only}
- Chertow GM, Akizawa T, Audhya P, Bakris GL, Chin M, Christ-Schmidt H, et al. The effect of bardoxolone methyl in patients with type 2 diabetes mellitus and stage 4 chronic kidney disease [abstract no: HI-OR02]. Journal of the American Society of Nephrology 2013;24(Abstract Suppl):1059A. [Google Scholar]
- Chertow GM, Appel GB, Block GA, Chin MP, Coyne DW, Goldsberry A, et al. Effects of bardoxolone methyl on body weight, waist circumference and glycemic control in obese patients with type 2 diabetes mellitus and stage 4 chronic kidney disease. Journal of Diabetes & Its Complications 2018;32(12):1113-7. [MEDLINE: ] [DOI] [PubMed] [Google Scholar]
- Chin MP, Bakris GL, Block GA, Chertow GM, Goldsberry A, Inker LA, et al. Bardoxolone methyl improves kidney function in patients with chronic kidney disease stage 4 and type 2 diabetes: post-hoc analyses from bardoxolone methyl evaluation in patients with chronic kidney disease and type 2 diabetes study. American Journal of Nephrology 2018;47(1):40-7. [MEDLINE: ] [DOI] [PMC free article] [PubMed] [Google Scholar]
- Chin MP, Reisman SA, Bakris GL, O'Grady M, Linde PG, McCullough PA, et al. Mechanisms contributing to adverse cardiovascular events in patients with type 2 diabetes mellitus and stage 4 chronic kidney disease treated with bardoxolone methyl. American Journal of Nephrology 2014;39(6):499-508. [MEDLINE: ] [DOI] [PubMed] [Google Scholar]
- Chin MP, Wrolstad D, Bakris GL, Chertow GM, Zeeuw D, Goldsberry A, et al. Risk factors for heart failure in patients with type 2 diabetes mellitus and stage 4 chronic kidney disease treated with bardoxolone methyl. Journal of Cardiac Failure 2014;20(12):953-8. [MEDLINE: ] [DOI] [PubMed] [Google Scholar]
- Zeeuw D, Akizawa T, Agarwal R, Audhya P, Bakris GL, Chin M, et al. Rationale and trial design of bardoxolone methyl evaluation in patients with chronic kidney disease and type 2 diabetes: the occurrence of renal events (BEACON). American Journal of Nephrology 2013;37(3):212-22. [MEDLINE: ] [DOI] [PubMed] [Google Scholar]
- Zeeuw D, Akizawa T, Audhya P, Bakris GL, Chin M, Christ-Schmidt H, et al. Bardoxolone methyl in type 2 diabetes and stage 4 chronic kidney disease. New England Journal of Medicine 2013;369(26):2492-503. [MEDLINE: ] [DOI] [PMC free article] [PubMed] [Google Scholar]
- Klein C, Noertersheuser P, Mensing S, Teuscher N, Meyer C, Dumas E, et al. Exposure-response analyses of bardoxolone methyl safety and efficacy and clinical trial simulations to inform phase III dose selection [abstract]. Nephrology Dialysis Transplantation 2012;27(Suppl 2):ii403. [EMBASE: 70766487] [Google Scholar]
- Lambers Heerspink HJ, Chertow GM, Akizawa T, Audhya P, Bakris GL, Goldsberry A, et al. Baseline characteristics in the Bardoxolone methyl EvAluation in patients with Chronic kidney disease and type 2 diabetes mellitus: the Occurrence of renal eveNts (BEACON) trial. Nephrology Dialysis Transplantation 2013;28(11):2841-50. [MEDLINE: ] [DOI] [PubMed] [Google Scholar]
- Rizk DV, Silva AL, Pergola PE, Toto R, Warnock DG, Chin MP, et al. Effects of bardoxolone methyl on magnesium in patients with type 2 diabetes mellitus and chronic kidney disease. Cardiorenal Medicine 2019;9(5):316-25. [MEDLINE: ] [DOI] [PMC free article] [PubMed] [Google Scholar]
- Rossing P, Appel G, Block G, Chertow G, Chin M, Coyne D, et al. Decreases in weight with bardoxolone methyl in obese patients with chronic kidney disease stage 4 and type 2 diabetes-Post-hoc analyses from BEACON [abstract]. Nephrology Dialysis Transplantation 2018;33(Suppl 1):i379. [EMBASE: 622605387] [Google Scholar]
- Rossing P, Block G, Chertow G, Chin M, Goldsberry A, McCullough P, et al. Effect of bardoxolone methyl treatment on urinary albumin in patients with type 2 diabetes and chronic kidney disease-post-hoc analysis from BEAM and BEACON [abstract]. Nephrology Dialysis Transplantation 2018;33(Suppl 1):i27. [EMBASE: 622605449] [Google Scholar]
- Rossing P, Block GA, Chin MP, Goldsberry A, Heerspink HJ, McCullough PA, et al. Effect of bardoxolone methyl on the urine albumin-to-creatinine ratio in patients with type 2 diabetes and stage 4 chronic kidney disease. Kidney International 2019;96(4):1030-6. [MEDLINE: ] [DOI] [PubMed] [Google Scholar]
- Wanner C, Bakris G, Block G, Chin M, Goldsberry A, Inker L, et al. Bardoxolone methyl prevents eGFR decline in patients with chronic kidney disease stage 4 and type 2 diabetes-post-hoc analyses from BEACON [abstract]. Nephrology Dialysis Transplantation 2018;33(Suppl 1):i10. [EMBASE: 622605571] [DOI] [PMC free article] [PubMed] [Google Scholar]
BEAM 2011 {published data only}
- Chin M, Goldsberry A, Hebbar S, Meyer C, Audhya P, Toto R, et al. Bardoxolone methyl acutely reduces serum magnesium in stage 3B and 4 CKD patients with type 2 diabetes without any adverse effect on QT interval [abstract]. Nephrology Dialysis Transplantation 2012;27(Suppl 2):ii12. [EMBASE: 70766563] [Google Scholar]
- Pergola P, Chin M, Goldsberry A, Hebbar S, Meyer C, Audhya P. Weight loss in obese, stage 3B and 4 CKD patients with type 2 diabetes given bardoxolone methyl [abstract]. Nephrology Dialysis Transplantation 2012;27(Suppl 2):ii12. [EMBASE: 70766564] [Google Scholar]
- Pergola PE, Raskin P, Toto RD, Meyer CJ, Huff JW, Grossman EB, et al. Bardoxolone methyl and kidney function in CKD with type 2 diabetes. New England Journal of Medicine 2011;365(4):327-36. [MEDLINE: ] [DOI] [PubMed] [Google Scholar]
- Rossing P, Block G, Chertow G, Chin M, Goldsberry A, McCullough P, et al. Effect of bardoxolone methyl treatment on urinary albumin in patients with type 2 diabetes and chronic kidney disease-post-hoc analysis from BEAM and BEACON [abstract]. Nephrology Dialysis Transplantation 2018;33(Suppl 1):i27. [EMBASE: 622605449] [Google Scholar]
- Rossing P, Chin M, Deen WM, Hebbar S, Potts S, Audhya P, et al. Bardoxolone methyl and albuminuria in type 2 diabetes patients with CKD [abstract no: SA-PO107]. Journal of the American Society of Nephrology 2012;23(Abstract Suppl):660A. [Google Scholar]
ESPECIAL 2014 {published data only}
- Ahn SY, Kim DK, Han SS, Park JH, Choi B, Lim CS, et al. Weight loss has an additive effect on the anti-proteinuric effects of angiotensin II receptor blockers in hypertensive patients with CKD [abstract no: FR-PO502]. Journal of the American Society of Nephrology 2017;28(Abstract Suppl):531. [EMBASE: 633703439] [Google Scholar]
- Ahn SY, Kim DK, Han SS, Park JH, Shin SJ, Lee SH, et al. Weight loss has an additive effect on the proteinuria reduction of angiotensin II receptor blockers in hypertensive patients with chronic kidney disease. Kidney Research & Clinical Practice 2018;37(1):49-58. [MEDLINE: ] [DOI] [PMC free article] [PubMed] [Google Scholar]
- Ahn SY, Kim DK, Park JH, Shin SJ, Lee SH, Choi BS, et al. Long-term effects of intensive low-salt diet education on deterioration of glomerular filtration rate among non-diabetic hypertensive patients with chronic kidney disease. Kidney & Blood Pressure Research 2019;44(5):1101-14. [MEDLINE: ] [DOI] [PubMed] [Google Scholar]
- An JN, Hwang JH, Lee JP, Chin HJ, Kim S, Kim DK, et al. The decrement of hemoglobin concentration with angiotensin II receptor blocker treatment Is correlated with the reduction of albuminuria in non-diabetic hypertensive patients: post-hoc analysis of ESPECIAL trial. PLoS ONE [Electronic Resource] 2015;10(6):e0128632. [MEDLINE: ] [DOI] [PMC free article] [PubMed] [Google Scholar]
- Baek SH, Kim S, Kim DK, Park JH, Shin SJ, Lee SH, et al. A low-salt diet increases the estimated net endogenous acid production in nondiabetic chronic kidney disease patients treated with angiotensin receptor blockade. Nephron 2014;128(3-4):407-13. [MEDLINE: ] [DOI] [PubMed] [Google Scholar]
- Chin HJ, Lim CS. Weight reduction has an additive effect on the anti-albuminuric effect of angiotensin II hypertensive patients with chronic kidney disease [abstract no: TH-PO556]. Journal of the American Society of Nephrology 2015;26(Abstract Suppl):214A. [Google Scholar]
- Chin HJ, Lim CS. Weight reduction has an additive effect on the anti-albuminuric effect of angiotensin II type I receptor blocker in hypertensive patients with chronic kidney disease [abstract]. Nephrology Dialysis Transplantation 2016;31(Suppl 1):i204. [EMBASE: 72326445] [Google Scholar]
- Han SS, Bae E, Ahn SY, Kim S, Park JH, Shin SJ, et al. Urinary adiponectin and albuminuria in non-diabetic hypertensive patients: an analysis of the ESPECIAL trial. BMC Nephrology 2015;16:123. [MEDLINE: ] [DOI] [PMC free article] [PubMed] [Google Scholar]
- Hwang JH, Chin HJ, Kim S, Kim DK, Kim S, Park JH, et al. Effects of intensive low-salt diet education on albuminuria among nondiabetic patients with hypertension treated with olmesartan: a single-blinded randomized, controlled trial. Clinical Journal of the American Society of Nephrology: CJASN 2014;9(12):2059-69. [MEDLINE: ] [DOI] [PMC free article] [PubMed] [Google Scholar]
- Lee A, Chin HJ. Long term effects of intensive low salt diet education on deterioration of glomerular filtration among non-diabetic hypertensive patients with CKD [abstract no: FR-PO389]. Journal of the American Society of Nephrology 2017;28(Abstract Suppl):501. [Google Scholar]
- Lim CS, Hwang JH, Chin HJ, Kim DK, Kim S, Park JH, et al. Effects of low sodium intake on the antiproteinuric efficacy of olmesartan in hypertensive patients with albuminuria (ESPECIAL): a randomized clinical trial [abstract no: 168]. Nephrology Dialysis Transplantation 2014;29(Suppl 3):iii376. [EMBASE: 71492549] [Google Scholar]
- Lim CS, Hwang JH, Chin HJ, Kim S, Choi BS. Effects of low sodium intake on the anti-proteinuric efficacy of olmesartan in hypertensive patients with albuminuria [abstract no: SA-PO155]. Journal of the American Society of Nephrology 2013;24(Abstract Suppl):659A. [Google Scholar]
- Yu MY, Kim DK, Park JH, Shin SJ, Lee SH, Choi BS, et al. Albuminuria during treatment with angiotensin type II receptor blocker is a predictor for GFR decline among non-diabetic hypertensive CKD patients. PLoS ONE [Electronic Resource] 2018;13(8):e0202676. [MEDLINE: ] [DOI] [PMC free article] [PubMed] [Google Scholar]
INTENT 2014 {published data only}
- Henggeler CK, Plank LD, Ryan KJ, Gilchrist EL, Casas JM, Lloyd LE, et al. A randomized controlled trial of an intensive nutrition intervention versus standard nutrition care to avoid excess weight gain after kidney transplantation: The INTENT trial. Journal of Renal Nutrition 2018;28(5):340-51. [MEDLINE: ] [DOI] [PubMed] [Google Scholar]
- Ryan KJ, Casas JM, Mash LE, McLellan SL, Lloyd LE, Stinear JW, et al. The effect of intensive nutrition interventions on weight gain after kidney transplantation: protocol of a randomised controlled trial. BMC Nephrology 2014;15:148. [MEDLINE: ] [DOI] [PMC free article] [PubMed] [Google Scholar]
Jasiak‐Panek 2019 {published data only}
- Jasiak-Panek N, Thielke J, Progar K, Chen J, Adams C, Benedetti E, et al. An analysis of tacrolimus XL dosing in obese kidney transplant recipients [abstract]. American Journal of Transplantation 2017;17(Suppl 3):739. [EMBASE: 615705137] [Google Scholar]
- Jasiak-Panek NM, Wenzler E, Patel S, Thielke JJ, Progar K, Patel S, et al. A randomized, open-label pharmacokinetic trial of tacrolimus extended-release dosing in obese de novo kidney transplant recipients. Clinical Transplantation 2019;33(8):e13640. [MEDLINE: ] [DOI] [PubMed] [Google Scholar]
Kincaid‐Smith 2002 {published data only}
- Kincaid-Smith P, Fairley K, Packham D. Comparison of the effect of 50% increase in angiotensin converting enzyme inhibitor (ACEI) with a combination of candesartan and ACEI on proteinuria and blood pressure in chronic renal disease [abstract no: A0392]. Journal of the American Society of Nephrology 2001;12(Program & Abstracts):75A. [CENTRAL: CN-00446096] [Google Scholar]
- Kincaid-Smith P, Fairley K, Packham D. Comparison of the effect of 50% increase in angiotensin converting enzyme inhibitor (ACEI) with a combination of candesartan and ACEI on proteinuria and blood pressure in chronic renal disease [abstract no: P99]. Nephrology 2002;7(1):A25. [CENTRAL: CN-00792336] [Google Scholar]
- Kincaid-Smith P, Fairley K, Packham D. Randomized controlled crossover study of the effect on proteinuria and blood pressure of adding an angiotensin II receptor antagonist to an angiotensin converting enzyme inhibitor in normotensive patients with chronic renal disease and proteinuria. Nephrology Dialysis Transplantation 2002;17(4):597-601. [MEDLINE: ] [DOI] [PubMed] [Google Scholar]
- Kincaid-Smith P, Fairley K. A fall in urine protein with combined angiotensin converting enzyme inhibitor (ACEI) and AII receptor antagonist (AIIRA) treatment predicts a good outcome at three years in patients with chronic renal disease with continuing reduction in urine protein levels. Diabetic and obese patients with a poor response to combined ACEI and AIIRA treatment have a poor outcome [abstract no: M419]. Nephrology Dialysis Transplantation 2003;18(Suppl 4):131. [CENTRAL: CN-00446094] [Google Scholar]
- Kincaid-Smith PS, Fairley KF, Packham D. Randomised controlled crossover study of the effect on proteinuria of adding an agiotensin 11-receptor antagonist (ARA) to an angiotensin converting enzyme inhibitor (ACEI) [abstract]. Journal of the American Society of Nephrology 2000;11(Sept):349A. [CENTRAL: CN-00626048] [Google Scholar]
- Kincaid-Smith PS, Fairley KF. A fall in urine protein with combined angiotensin converting enzyme inhibitor (ACEI) and AII receptor antagonist (AIIRA) treatment predicts a good outcome at three years in patients with chronic renal disease (mean serum creatinine level of 0.18 mmols/litre mean urinary protein level of 2.3 grams/24 hours). Diabetic and obese patients with poor response to combined ACEI and AIIRA treatment have a poor outcome [abstract no: PUB059]. Journal of the American Society of Nephrology 2003;14(Nov):786A. [Google Scholar]
Teplan 2000 {published data only}
- Teplan V, Poledne R, Schuck O, Ritz E, Vitko S. Hyperlipidemia and obesity after renal transplantation. Annals of Transplantation 2001;6(2):21-3. [MEDLINE: ] [PubMed] [Google Scholar]
- Teplan V, Schuck O, Poledne R, Stollova M, Skibova J, Vitko S. Obesity is a high-risk factor after renal transplantation [abstract]. Nephrology Dialysis Transplantation 2000;15(9):A259. [CENTRAL: CN-00461848] [Google Scholar]
- Teplan V, Schuck O, Poledne R, Vitko S, Stollova M. Hyperlipidemia following renal transplantation: the effects of obesity, age and sex [abstract no: 11]. Kidney & Blood Pressure Research 2000;24(2):133-4. [CENTRAL: CN-00509505] [Google Scholar]
Teplan 2003b {published data only}
- Teplan V, Schuck O, Hyanek J, Poledne R, Vitko S. Effective treatment of hyperhomocysteinemia and obesity reduces the risk after renal transplantation [abstract no: T711]. Nephrology Dialysis Transplantation 2003;18(Suppl 4):509. [CENTRAL: CN-00447972] [Google Scholar]
Teplan 2004 {published data only}
- Teplan V, Schuck O, Sebekova K, Poledne R, Vitko S. Obesity may influence renal function after transplantation: 60 months follow-up [abstract]. In: 41st Congress. European Renal Association. European Dialysis and Transplantation Association; 2004 May 15-18; Lisbon, Portugal. 2004:202. [CENTRAL: CN-00509506]
Teplan 2007 {published data only}
- Teplan V, Mareckova O, Racek J, Haluzik M, Kudla M, Stollova M, et al. Pentosidine and cardiovascular disease in obese renal transplant patients [abstract no: SA-PO422]. Journal of the American Society of Nephrology 2007;18(Abstracts):433A. [CENTRAL: CN-00740449] [Google Scholar]
Tzvetanov 2014 {published data only}
- Tzvetanov I, D'Amico G, West-Thielke P, Johnsen M, Hahaj G, Heller R, et al. An innovative rehabilitation program for obese kidney transplant recipients: impact of return to work rates [abstract no: D2729]. Transplantation 2014;98(Suppl 1):843. [EMBASE: 71546415] [DOI] [PubMed] [Google Scholar]
- Tzvetanov I, West-Thielke P, D'Amico G, Johnsen M, Ladik A, Hachaj G, et al. A novel and personalized rehabilitation program for obese kidney transplant recipients. Transplantation Proceedings 2014;46(10):3431-7. [MEDLINE: ] [DOI] [PubMed] [Google Scholar]
Zingerman 2015 {published data only}
- Zingerman B, Erman A, Itach SBS, Ori Y, Herman-Edelstein M, Gafter U, et al. Acetazolamide reduces glomerular hyperfiltration and renal plasma flow in obese subjects: a randomized controlled trial [abstract no: FR-PO1038]. Journal of the American Society of Nephrology 2012;23(Abstract Suppl):607A. [Google Scholar]
- Zingerman B, Herman-Edelstein M, Erman A, Bar S, Ori Y, Rozen-Zvi B, et al. Effect of acetazolamide on obesity-induced glomerular hyperfiltration: a randomized controlled trial. PLoS ONE [Electronic Resource] 2015;10(9):e0137163. [MEDLINE: ] [DOI] [PMC free article] [PubMed] [Google Scholar]
References to ongoing studies
HHK 2018 {published data only}
- Sevick MA, Woolf K, Mattoo A, Katz SD, Li H, St-Jules DE, et al. The Healthy Hearts and Kidneys (HHK) study: Design of a 2x2 RCT of technology-supported self-monitoring and social cognitive theory-based counseling to engage overweight people with diabetes and chronic kidney disease in multiple lifestyle changes. Contemporary Clinical Trials 2018;64:265-73. [MEDLINE: ] [DOI] [PMC free article] [PubMed] [Google Scholar]
Spaggiari 2020 {published data only}
- Spaggiari M, Di Cocco P, Tulla K, Kaylan KB, Masrur MA, Hassan C, et al. Simultaneous robotic kidney transplantation and bariatric surgery for morbidly obese patients with end-stage renal failure. American Journal of Transplantation 2020 Sep 25 [epub ahead of print]. [MEDLINE: ] [DOI] [PubMed] [Google Scholar]
- West-Thielke P, Tulla KA, Okoye OT, Almario Alvarez JA, Spaggiari M, Tzvetanov IG, et al. Simultaneous robotic kidney transplantation and bariatric surgery for morbidly obese patients with end-stage renal failure [abstract]. American Journal of Transplantation 2019;19:331-2. [EMBASE: 628454944] [DOI] [PubMed] [Google Scholar]
Additional references
Afshin 2017
- GBD 2015 Obesity Collaborators, Afshin A, Forouzanfar MH, Reitsma MB, Sur P, Estep K, et al. Health effects of overweight and obesity in 195 countries over 25 years. New England Journal of Medicine 2017;377(1):13-27. [MEDLINE: ] [DOI] [PMC free article] [PubMed] [Google Scholar]
Afshinnia 2010
- Afshinnia F, Wilt TJ, Duval S, Esmaeili A, Ibrahim HN. Weight loss and proteinuria: systematic review of clinical trials and comparative cohorts. Nephrology Dialysis Transplantation 2010;25(4):1173-83. [MEDLINE: ] [DOI] [PubMed] [Google Scholar]
Ash 2006
- Ash S, Campbell K, MacLaughlin H, McCoy E, Chan M, Anderson K, et al. Evidence based practice guidelines for the nutritional management of chronic kidney disease. Nutrition & Dietetics 2006;63(s2):S35-45. [DOI: 10.1111/j.1747-0080.2006.00100.x] [DOI] [Google Scholar]
Bolignano 2013
- Bolignano D, Zoccali C. Effects of weight loss on renal function in obese CKD patients: a systematic review. Nephrology Dialysis Transplantation 2013;28 Suppl 4:iv82-98. [MEDLINE: ] [DOI] [PubMed] [Google Scholar]
Chang 2017
- Chang AR, Grams ME, Navaneethan SD. Bariatric surgery and kidney related outcomes. KI Reports 2017;2(2):261-70. [MEDLINE: ] [DOI] [PMC free article] [PubMed] [Google Scholar]
Colquitt 2014
- Colquitt JL, Pickett K, Loveman E, Frampton GK. Surgery for weight loss in adults. Cochrane Database of Systematic Reviews 2014, Issue 8. Art. No: CD003641. [DOI: 10.1002/14651858.CD003641.pub4] [DOI] [PMC free article] [PubMed] [Google Scholar]
Darouich 2011
- Darouich S, Goucha R, Jaafoura MH, Zekri S, Ben Maiz H, Kheder A. Clinicopathological characteristics of obesity-associated focal segmental glomerulosclerosis. Ultrastructural Pathology 2011;35(4):176-82. [MEDLINE: ] [DOI] [PubMed] [Google Scholar]
GBD 2016
- Institute for Health Metrics and Evaluation. Global Burden of Disease Study 2016. Results. ghdx.healthdata.org/gbd-2016 (accessed 17 February 2021).
GBD 2017
- GBD 2016 Risk Factor Collaborators. Global, regional, and national comparative risk assessment of 84 behavioural, environmental and occupational, and metabolic risks or clusters of risks, 1990-2016: a systematic analysis for the Global Burden of Disease Study 2016 [Erratum in: Lancet. 2017 Oct 14;390(10104):1736; PMID: 28935160; Erratum in: Lancet. 2017 Oct 28;390(10106):e38; PMID: 29032996]. Lancet 2017;390(10100):1345-422. [MEDLINE: ] [DOI] [PMC free article] [PubMed] [Google Scholar]
GRADE 2008
- Guyatt GH, Oxman AD, Vist GE, Kunz R, Falck-Ytter Y, Alonso-Coello P, et al. GRADE: an emerging consensus on rating quality of evidence and strength of recommendations. BMJ 2008;336(7650):924-6. [MEDLINE: ] [DOI] [PMC free article] [PubMed] [Google Scholar]
GRADE 2011
- Guyatt G, Oxman AD, Akl EA, Kunz R, Vist G, Brozek J, et al. GRADE guidelines: 1. Introduction-GRADE evidence profiles and summary of findings tables. Journal of Clinical Epidemiology 2011;64(4):383-94. [MEDLINE: ] [DOI] [PubMed] [Google Scholar]
Herrington 2017
- Herrington WG, Smith M, Bankhead C, Matsushita K, Stevens S, Holt T, et al. Body-mass index and risk of advanced chronic kidney disease: prospective analyses from a primary care cohort of 1.4 million adults in England. PLoS ONE [Electronic Resource] 2017;12(3):e0173515. [MEDLINE: ] [DOI] [PMC free article] [PubMed] [Google Scholar]
Higgins 2003
- Higgins JP, Thompson SG, Deeks JJ, Altman DG. Measuring inconsistency in meta-analyses. BMJ 2003;327(7414):557-60. [MEDLINE: ] [DOI] [PMC free article] [PubMed] [Google Scholar]
Higgins 2011
- Higgins JP, Green S (editors). Cochrane Handbook for Systematic Reviews of Interventions Version 5.1.0 [updated March 2011]. The Cochrane Collaboration, 2011. Available from www.cochrane-handbook.org.
Hill 2016
- Hill NR, Fatoba ST, Oke JL, Hirst JA, O'Callaghan CA, Lasserson DS, et al. Global prevalence of chronic kidney disease - A systematic review and meta-analysis. PLoS ONE [Electronic Resource] 2016;11(7):e0158765. [MEDLINE: ] [DOI] [PMC free article] [PubMed] [Google Scholar]
KDIGO 2013
- Levin A, Stevens PE, Bilous RW, Coresh J, De Francisco AL, De Jong PE, et al. KDIGO 2012 Clinical Practice Guideline for the Evaluation and Management of Chronic Kidney Disease. Kidney International - Supplement 2013;3(1):1-150. [EMBASE: 369856107] [Google Scholar]
Kovesdy 2017
- Kovesdy CP, Furth SL, Zoccali C, World Kidney Day Steering Committee. Obesity and kidney disease: hidden consequences of the epidemic. Kidney International 2017;91(2):260–2. [MEDLINE: ] [DOI] [PubMed] [Google Scholar]
Ladhani 2017
- Ladhani M, Craig JC, Irving M, Clayton P, Wong G. Obesity and the risk of cardiovascular and all-cause mortality in chronic kidney disease: a systematic review and meta-analysis. Nephrology Dialysis Transplantation 2017;32(3):439-49. [MEDLINE: ] [DOI] [PubMed] [Google Scholar]
Lambert 2017
- Lambert K, Beer J, Dumont R, Hewitt K, Manley K, Meade A, et al. Weight management strategies for those with chronic kidney disease - a consensus report from the Asia Pacific Society of Nephrology and Australia and New Zealand Society of Nephrology 2016 renal dietitians meeting. Nephrology 2017;23(10):912-20. [MEDLINE: ] [DOI] [PubMed] [Google Scholar]
Lassalle 2017
- Lassalle M, Fezeu LK, Couchoud C, Hannedouche T, Massy ZA, Czernichow S. Obesity and access to kidney transplantation in patients starting dialysis: a prospective cohort study. PLoS ONE [Electronic Resource] 2017;12(5):e0176616. [MEDLINE: ] [DOI] [PMC free article] [PubMed] [Google Scholar]
Navaneethan 2009
- Navaneethan SD, Yehnert H, Moustarah F, Schreiber MJ, Schauer PR, Beddhu S. Weight loss interventions in chronic kidney disease: a systematic review and meta-analysis. Clinical Journal of The American Society of Nephrology: CJASN 2009;4(10):1565-74. [MEDLINE: ] [DOI] [PMC free article] [PubMed] [Google Scholar]
Schunemann 2011a
- Schünemann HJ, Oxman AD, Higgins JP, Vist GE, Glasziou P, Guyatt GH. Chapter 11: Presenting results and 'Summary of findings' tables. In: Higgins JP, Green S (editors). Cochrane Handbook for Systematic Reviews of Interventions Version 5.1.0 [updated March 2011]. The Cochrane Collaboration, 2011. Available from www.cochrane-handbook.org.
Schunemann 2011b
- Schünemann HJ, Oxman AD, Higgins JP, Deeks JJ, Glasziou P, Guyatt GH. Chapter 12: Interpreting results and drawing conclusions. In: Higgins JP, Green S (editors). Cochrane Handbook for Systematic Reviews of Interventions Version 5.1.0 [updated March 2011]. The Cochrane Collaboration, 2011. Available from www.cochrane-handbook.org.
Segev 2008
- Segev DL, Simpkins CE, Thompson RE, Locke JE, Warren DS, Montgomery RA. Obesity impacts access to kidney transplantation. Journal of the American Society of Nephrology 2008;19(2):349-55. [MEDLINE: ] [DOI] [PMC free article] [PubMed] [Google Scholar]
Stenvinkel 2008
- Stenvinkel P, Lindholm B. Resolved: being fat is good for dialysis patients. The godzilla effect: con. Journal of the American Society of Nephrology 2008;19(6):102-4. [MEDLINE: ] [DOI] [PubMed] [Google Scholar]
Tsujimoto 2014
- Tsujimoto T, Sairenchi T, Iso H, Irie F, Yamagishi K, Watanabe H, et al. The dose-response relationship between body mass index and the risk of incident stage >=3 chronic kidney disease in a general Japanese population: the Ibaraki prefectural health study (IPHS). Journal of Epidemiology 2014;24(6):444–51. [MEDLINE: ] [DOI] [PMC free article] [PubMed] [Google Scholar]
van der Velde 2011
- Velde M, Matsushita K, Coresh J, Astor BC, Woodward M, Levey AS, et al. Lower estimated glomerular filtration rate and higher albuminuria are associated with all-cause and cardiovascular mortality: a collaborative meta-analysis of high-risk population cohorts. Kidney International 2011;79(12):1341-52. [MEDLINE: ] [DOI] [PubMed] [Google Scholar]
Van Huffel 2014
- Van Huffel L, Tomson CR, Ruige J, Nistor I, Van Biesen W, Bolignano D. Dietary restriction and exercise for diabetic patients with chronic kidney disease: a systematic review. PLoS ONE [Electronic Resource] 2014;9(11):e113667. [MEDLINE: ] [DOI] [PMC free article] [PubMed] [Google Scholar]
Weiner 2004
- Weiner DE, Tighiouart H, Amin MG, Stark PC, MacLeod B, Griffith JL, et al. Chronic kidney disease as a risk factor for cardiovascular disease and all-cause mortality: a pooled analysis of community-based studies. Journal of the American Society of Nephrology 2004;15(5):1307-15. [MEDLINE: ] [DOI] [PubMed] [Google Scholar]
WHO 2017
- World Health Organization. Obesity and overweight. who.int/en/news-room/fact-sheets/detail/obesity-and-overweight (accessed 17 February 2021).
References to other published versions of this review
Conley 2018
- Conley MM, McFarlane CM, MacLaughlin HL, Johnson DW, Campbell KL. Interventions for weight loss in people with chronic kidney disease who are overweight or obese. Cochrane Database of Systematic Reviews 2018, Issue 9. Art. No: CD013119. [DOI: 10.1002/14651858.CD013119] [DOI] [PMC free article] [PubMed] [Google Scholar]


