

Abstract
DEP‐1/PTPRJ is a transmembrane protein‐tyrosine phosphatase which has been proposed as a suppressor of epithelial tumors. We have found loss of heterozygosity (LOH) of the PTPRJ gene and loss of DEP‐1 protein expression in a subset of human meningiomas. RNAi‐mediated suppression of DEP‐1 in DEP‐1 positive meningioma cell lines caused enhanced motility and colony formation in semi‐solid media. Cells devoid of DEP‐1 exhibited enhanced signaling of endogenous platelet‐derived growth factor (PDGF) receptors, and reduced paxillin phosphorylation upon seeding. Moreover, DEP‐1 loss caused diminished adhesion to different matrices, and impaired cell spreading. DEP‐1‐deficient meningioma cells exhibited invasive growth in an orthotopic xenotransplantation model in nude mice, indicating that elevated motility translates into a biological phenotype in vivo. We propose that negative regulation of PDGF receptor signaling and positive regulation of adhesion signaling by DEP‐1 cooperate in inhibition of meningioma cell motility, and possibly tumor invasiveness. These phenotypes of DEP‐1 loss reveal functions of DEP‐1 in adherent cells, and may be more generally relevant for tumorigenesis.
Keywords: DEP‐1, invasion, meningioma, motility, protein‐tyrosine phosphatase
INTRODUCTION
Meningiomas account for 15–20% of all central nervous system tumors. The vast majority of meningiomas are slowly growing benign WHO grade I tumors. About 4% are atypical meningiomas (WHO grade II), and 1% are graded as anaplastic meningiomas (WHO grade III) being associated with aggressive clinical features, including early recurrence and infiltration of brain tissue, leading to increased patient morbidity and mortality 29, 36. However, even histopathologically benign meningiomas can cause substantial clinical problems (28) because of tumor recurrence and occurrence at intracranial locations impeding neurosurgical resection, as well as brain and/or bone infiltration (31). A very common genetic lesion that contributes to meningioma development is loss of the tumor suppressor Neurofibromatosis type 2 (NF2, also designated “merlin”), which is encoded at chromosome 22q 39, 44. Germline mutations of NF2 cause early onset meningiomas (5), and experiments in genetically modified mice have confirmed a function of NF2 as a tumor suppressor in meningioma 17, 18. A number of further abnormalities associated with the gain or loss of gene functions have been reported, for example activation of platelet‐derived growth factor (PDGF) signaling, loss of TSLC‐1 or p16INK, elevated Akt/PKB signaling and alterations in surface proteinase and matrix molecule expression (e.g., SPARC) in progressing meningiomas 30, 31, 36, 39, 48.
Density‐enhanced phosphatase‐1 (DEP‐1, PTPRJ, CD148) is a receptor‐like protein‐tyrosine phosphatase with widespread expression, which is upregulated in some cell types at high cell density 1, 33. DEP‐1 has been proposed to negatively interfere with surface receptor signaling at several levels. Direct dephosphorylation of several receptor tyrosine kinases, including PDGF‐receptors 16, 19, and c‐Met (34), as well as dephosphorylation of downstream mediators 2, 45, 55 have been reported. Src‐family kinases (SFKs) comprise another group of substrates that can be activated by DEP‐1‐mediated dephosphorylation of their C‐terminal inhibitory phosphotyrosines 8, 35, 47, 56. Loss‐of‐function studies have revealed physiological functions of DEP‐1 in vasculogenesis, B‐cell and macrophage immunoreceptor signaling, as well as platelet activation 40, 47, 50, 56.
Density‐dependent regulation and inhibition of mitogenic signaling may be related to a presumed function of DEP‐1 as a tumor suppressor in several types of cancer. Further support for such a role comes from the frequent allele loss of the DEP‐1 encoding PTPRJ gene in several human epithelial tumors (42), anti‐transforming effects of DEP‐1 upon re‐ or over‐expression in tumor cell lines 3, 14, 15, 22, 53, and assignment of Ptprj to a “susceptibility to colon cancer” locus in mice (43). Very recently, a mutation of PTPRJ, which may lead to inactivation, has been reported in brain metastasis from a basal‐like breast cancer, representing one out of two de novo mutations identified by genome‐wide sequencing (10). This has been the first report of a tumor‐associated PTPRJ mutation to date. Understanding the role of DEP‐1 loss in tumors is hampered by the scarcity of experimental loss‐of‐function analyses. No spontaneous tumor formation is seen in mice with inactivated Ptprj gene (54), suggesting that further genetic lesions need to cooperate with DEP‐1 loss in tumorigenesis.
Based on the observation that loss of heterozygosity (LOH) at the PTPRJ locus occurs in a significant fraction of human meningiomas, we addressed the function of DEP‐1 in these cells by shRNA‐mediated knockdown. DEP‐1 downregulation caused a hypermigratory and hypoadhesive phenotype, and promoted colony formation in semi‐solid medium and invasive growth in vivo. Analysis of the underlying signaling events revealed DEP‐1 as a negative regulator of the PDGF receptor function, and as a positive regulator for focal adhesion signaling. We hypothesize that both effects may synergize in contributing to cell motility and invasiveness in DEP‐1‐deficient human meningiomas. Our data show for the first time biological functions of DEP‐1 in adherent cells based on a loss‐of‐function analysis.
MATERIALS AND METHODS
Cell lines
The cell lines KT21‐MG1 (designated throughout as KT21) (51), and SF3061 (9), derived from anaplastic meningiomas WHO grade III, were kindly provided by Dr Anita Lal [University of California, San Francisco (UCSF), San Francisco, CA, USA]. They were tested by the original donor labs to be immunohistochemically positive for vimentin and epithelial membrane antigen, characteristic markers of meningiomas. HBL52 (Cell Lines Service, Heidelberg, Germany) and Ben‐Men‐1 (38), kindly provided by Dr Werner Paulus (Institute of Neuropathology, University Hospital Muenster, Germany), originate from benign meningiomas WHO grade I. The meningioma cell lines F5 and IOMM‐Lee (49) were derived from anaplastic meningiomas WHO grade III, and kindly provided by Dr Anita Lal (UCSF), and Dr David Gutmann (Washington University School of Medicine, St. Louis, MO, USA). Colon carcinoma cell lines SW480 and HCT116 were obtained from Deutsche Sammlung für Mikroorganismen und Zellkulturen GmbH (DSMZ, Braunschweig, Germany). The cell batches used in this study were cultivated less than 6 months from the original cell stocks.
Antibodies and reagents
Phospho‐Met (Tyr1230/Tyr1234/Tyr1235) antibody was obtained from Biosource (Karlsruhe, Germany), and Src antibody (SRC 2; sc‐18) was obtained from Santa Cruz (Heidelberg, Germany). Phospho‐PLCγ1 (Tyr783) (#2821), phospho‐PDGF receptor α (Tyr849)/β (Tyr857) (#3170), phospho‐Akt (#4058), Akt (#9272), phospho‐paxillin (Tyr118) (#2541) and phospho‐p44/42 Erk (Thr202/Tyr204) (#9106) antibodies were obtained from Cell Signaling (Frankfurt, Germany); PLCγ (sc‐7290), paxillin (sc‐5574), NF2/Merlin (sc‐331) and DEP‐1 mouse monoclonal (clone 143‐41, sc‐21761) or goat polyclonal (C17, sc‐13798) antibodies were from Santa Cruz Biotechnology (Heidelberg, Germany); β‐actin antibody (A5441) was purchased from Sigma‐Aldrich (Taufkirchen, Germany); anti‐p120 catenin and Erk1 antibodies from Transduction Laboratories (Heidelberg, Germany). Vinculin antibody was purchased from Biozol (Echingen, Germany).
The PDGF receptor kinase inhibitor AG1295 was obtained from Merck‐Calbiochem (Bad Soden, Germany), and STI571/Imatinib was synthesized as described (7).
Plasmids
pLKO.1 plasmids encoding either a DEP‐1‐targeting shRNA (CCGGCCTACTGTGTCTTGGA ATCTACTCGAGTAG‐ATTCCAAGACACAGTAGGTTTTT; Clone ID NM_002843.x‐4772s1c1/TRCN0000002872 from the MISSION shRNA lentivirus‐mediated transduction system collection SHCLNG‐NM_002843) or non‐targeting shRNA (CAACAAGATGAAGAG‐ CACCAACTCGAGTTGGTGCTCTTCATCTTGTTG; cat. No. SHP002) were obtained from Sigma‐Aldrich. Lentiviral packaging constructs pRev, pEnv‐VSV‐G and pMDLg have been described previously 6, 11. pGEX6P‐1‐cat‐DEP‐1‐WT encodes a GST fusion protein of the intracellular domain of DEP‐1 containing the catalytic domain. pGEX6P‐1‐cat‐DEP‐1‐D1205A plasmid encodes a GST fusion protein of the intracellular domain of DEP‐1 with the D1205A substrate trapping mutation of the invariant aspartate of the catalytic domain.
LOH analysis
A total of 32 meningiomas of different histological subtype and grade of malignancy (graded according to the 2007 WHO classification of brain tumors (26)) were used for the LOH analysis. For PTPRJ, we analyzed LOH at four microsatellite markers (D11S1350, D11S1784, D11S4117 and D11S4183) as described by Ruivenkamp et al (42), and for NF2 at three microsatellite markers (D22S268, D22S421 and D22S929) (21). Further details are described in the Online Supplement.
Sequencing
Genomic DNA from meningioma tumor samples analyzed for LOH, as well as genomic DNA from KT21 and SF3061 cells, was screened for the DEP‐1 K1017N mis‐sense mutation reported in Ding et al (10). A 479 bp fragment of the PTPRJ gene containing the potential mutation was amplified using the primers 5′ CCC TCT TGC CAA ATT ATA CCC 3′ (forward) and 5′ TAA CTG CAC TGC TGA CTC TGT AG 3′ (reverse). Polymerase chain reaction (PCR) mixtures (50 µL volume) contained 100 ng genomic DNA, 1 µL PfuUltra II Fusion HS DNA Polymerase (Agilent Technologies, Waldbronn, Germany), 0.2 µM of each primer, 0.2 mM dNTPs and 1× supplied reaction buffer. Cycling conditions were 2 min initializing denaturation at 95°C, followed by 38 cycles of 95°C for 30 s, 59°C for 30 s and 72°C for 30 s, and a final step at 72°C for 3 min. PCR product purification and sequencing of both DNA strands with the PCR primers was performed by Eurofins MWG Operon (Ebersberg, Germany).
Immunoblotting
Protein samples were separated on 7.5% or 10% sodium dodecylsulfate‐polyacrylamide gel electrophoresis (SDS‐PAGE) gels, and transferred to polyvinylidene fluoride membranes (Millipore, Schwalbach, Germany). The membranes were blocked in 1× NET‐G (50 mM Tris‐HCl, pH 7.5, 150 mM NaCl, 5 mM EDTA, 0.04% gelatin, 0.05% Tween 20) at room temperature for 1 h and incubated with primary antibody at 4°C overnight, followed by incubation with horseradish peroxidase (HRP)‐conjugated secondary antibodies for 1 h at room temperature, and development using enhanced chemiluminescence. Images were acquired with a LAS 4000 camera (Fujifilm, Düsseldorf, Germany) and quantified with Multi Gauge V3.0 software (Fujifilm).
shRNA‐mediated DEP‐1 knockdown
HEK293T cells were transfected with pLKO.1 plasmids encoding either a DEP‐1‐targeting shRNA or non‐targeting shRNA together with the plasmids pRev, pEnv‐VSV‐G and pMDLg by the polyethylenimine (PEI) transfection method (20). The medium containing the replication‐deficient lentiviral particles was collected and used for infection of KT21 and SF3061 cells 24 h and 48 h after transfection. The infection with the virus was performed in three cycles for either 8 h or overnight in the presence of 8 µg/mL polybrene (1.5‐dimethyl‐1.5‐diazaundecamethylene polymethobromide; Sigma‐Aldrich). Selection of stably transfected cells was started 48 h after the third infection with 1.5 µg/mL puromycin (Sigma‐Aldrich).
siRNA transfection
KT21 cells seeded in 6 cm cell culture dishes were transfected with 2 µg DEP‐1 siRNA (antisense: UAGAUUCCAAGACACAGUAdGdG; sense: UACUGUGUCUUGGAAUCUAdGdC; Qiagen, Hilden, Germany) or 2 µg control siRNA (target DNA sequence AATTCTCCGAACGTGTCACGT; SI03650325; Qiagen) using Oligofectamine (Invitrogen, Karlsruhe, Germany) as recommended by the manufacturer. Oligofectamine‐siRNA complexes were added to the cells at about 50% confluence, and cells were analyzed 72 h after transfection.
Proliferation and apoptosis assays
KT21 or SF3061 cells (non‐transfected, or stably expressing DEP‐1‐targeting shRNA, or stably expressing control shRNA) were seeded in 96‐well plates at a cell number of 2 × 10³ or 2.5 × 10³, respectively, in a final volume of 100 µL DMEM containing 10% fetal calf serum (FCS). After 24, 48, 72 and 96 h, 10 µL of 5 mg/mL 3‐(4,5‐Dimethylthiazol‐2‐yl)‐2,5‐diphenyltetrazolium bromide (MTT, Sigma‐Aldrich) were added for 4 h, followed by 100 µL of solubilization buffer (10% SDS, 0.01 M HCl) for overnight incubation. Absorbance was measured at 570 nm. Experiments were performed three times, with seven replicates for each condition.
For measurement of apoptosis, cells were treated for 24 h in absence or presence of staurosporine, and Caspase‐3 activity was measured in cell extracts using the CCP32/caspase‐3 fluorimetric protease assay kit (Chemicon, Temecula, CA, USA) as reported (46). This experiment was repeated twice.
Migration assays
In vitro wounding assays were performed by culturing cells in 6 cm dishes to confluency in DMEM containing 10% FCS. Mitomycin C (Sigma, Steinheim, Germany) was added to a final concentration of 10 µg/mL. Two hours later, cell layers were wounded using sterile 20 µL pipette tips and washed twice with phosphate‐buffered saline (PBS) to remove non‐adherent cells. Cells were further incubated in complete medium, and the scratches were imaged after 0 h, 6 h and 20 h by phase‐contrast microscopy. The presented quantification is based on at least three independent experiments (with the exceptions given in the figure legends) per cell line. In each experiment, three replicate dishes were analyzed and, in each dish, three scratches were carried out and evaluated. On each scratch, three areas were marked and quantified (total number of 27 data points per variant) using the software Image J to measure the areas that were not covered by cells at the start (0 h) and after the incubation time of 20 h.
Transwell assays were performed using a 48‐well micro chemotaxis chamber (Neuro Probe, Inc. Gaithersburg, MD, USA) and polycarbonate membranes (8 µm pore size) similar as previously reported (16). In brief, cells were serum‐starved for 16 h. The lower chambers were filled with serum‐free medium containing 10 ng/mL PDGF‐BB. Cells (4 × 10⁴) were seeded in 52 µL serum‐free medium in the upper chamber in quadruplicate. After incubation at 37°C for 4 h, the membranes were stained with 0.5% crystal violet in 20% methanol. Non migrated cells were removed with a cotton swab, and the migrated cells on the lower side of the membrane were counted for the whole well under a light microscope using a 100× objective. Three independent experiments were carried out.
PDGF signaling analysis
KT21 or SF3061 cells stably expressing DEP‐1‐targeting or control shRNA were seeded in 10 cm dishes, allowed to grow to confluency and deprived of serum over night. Cells were stimulated with 50 ng/mL PDGF‐BB (Biosource, Karlsruhe, Germany) for 0, 2.5, 5 and 15 min, washed with PBS, and extracted with lysis buffer containing 1% NP40, 50 mM HEPES pH 7.5, 150 mM NaCl, 1 mM EDTA, 2 mM EGTA, 1 mM sodium orthovanadate and protease inhibitors. Lysates were cleared by centrifugation and protein concentration was determined by the bicinchoninic acid (BCA) assay (Thermo Scientific/Pierce, Bonn, Germany). Equal protein amounts were analyzed by immunoblotting.
For detection of PDGF receptors and DEP‐1, glycoproteins were enriched from the lysates with wheat germ agglutinin agarose (Sigma‐Aldrich). DEP‐1 knockdown, PDGF receptor phosphorylation and activation of different signaling proteins were detected by immunoblotting and subsequent quantification, as described previously. All experiments were repeated at least three times.
Paxillin phosphorylation
KT21 or HCT116 cells stably expressing DEP‐1‐targeting or control shRNA were trypsinized, resuspended in medium containing 10% FCS, washed twice with serum‐free medium and kept in suspension in serum‐free medium for 1 h. KT21 cells (4 × 10⁵) or 3 × 10⁶ HCT116 cells were seeded in fibronectin‐(F1141; Sigma Aldrich) coated (1 µg/cm2) 6‐well plates, and adherent cells were lysed at different times. Protein concentration was determined by the BCA assay and equal amounts of protein were analyzed by immunoblotting. SW480 cells inducibly re‐expressing DEP‐1 (3) were grown in the absence (DEP‐1 induced) or presence (DEP‐1 repressed) of anhydrotetracylin (ATC, 150 ng/mL). Unstimulated cells were lysed and tested for paxillin phosphorylation by immunoblotting. All experiments were repeated at least three times.
Adhesion assay
For quantitative adhesion measurements, KT21 and SF3061 cell lines stably expressing DEP‐1‐targeting or control shRNA were trypsinized and resuspended in growth medium. Cells (5 × 10⁶) were labeled with 1 mL of 10 µM CellTracker™ Green CMFDA (C2925; Invitrogen) in medium containing 1% FCS at 37°C for 30 min. Subsequently, cells were washed twice with serum‐free medium, diluted to a concentration of 1.5 × 10⁵ cells/mL (KT21 cell lines) or 2 × 10⁵ cells/mL (SF3061 cell lines), respectively, and kept in suspension for 1 h. Thereafter, 100 µL suspension per well were seeded into 96‐well plates (flat bottom, clear, Greiner Bio‐One, Frickenhausen, Germany, cat. no. 655098) coated with 1 µg/cm2 fibronectin, 9 µg/cm2 collagen type I (C9791), or 9 µg/cm2 collagen type II (C9301; Sigma‐Aldrich, Taufkirchen, Germany). At different time‐points, medium and non adherent cells were aspirated, the remaining adherent cells were washed three times with PBS, and subsequently lysed in buffer containing 1% NP40, 150 mM NaCl, 50 mM HEPES, 1 mM EDTA, 2 mM EGTA for 10 min. Fluorescence of the lysates was measured in a plate reader (Infinite F200; Tecan, Crailsheim, Germany). These experiments were carried out four times. For further illustration of adhesion properties, unlabeled stable KT21 cell lines, starved in serum‐free medium in suspension for 1 h, were seeded in coated 96‐well plates (1.5 × 10⁴ cells in 100 µL serum‐free medium per well). Medium and non adherent cells were aspirated after 2 h, adherent cells were washed three times with PBS and stained with 0.5% crystal violet in 20% methanol for 5 min. The wells were washed three times with PBS and the plate was scanned. This experiment was repeated three times.
Immunostainings and time‐lapse microscopy
Immunostainings of DEP‐1 in sections of paraffin‐embedded tissue were performed using polyclonal DEP‐1 antibodies by standard techniques as previously reported (31). The tissue microarray used to estimate DEP‐1 expression in human meningiomas has been recently described in detail (13).
For immunostaining of paxillin and vinculin, KT21 cells stably transfected with DEP‐1‐targeting or control shRNA expression constructs were starved in suspension in serum‐free medium for 1 h. Cells (104) were seeded on cover slips coated with fibronectin (1 µg/cm2). After 2 h, cells were fixed with 4% paraformaldehyde in PBS (10 min, RT) and incubated with paxillin or vinculin antibodies (1:250 or 1:500 in 1.5% BSA in PBS, respectively, for 1 h at RT), followed by Cy3‐conjugated secondary antibodies (Jackson Immunoresearch, Hamburg, Germany). For detection of filamentous actin, serum starved cells were fixed 30 min or 60 min after seeding on fibronectin‐coated cover slips, and actin was stained using TRITC‐labeled phalloidin (0.2 µM; Sigma‐Aldrich) in 1.5% BSA in PBS for 30 min at RT. Images were taken with a laser scanning microscope (Zeiss LSM510, Carl Zeiss Jena GmbH, Jena, Germany). Paxillin, vinculin and phalloidin stainings were repeated three times, with 20 images analyzed each.
For time‐lapse microscopy, cells were serum starved for 30 min and then plated on fibronectin‐coated four‐chamber glass bottom culture dishes. Cell spreading was examined with a time‐lapse microscope (AxioVision, Carl Zeiss Jena GmbH; incubation chamber 37°C, 5% CO2) with a 25× objective, recording Z‐stacks with Z‐steps of 1.89 µm every 10 minutes over a period of 90 minutes. This experiment was performed twice. Five microscopic fields, each containing 20–30 cells were analyzed.
Colony forming assay
Cells were suspended in culture medium containing 0.25% agar and 10% FCS (3:1 agarose, MoBiTec, Göttingen, Germany) at a density of 5 × 10³ in 1 mL and seeded on a bottom layer of 0.5 mL 0.5% agar in a 24‐well plate. Colonies were stained after 15 days with 3‐(4,5‐Dimethylthiazol‐2‐yl)‐2,5‐diphenyltetrazolium bromide (MTT, 5 mg/mL, 1:10 dilution), and all colonies per well were counted for statistical analysis. Three independent experiments were performed with quadruplicate measurements.
Invasion assays
To analyze tumor formation in vivo, KT21 cells stably expressing DEP‐1‐targeting or control shRNA were grown to confluence, trypsinized, and resuspended in DMEM supplemented with 10% FCS. Cells were then centrifuged and stereotactical transplantation of 106 cells was carried out into the prefrontal cortex (coordinates: anterior 2 mm, lateral 0.6 mm, ventral 2 mm to bregma) of anaesthetized five‐weeks‐old NMRI nu/nu mice. Ten days after surgery, all mice were killed by an overdose of anesthetic and their heads fixed in 4% phosphate‐buffered formaldehyde solution for subsequent histological workup. A region of the brain of each animal spanning 400 µm was analyzed by taking 8 consecutive 3–4 µm coronal sections every 50 µm, which were all analyzed qualitatively for tumor growth and brain invasion by hematoxylin–eosin staining and microscopy. Few selected sections were subjected to immunohistochemistry to verify DEP‐1 expression or knockdown, respectively.
Animals were bred and housed at the Institute for Laboratory Animal Science, Hannover Medical School, Germany. All experiments were conducted in compliance with the German Animal Welfare Act and approved by the local authorities, including approval by an animal ethics committee, in accordance with the NIH Guide for Care and Use of Laboratory Animals.
Statistic data evaluation
Statistical analysis was performed using SigmaPlot 11.0 software. Migration and apoptosis assays were analyzed for statistically significant differences by two‐tailed t‐test. Signaling experiments and adhesion assays were tested by two‐way ANOVA followed by Bonferroni's multiple comparison test. Differences with P < 0.05 are indicated as significant.
RESULTS
LOH at the PTPRJ locus in meningioma
Little is known about the role of protein‐tyrosine phosphatases in formation and biology of meningiomas. Because activation of PDGFRs has been reported in these tumors (48), and DEP‐1/PTPRJ can negatively regulate PDGFRs, we considered the possibility that DEP‐1 loss may occur in meningioma. We therefore analyzed the status of the DEP‐1 encoding PTPRJ gene. Established genetic markers (42) were used to explore possible LOH at the PTPRJ locus. LOH could indeed be detected in 38.5% of samples (Table 1, Figure S1, Table S1, Online Supplement). For comparison, LOH at the NF2 locus was also analyzed. In the current sample set, the frequency was 50%, thereby similar to published data (4). High‐grade meningiomas are rare, so the number of analyzed cases was small. However, a tendency to higher LOH rates for both PTPRJ and NF2 in WHO grade II/III tumors could be observed (Table 1). LOH of PTPRJ and NF2 was not mutually exclusive, 30% of WHO grade I tumors and 50% of WHO grade II/III tumors revealed LOH in both genes. Analysis of tumor samples with or without LOH by immunoblotting for DEP‐1 expression showed low expression in the LOH samples, but also in three out of six tumors without LOH (Figure 1A). These data indicate that DEP‐1 expression is lost in a subset of meningiomas by allelic loss and, possibly, by additional mechanisms as well. Consistent with these findings, immunohistochemistry revealed that DEP‐1 is expressed in primary meningiomas, but is indeed absent in a significant fraction (Figure 1B). Among 35 meningiomas present in triplicate on a tissue micro array, only 16 (46%) tumors showed retained immunoexpression of DEP‐1. Similarly, meningioma cell lines only partly expressed DEP‐1, notably the cell lines KT21 and SF3061 (Figure 1C). While the former expressed very little NF2/merlin (consistent with a reported monosomy of chromosome 22 (51)), the latter exhibited high expression of NF2 (Figure 1D). Genomic DNA from all meningioma samples included in the LOH analysis, as well as from KT21 and SF3061 cells, was sequenced to detect a possible mutation at codon 1017(K), a site previously found mutated in a metastasis from mammary carcinoma (10). No mutations were found, suggesting that the DEP‐1 protein detected by immunoblotting is presumably enzymatically active. We conclude from these studies that DEP‐1 is expressed in meningioma cells, but that PTPRJ allelic loss and loss of DEP‐1 protein expression occur in a significant fraction of meningiomas, potentially indicating a role for tumor biology.
Table 1.
Frequency of LOH of PTPRJ and NF2 in human meningiomas of different WHO grade. Established genetic markers were used to explore possible LOH at the PTPRJ and NF2 locus for 32 meningioma cases.
| Tumor type | Number of tumors | |||||
|---|---|---|---|---|---|---|
| PTPRJ informative | LOH (%) | NF2 informative | LOH (%) | PTPRJ + NF2 informative | LOH (%) | |
| All grades | 26 | 10 (38.5) | 26 | 13 (50) | 26 | 9 (34.5) |
| Grade I | 20 | 7 (35) | 20 | 9 (45) | 20 | 6 (30) |
| Grade II/III | 6 | 3 (50) | 6 | 4 (67) | 6 | 3 (50) |
Figure 1.
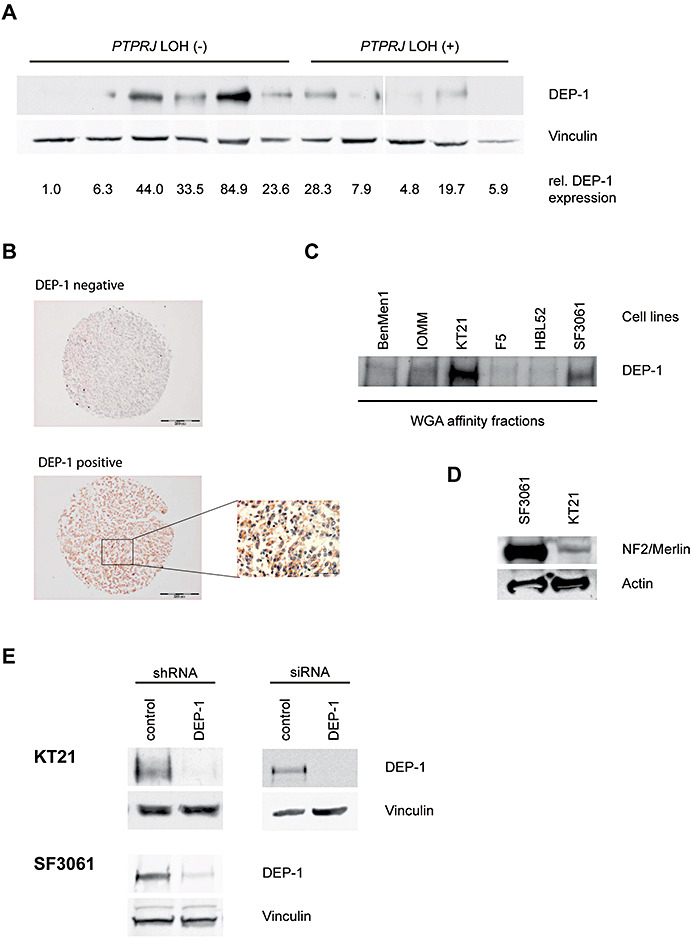
A. Lysates of meningioma tumor samples with or without LOH at the PTPRJ locus, as indicated, were analyzed for DEP‐1 expression. Equal amounts of lysate protein were subjected to enrichment of DEP‐1 by wheat‐germ agglutinin affinity precipitation and analyzed by immunoblotting using anti‐DEP‐1 143‐41 monoclonal antibodies. DEP‐1 expression was quantified by densitometry and normalized to the intensity of the loading control vinculin. All lanes were on the same blot with identical exposure and image processing, but were rearranged for better clarity. B. Immunostainings of paraffin‐embedded meningioma samples derived from a tissue microarray. One example for positive and negative staining each is shown (scale bars 200 µm), the inset is a larger magnification (scale bar 50 µm). C. DEP‐1 protein expression in meningioma cell lines (details on the cell lines given in the Materials and Methods section) was analyzed by immunoblotting. Equal protein amounts of the meningioma cell lysates were subjected to enrichment by wheat‐germ agglutinin affinity precipitation. D. Cell lysates from SF3061 and KT21 cells were tested for NF2/Merlin expression by immunoblotting. E. Stable knockdown of DEP‐1 in KT21 and SF3061 cells was achieved by lentiviral transduction with DEP‐1 shRNA (or non‐targeting control shRNA) expression constructs and subsequent puromycin selection of transduced cells. For transient knockdown of DEP‐1 in the KT21 cell line, cells were transfected with a DEP‐1 siRNA (or a non‐targeting control siRNA). Equal protein amounts of the cell lysates were subjected to enrichment by wheat‐germ agglutinin affinity precipitation and analyzed by immunoblotting.
DEP‐1 loss drives migration of meningioma cells
To address the potential function of DEP‐1, we used stable knockdown by shRNA, or transient knockdown with siRNA in the DEP‐1 positive cell lines KT21 and SF3061 (Figure 1E). DEP‐1‐depleted cells were analyzed for alterations in cell growth, apoptosis and cell migration. The knockdown had little effect on proliferation in monolayer culture (Figure 2A, both cell lines), or on the rate of spontaneous apoptosis (Figure 2B), but in agreement with a previous report (27), DEP‐1 knockdown reduced drug‐induced apoptosis in KT21 cells (Figure 2B). Possible effects on cell motility were tested in wounding assays with mitotically inactive cells. DEP‐1‐depleted cells had a clearly elevated motility (Figure 3A,B). This was seen with both cell lines (KT21, SF3061). We also used transient transfection of siRNA as alternative technique for DEP‐1 depletion in KT21 cells. Making use of this approach, knockdown likewise resulted in a hypermigratory phenotype (Figure S2). Considering the capacity of DEP‐1 to negatively regulate PDGF receptors, we analyzed the role of PDGFR kinase activity in the hypermigratory phenotype. Cells were subjected to treatment with the relatively selective PDGFR inhibitors, AG1295 or STI571/Imatinib. Both compounds abolished elevated migration but had little effect on basal motility (Figure 3C), suggesting that increased PDGFR activity is indeed important for elevated migration in absence of DEP‐1.
Figure 2.
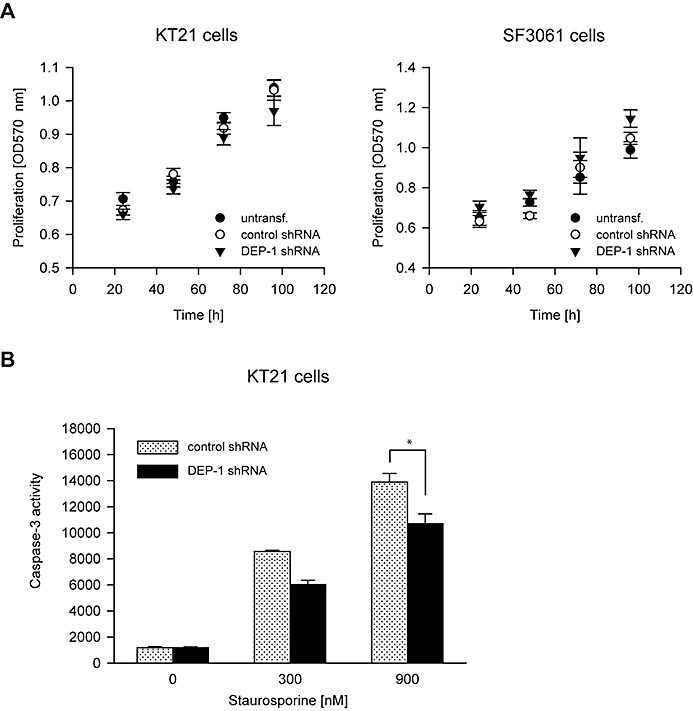
DEP‐1 knockdown does not affect proliferation but reduces sensitivity to drug‐induced apoptosis. A. KT21 and SF3061 cells stably transfected with DEP‐1‐targeting or control shRNA expression plasmids were seeded in 96‐well plates in growth medium containing 10% FCS. After the indicated times, MTT reagent was added for 4 h, the cells were lysed and OD 570 nm was measured. The mean of seven replicates ± SD of one representative experiment out of three with consistent results is shown. B. KT21 cells stably transfected with DEP‐1‐targeting or control shRNA expression plasmids were left untreated or were treated for 24 h with staurosporine in the indicated concentrations, and then subjected to a caspase‐3 activity assay to assess apoptosis induction (mean values ± SD, n = 10, *P < 0.05 by t‐test).
Figure 3.
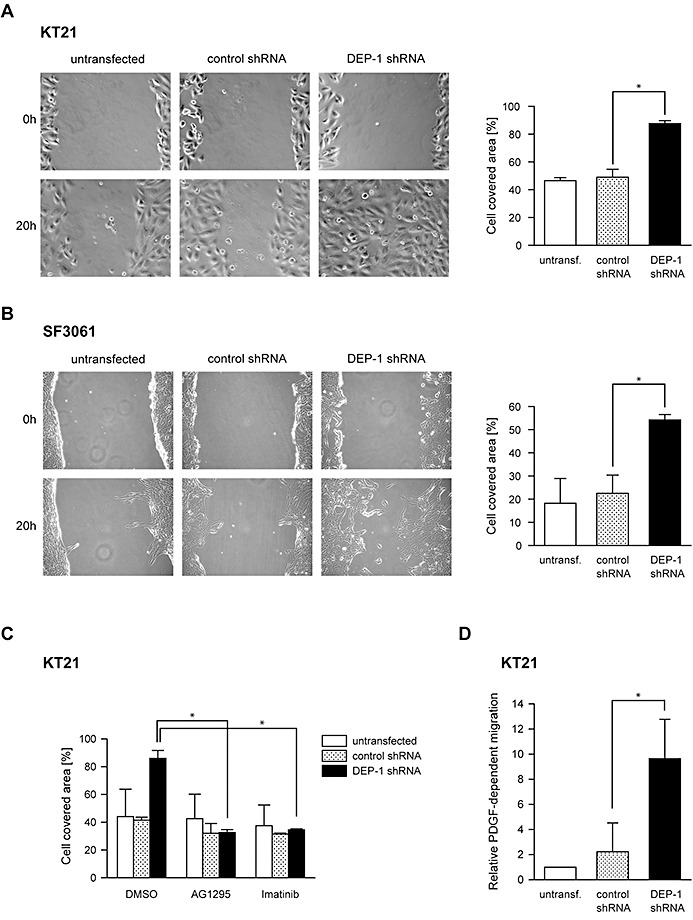
DEP‐1 is a negative regulator of meningioma cell migration. A. Untransfected KT21 and SF3061 cells and B. Cells stably expressing DEP‐1‐targeting shRNA or control shRNA were subjected to wounding assays. Images of three positions were taken 0 h and 20 h after wounding, and the area of the wound covered with cells after 20 h was quantified (mean values ± SD of three independent experiments, *P < 0.05 by t‐test). C. Untransfected, DEP‐1‐targeting shRNA or control shRNA expressing KT21 cells were treated as in A, except that the PDGF receptor kinase inhibitors AG1295 (20 µM) or Imatinib/STI571 (2 µM), or the solvent DMSO (as indicated) were added to the medium after wounding the cell layers (mean values ± SD of two independent experiments, *P < 0.05 by t‐test). D. Untransfected, DEP‐1‐targeting shRNA or control shRNA expressing KT21 cells were serum‐starved and subjected to a chemotaxis assay using a modified Boyden chamber. Cells that migrated towards a PDGF‐BB gradient to the lower side of the membrane were counted (mean values ± SD of three independent experiments, *P < 0.05 by t‐test).
Increased PDGFR signaling in DEP‐1‐depleted meningioma cells
To directly address the role of PDGFR in the hypermigratory response, we performed transwell migration assays using PDGF‐BB as a motogen. The response to PDGF was highly increased in the DEP‐1 knockdown cells (Figure 3D). We went on to analyze signaling responses to PDGF. As shown in Figure 4A,B, PDGFR phosphorylation in response to PDGF‐BB stimulation was significantly elevated in DEP‐1‐depleted meningioma cells. Analysis of downstream signaling showed a significant effect of DEP‐1 knockdown on PLCγ phosphorylation, but not on Erk1/2 or Akt activation (Figure 4C).
Figure 4.
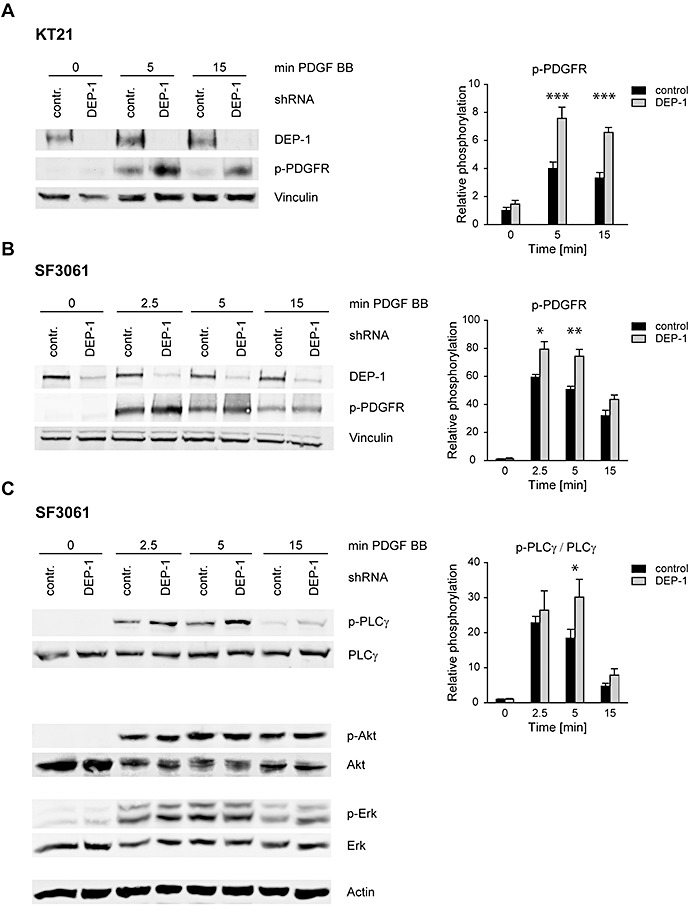
DEP‐1 negatively regulates PDGF receptor signaling. KT21 and SF3061 cells stably transfected with control shRNA or DEP‐1‐targeting shRNA expression constructs were allowed to grow to confluence and starved with serum‐free medium over night. A. KT21 or B. SF3061 cells were stimulated with 50 ng/mL PDGF‐BB, and PDGFR activation, or C. activation of downstream signaling steps were analyzed by immunoblotting. Equal amounts of protein were loaded on SDS‐PAGE gels for whole cell lysate analysis by immunoblotting (verified by vinculin detection as loading control), or were subjected to glycoprotein enrichment with wheat germ agglutinin‐agarose prior to electrophoresis for detection of PDGF receptors or DEP‐1. Blots were quantified by densitometry, and p‐PDGFR signal intensities (A,B) or intensities of p‐PLCγ normalized to PLCγ are displayed in the graphs (right panels, mean values ± SEM of at least three independent experiments). Two‐way ANOVA and Bonferroni's multiple comparison test was applied to test for significance. Signaling intensities of DEP‐1 shRNA vs. control shRNA expressing cells differed significantly with respect to the whole time‐series of stimulation [***P < 0.001 (A,B); *P < 0.05 (C)]. Comparisons for individual time points displayed in the graphs were also statistically tested (*P < 0.05; **P < 0.01, ***P < 0.001).
DEP‐1 mediates focal adhesion signaling and cell adhesion
The stimulatory effects of DEP‐1 knockdown on cell migration were very pronounced, consistent with our previous observations that DEP‐1 re‐expression in DEP‐1 negative cells strongly inhibited migration (3). We considered that additional substrates may be relevant for this phenotype. To find such substrates, we used a method based on the formation of relatively stable complexes of substrates with certain inactive mutant‐proteins of protein‐tyrosine phosphatases designated “substrate trapping” mutants (12). DEP‐1 D1205A has previously been described as a substrate trapping DEP‐1 version (34). We used a GST‐DEP‐1 D1205A fusion protein covalently bound to agarose‐beads, and subjected lysates of DEP‐1 negative cells to affinity purification. Proteins bound to the beads were subsequently analyzed by mass spectrometry and immunoblotting. These experiments revealed complex formation of DEP‐1 with focal adhesion kinase (FAK), paxillin and pp60c‐src among other proteins (data not shown and Figure S3A). Additionally, lysates of cells with DEP‐1 knockdown were subjected to an array analysis with phosphospecific antibodies. In this analysis, alterations in the phosphorylation state of paxillin were found (data not shown). Consistent with an earlier report (35), both findings suggested that DEP‐1 may play a role in regulating phosphorylation in focal adhesion complexes. Based on overexpression experiments, it had been proposed that DEP‐1 can activate pp60c‐src, leading to hyperphosphorylation of paxillin and enhanced cell adhesion (35). To test the role of such a pathway, we analyzed paxillin phosphorylation in DEP‐1‐depleted meningioma cells. The cells were trypsinized, serum‐starved in suspension and subsequently seeded on fibronectin‐coated dishes. Paxillin phosphorylation as a readout for focal adhesion signaling was assayed by immunoblotting after different time intervals. As shown in Figure 5A, DEP‐1 knockdown was associated with a moderately but significantly reduced paxillin phosphorylation. A similar reduction of paxillin phosphorylation was also seen in colon epithelial cells with DEP‐1 knockdown (Figure S3B), whereas a paxillin hyperphosphorylation was observed upon DEP‐1 re‐expression in DEP‐1 negative cells (Figure S3C). Taken together, these findings indicated that positive regulation of paxillin tyrosine phosphorylation by DEP‐1 occurs in meningioma cells, and also appears to be a more general phenomenon.
Figure 5.
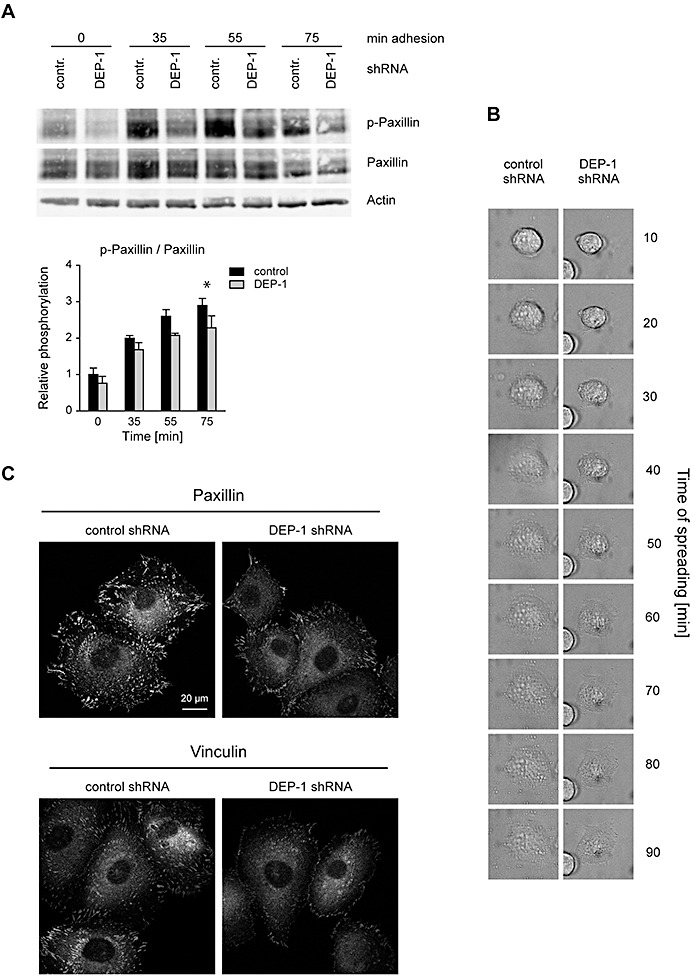
DEP‐1 positively regulates paxillin phosphorylation, and enhances cell spreading and formation of focal adhesion complexes. A. KT21 cells stably transfected with DEP‐1‐targeting or control shRNA expression constructs were starved in suspension and seeded in fibronectin‐coated plates. After the indicated times, adherent cells were lysed, and lysates were analyzed by immunoblotting. Equal loading was verified by detection of β‐actin. The blots were quantified by densitometry, and intensities of p‐paxillin normalized to paxillin signals are displayed in the graph (mean values ± SEM of four independent experiments). Two‐way ANOVA and Bonferroni's multiple comparison test was applied to test for significant differences. Signaling intensities of DEP‐1 shRNA vs. control shRNA expressing cells differed significantly with respect to the whole time‐series of stimulation (**P < 0.01). Comparisons for individual time points displayed in the graphs were also statistically tested (*P < 0.05) B. Reduced spreading of DEP‐1‐depleted KT21 cells. Attachment of the indicated cell lines was examined simultaneously under a time‐lapse microscope over a period of 90 min. A representative example is shown. C. KT21 cells stably transfected with DEP‐1‐targeting or control shRNA expression constructs were starved in suspension in serum‐free medium for 1 h and seeded on fibronectin‐coated cover slips. After 2 h, cells were fixed and stained with paxillin or vinculin antibodies followed by Cy3‐conjugated secondary antibodies. Images were taken using a laser scanning microscope and converted into grayscale. A representative example is shown.
The effects of DEP‐1 knockdown on paxillin phosphorylation suggested that DEP‐1 may regulate focal adhesion functions. We and others have previously observed elevated cell‐matrix adhesion in DEP‐1 overexpressing cells 16, 35. Indeed, when DEP‐1‐depleted cells were suspended, starved and seeded again, adhesion and spreading were impaired, as shown for examples analyzed by time‐lapse microscopy (Figure 5B), or by actin staining (Figure S4A). We then tested substrate adhesion of DEP‐1‐depleted cells. Cells were serum‐starved in suspension, and seeded and adhered cells were monitored for the formation of focal adhesion complexes. Staining for paxillin and vinculin clearly showed reduced numbers of focal adhesions in the DEP‐1‐depleted cells (Figure 5C) at a fixed time‐point. These experiments also strongly suggested a reduced efficiency of cell‐matrix adhesion of DEP‐1‐depleted cells. To test this notion, serum‐starved cells were seeded in dishes coated with different matrix proteins, non‐adherent cells were removed after 2 h and the adherent cells were stained with crystal violet. As shown in Figure 6A, DEP‐1‐depleted cells indeed exhibited diminished adhesion in this assay. To quantify the differential adhesion kinetics, we labeled cells with the fluorescent dye CellTracker™ Green CMFDA before allowing them to adhere to different matrices. The adhered cells were quantified based on their fluorescence (Figure 6B, Figure S4B). The two different meningioma cell lines with DEP‐1 knockdown were clearly hypoadhesive. The effect was more pronounced for KT21 cells, and adhesion to collagen I, II and fibronectin was impaired to a similar extent (Figure 6B). SF3061 cells were somewhat less affected and the effect was significant only in case of collagen I and II, but not on fibronectin (Figure S4B). Taken together, the results revealed DEP‐1 as a positive regulator of focal adhesion signaling and cell adhesion to different matrices in meningioma cells.
Figure 6.
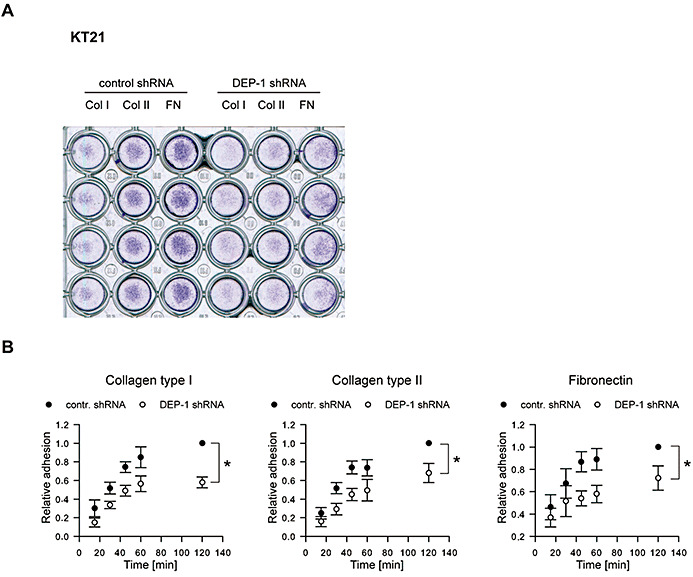
Impaired adhesion of DEP‐1‐depleted cells. A. KT21 cells stably transfected with DEP‐1‐targeting or with control shRNA expression constructs were starved in suspension and seeded in a 96‐well plate coated with collagen type I, collagen type II or fibronectin. After 2 h, medium and non‐adherent cells were removed, adherent cells were washed with PBS and stained with crystal violet. The image was taken by scanning the plate. A representative example is shown. B. KT21 cells and SF3061 cells stably transfected with DEP‐1‐targeting or control shRNA expression constructs were fluorescently labeled with CellTracker™ Green CMFDA and starved for 1 h in suspension before they were seeded in 96‐well plates coated with the indicated matrix proteins. At different time points, non‐adherent cells were removed, adherent cells were lysed and the fluorescence of the lysates was determined. Measurements were performed in six replicates; fluorescence was normalized to the 120 minute value of the control shRNA transfected cell line. Graphs display mean ± SEM of four independent experiments; two‐way ANOVA and Bonferroni's multiple comparison test was applied to test for significant differences between the two cell lines (*P < 0.05).
DEP‐1 inhibits meningioma cell invasive growth
We further tested the effect of DEP‐1 loss on colony formation in semi‐solid medium. DEP‐1‐depleted KT21 cells exhibited a strongly elevated colony formation (Figure 7A). Moreover, DEP‐1‐depleted KT21 cells and corresponding control cells were analyzed for tumor growth in an orthotopic xenotransplantation model. Intracranial injection of cells in nu/nu mice caused formation of sheet‐like tumor tissue in all animals covering both hemispheres (Figure 7B I, II). In three out of five mice bearing DEP‐1‐depleted cells, additional brain infiltration was evident (Table S2; arrows in Figure 7B II and VI), which was histologically reminiscent of invasive growth seen in human high‐grade meningiomas (Figure 7B II, IV, VI). In addition, necrosis (*) was present in these tumors. In contrast, in only one case did DEP‐1‐expressing control cells show additional growth into the brain, with a displacing rather than an infiltrating type of growth (Figure 7B III, V). These data indicate that DEP‐1 loss may promote an invasive phenotype of meningioma cells.
Figure 7.
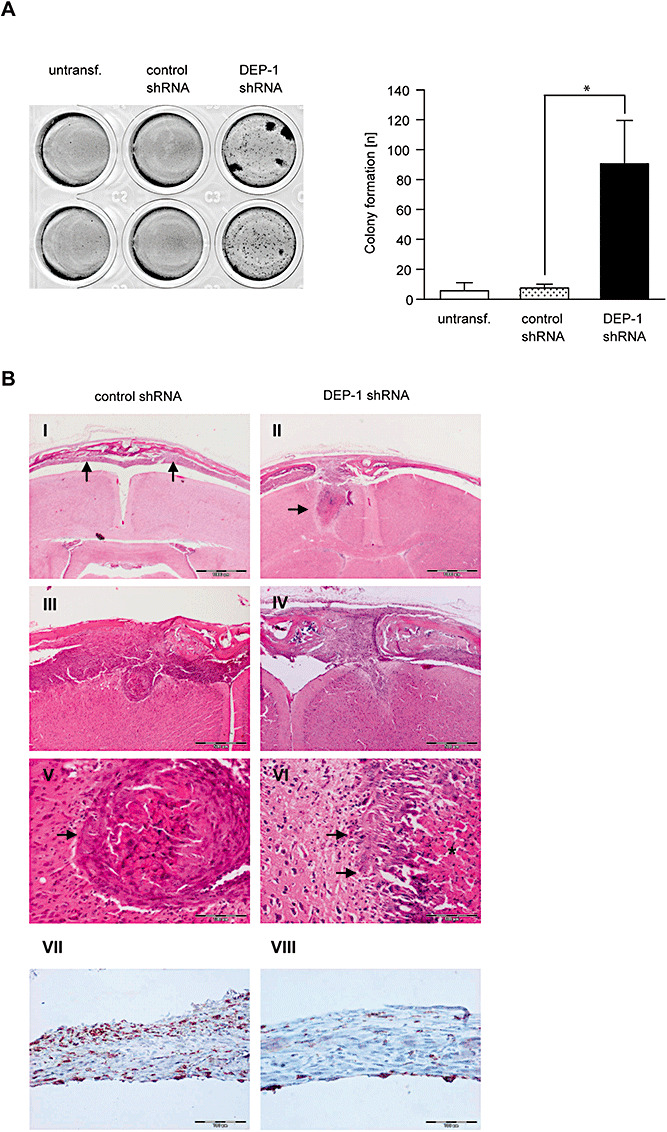
DEP‐1 knockdown promotes meningeal cell transformation and invasion. A. Parental KT21 cells, KT21 cells stably transfected with non‐targeting shRNA, or with DEP‐1‐targeting shRNA, as indicated, were grown in soft agar for 15 days. Colonies were stained with MTT and counted. An example and quantification of three independent experiments with quadruplicate determination are depicted. B. KT21 cells stably transfected with non‐targeting shRNA, or with DEP‐1‐targeting shRNA as indicated were stereotactically transplanted into the prefrontal cortex of NMRI nu/nu mice. Tumor growth and brain invasion were analyzed histologically. Scale bars represent 1000 µm (I, II) 500 µm (III, IV), and 100 µm (V–VIII). V and VI are higher magnifications of III and IV, respectively. The arrows indicate tumor tissue in (I) and brain invasion of tumor cells in (II). While KT21 meningioma cells bearing control shRNA show a more displacing mode of brain invasion (III; arrow in V), DEP1‐depleted KT21 cells were characterized by a more diffuse type of brain invasion (IV; arrows in VI; asterisk marks tumor necrosis). Immunostaining of paraffin‐embedded intracranial tumors derived from control (VII) or DEP‐1 knockdown (VIII) cells using an anti‐DEP‐1 antibody revealed maintenance of the DEP‐1 status throughout the experiment (scale bar 100 µm).
DISCUSSION
The present study demonstrates that allelic loss and diminished expression of DEP‐1 occurs in a significant fraction of human meningiomas. When loss of DEP‐1 expression was recapitulated using RNAi technology in meningeal cell lines, this led to elevated anchorage‐independent growth. Moreover, the cells exhibited a strongly elevated motility. In an orthotopic xenotransplantation experiment with KT21 cells, invasive tumor growth was observed for DEP‐1‐depleted cells in three out of five mice, indicating that DEP‐1 loss may also translate into increased motility in vivo.
DEP‐1/PTPRJ has previously been hypothesized to function as a tumor suppressor for different tumor entities, including colorectal, pancreatic and mammary carcinoma 22, 42, 43, 53. Consistent with such a role, re‐expression and overexpression of DEP‐1 in corresponding cell lines suppressed the transformed phenotype 3, 22, 53. Loss‐of‐function experiments supporting a tumor suppressor function are, however, lacking. Notably, genetic inactivation of the DEP‐1 encoding gene Ptprj in mice did not lead to spontaneous tumorigenesis in any tissue (54). The difficulties in unequivocally demonstrating the tumor suppressive functions of DEP‐1 may have different reasons. On the one hand, redundancy in function with other PTPs may obscure a role of DEP‐1 in loss‐of‐function studies. It has recently been elegantly demonstrated that DEP‐1 and CD45 have an overlapping redundant function for B‐cell maturation. This role was not readily apparent in Ptprj knockout mice, and only became obvious in CD45/Ptprj double knockouts (56). Similarly, other PTPs may cooperate with DEP‐1 and have the capacity to compensate for its loss of function. On the other hand, DEP‐1 loss presumably cooperates with further genetic lesions in tumorigenesis. Phenotypes of DEP‐1 loss may not be easily detectable in the context of either the absence of additional alterations in normal cells, or at a late stage of tumorigenesis when many further mutations have already accumulated. Genetic alterations in meningiomas may be less complex than in other solid tumors, possibly facilitating detection of the effect of DEP‐1 loss.
A common genetic lesion in meningioma is the loss of NF2, also designated merlin, a member of the ezrin‐radixin‐moesin (ERM) protein family 4, 5, 25, 39. Merlin interacts with the CD44 cell adhesion receptor and with paxillin, and negatively regulates Ras and Rac signaling (32). Our LOH analysis revealed simultaneous loss of NF2 and PTPRJ alleles in a subset of tumors, notably in most of the advanced meningiomas. KT21 cells express low levels of NF2/merlin, and DEP‐1 knockdown in this background was correlated with invasive growth. Loss of DEP‐1 and merlin might synergize in causing an invasive growth. This possibility needs further investigation, notably by comparing invasive features of cells with different combinations of DEP‐1 and NF2/merlin expression.
Different molecular mechanisms have been previously proposed to mediate a potential tumor suppressor function of DEP‐1, inhibition of receptor tyrosine kinase signaling in particular. PDGF‐receptor has been suggested to be a DEP‐1 substrate on the basis of overexpression and in vitro experiments 16, 23, 24, 37. We found increased PDGF responses in DEP‐1‐depleted meningioma cells, both in signaling studies and measuring cell motility as a biological endpoint. Among the analyzed signaling mediators, only PLCγ appeared to be regulated differentially. PLCγ is known to critically contribute to PDGF‐driven cell migration (41), and may also serve as a direct target of DEP‐1 as suggested by previous findings in T‐cells (2).
Our studies identified also cell‐matrix adhesion as a process critically controlled by DEP‐1 in meningeal cells. DEP‐1 depletion led to reduced adhesion to different matrices. Thus, our loss‐of‐function analysis confirms previous proposals of DEP‐1‐mediated regulation of cell‐matrix adhesion, based on overexpression studies 16, 35. It is tempting to speculate that this phenotype contributes to elevated motility, in conjunction with enhanced PDGFR signaling. Cell‐matrix adhesion has to be tightly regulated in the course of cell migration (52). It will be important to analyze more closely the role of DEP‐1 for directional migration and its function at the front and the rear of migrating cells. Reduced paxillin phosphorylation and reduced formation of focal adhesions in DEP‐1‐depleted cells are consistent with an adhesion defect. Attempts to trap DEP‐1 targets recovered several focal adhesion complex components, including FAK and paxillin. Both are, however, unlikely to be direct substrates of DEP‐1. We propose that these proteins are part of larger complexes which also contain direct DEP‐1 substrate(s). Recently, an activation defect has been described in platelets from DEP‐1 knockout mice (47). Signaling downstream of GPVI, and of αIIbβ3 integrin is strongly impaired in DEP‐1‐deficient platelets, and platelet aggregration as well as adhesion and spreading of megakaryocytes are diminished. Direct substrates of DEP‐1 in this context are presumably the Src‐family kinases Lyn and pp60c‐src, which are activated by DEP‐1 through dephosphorylation of their C‐terminal inhibitory phosphotyrosines. It is possible that similar steps are involved in regulation of meningeal cell adhesion by DEP‐1. This will be addressed in future experiments.
Taken together, we have shown by loss‐of‐function analyses that DEP‐1 inhibits motility and presumably invasion of meningioma cells and identified enhanced PDGFR signaling, reduced cell‐matrix adhesion, and enhanced cell motility as phenotypes of DEP‐1‐deficient cells. These findings disclose functions of DEP‐1 in adherent cells, which may be of more general importance with respect to its proposed role as a tumor suppressor.
Supporting information
Figure S1. Examples for LOH analysis. Electropherograms of PCR products of two microsatellite markers located in the NF2 and DEP‐1 region, respectively, are shown. A difference of 30% or more in the intensity ratio of the two alleles in tumor DNA compared to normal tissue DNA was considered as LOH.
Figure S2. DEP‐1 is a negative regulator of meningioma cell migration. Wounding assays with untransfected KT21 cells or cells transiently transfected with DEP‐1‐ targeting or a control siRNA. The assays were performed 72 h after transfection. Images of three positions were taken 0 h and 20 h after wounding, and the area of the wound covered with cells after 20 h was quantified (mean values ± SD of three independent experiments, *P < 0.05 by t‐test).
Figure S3. A DEP‐1 trapping mutant binds to focal adhesion components, and DEP‐1 expression positively correlates with paxillin phosphorylation. A. GST fusion proteins of the DEP‐1 catalytic domain 'wild type (WT) or D1205A trapping mutant (DA)' covalently coupled to agarose beads were incubated with lysates of pervanadate treated or untreated DEP‐1 negative SW480 cells. As control, uncoupled beads were incubated with cell lysate (lane 6), and beads coupled to the DEP‐1‐D1205A catalytic domain were incubated with lysis buffer (lane 5). Trapped proteins eluted from the beads were separated by SDS‐PAGE and analyzed by immunoblotting. For comparison, SW480 lysate (approximately 1% of the substrate trapping input) was loaded on the gel. B. HCT116 cells stably transfected with DEP‐1‐targeting or control shRNA expression constructs were trypsinized, starved in suspension and seeded in fibronectin‐coated plates. After the indicated times, adherent cells were lysed and lysates were analyzed by immunoblotting. C. SW480 cells stably transfected with an inducible DEP‐1 expression construct were grown in the presence (repressed expression) or absence (induced expression) of anhydrotetracycline. Cells were lysed and analyzed by immunoblotting.
Figure S4. Impaired adhesion of DEP‐1‐depleted cells. A. KT21 cells stably transfected with non‐targeting shRNA, or with DEP‐1‐targeting shRNA, as indicated, were seeded on fibronectin‐coated cover slips. After indicated times, cells were fixed and filamentous actin was stained with TRITC‐phalloidin. A representative example is shown. B. SF3061 cells stably transfected with DEP‐1‐targeting or control shRNA expression constructs were fluorescently labeled with CellTracker™ Green CMFDA and starved for 1 h in suspension before they were seeded in 96‐well plates coated with the indicated matrix proteins. At different time points, non‐adherent cells were removed, adherent cells were lysed, and fluorescence of the lysates was determined. Measurements were performed in six replicates; fluorescence was normalized to the 120 min value of the control shRNA transfected cell line. Graphs display mean ± SEM of four independent experiments; two‐way ANOVA and Bonferroni's multiple comparison test was applied to test for significant differences between the two cell lines (*P < 0.05).
Table S1. LOH of PTPRJ and NF2 in human meningiomas. Results for individual genetic markers.
Table S2. Histological features of tumors formed by KT21 cells in an orthotopic xenotransplantation model.
Supporting info item
ACKNOWLEDGMENTS
The authors acknowledge support by the Deutsche Forschungsgemeinschaft (SFB604, A1, to F.D.B and C.M.), and from the Marie Curie Network MRTN‐CT‐2006‐035830 (to F.D.B.). Meningioma research of C.M. is further supported by the Deutsche Krebshilfe, grant #108987, and the Wilhelm Sander Stiftung, grant #2010.017.1. We are grateful to Drs Anita Lal, Werner Paulus and David Gutmann for the kind provision of meningioma cell lines, and to Nadine Andrae and Ines Schellhase for providing data sets.
REFERENCES
- 1. Autschbach F, Palou E, Mechtersheimer G, Rohr C, Pirotto F, Gassler N et al (1999) Expression of the membrane protein tyrosine phosphatase CD148 in human tissues. Tissue Antigens 54:485–498. [DOI] [PubMed] [Google Scholar]
- 2. Baker JE, Majeti R, Tangye SG, Weiss A (2001) Protein tyrosine phosphatase CD148‐mediated inhibition of T‐cell receptor signal transduction is associated with reduced LAT and phospholipase Cgamma1 phosphorylation. Mol Cell Biol 21:2393–2403. [DOI] [PMC free article] [PubMed] [Google Scholar]
- 3. Balavenkatraman KK, Jandt E, Friedrich K, Kautenburger T, Pool‐Zobel BL, Östman A, Böhmer FD (2006) DEP‐1 protein tyrosine phosphatase inhibits proliferation and migration of colon carcinoma cells and is upregulated by protective nutrients. Oncogene 25:6319–6324. [DOI] [PubMed] [Google Scholar]
- 4. Baser ME, Poussaint TY (2006) Age associated increase in the prevalence of chromosome 22q loss of heterozygosity in histological subsets of benign meningioma. J Med Genet 43:285–287. [DOI] [PMC free article] [PubMed] [Google Scholar]
- 5. Baser ME, Evans DGR, Gutmann DH (2003) Neurofibromatosis 2. Curr Opin Neurol 16:27–33. [DOI] [PubMed] [Google Scholar]
- 6. Beyer WR, Westphal M, Ostertag W, von Laer D (2002) Oncoretrovirus and lentivirus vectors pseudotyped with lymphocytic choriomeningitis virus glycoprotein: generation, concentration, and broad host range. J Virol 76:1488–1495. [DOI] [PMC free article] [PubMed] [Google Scholar]
- 7. Böhmer FD, Karagyozov L, Uecker A, Serve H, Botzki A, Mahboobi S, Dove S (2003) A single amino acid exchange inverts susceptibility of related receptor tyrosine kinases for the ATP site inhibitor STI‐571. J Biol Chem 278:5148–5155. [DOI] [PubMed] [Google Scholar]
- 8. Chabot C, Spring K, Gratton JP, Elchebly M, Royal I (2009) New role for the protein tyrosine phosphatase DEP‐1 in Akt activation and endothelial cell survival. Mol Cell Biol 29:241–253. [DOI] [PMC free article] [PubMed] [Google Scholar]
- 9. Cuevas IC, Slocum AL, Jun P, Costello JF, Bollen AW, Riggins GJ et al (2005) Meningioma transcript profiles reveal deregulated Notch signaling pathway. Cancer Res 65:5070–5075. [DOI] [PubMed] [Google Scholar]
- 10. Ding L, Ellis MJ, Li S, Larson DE, Chen K, Wallis JW et al (2010) Genome remodelling in a basal‐like breast cancer metastasis and xenograft. Nature 464:999–1005. [DOI] [PMC free article] [PubMed] [Google Scholar]
- 11. Dull T, Zufferey R, Kelly M, Mandel RJ, Nguyen M, Trono D, Naldini L (1998) A third‐generation lentivirus vector with a conditional packaging system. J Virol 72:8463–8471. [DOI] [PMC free article] [PubMed] [Google Scholar]
- 12. Flint AJ, Tiganis T, Barford D, Tonks NK (1997) Development of “substrate‐trapping” mutants to identify physiological substrates of protein tyrosine phosphatases. Proc Natl Acad Sci U S A 94:1680–1685. [DOI] [PMC free article] [PubMed] [Google Scholar]
- 13. Haase D, Schmidl S, Ewald C, Kalff R, Huebner C, Firsching R et al (2010) Fatty acid synthase as a novel target for meningioma therapy. Neuro Oncol 12:844–854. [DOI] [PMC free article] [PubMed] [Google Scholar]
- 14. Iervolino A, Iuliano R, Trapasso F, Viglietto G, Melillo RM, Carlomagno F et al (2006) The receptor‐type protein tyrosine phosphatase J antagonizes the biochemical and biological effects of RET‐derived oncoproteins. Cancer Res 66:6280–6287. [DOI] [PubMed] [Google Scholar]
- 15. Iuliano R, Trapasso F, Le Pera I, Schepis F, Sama I, Clodomiro A et al (2003) An adenovirus carrying the rat protein tyrosine phosphatase eta suppresses the growth of human thyroid carcinoma cell lines in vitro and in vivo . Cancer Res 63:882–886. [PubMed] [Google Scholar]
- 16. Jandt E, Denner K, Kovalenko M, Östman A, Böhmer FD (2003) The protein‐tyrosine phosphatase DEP‐1 modulates growth factor‐stimulated cell migration and cell‐matrix adhesion. Oncogene 22:4175–4185. [DOI] [PubMed] [Google Scholar]
- 17. Kalamarides M, Niwa‐Kawakita M, Leblois H, Abramowski V, Perricaudet M, Janin A et al (2002) Nf2 gene inactivation in arachnoidal cells is rate‐limiting for meningioma development in the mouse. Genes Dev 16:1060–1065. [DOI] [PMC free article] [PubMed] [Google Scholar]
- 18. Kalamarides M, Stemmer‐Rachamimov AO, Takahashi M, Han ZY, Chareyre F, Niwa‐Kawakita M et al (2008) Natural history of meningioma development in mice reveals: a synergy of Nf2 and p16(Ink4a) mutations. Brain Pathol 18:62–70. [DOI] [PMC free article] [PubMed] [Google Scholar]
- 19. Kappert K, Paulsson J, Sparwel J, Leppanen O, Hellberg C, Östman A, Micke P (2007) Dynamic changes in the expression of DEP‐1 and other PDGF receptor‐antagonizing PTPs during onset and termination of neointima formation. Faseb J 21:523–534. [DOI] [PubMed] [Google Scholar]
- 20. Karagyozov L, Godfrey R, Böhmer SA, Petermann A, Hölters S, Östman A, Böhmer FD (2008) The structure of the 5′‐end of the protein‐tyrosine phosphatase PTPRJ mRNA reveals a novel mechanism for translation attenuation. Nucleic Acids Res 36:4443–4453. [DOI] [PMC free article] [PubMed] [Google Scholar]
- 21. Kaufman DL, Heinrich BS, Willett C, Perry A, Finseth F, Sobel RA, MacCollin M (2003) Somatic instability of the NF2 gene in schwannomatosis. Arch Neurol 60:1317–1320. [DOI] [PubMed] [Google Scholar]
- 22. Keane MM, Lowrey GA, Ettenberg SA, Dayton MA, Lipkowitz S (1996) The protein tyrosine phosphatase DEP‐1 is induced during differentiation and inhibits growth of breast cancer cells. Cancer Res 56:4236–4243. [PubMed] [Google Scholar]
- 23. Kellie S, Craggs G, Bird IN, Jones GE (2004) The tyrosine phosphatase DEP‐1 induces cytoskeletal rearrangements, aberrant cell‐substratum interactions and a reduction in cell proliferation. J Cell Sci 117:609–618. [DOI] [PubMed] [Google Scholar]
- 24. Kovalenko M, Denner K, Sandström J, Persson C, Gross S, Jandt E et al (2000) Site‐selective dephosphorylation of the platelet‐derived growth factor beta‐receptor by the receptor‐like protein‐tyrosine phosphatase DEP‐1. J Biol Chem 275:16219–16226. [DOI] [PubMed] [Google Scholar]
- 25. Lallemand D, Manent J, Couvelard A, Watilliaux A, Siena M, Chareyre F et al (2009) Merlin regulates transmembrane receptor accumulation and signaling at the plasma membrane in primary mouse Schwann cells and in human schwannomas. Oncogene 28:854–865. [DOI] [PubMed] [Google Scholar]
- 26. Louis DN, Ohgaki H, Wiestler OD, Cavenee WK, Burger PC, Jouvet A et al (2007) The 2007 WHO classification of tumours of the central nervous system. Acta Neuropathol 114:97–109. [DOI] [PMC free article] [PubMed] [Google Scholar]
- 27. MacKeigan JP, Murphy LO, Blenis J (2005) Sensitized RNAi screen of human kinases and phosphatases identifies new regulators of apoptosis and chemoresistance. Nat Cell Biol 7:591–600. [DOI] [PubMed] [Google Scholar]
- 28. Marosi C, Hassler M, Roessler K, Reni M, Sant M, Mazza E, Vecht C (2008) Meningioma. Crit Rev Oncol Hematol 67:153–171. [DOI] [PubMed] [Google Scholar]
- 29. Mawrin C, Perry A (2010) Pathological classification and molecular genetics of meningiomas. J Neurooncol 99:379–391. [DOI] [PubMed] [Google Scholar]
- 30. Mawrin C, Sasse T, Kirches E, Kropf S, Schneider T, Grimm C et al (2005) Different activation of mitogen‐activated protein kinase and Akt signaling is associated with aggressive phenotype of human meningiomas. Clin Cancer Res 11:4074–4082. [DOI] [PubMed] [Google Scholar]
- 31. Mawrin C, Wolke C, Haase D, Kruger S, Firsching R, Keilhoff G et al (2010) Reduced activity of CD13/Aminopeptidase N (APN) in aggressive meningiomas is associated with increased levels of SPARC. Brain Pathol 20:200–210. [DOI] [PMC free article] [PubMed] [Google Scholar]
- 32. Morrison H, Sperka T, Manent J, Giovannini M, Ponta H, Herrlich P (2007) Merlin/neurofibromatosis type 2 suppresses growth by inhibiting the activation of Ras and Rac. Cancer Res 67:520–527. [DOI] [PubMed] [Google Scholar]
- 33. Östman A, Yang Q, Tonks NK (1994) Expression of DEP‐1, a receptor‐like protein‐tyrosine‐phosphatase, is enhanced with increasing cell density. Proc Natl Acad Sci U S A 91:9680–9684. [DOI] [PMC free article] [PubMed] [Google Scholar]
- 34. Palka HL, Park M, Tonks NK (2003) Hepatocyte growth factor receptor tyrosine kinase met is a substrate of the receptor protein‐tyrosine phosphatase DEP‐1. J Biol Chem 278:5728–5735. [DOI] [PubMed] [Google Scholar]
- 35. Pera IL, Iuliano R, Florio T, Susini C, Trapasso F, Santoro M et al (2005) The rat tyrosine phosphatase eta increases cell adhesion by activating c‐Src through dephosphorylation of its inhibitory phosphotyrosine residue. Oncogene 24:3187–3195. [DOI] [PubMed] [Google Scholar]
- 36. Perry A, Gutmann DH, Reifenberger G (2004) Molecular pathogenesis of meningiomas. J Neurooncol 70:183–202. [DOI] [PubMed] [Google Scholar]
- 37. Persson C, Engström U, Mowbray SL, Östman A (2002) Primary sequence determinants responsible for site‐selective dephosphorylation of the PDGF beta‐receptor by the receptor‐like protein tyrosine phosphatase DEP‐1. FEBS Lett 517:27–31. [DOI] [PubMed] [Google Scholar]
- 38. Puttmann S, Senner V, Braune S, Hillmann B, Exeler R, Rickert CH, Paulus W (2005) Establishment of a benign meningioma cell line by hTERT‐mediated immortalization. Lab Invest 85:1163–1171. [DOI] [PubMed] [Google Scholar]
- 39. Riemenschneider MJ, Perry A, Reifenberger G (2006) Histological classification and molecular genetics of meningiomas. Lancet Neurol 5:1045–1054. [DOI] [PubMed] [Google Scholar]
- 40. Rodriguez F, Vacaru A, Overvoorde J, den Hertog J (2008) The receptor protein‐tyrosine phosphatase, Dep1, acts in arterial/venous cell fate decisions in zebrafish development. Dev Biol 324:122–130. [DOI] [PubMed] [Google Scholar]
- 41. Rönnstrand L, Heldin CH (2001) Mechanisms of platelet‐derived growth factor‐induced chemotaxis. Int J Cancer 91:757–762. [DOI] [PubMed] [Google Scholar]
- 42. Ruivenkamp C, Hermsen M, Postma C, Klous A, Baak J, Meijer G, Demant P (2003) LOH of PTPRJ occurs early in colorectal cancer and is associated with chromosomal loss of 18q12‐21. Oncogene 22:3472–3474. [DOI] [PubMed] [Google Scholar]
- 43. Ruivenkamp CA, van Wezel T, Zanon C, Stassen AP, Vlcek C, Csikos T et al (2002) Ptprj is a candidate for the mouse colon‐cancer susceptibility locus Scc1 and is frequently deleted in human cancers. Nat Genet 31:295–300. [DOI] [PubMed] [Google Scholar]
- 44. Ruttledge MH, Sarrazin J, Rangaratnam S, Phelan CM, Twist E, Merel P et al (1994) Evidence for the complete inactivation of the NF2 gene in the majority of sporadic meningiomas. Nat Genet 6:180–184. [DOI] [PubMed] [Google Scholar]
- 45. Sacco F, Tinti M, Palma A, Ferrari E, Nardozza AP, Hooft van Huijsduijnen R et al (2009) Tumor suppressor density‐enhanced phosphatase‐1 (DEP‐1) inhibits the RAS pathway by direct dephosphorylation of ERK1/2 kinases. J Biol Chem 284:22048–22058. [DOI] [PMC free article] [PubMed] [Google Scholar]
- 46. Schoeler S, Szibor R, Gellerich FN, Wartmann T, Mawrin C, Dietzmann K, Kirches E (2005) Mitochondrial DNA deletions sensitize cells to apoptosis at low heteroplasmy levels. Biochem Biophys Res Commun 332:43–49. [DOI] [PubMed] [Google Scholar]
- 47. Senis YA, Tomlinson MG, Ellison S, Mazharian A, Lim J, Zhao Y et al (2009) The tyrosine phosphatase CD148 is an essential positive regulator of platelet activation and thrombosis. Blood 113:4942–4954. [DOI] [PMC free article] [PubMed] [Google Scholar]
- 48. Shamah SM, Alberta JA, Giannobile WV, Guha A, Kwon YK, Carroll RS et al (1997) Detection of activated platelet‐derived growth factor receptors in human meningioma. Cancer Res 57:4141–4147. [PubMed] [Google Scholar]
- 49. Surace EI, Lusis E, Haipek CA, Gutmann DH (2004) Functional significance of S6K overexpression in meningioma progression. Ann Neurol 56:295–298. [DOI] [PubMed] [Google Scholar]
- 50. Takahashi T, Takahashi K, St John PL, Fleming PA, Tomemori T, Watanabe T et al (2003) A mutant receptor tyrosine phosphatase, CD148, causes defects in vascular development. Mol Cell Biol 23:1817–1831. [DOI] [PMC free article] [PubMed] [Google Scholar]
- 51. Tanaka K, Sato C, Maeda Y, Koike M, Matsutani M, Yamada K, Miyaki M (1989) Establishment of a human malignant meningioma cell line with amplified c‐myc oncogene. Cancer 64:2243–2249. [DOI] [PubMed] [Google Scholar]
- 52. Tomar A, Schlaepfer DD (2009) Focal adhesion kinase: switching between GAPs and GEFs in the regulation of cell motility. Curr Opin Cell Biol 21:676–683. [DOI] [PMC free article] [PubMed] [Google Scholar]
- 53. Trapasso F, Yendamuri S, Dumon KR, Iuliano R, Cesari R, Feig B et al (2004) Restoration of receptor‐type protein tyrosine phosphatase eta function inhibits human pancreatic carcinoma cell growth in vitro and in vivo . Carcinogenesis 25:2107–2114. [DOI] [PubMed] [Google Scholar]
- 54. Trapasso F, Drusco A, Costinean S, Alder H, Aqeilan RI, Iuliano R et al (2006) Genetic ablation of Ptprj, a mouse cancer susceptibility gene, results in normal growth and development and does not predispose to spontaneous tumorigenesis. DNA Cell Biol 25:376–382. [DOI] [PubMed] [Google Scholar]
- 55. Tsuboi N, Utsunomiya T, Roberts RL, Ito H, Takahashi K, Noda M, Takahashi T (2008) The tyrosine phosphatase CD148 interacts with the p85 regulatory subunit of phosphoinositide 3‐kinase. Biochem J 413:193–200. [DOI] [PubMed] [Google Scholar]
- 56. Zhu JW, Brdicka T, Katsumoto TR, Lin J, Weiss A (2008) Structurally distinct phosphatases CD45 and CD148 both regulate B cell and macrophage immunoreceptor signaling. Immunity 28:183–196. [DOI] [PMC free article] [PubMed] [Google Scholar]
Associated Data
This section collects any data citations, data availability statements, or supplementary materials included in this article.
Supplementary Materials
Figure S1. Examples for LOH analysis. Electropherograms of PCR products of two microsatellite markers located in the NF2 and DEP‐1 region, respectively, are shown. A difference of 30% or more in the intensity ratio of the two alleles in tumor DNA compared to normal tissue DNA was considered as LOH.
Figure S2. DEP‐1 is a negative regulator of meningioma cell migration. Wounding assays with untransfected KT21 cells or cells transiently transfected with DEP‐1‐ targeting or a control siRNA. The assays were performed 72 h after transfection. Images of three positions were taken 0 h and 20 h after wounding, and the area of the wound covered with cells after 20 h was quantified (mean values ± SD of three independent experiments, *P < 0.05 by t‐test).
Figure S3. A DEP‐1 trapping mutant binds to focal adhesion components, and DEP‐1 expression positively correlates with paxillin phosphorylation. A. GST fusion proteins of the DEP‐1 catalytic domain 'wild type (WT) or D1205A trapping mutant (DA)' covalently coupled to agarose beads were incubated with lysates of pervanadate treated or untreated DEP‐1 negative SW480 cells. As control, uncoupled beads were incubated with cell lysate (lane 6), and beads coupled to the DEP‐1‐D1205A catalytic domain were incubated with lysis buffer (lane 5). Trapped proteins eluted from the beads were separated by SDS‐PAGE and analyzed by immunoblotting. For comparison, SW480 lysate (approximately 1% of the substrate trapping input) was loaded on the gel. B. HCT116 cells stably transfected with DEP‐1‐targeting or control shRNA expression constructs were trypsinized, starved in suspension and seeded in fibronectin‐coated plates. After the indicated times, adherent cells were lysed and lysates were analyzed by immunoblotting. C. SW480 cells stably transfected with an inducible DEP‐1 expression construct were grown in the presence (repressed expression) or absence (induced expression) of anhydrotetracycline. Cells were lysed and analyzed by immunoblotting.
Figure S4. Impaired adhesion of DEP‐1‐depleted cells. A. KT21 cells stably transfected with non‐targeting shRNA, or with DEP‐1‐targeting shRNA, as indicated, were seeded on fibronectin‐coated cover slips. After indicated times, cells were fixed and filamentous actin was stained with TRITC‐phalloidin. A representative example is shown. B. SF3061 cells stably transfected with DEP‐1‐targeting or control shRNA expression constructs were fluorescently labeled with CellTracker™ Green CMFDA and starved for 1 h in suspension before they were seeded in 96‐well plates coated with the indicated matrix proteins. At different time points, non‐adherent cells were removed, adherent cells were lysed, and fluorescence of the lysates was determined. Measurements were performed in six replicates; fluorescence was normalized to the 120 min value of the control shRNA transfected cell line. Graphs display mean ± SEM of four independent experiments; two‐way ANOVA and Bonferroni's multiple comparison test was applied to test for significant differences between the two cell lines (*P < 0.05).
Table S1. LOH of PTPRJ and NF2 in human meningiomas. Results for individual genetic markers.
Table S2. Histological features of tumors formed by KT21 cells in an orthotopic xenotransplantation model.
Supporting info item