

Abstract
Multiple sclerosis (MS) is a demyelinating disease of the central nervous system (CNS). Microarray‐based global gene expression profiling is a promising method, used to study potential genes involved in the pathogenesis of the disease. In the present study, we have examined global gene expression in normal‐appearing gray matter and gray matter lesions from the cortex of MS patients, and compared them with cortical gray matter samples from controls. We observed a massive upregulation of immunoglobulin (Ig)‐related genes in cortical sections of MS patients. Using immunohistochemistry, the activation of Ig genes seems to occur within plasma cells in the meninges. As synthesis of oligoclonal IgGs has been hypothesized to be caused by the activation of Epstein–Barr virus (EBV)‐infected B‐cells, we screened the brain samples for the presence of EBV by real‐time quantitative polymerase chain reaction (qPCR) and immunohistochemistry, but no evidence of active or latent EBV infection was detected. This study demonstrates that genes involved in the synthesis of Igs are upregulated in MS patients and that this activation is caused by a small number of meningeal plasma cells that are not infected by EBV. The findings indicate that the Ig‐producing B‐cells found in the cerebrospinal fluid (CSF) of MS patients could have meningeal origin.
Keywords: EBV, Epstein–Barr virus, immunoglobulin, microarray, multiple sclerosis
BACKGROUND
Multiple sclerosis (MS) is a demyelinating disease of the central nervous system (CNS). The etiology is unknown, but environmental factors as well as multiple separate genetic loci contribute to the disease's susceptibility (6). The disease is characterized by multifocal demyelination, inflammation and axonal loss leading to neuronal dysfunction (17). The affected discrete areas of the CNS are called MS lesions. The lesions can appear in any location in the CNS parenchyma, and thus, generate a wide range of symptoms and functional deficits. The pathogenesis of MS lesions has been extensively studied, but there is still controversy regarding the initial events of lesion formation (11).
Microarray‐based global gene expression profiling is a promising method, used to study potential genes involved in the pathogenesis of MS. Previous studies have mainly focused on white matter tissue, which is known to have disrupted tissue cytoarchitecture and extensive T‐cell and monocyte infiltration within active lesions 12, 33, 36. MS lesions are also present in the cerebral cortex, and cortical plaques have been found to constitute a significant proportion of such lesions in the brain 3, 5, 25. The cytoarchitecture of cortical lesions is usually well preserved, and there is no significant T‐cell infiltration compared with control areas (2). Inflammatory changes are thus less pronounced in gray matter lesions, and the chance of identifying inflammation‐independent gene expression changes is expectedly higher than in white matter lesions. To date, there have been only two studies on global gene expression in the cortex of MS patients, and these works suggested that the patients had reduced mitochondrial gene expression and dysfunctioning mitochondria in cortical neurons 8, 9.
In the present study, we have examined global gene expression in normal‐appearing gray matter and gray matter lesions from the cortex of MS patients, and compared them with gray matter samples from controls. We observed a strong upregulation of immunoglobulin (Ig)‐related genes in cortical sections of MS patients and validated the results with TaqMan‐based real‐time quantitative polymerase chain reaction (qPCR). We also used immunohistochemical techniques to determine which cells caused this Ig upregulation and where they were located. It has been recently suggested that oligoclonal bands (OCBs) might be caused by Epstein–Barr virus (EBV)‐infected B‐cells in the CNS (29). As we detected a massive upregulation of Ig genes in this study, qPCR and immunohistochemistry were performed for detecting both potential EBV transcripts and proteins.
MATERIALS AND METHODS
Tissue collection and patient characterization
For microarray examination, brain samples from six patients with MS and eight control patients without any signs of neurological disease were obtained from the Dutch Brain Bank, the Netherlands. The mean age of MS cases was 49.2 years (range 41–58) with a mean postmortem delay of 8.6 h (range 8–11). The mean age of the control cases was 81.9 years (range 74–89) with a mean postmortem delay of 7.3 h (range 4–15). For qPCR validation, five additional MS patients and four additional controls were included. The mean age of these MS patients was 57.8 years (range 34–75) with a mean postmortem delay of 10.7 h (range 6–18), and the mean age of these controls was 73.7 years (range 57–82) with a postmortem delay of 6.7 h (range 5–8) (Table 1).
Table 1.
Clinical data and characterization of samples from patients with multiple sclerosis (MS) and control cases (C). The samples included in the microarray study are marked with “+.” The results were verified with TaqMan real‐time quantitative polymerase chain reaction (qPCR). As an independent validation of the results, five MS patients and four controls not included in the microarray were included in the qPCR validation (marked with “+” in the qPCR, but not in the array, column). Abbreviations: F = female; M = male; NA = Not available; PR = progressive relapsing; SP = secondary progressive.
| Patient ID | Age (year) | Sex | Postmortem interval (h) | Type of MS | Disease duration (year) | Cause of death | Array | qPCR |
|---|---|---|---|---|---|---|---|---|
| MS 01 | 52 | F | 8.3 | SP | >12 | Respiratory failure | + | + |
| MS 02 | 41 | F | 8.3 | SP | >11 | MS | + | + |
| MS 03 | 48 | F | 8.1 | SP | 8 | Euthanasia | + | + |
| MS 04 | 43 | M | 8.3 | SP | 11 | Pneumonia | + | + |
| MS 05 | 53 | F | 10.5 | SP | 27 | Euthanasia | + | + |
| MS 06 | 58 | F | 8.1 | NA | NA | Unknown | + | + |
| MS 07 | 65 | M | 10.4 | PR | 21 | Urosepsis | + | |
| MS 08 | 75 | F | 8.0 | SP | 42 | Euthanasia | + | |
| MS 09 | 34 | M | 18.0 | NA | NA | Unknown | + | |
| MS 10 | 70 | F | 6.3 | NA | 27 | Urosepsis | + | |
| MS 11 | 45 | F | 10.6 | SP | 14 | Unknown | + | |
| C 01 | 81 | F | 6.4 | — | — | Euthanasia | + | + |
| C 02 | 85 | M | 4.2 | — | — | Cardiac failure | + | + |
| C 03 | 88 | F | 6.2 | — | — | Unknown | + | + |
| C 04 | 65 | M | 5.0 | — | — | Cachexia/dehydration | + | + |
| C 05 | 89 | F | 15.4 | — | — | Cachexia/dehydration | + | + |
| C 06 | 86 | F | 6.3 | — | — | Cardiac failure | + | + |
| C 07 | 87 | M | 10.2 | — | — | Pneumonia | + | + |
| C 08 | 74 | M | 5.0 | — | — | Bronchus carcinoma | + | + |
| C 09 | 77 | F | 8.2 | — | — | Cachexia | + | |
| C 10 | 57 | M | 5.4 | — | — | Unknown | + | |
| C 11 | 82 | F | 7.0 | — | — | Aspiration pneumonia | + | |
| C 12 | 79 | M | 6.3 | — | — | Stroke | + |
The MS tissue specimens from the Dutch Brain Bank were sampled using magnetic resonance imaging (MRI) as guidance. Briefly, the brains were cut into 1‐cm thick coronal slices, and MRI was performed (T1‐ and T2‐weighted spin echo) 1, 7. Subsequently, scanned slices were cut in two 5‐mm thick slices, and adjacent halves were fixed in 10% buffered formalin or snap‐frozen in liquid nitrogen. Suitable tissue blocks containing cortical demyelinated areas or adjacent non‐demyelinated areas were identified using anti‐proteolipid protein (PLP) immunohistochemistry for myelin. Gray matter lesions and adjacent normal‐appearing gray matter were then mechanically sectioned from five consecutive 20‐µm thick cryostat sections with a razor blade, by comparison with the PLP immunostained adjacent section. Control samples were treated in the same way.
Microarray experiments
Dissected regions were homogenized, and total Ribo Nucleic Acid (RNA) was extracted using the QIAGEN RNeasy® Lipid Tissue Mini Kit (Qiagen Sciences, Maryland 20874, USA). Amount and quality of the extracted RNA were verified by the NanoDrop® ND‐1000 spectrophotometer (Thermo Fisher Scientific Inc., Nanodrop Products, Wilmington, DE, USA) and the Agilent 2100 Bioanalyzer™ (Agilent Technologies, Santa Clara, CA, USA). The average total RNA yield was around 10 µg. All microarray experiments were performed using the Applied Biosystems Expression Array System (Applied Biosystems, Foster City, CA, USA), which is based upon chemiluminescence detection (31). One microgram of total RNA from each sample was reversely transcribed, amplified and DIG‐labeled using the Applied Biosystems Chemiluminescent RT‐IVT Labeling Kit™. Amount (∼50 µg) and quality of the DIG‐labeled cRNA was controlled by both NanoDrop spectrophotometer and Agilent 2100 Bioanalyzer. Twenty microgram of DIG‐labeled cRNA was hybridized to the Applied Biosystems Human Genome Survey Microarray v1.0 according to the manufacturer's instructions. The Applied Biosystems Human Microarray contains 31 700 probes against 27 868 genes, as well as about 1000 control probes. The chemiluminescent signal detection, image acquisition and image analysis of the microarrays were performed on the Applied Biosystems 1700 Chemiluminescent Microarray Analyzer.
Microarray data analysis
The Applied Biosystems Expression System software was used to extract signals and signal‐to‐noise ratios (S/N). Only microarrays showing average normalized signal intensities above 5000 and median backgrounds below 600 were included in the study. Signal intensities were imported into the J‐Express Pro V2.7™ software (MolMine, Bergen, Norway) (10), where inter‐array quantile normalization was performed in order to minimize the effect of external variables introduced into the data. Examination of similarities and differences in global gene expression profiles of the samples was carried out by principal component analysis (PCA).
Identification of probes that differed significantly in expression level (ie, hybridization signal intensity) between sample groups was carried out by significance analysis of microarrays (SAM) (34), comparing the expression levels of all probes in one group with those of the other. The SAM threshold was set to a q‐value of five (32).
Functional classification of the SAM‐generated lists of differentially expressed genes was performed by the Protein ANalysis THrough Evolutionary Relationships (PANTHER) Classification System (http://www.pantherdb.org/) (20). Both lists of up‐ and downregulated genes were compared with the entire list of genes that showed detectable expression in at least one of the samples included in the study (24 426 genes, S/N ≥ 3) on the Applied Biosystems Human Genome Survey Array. Statistically significant over‐ and underrepresented annotation categories were determined by binomial statistics, using the observed number of genes vs. the numbers expected by chance within a certain annotation group.
Validation of microarray results by TaqMan real‐time qPCR
From each sample, 50 ng of total RNA was reverse transcribed to complementary DNA (cDNA) using the High‐Capacity cDNA Reverse Transcription Kit (Applied Biosystems). The final concentrations of the reagents were as follows: 1× reverse transcription Buffer, 1× dNTP Mix (4 mM), 1× Random Primers, 2.5 U/µL MultiScribe™ Reverse Transcriptase and 1 U/µL RNase inhibitor in RNase‐free water to a total volume of 60 µL. The reaction was incubated at 25°C for 10 minutes (primer annealing), 37°C for 120 minutes (synthesis) and 85°C for 5 s (enzyme inactivation). The resulting cDNA samples were stored at −20°C. All subsequent real‐time PCR experiments were performed on the 7900HT Fast Real‐time PCR System from Applied Biosystems using 384 well plates. The real‐time PCR reaction solution contained 0.5 µL 20× TaqMan® Gene Expression assay (Applied Biosystems), 5 µL 2× TaqMan® universal PCR Master Mix, 1 µL of cDNA and RNase‐free water to a total volume of 10 µL. The real‐time PCR was run as follows: 50°C for 2 minutes (uracil‐N‐glycosylase (UNG) incubation) and 95°C for 10 minutes (AmpliTaq Gold® activation, Applieds Biosystems, Foster City, CA, USA), followed by 40 cycles of 95°C for 10 s and 60°C for 1 minute. The relative gene expression levels were determined with the comparative ΔΔCt method (38) and normalized relative to the ribosomal protein P0 gene, RPLP0, which was found to be most stabile after testing all samples on the TaqMan Human Endogenous Control Array (Applied Biosystems) (not shown), but similar results were obtained when normalizing relative to glyceraldehyde‐3‐phosphate dehydrogenase. As an independent validation of the microarray results, the TaqMan experiments included samples from five MS patients and four controls not included in the original microarray analysis (Table 1). Statistical significance of the qPCR results was tested by Student's t‐test (P < 0.01).
Real‐time qPCR assay for detection of EBV transcripts
Specific primer sequences for EBV latent (EBNA1, EBNA2, LMP1 and LMP2) and lytic (BZLF1) transcripts were obtained from Kubota and colleagues (15) (Table 2). The PCR reaction solution contained 5 µL 2× SYBRgreen® (Sigma Aldrich Corp., St. Louis, MO, USA), together with forward and reverse primers (Sigma‐Aldrich, St. Louis, MO, USA) in a final concentration of 300 nM. All PCR reactions contained 1 µL of cDNA and RNase‐free water to a total volume of 10 µL. The real‐time PCR was run as follows: 50°C for 2 minutes (UNG incubation) and 95°C for 10 minutes (AmpliTaq Gold activation), followed by 40 cycles of 95°C for 10 s and 60°C for 1 minute. In order to test the sensitivity of the qPCR assay for detection of EBV transcripts, we used a lymphoblastoid cell line transformed with B95.8 as a positive control and the EBV negative cell line CRL‐1593.2 (ATCC, Manassas, VA, USA) as a negative control. The cell pellets were stored at −80°C until use.
Table 2.
Primers used in the quantitative polymerase chain reaction detection of Epstein–Barr virus (EBV) transcripts (15). Abbreviations: F = Forward; R = Reverse.
| Target | Nucleotide sequence | |
|---|---|---|
| EBV‐LMP1 | F | 5′‐CCCTTTGTATACTCCTACTGATGATCAC‐3′ |
| R | 5′‐ACCCGAAGATGAACAGCACAAT‐3′ | |
| EBV‐LMP2 | F | 5′‐AAGATCCTTCTGGCACGACTGT‐3′ |
| R | 5′‐TGCAGAACAAATTGGGTATAAATTCA‐3′ | |
| EBV‐EBNA1 | F | 5′‐GGAGCCTGACCTGTGATCGT‐3′ |
| T | 5′‐TAGGCCATTTCCAGGTCCTGTA‐3′ | |
| EBV‐EBNA2 | F | 5′‐TTAGAGAGTGGCTGCTACGCATT‐3′ |
| T | 5′‐AGTGCTGGGTTACTGGCTAAGC‐3′ | |
| EBV‐BZLF1 | F | 5′‐ACGCACACGGAAACCACAA‐3′ |
| R | 5′‐CTTAAACTTGGCCCGGCATT‐3′ |
Immunohistochemistry
For immunohistochemistry, frozen sections were washed and postfixed for 10 minutes in 95% ethanol. Sections were incubated at room temperature (RT) (1 h) or overnight with the primary antibodies. The following primary antibodies were used: anti‐PLP (for myelin proteins; mouse IgG, AbD Serotec, Oxford, UK), anti‐CD20 (for B‐cells; mouse IgG, Dako, Glostrup, Denmark), anti‐CD3 (for T‐cells; rabbit polyclonal, Sigma‐Aldrich), anti‐CD138 (for plasma cells; mouse IgG, AbD Serotec), anti‐IgA, ‐IgG, ‐IgM, ‐kappa and ‐lambda (for Igs; rabbit polyclonal, Dako), anti‐EBNA2 (for EBV latent protein; mouse monoclonal, Abcam, Cambridge, UK) and anti‐LMP1 (for EBV latent protein; mouse monoclonal, Abcam). Sections were then blocked with peroxidase‐blocking solution (Dako), incubated with the EnVision‐goat peroxidase complex (30 minutes RT; Dako) and visualized using the EnVision 3.3‐diaminobenzidine (1:50; 10 minutes at RT; Dako). The tissue sections were counterstained with hematoxylin. A lymphoblastoid cell line transformed with B95.8 was used as a positive control for LMP1 and EBNA2. Human tonsillar tissue was used as positive control for CD3, CD20, CD138 and the Igs. Cerebellum from rat and omission of the primary antibodies were used as negative controls.
RESULTS
Global gene expression in cortical samples from MS patients and controls
Global gene expression in gray matter lesions and surrounding normal‐appearing gray matter from MS patients and gray matter from control patients were first studied by PCA. On the global level, no systematic differences could be observed between MS samples of gray matter lesions and normal‐appearing gray matter, or between gray matter from MS patients and controls (data not shown). On the gene level, no genes were found to be differentially expressed between normal‐appearing gray matter and gray matter lesions from MS patients. However, using a q‐value of five as significance threshold, a total of 572 probes were identified as differentially expressed between MS samples (both normal‐appearing gray matter and gray matter lesions) and controls (Table S1). Of these, 296 probes were downregulated and 276 probes were upregulated in MS, representing 279 and 253 unique genes, respectively. The up‐ and downregulated probes were mapped to the Panther annotation categories (20), to search for significant overrepresentations of particular functional groups, compared with the overall distribution of the 24 426 probes showing detectable expression on the AB1700 Human Genome Survey Array v1.0. The most prominent functional categories among the differentially expressed probes are presented in Table S2.
Massive upregulation of Ig‐related genes in cortical samples from MS patients
Strikingly, 39 of the 276 probes upregulated in gray matter from MS patients map to the biological process “Immunity and Defence,” of which 33 are related to B‐cell and antibody‐mediated immunity (Table S2). This finding is also reflected by the massive representation of 33 probes mapping to the molecular function Ig. No genes mapping to any of these categories were represented among the downregulated probes.
A total of 83 Ig‐related probes showed detectable expression among the MS and control samples, targeting 67 unique genes. The 33 Ig‐related probes upregulated in MS samples represent 27 unique genes, hence, almost half of all Ig‐related genes present show a significant upregulation in cortical samples of MS patients compared with controls. Closer investigation of the upregulated genes reveals that a large proportion are novel genes that are classified by Panther as belonging to Ig families based on sequence homology (Table 3). Relative expression levels for the Ig‐related genes are presented in Figure 1. The Panther families represented among the genes in Table 3 include a variety of constant and variable regions of the Ig heavy chain, as well as kappa and lambda variants of the Ig light chain. None of the Ig Fc‐receptors (FcR) was represented among the upregulated genes; however, these genes map to the category Ig receptor rather than to Ig (see ontologies at http://www.pantherdb.org). The upregulation of Ig‐related genes was found in both the sections from gray matter lesions and normal‐appearing gray matter, and there were no significant differences between these two MS samples in the degree of Ig upregulation.
Table 3.
Immunoglobulin‐related genes upregulated among multiple sclerosis patients. Abbreviations: AB = Applied Biosystems; n.d. = not detected by qPCR; qPCR = quantitative polymerase chain reaction; SAM = significance analysis of microarrays.
| Celera gene ID | Gene symbol | Gene name | AB probe ID | SAM q‐value | TaqMan ID | qPCR P‐value | Panther family name |
|---|---|---|---|---|---|---|---|
| hCG2041292 | 178480 | 0.0 | Immunoglobulin gamma heavy chain constant region (PTHR23266:SF4) | ||||
| hCG2038926 | IGHG1 | Immunoglobulin heavy constant gamma 1 | 191229 | 1.0 | Hs00378230_g1 | 1.3E‐02 | |
| hCG2003479 | IGHG3 | Immunoglobulin heavy constant gamma 3 | 121996 | 1.6 | |||
| hCG1988537 | 220939 | 3.1 | Immunoglobulin heavy chain variable region (PTHR23266:SF11) | ||||
| hCG1793614* | IGHM | Immunoglobulin heavy constant mu | 179702 | 0.0 | Immunoglobulin heavy chain variable region VH‐II (PTHR23266:SF7) | ||
| 102721 | 0.0 | ||||||
| hCG2038924 | 206632 | 0.0 | |||||
| hCG2038932 | 138080 | 0.0 | |||||
| hCG1794122 | 236107 | 0.0 | |||||
| hCG2038943 | 154783 | 1.0 | |||||
| hCG1812074 | VSIG6 | V‐set and immunoglobulin domain containing 6 | 102138 | 0.0 | Hs00868452_g1 | n.d. | |
| hCG2038940* | 113811 | 0.0 | Hs01635161_gH | n.d. | Immunoglobulin heavy chain variable region VH‐III (PTHR23266:SF10) | ||
| 123277 | 1.0 | ||||||
| hCG1773456 | 188651 | 0.0 | Hs01635150_gH | n.d. | |||
| 202646 | 2.9 | ||||||
| hCG2038923 | LOC90925* | Hypothetical protein LOC90925 | 193687 | 0.0 | |||
| hCG2038931 | 108776 | 1.8 | |||||
| hCG1812069 | LOC388248 | 141132 | 0.0 | ||||
| hCG2038939 | 181990 | 1.0 | |||||
| hCG2003024 | VSIG7 | V‐set and immunoglobulin domain containing 7 | 188579 | 2.4 | |||
| hCG2038930 | 126586 | 3.0 | |||||
| hCG1980528* | IGKC | Immunoglobulin kappa constant | 112729 | 0.0 | Hs01692073_s1 | 4.1E‐03 | Immunoglobulin lambda chain C region (PTHR23267:SF1) |
| 177583 | 0.0 | ||||||
| 165736 | 2.1 | ||||||
| hCG1742442 | 175634 | 0.0 | Hs01593416_g1 | n.d. | Immunoglobulin kappa light chain V region (PTHR23267:SF33) | ||
| hCG2042707 | 136785 | 0.0 | Hs01847594_sH | 1.4E‐01† | |||
| hCG1791795 | 134541 | 0.0 | |||||
| hCG1642538 | LOC440786 | Hypothetical LOC440786 | 183428 | 1.0 | |||
| hCG1749806 | IGKV4‐1 | Immunoglobulin kappa variable 4‐1 | 135354 | 1.6 | Hs00863339_g1 | 6.2E‐03 | |
| hCG1642807 | 125874 | 2.7 | |||||
| hCG2042722 | 161488 | 3.0 | |||||
| hCG2043208 | 152990 | 4.1 | |||||
| hCG1789507 | 172955 | 4.5 |
Gene is targeted by several upregulated probes.
Gene was only detected in a fraction of the samples, but a strong upregulation among multiple sclerosis patients was clearly indicated.
Figure 1.
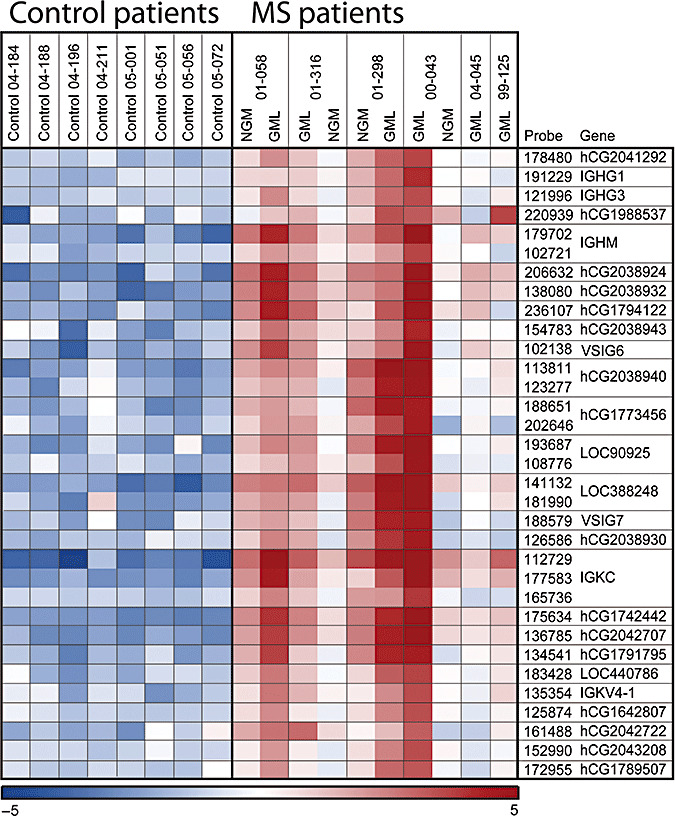
Heat map illustrating relative expression levels of the immunoglobulin‐related genes across control‐ and MS patients. Microarray intensity levels were log2 transformed, and high‐level mean was normalized for visualization of contrasts. Red and blue colors indicate expression levels above and below average, respectively. Abbreviations: GML = Grey matter lesions; NGM = Normal‐appearing grey matter.
Eight of the upregulated Ig‐related genes were selected for validation by TaqMan qPCR, including a combination of known RefSeq genes and novel genes with Ig‐sequence homology. Significant upregulation in MS samples (P < 0.001) was confirmed for three of these genes: IGKC, IGHG1 and IGKV41 (Figure 2, Table 3). A fourth gene, hCG2042707, was only detected in three control patients and four MS patients, but indicated a strong upregulation among the MS patients. Of the remaining four Ig‐related genes, three of them (hCG1742442, hCG2038937 and hCG1773456) could not be detected in any of the samples examined, while one (VSIG6) showed no upregulation according to the TaqMan assay (Figure 2, Table 3). As an independent control of the microarray results, the qPCR experiments included samples from five MS patients and four controls not included in the microarray analysis. The Ig‐expression patterns in these additional samples completely followed those of the original samples (data not shown). qPCR was also performed on these additional samples in order to examine a potential age effect of the gene expression pattern observed. In these samples, the age was overlapping between the MS and control groups, and we did not observe any age effect on the Ig upregulation (data not shown).
Figure 2.
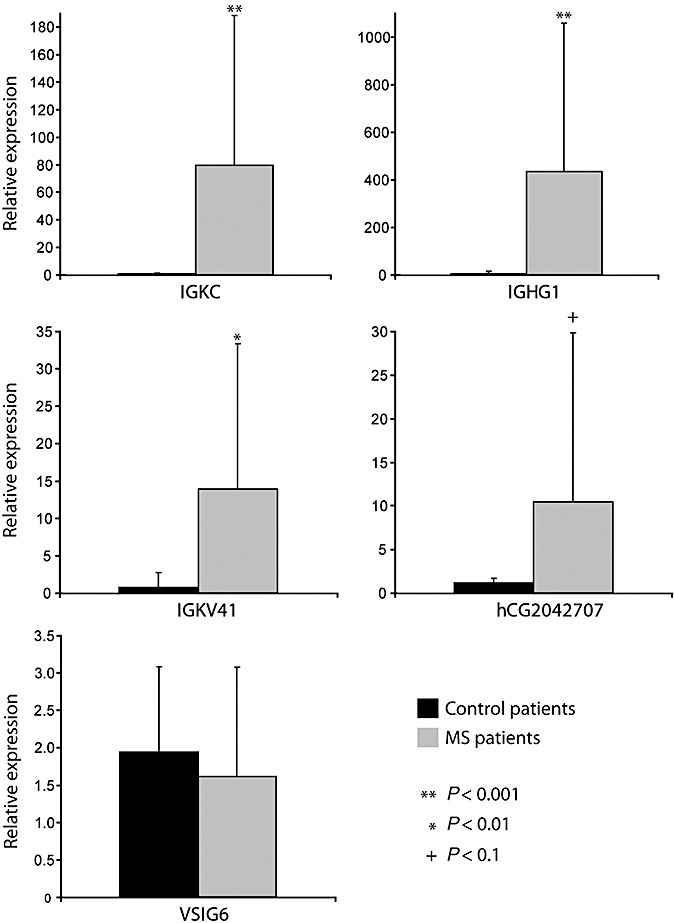
Relative gene expression as demonstrated by TaqMan quantitative polymerase chain reaction (qPCR) for IGKC, IGHG1, IGKV41, hCG2042707 and VSIG6. The diagrams display mean values for 12 controls and 11 multiple sclerosis (MS) patients (including both NGM and GML samples). Gene expression levels in the samples from the additional patients completely correlated with data from the original patients. A Student's t‐test (P < 0.001) confirmed significant upregulation of IGKC, IGHG1 and IGKV41 in MS patients compared with controls. hCG2042707 was only detected in a fraction of the samples studied, but it indicated a clear upregulation in MS patients. The activation of VSIG6 could not be confirmed by qPCR. Expression of hCG1742442, hCG2038937 and hCG1773456 could not be detected by their respective TaqMan assays. Details on TaqMan assays and statistical results are included in Table 3.
Immunohistochemical demonstration of Ig deposition and plasma cells in the meninges of MS patients
The upregulation of Ig genes in cortical samples from MS patients led us to hypothesize that the sections also contained traces of meningeal tissue. As suspected, meningeal tissue was present in all the MS and control samples. Immunohistochemistry was used to study whether the Ig upregulation occurred within plasma cells in the meninges of the MS patients. Staining for IgA, IgG, IgM, kappa and lambda revealed Ig deposition and cellular infiltration in the meninges of the MS patients compared with controls (Figure 3). The staining showed a pattern of immunopositivity consistent with Ig expression and deposition. To determine if these originated from nearby plasma cells, the sections were stained for CD138. This staining detected few immunopositive cells for CD138 in the meninges of all MS patients, but not in any of the controls (Figure 4). The overall numbers of CD138 immunopositive cells were, however, too low for statistical comparisons between lesion and non‐lesion areas, or between cortex and meninges.
Figure 3.

Meninges from one multiple sclerosis (MS) patient (A) and a control (B) stained with immunoglobulin. The pictures show immunoglobulin deposits (arrows) and cellular infiltration in the meningeal tissue from the MS patient compared with the control. All pictures have an original magnification of ×40.
Figure 4.

Immunohistochemical staining of CD138 (A), CD20 (B) and CD3 (C) positive cells (arrows) in meninges of multiple sclerosis patients (stainings from controls are not shown). CD20 and CD138 positive cells are only seen occasionally.
Presence of T‐ and B‐cells, but no ectopic B‐cell follicles in the MS patients
Cells immunopositive for CD3 were found in the meninges and in active lesions in the MS patients (Figure 4). A small number of CD20 positive B‐cells were detected in the meninges and cerebral cortex of the MS patients (Figure 4). The findings of few cells in gray matter lesions and in surrounding cortical areas are in accordance with our previous findings (2). CD20 positive cells were only apparent as single‐stained cells in the meninges, and no follicles of CD20 positive cells could be detected in the meninges of any of the MS patients.
EBV was not detected in the sections
As previously suggested, Ig production might be the result of EBV infection in the MS brain (29). Based on this study, we wanted to assess whether the Ig activation could be because of an ongoing EBV infection in the meninges, by qPCR with primers specifically targeting transcripts of the EBV latent (LMP1, LMP2, EBNA1 and EBNA2) and lytic (BZLF1) proteins. The positive control B95.8 showed strong signals from all the latent and lytic transcripts (data not shown). The quantitative nature of the system was evaluated using known concentrations of RNA from EBV positive cells in 10‐fold serial dilutions of RNA from the control cell line. The sensitivity testing revealed that RNA from EBV positive cells was detectable at concentrations down to 1:1000–10000 in dilutions with the CRL‐1593.2 cell line. Thus, between 0.01% and 0.1%, positive cells were necessary to detect the presence of LMP1, LMP2, EBNA1, EBNA2 or BZLF1. Our results were in accordance with the sensitivity testing of Kubota and colleagues (15). Preservation of RNA was found in all the MS patients and controls. qPCR on RNA samples with primers specifically targeting the transcripts of the EBV lytic protein BZLF1 and the latent proteins LMP1 and 2 and EBNA1 and 2 showed no signs of latent or lytic EBV infections in any of the MS or control samples.
Further, the latent proteins EBNA2 and LMP1 were analyzed using immunohistochemistry. The antibodies showed a positive staining from the B95.8 transformed cell line (Figure S1). Staining for LMP1 and EBNA2, however, did not detect the presence of any EBV‐infected cells in our MS tissue samples.
DISCUSSION
In this study, we have compared global gene expression in gray matter lesions and surrounding normal‐appearing gray matter from MS patients and gray matter from control patients. Only a few studies have thus far focused on gene expression in cortical sections from MS patients 8, 9 and, to our knowledge, gene expression data on gray matter lesions have not been reported before. On the global level, we were unable to detect systematic differences in gene expression pattern between any of these groups. Furthermore, we were unable to identify genes differentially expressed between gray matter lesions and normal‐appearing gray matter in MS samples. The findings may be influenced by heterogeneity of the samples and batch effects interfering with our results, thus making it more difficult to detect differences between the groups. The low sensitivity indicates that there is a need for more microarray studies comparing gray matter and gray matter lesions, preferably with laser‐dissected material. Still, when comparing MS brains with controls, we observed a striking activation of Ig‐related genes, which has not been reported earlier. Age differences between the MS and control samples may have influenced our results. Aging has been reported to affect the expression of antioxidative stress genes and mitochondrial function (18). However, we have not been able to find any reports of changes in Ig expression with increasing age. Further, we did not observe any age effect on the additional samples included in the qPCR validation. Thus, the upregulation of Ig genes seemed to be attributable to MS and not to age‐related changes in gene expression.
The Igs are known to either exist in a membrane‐bound form, attached to the membrane of B‐cells, or to be secreted by plasma cells. Thus, the upregulation of Ig genes observed in this study could have resulted from a meningeal or parenchymal accumulation of B‐cells, or from an increased secretion of Igs by parenchymal plasma cells. The majority of Ig genes with the strongest activation was variable and constant regions of the kappa and lambda light chains, but also included genes encoding heavy chains for IgM and IgG. Interestingly, MS has been shown to cause a selective elevation of the kappa compared with the lambda light chain in the cerebrospinal fluid (CSF), and elevated levels of kappa light chains have been demonstrated to be highly specific for MS (27). The plasma cells produce an excess of these chains during the formation of Igs, and they are secreted as free light chains to the CSF. Thirteen‐fold higher concentrations of IgM have been demonstrated in the CSF of MS patients compared with controls (22). IgG, however, has been shown to be the most important subfamily found in the OCBs of MS patients (23).
We selected eight Ig‐related genes for validation by qPCR and were able to confirm the activation of four of these, IGKC, IGHG1, IGKV41 and hCG2042707,* in the brains of MS patients. Despite apparently strong upregulation in the microarray analysis, three of the other Ig‐related genes were not detected by their respective TaqMan assays, (hCG1742442, hCG2038937 and hCG1773456). These are all “novel” genes with no representation in the RefSeq database, and their nature as true genes could thus be questioned. Their increased hybridization signals on the microarrays might represent cross‐hybridizations with other, closely related, Ig‐like sequences. Finally, one gene was detected in both controls and MS patients but showed no upregulation by qPCR among MS patients. This gene, VSIG6, is however not an Ig gene in itself but contains an Ig domain. Its function is unknown, and it is thus possible that this gene is regulated by other factors than the Ig genes. The apparent upregulation of this gene on the microarray might also be because of cross‐hybridization with probes for closely related genes containing Ig domains.
Despite the upregulation of Ig genes in the brains of MS patients, there was no corresponding upregulation of FcR genes. The FcRs are found on cells, granulocytes, monocytes and microglia (35). They work by binding to circulating Ig at their Fc region and have been shown to co‐localize with Ig in active white matter MS lesions (4). The fact that we observed an upregulation of Ig genes and not FcRs probably reflected the fact that few immune cells were present in both the cortical lesions and in adjacent normal‐appearing gray matter. The expression of Ig genes seems mainly to be the result from secretion of Igs and, to a lesser extent, from membrane‐bound Igs. Thus, the gene profile found in this study seems to be most consistent with increased Ig secretion from plasma cells, rather than B‐cell accumulation.
All MS and control sections in this study contained meninges. The staining revealed Ig deposition in the meninges of the MS patients compared with the controls. Closer investigation revealed a small number of CD138 positive cells, found almost exclusively in the meninges or in brain parenchyma in close proximity to the meninges in the MS patients. The Ig deposition found with immunohistochemistry could theoretically have originated from plasma cells in CSF or elsewhere in the subarachnoid space. Further, Ig immunostaining is associated with a risk of unspecific background staining, indicating that the results from this staining should be interpreted with caution. However, the strong upregulation of Ig genes found with the microarray assay and qPCR indicates that RNA transcripts of Igs are produced in the sections examined. Thus, the Ig upregulation and, at least partly, the Ig deposition could be related to the presence of plasma cells. Although immunohistochemical staining also revealed some CD20 positive cells in the meninges, we did not detect B‐cell follicles, as has been previously reported 19, 29, 30. The reason for this discrepant result could have been caused by the small number of tissue blocks examined in our study, or that ectopic follicles have only developed transiently and disappeared at the time of death (29). As the immunohistochemical sampling in our study was limited, the most plausible hypothesis seems to be that there could have been B‐cell follicles located in other blocks not examined. A detailed examination of B‐cell follicles in different brain areas was, however, beyond the scope of this study. Interestingly, both the Ig upregulation and plasma cells were found in all the MS samples, whether they contained gray matter lesions or not. This indicates that the plasma cells and the production of Igs could not be directly linked to cortical lesion formation.
OCBs in the CSF are recognized as a diagnostic hallmark of MS (26). Plasma cells are present in the CNS of MS patients, and it has been postulated that CNS plasma cells are the main source of CSF IgGs (28). It has also been demonstrated that the OCBs are composed of Igs that are produced by CSF B‐cells (23). The origin of these cells is not known. They could have entered from the meningeal spaces, choroid plexus or CNS parenchyma (23). The production of Igs detected in our study may reflect the OCBs observed in the CSF of MS patients. Thus, our findings suggest that the B‐cells found in the CSF could have entered from the meninges. The production of OCBs in MS patients has been suggested to result from a persistent EBV infection in the CNS (29). Our data indicate, however, that a massive upregulation of Ig genes is possible without detection of EBV by qPCR or immunohistochemistry. Four other studies have not found signs of infection or reactivation of EBV in MS brain tissue 13, 21, 24, 37. In agreement with recent findings (14), our study demonstrates that very few plasma and B‐cells are present in the cortex and meninges of MS patients. Thus, a highly sensitive method is probably necessary to detect the presence of EBV‐infected cells, and the discrepant findings could be because of a limited sensitivity of the methods used in the negative studies. As B‐cell follicles have been demonstrated to be the main focus of EBV persistence (29), it could be argued that the chance of identifying EBV‐infected cells is very small when B‐cell follicles are not present. Another reason for the discrepant data could be that EBV is only present in a subgroup of MS patients. In other disorders where EBV infections are known to be an important co‐factor, such as Burkitt's lymphoma, EBV is only found in about 30%–40% of the cases (16). Our study was not designed to give a detailed investigation of the possible presence of B‐cell follicles or EBV infection in the CNS of MS patients. It seems, however, that persistent EBV infection did not cause the Ig upregulation found in our sections, as neither B‐cell follicles nor EBV‐infected cells were found in close proximity to the microarray sections examined.
In summary, this study demonstrates that (i) genes involved in the synthesis of Igs are upregulated in gray matter from MS patients; (ii) this upregulation seems to be caused by a small number of plasma cells located in the meninges or in close proximity to the meninges; and (iii) latently EBV‐infected cells seem not to be necessary for this Ig upregulation. Finally, our findings indicate that the OCB‐producing B‐cells found in the CSF of MS patients could have meningeal origin. Thus, this study adds to the growing knowledge of the processes underlying meningeal inflammation and Ig production in MS.
FUNDING
The present study has been supported by grants from The Research Council of Norway (The FUGE program), the Western Norway Regional Health Authority, the Odd Fellow Research Fund for MS and the Bergen MS Society, Norway.
Supporting information
Figure S1. Immunohistochemical staining of the EBV‐positive cell line B95.8. The figure shows LMP1 positive cells (arrow) (A) and nuclear localisation of the EBNA2 antigen (arrow) (B) in the B95.8 transformed cell line. There were no LMP1 or EBNA2 positive cells in the brains or meninges of the MS patients (stainings not shown). All pictures have an original magnification of × 40.
Table S1. Genes differentially expressed (q = 5) between cortical samples from MS patients and controls. Up‐ and down‐regulated genes are presented as separate worksheets in the excel‐file.
Table S2. Prominent Panther functional categories over‐represented among genes up‐ and down‐regulated in MS brains. The lists of up‐ and down‐regulated genes were compared to the entire list of genes that showed detectable expression in at least one of the samples included in the study (24 426 genes, S/N ≥ 3) on the Applied Biosystems Human Genome Survey Array. Statistically significant over‐ and under‐represented annotation categories were determined by binomial statistics, using the observed number of genes versus the numbers expected by chance within a certain annotation group.
Please note: Wiley‐Blackwell are not responsible for the content or functionality of any supporting materials supplied by the authors. Any queries (other than missing material) should be directed to the corresponding author for the article.
Supporting info item
Supporting info item
Supporting info item
ACKNOWLEDGMENTS
We acknowledge the research infrastructure provided by the Norwegian Microarray Consortium (http://www.microarray.no), a national FUGE technology platform (Functional Genomics in Norway; http://www.fuge.no). The brain samples were kindly provided by the Dutch Brain Bank (Director, Dr Inge Huitinga). The positive controls for EBV were kindly provided by Karl Brokstad and Dr Torbjørn Hansen, and the negative control was provided by Sonia Gavasso.
Footnotes
hCG2042707 was detected in only a fraction of the samples studied, but a strong upregulation among MS patients was nevertheless clearly indicated.
REFERENCES
- 1. Bo L, Geurts JJG, Ravid R, Barkhof F (2004) Magnetic resonance imaging as a tool to examine the neuropathology of multiple sclerosis. Neuropathol Appl Neurobiol 30:106–117. [DOI] [PubMed] [Google Scholar]
- 2. Bo L, Vedeler CA, Nyland H, Trapp BD, Mork SJ (2003) Intracortical multiple sclerosis lesions are not associated with increased lymphocyte infiltration. Mult Scler 9:323–331. [DOI] [PubMed] [Google Scholar]
- 3. Bo L, Vedeler CA, Nyland HI, Trapp BD, Mork SJ (2003) Subpial demyelination in the cerebral cortex of multiple sclerosis patients. J Neuropathol Exp Neurol 62:723–732. [DOI] [PubMed] [Google Scholar]
- 4. Breij EC, Brink BP, Veerhuis R, Van Den Berg C, Vloet R, Yan R et al (2008) Homogeneity of active demyelinating lesions in established multiple sclerosis. Ann Neurol 63:16–25. [DOI] [PubMed] [Google Scholar]
- 5. Brownell B, Hughes JT (1962) The distribution of plaques in the cerebrum in multiple sclerosis. J Neurol Neurosurg Psychiatry 25:315–320. [DOI] [PMC free article] [PubMed] [Google Scholar]
- 6. Compston A, Coles A (2008) Multiple sclerosis. Lancet 372:1502–1517. [DOI] [PubMed] [Google Scholar]
- 7. De Groot CJ, Bergers E, Kamphorst W, Ravid R, Polman CH, Barkhof F, Van Der Valk P (2001) Post‐mortem MRI‐guided sampling of multiple sclerosis brain lesions: increased yield of active demyelinating and (p)reactive lesions. Brain 124:1635–1645. [DOI] [PubMed] [Google Scholar]
- 8. Dutta R, McDonough J, Chang A, Swamy L, Siu A, Kidd GJ et al (2007) Activation of the ciliary neurotrophic factor (CNTF) signalling pathway in cortical neurons of multiple sclerosis patients. Brain 130:2566–2576. [DOI] [PubMed] [Google Scholar]
- 9. Dutta R, McDonough J, Yin X, Peterson J, Chang A, Torres T et al (2006) Mitochondrial dysfunction as a cause of axonal degeneration in multiple sclerosis patients. Ann Neurol 59:478–489. [DOI] [PubMed] [Google Scholar]
- 10. Dysvik B, Jonassen I (2001) J‐Express: exploring gene expression data using Java. Bioinformatics 17:369–370. [DOI] [PubMed] [Google Scholar]
- 11. Geurts JJG, Barkhof F (2008) Grey matter pathology in multiple sclerosis. Lancet Neurol 7:841–851. [DOI] [PubMed] [Google Scholar]
- 12. Graumann U, Reynolds R, Steck AJ, Schaeren‐Wiemers N (2003) Molecular changes in normal appearing white matter in multiple sclerosis are characteristic of neuroprotective mechanisms against hypoxic insult. Brain Pathol 13:554–573. [DOI] [PMC free article] [PubMed] [Google Scholar]
- 13. Hilton DA, Love S, Fletcher A, Pringle JH (1994) Absence of Epstein–Barr virus RNA in multiple sclerosis as assessed by in situ hybridisation. J Neurol Neurosurg Psychiatry 57:975–976. [DOI] [PMC free article] [PubMed] [Google Scholar]
- 14. Kooi EJ, Geurts JJ, Van Horssem J, Bø L, Van Der Valk P (2009) Meningeal inflammation is not associated with cortical demyelination in chronic multiple sclerosis. J Neuropathol Exp Neurol 68:1021–1028. [DOI] [PubMed] [Google Scholar]
- 15. Kubota N, Wada K, Ito Y, Shimoyama Y, Nakamura S, Nishiyama Y, Kimura H (2008) One‐step multiplex real‐time PCR assay to analyse the latency patterns of Epstein–Barr virus infection. J Virol Methods 147:26–36. [DOI] [PubMed] [Google Scholar]
- 16. Kuppers R (2003) B cells under influence: transformation of B cells by Epstein–Barr virus. Nat Rev Immunol 3:801–812. [DOI] [PubMed] [Google Scholar]
- 17. Lassmann H, Bruck W, Lucchinetti CF (2007) The immunopathology of multiple sclerosis: an overview. Brain Pathol 17:210–218. [DOI] [PMC free article] [PubMed] [Google Scholar]
- 18. Lu T, Pan Y, Kao SY, Li C, Kohane I, Chan J, Yankner BA (2004) Gene regulation and DNA damage in the ageing human brain. Nature 429:883–891. [DOI] [PubMed] [Google Scholar]
- 19. Magliozzi R, Howell O, Vora A, Serafini B, Nicholas R, Puopolo M et al (2007) Meningeal B‐cell follicles in secondary progressive multiple sclerosis associate with early onset of disease and severe cortical pathology. Brain 130:1089–1104. [DOI] [PubMed] [Google Scholar]
- 20. Mi H, Lazareva‐Ulitsky B, Loo R, Kejariwal A, Vandergriff J, Rabkin S et al (2005) The PANTHER database of protein families, subfamilies, functions and pathways. Nucleic Acids Res 33:D284–D288. [DOI] [PMC free article] [PubMed] [Google Scholar]
- 21. Morre SA, Van Beek J, De Groot CJA, Killestein J, Meijer CJ, Polman CH et al (2001) Is Epstein–Barr virus present in the CNS of patients with MS? Neurology 56:692. [DOI] [PubMed] [Google Scholar]
- 22. Nerenberg ST, Prasad R, Rothman ME (1978) Cerebrospinal fluid IgG, IgA, IgM, IgD, and IgE levels in central nervous system disorders. Neurology 28:988–990. [DOI] [PubMed] [Google Scholar]
- 23. Obermeier B, Mentele R, Malotka J, Kellermann J, Kümpfel T, Wekerle H et al (2008) Matching of oligoclonal immunoglobulin transcriptomes and proteomes of cerebrospinal fluid in multiple sclerosis. Nat Med 14:688–693. [DOI] [PubMed] [Google Scholar]
- 24. Opsahl ML, Kennedy PG (2007) An attempt to investigate the presence of Epstein Barr virus in multiple sclerosis and normal control brain tissue. J Neurol 254:425–430. [DOI] [PubMed] [Google Scholar]
- 25. Peterson JW, Bo L, Mork S, Chang A, Trapp BD (2001) Transected neurites, apoptotic neurons, and reduced inflammation in cortical multiple sclerosis lesions. Ann Neurol 50:389–400. [DOI] [PubMed] [Google Scholar]
- 26. Polman CH, Reingold SC, Edan G, Filippi M, Hartung HP, Kappos L et al (2005) Diagnostic criteria for multiple sclerosis: 2005 revisions to the “McDonald Criteria.” Ann Neurol 58:840–846. [DOI] [PubMed] [Google Scholar]
- 27. Presslauer S, Milosavljevic D, Brucke T, Bayer P, Hubl W (2008) Elevated levels of kappa free light chains in CSF support the diagnosis of multiple sclerosis. J Neurol 255:1508–1514. [DOI] [PubMed] [Google Scholar]
- 28. Prineas JW, Wright RG (1978) Macrophages, lymphocytes and plasma cells in the perivascular compartment in chronic multiple sclerosis. Lab Invest 38:409–421. [PubMed] [Google Scholar]
- 29. Serafini B, Rosicarelli B, Franciotta D, Magliozzi R, Reynolds R, Cinque P et al (2007) Dysregulated Epstein–Barr virus infection in the multiple sclerosis brain. J Exp Med 204:2899–2912. [DOI] [PMC free article] [PubMed] [Google Scholar]
- 30. Serafini B, Rosicarelli B, Magliozzi R, Stigliano E, Aloisi F (2004) Detection of ectopic B‐cell follicles with germinal centers in the meninges of patients with secondary progressive multiple sclerosis. Brain Pathol 14:164–174. [DOI] [PMC free article] [PubMed] [Google Scholar]
- 31. Stansberg C, Vik‐Mo AO, Holdhus R, Breilid H, Srebro B, Petersen K et al (2007) Gene expression profiles in rat brain disclose CNS signature genes and regional patterns of functional specialisation. BMC Genomics 8:94. [DOI] [PMC free article] [PubMed] [Google Scholar]
- 32. Storey J (2003) The positive false discovery rate: a Bayesian interpretation and the q‐value. Ann Stat 31:2013–2035. [Google Scholar]
- 33. Tajouri L, Mellick AS, Ashton KJ, Tannenberg AE, Nagra RM, Tourtellotte WW, Griffiths LR (2003) Quantitative and qualitative changes in gene expression patterns characterize the activity of plaques in multiple sclerosis. Brain Res Mol Brain Res 119:170–183. [DOI] [PubMed] [Google Scholar]
- 34. Tusher VG, Tibshirani R, Chu G (2001) Significance analysis of microarrays applied to the ionizing radiation response. Proc Natl Acad Sci U S A 98:5116–5121. [DOI] [PMC free article] [PubMed] [Google Scholar]
- 35. Van Der Pol W, Van De Winkel JG (1998) IgG receptor polymorphisms: risk factors for disease. Immunogenetics 48:222–232. [DOI] [PubMed] [Google Scholar]
- 36. Whitney LW, Becker KG, Tresser NJ, Caballero‐Ramos CI, Munson PJ, Prabhu VV et al (1999) Analysis of gene expression in mutiple sclerosis lesions using cDNA microarrays. Ann Neurol 46:425–428. [DOI] [PubMed] [Google Scholar]
- 37. Willis SN, Stadelmann C, Rodig SJ, Caron T, Gattenloehner S, Mallozzi SS et al (2009) Epstein–Barr virus infection is not a characteristic feature of multiple sclerosis brain. Brain [Epub ahead of print] DOI:10.1093/brain/awp200. [DOI] [PMC free article] [PubMed] [Google Scholar]
- 38. Winer J, Jung CK, Shackel I, Williams PM (1999) Development and validation of real‐time quantitative reverse transcriptase‐polymerase chain reaction for monitoring gene expression in cardiac myocytes in vitro. Anal Biochem 270:41–49. [DOI] [PubMed] [Google Scholar]
Associated Data
This section collects any data citations, data availability statements, or supplementary materials included in this article.
Supplementary Materials
Figure S1. Immunohistochemical staining of the EBV‐positive cell line B95.8. The figure shows LMP1 positive cells (arrow) (A) and nuclear localisation of the EBNA2 antigen (arrow) (B) in the B95.8 transformed cell line. There were no LMP1 or EBNA2 positive cells in the brains or meninges of the MS patients (stainings not shown). All pictures have an original magnification of × 40.
Table S1. Genes differentially expressed (q = 5) between cortical samples from MS patients and controls. Up‐ and down‐regulated genes are presented as separate worksheets in the excel‐file.
Table S2. Prominent Panther functional categories over‐represented among genes up‐ and down‐regulated in MS brains. The lists of up‐ and down‐regulated genes were compared to the entire list of genes that showed detectable expression in at least one of the samples included in the study (24 426 genes, S/N ≥ 3) on the Applied Biosystems Human Genome Survey Array. Statistically significant over‐ and under‐represented annotation categories were determined by binomial statistics, using the observed number of genes versus the numbers expected by chance within a certain annotation group.
Please note: Wiley‐Blackwell are not responsible for the content or functionality of any supporting materials supplied by the authors. Any queries (other than missing material) should be directed to the corresponding author for the article.
Supporting info item
Supporting info item
Supporting info item