

Abstract
Growing evidence strongly suggests that high fat diet (HFD) has an important role in some neurodegenerative disorders, including Alzheimer's disease (AD). To identify new cellular pathways linking hypercholesterolemia and neurodegeneration, we analyzed the effects of HFD on gene expression in mouse brain. Using cDNA microarrays and real time RT‐PCR, we found that HFD has a mild, but significant effect on the expression of several genes. The altered genes include molecules linked to AD pathology and others of potential interest for neurodegeneration. We further investigated the effect of HFD on the activity‐regulated cytoskeleton‐associated protein (Arc). Expression of Arc was decreased in cerebral cortex and hippocampus of HFD‐fed animals. From the known regulatory mechanisms of Arc expression, HFD reduced N‐methyl‐D‐aspartate receptor (NMDAR) activity, as seen by decreases in tyrosine phosphorylation of NMDAR2A and levels of NMDAR1. Additionally, we demonstrated that 27‐hydroxycholesterol, a cholesterol metabolite that enters the brain from the blood, decreases Arc levels as well as NMDAR and Src kinase activities in rat primary hippocampal neurons. Finally, we showed that Arc levels are decreased in the cortex of AD brains. We propose that one of the mechanisms, by which hypercholesterolemia contributes to neurodegenerative diseases, could be through Arc down‐regulation caused by 27‐hydroxycholesterol.
Keywords: Alzheimer's disease, hypercholesterolemia, neurodegeneration, N‐methyl‐D‐aspartate receptor activity, Src kinase
INTRODUCTION
Over the recent years, increasing evidence has suggested that cholesterol, or cholesterol metabolism, plays a role in some neurodegenerative disorders, including Alzheimer's disease (AD). The first evidence came from clinical and epidemiological studies, showing that patients with elevated plasma cholesterol levels have increased susceptibility to AD 18, 36, 41 and that the incidence of AD is higher in countries with high fat and high calorie diet (20). The relation between hypercholesterolemia and AD or mild cognitive impairment has been confirmed repeatedly 9, 22, 25. Several studies have shown that the use of statins, drugs that inhibit the cholesterol synthesis, decreases the prevalence 19, 51 and the progression (43) of AD. In addition, polymorphisms in genes, involved in the transport or in the metabolism of cholesterol, have been suggested as putative risk factors for AD. The presence of the E4 isoform of the apolipoprotein E (ApoE), the main cholesterol transporter in the body, is the major known risk factor for this disease (6). Moreover, polymorphisms in receptors for the uptake of cholesterol, such as low‐density lipoprotein receptor‐related protein and the very‐low‐density lipoprotein receptor (53), as well as in enzymes that regulate the cholesterol catabolism such as Cyp46 (50), have been associated with an increased risk for AD. Furthermore, a number of studies suggest that cholesterol regulates the production of amyloid beta (Aβ), the major constituent in amyloid plaques and central to the pathogenesis of AD. High cholesterol promotes while low cellular cholesterol reduces Aβ production both in vitro and in vivo (31).
An unsolved paradox is how high serum cholesterol influences AD pathology, knowing that cholesterol metabolism in the central nervous system is regulated independently and separately from blood cholesterol metabolism, and that the cholesterol in the brain is separated from the blood by the blood–brain barrier (BBB) (5). Metabolites of cholesterol such as 24S‐hydroxycholesterol and 27‐hydroxycholesterol (27‐OH) can pass the BBB, and a large amount of 27‐OH is taken up from the blood, acting as an important link between extra‐cerebral and intra‐cerebral pools of cholesterol (17). However, the mechanisms by which hypercholesterolemia could contribute to neurodegenerative disorders are currently unknown.
In this study, we have used gene expression arrays to scrutinize the effects of high fat diet (HFD) on gene expression in the mouse brain, with the aim of identifying new cellular pathways linking hypercholesterolemia and neurodegeneration. Among the genes with altered expression, we have further focused on investigating the effects on activity‐regulated cytoskeleton‐associated protein (Arc). Arc is a key molecule for maintenance of synaptic potentiation and long‐term consolidation of memory 15, 29, and it has been shown to decrease in tangle‐bearing neurons in the AD brain (12).
MATERIAL AND METHODS
Animals
Five‐to‐six‐week‐old mice (strain C57BL/6) were purchased from B&K (Sollentuna, Sweden). The animals were housed in groups of five with 12‐h light/dark cycle and fed with normal chow diet (ND) or an HFD containing 21% fat and 0.15% cholesterol (R638, Lactamine, Sweden) for 9 months. Ethical consent was received from the regional ethical committee for animal studies. In order to monitor the effect of the diet in blood, we analyzed the levels of plasma lipids after 18 weeks of treatment. At this time, the plasma levels of cholesterol, high‐density lipoproteins and low‐density lipoproteins were approximately doubled in HFD‐fed animals as in controls (data not shown). Different sets of animals were used in each experiment and analysis technique.
RNA extraction
Five animals per group were sacrificed by decapitation and the brains immediately frozen on dry ice and subsequently stored at −70°C. Total RNA was extracted from one hemisphere using the RNeasy lipid tissue mini kit from Qiagen (Palo Alto, CA, USA), following the manufacturer's instructions. In addition, total RNA was extracted from a pool containing the cerebellum from all animals and was used as a common control for the microarray hybridizations. The RNA sample from each animal was analyzed individually against the common control. The expression ratios obtained were used to analyze differential gene expression between HFD and ND animals.
cDNA microarrays
DNA microarrays built with 70‐oligomer gene‐specific oligonucleotide probes (Operon, Huntsville, AL, USA) were obtained from the Royal Institute of Technology (Stockholm, Sweden). Four males were analyzed with a microarray, containing 15 000 gene probes (Mus musculus, AROS V2.0 set from Operon Biotechnologies GmbH, Cologne, Germany) spotted in duplicate. One male and five females were analyzed with a microarray, containing 27 000 gene probes (Mus Musculus, AROS V4.0 from Operon). Total sample RNA (5 µg) was treated with DNase I (Promega, SDS, Sweden), according to the manufacturer's instructions, and was labeled by reverse transcription (RT) in the presence of Cy5‐CTP, using the Pronto labeling kit (Corning, NY, USA). An equal amount of control reference RNA (Stratagene, CA, USA) was labeled with Cy3‐CTP, mixed with the Cy5‐labeled target, purified and mixed with 40 µL of the hybridization buffer supplied by the Pronto System (Corning, NY, USA). The labeled probe mix was added to the array and placed in a sealed hybridization chamber (Corning, NY, USA) for 15–18 h at 65°C, after which the array was washed and dried. The arrays were scanned immediately using a GenePix scanner (Axon Instruments, Union City, CA, USA). Image analysis was performed using the GenePix Pro 6.0 software (Axon Instruments, Union City, CA, USA). Automatic flagging was used to localize absent or very weak spots, which were excluded from analysis. Fluorescence (Cy5/Cy3) ratios were normalized as described previously (13), using the Locally Weighted Scatter Plot Smoother (LOWESS) method in the Statistics for Microarray Analysis (SMA) package (http://www.bioconductor.org). Identification of differentially expressed genes was performed using the Significance Analysis for Microarrays (SAM) statistical technique (47). A q value was assigned for each of the detectable genes in the array. This value measures the lowest false discovery rate at which differential expression of a gene is considered significant. Genes, which differences in expression showed a q value > 24%, were not selected for further analysis. Further statistical analyses of differential expression were performed with Student's t‐test, and a P < 0.05 was considered significant (see Supplementary Material for complete list of genes). A total of 10 microarray experiments were performed, five for male and five for female. Two chips in each group were performed in a dye swoop manner.
Real‐time RT‐PCR
To validate the microarray data, five genes (Arc, Ppp2r1b, Ace, Avp and Hmgcs2) were analyzed using real‐time quantitative RT– polymerase chain reaction (qRT‐PCR). Total RNA was reverse‐transcribed, using an oligo‐dT primer and the SuperScripTM II RT enzyme (Invitrogen, Carlsbad, CA USA). For each gene, three animals per group were analyzed, and each gene expression value was calculated as the mean of the three independent measurements. For relative qRT‐PCR, synthesized cDNA was amplified with target gene‐specific primers using an ABI PRISM 7700 Sequence Detection System (Applied Biosystems, Foster City, CA, USA). The following conditions were used: heat activation of DNA polymerase for 15 minutes at 95°C, 42 cycles of PCR: 95°C for 30 s, 55°C for 30 s, 72°C for 40 s and a final incubation at 72°C for 10 minutes. For each PCR product, melting curves were determined, according to the manufacturer's instruction (ABI PRISM 7700 sequence Detection System), ensuring specific amplification of the target gene. Quantitative values were obtained as the threshold PCR cycle number (Ct), when the increase in the fluorescent signal of the PCR product showed exponential amplification. Expression of 36B4 mRNA was used as an internal standard, as this gene is known to demonstrate low variability and high reproducibility. The relative transcription level of each gene was calculated, using the 2−ΔΔCt method, where ΔΔCt = (Ct target gene − Ct 36B4)HFD − (Ct target gene − Ct 36B4)ND (27). The mean of the results was obtained after the 2−ΔΔCt calculations of cDNA for each sample in triplicate, and the relative transcription levels were expressed as mean ± standard deviation (SD).
Immunoblotting
Four animals per group were sacrificed by decapitation and the brains immediately frozen on dry ice and stored at −70°C. Each brain was homogenized in a buffer containing 40 mM Tris‐HCl (pH 6.8), 1% NP‐40, a protease inhibitor cocktail (Sigma‐Aldrich, Saint Louis, MO, USA) and phosphatase inhibitors (20 mM β‐glycerophosphate, 2 nM okadaic acid, 50 mM NaF, 1 mM Na3VO4). Protein levels in the cell extracts were quantified using the BCA protein assay kit (Pierce, Rockford, IL, USA). Equal amounts of protein were separated using 10% acrylamide gel, and the proteins transferred to a nitrocellulose membrane (Schleicher & Schuell, Germany). Incubation with primary antibodies (see Table 1) was performed overnight at 1:1000 dilution, followed by incubation with anti‐rabbit or anti‐mouse immunoglobulin G (IgG) at 1:2000 dilution (Amersham Biosciences, Little Chalfont, UK). Immunoreactivity was detected by the ECL detection system (Amersham Biosciences, Little Chalfont, UK). Some immunoblots were stripped using Restore™ Western Blot Stripping buffer (Pierce, Rockford, IL, USA) at room temperature for 15 minutes, and then re‐blotted with other antibodies. The relative density of the immunoreactive bands was calculated from the optical density (OD) multiplied by the area of the selected band using Image SXM program (University of Liverpool, United Kingdom).
Table 1.
Primary antibodies used in the experiments.
| Antibody | Company |
|---|---|
| Arc (H‐300) | Santa Cruz Biotechnology, CA, USA |
| Arc (for immunohistochemistry) | Synaptic system GmbH, Germany |
| NMDAR1 (mouse) | BD Bioscience Pharmingen, UK |
| NMDAR1 (rat) | Chemicon International Inc., CA, USA |
| NMDAR2A (p‐Y1325) | Abcam, UK |
| Active Src | Biosource Europe, Belgium |
| GluR1 | Chemicon International Inc., CA, USA |
| GluR2 | Chemicon International Inc., CA, USA |
| Actin | Sigma Aldrich, MO, USA |
| NeuN | Chemicon International Inc., CA, USA |
Immunohistochemistry
For immunohistochemistry, 13 animals were used, five mice on ND and eight on HFD. All of the animals were anaesthetized with sodium chloral hydrate (40 mg/100 g, intraperitoneally) and perfused transcardially with 20 mL of 0.1 M phosphate‐buffered saline (PBS) followed by 60 mL 4% paraformaldehyde in 0.1 M PBS, pH 7.4. After perfusion, the animals were decapitated and the brains removed and post‐fixed in the same fixative for 8 h and then soaked in 10% sucrose in 0.1 M Sörensen phosphate buffer, pH 7.4, until the brains were cut on a cryostat. 14‐µm‐thick coronal sections were collected at two levels: bregma = −1.82–2.80 mm, according to the Franklin and Paxinos' atlas (10). The tissue sections were kept at −20°C until staining. Heat‐induced epitope retrieval was performed by microwaving the sections in 0.01 M citrate buffer, pH 6.0, at 80°C for 13 minutes. Unspecific binding was blocked with 5% normal goat serum (Sigma‐Aldrich, St. Louis, MO, USA) in PBS for 10 minutes before overnight incubation with the anti‐Arc antibody (see Table 1) at +4°C. Cy3‐conjugated goat‐anti rabbit IgG (Jackson ImmunoResearch, West Grove, PA, USA) was used for detecting the primary antibody (1:1000 dilution). Cell nuclei were stained with DAPI (Sigma‐Aldrich, St. Louis, MO, USA). Arc staining was assessed on two slides per animal, collected at the levels indicated above. The pattern of Arc immunostaining in the cortex allows dividing the structure into superficial (II–III), and deep (V–VI) layers, separated by a band of discontinuity. The Arc‐positive cells in the cortex were counted within arbitrarily delineated rectangles that span, but do not go beyond the limits of the layer. A minimum of three rectangular areas were counted per slide and per group of layers. The results were computed as number of Arc‐positive cells per square millimeter and expressed as mean ± SD.
In the dentate gyrus (DG), for measuring relative the intensity of staining, OD was measured using ImageJ 1.38 by manually delineating the cell bodies staining positively for Arc and normalizing the average OD to a number of similarly measured areas with background only in the vicinity of the granule cell layer. A minimum number of four Arc‐positive cells and five background regions per slide were analyzed. The Arc‐positive cells were counted in the outer (ob) and inner (ib) blade separately. Statistical analyses were performed on the average number of Arc‐positive cells per slide, and on an asymmetry index, calculated as the percentage difference between cell counts in ob and ib: (Nob − Nib)/(Nob + Nib) × 100.
27‐hydroxycholesterol treatment of rat primary hippocampal neurons culture
Hippocampal tissue from 16‐day‐old Sprague‐Dawley rat embryos were homogenized in serum‐free neurobasal medium with supplement of 2% B27 (Invitrogen). Cells from each embryo were seeded separately in dishes, pre‐coated with 0.17 mg/mL poly‐D‐lysine MW 300 000 (Sigma‐Aldrich, St. Louis, MO, USA) in PBS. The culture medium was changed every fourth day. Ten‐day‐cultured neurons were treated with 1 µM 27‐OH for 24 h. This concentration of 27‐OH is similar to that found in mammalian brain (16).
Cells were collected and lysed in lysis buffer (50 mM Tris‐HCl, 150 mM NaCl, 2 mM ethylenediamine tetraacetic acid, 2 mM ethyleneglycol tetraacetic acid, 1% Triton‐X100) containing a protease inhibitor cocktail (Sigma‐Aldrich, St. Louis, MO, USA) and phosphatase inhibitors (20 mM β‐glycerophosphate, 2 nM okadaic acid, 50 mM NaF, 1 mM Na3VO4). Immunoblotting was performed as described for the mouse brain extracts above.
Brain samples and tissue preparation
Post‐mortem brain material was obtained from the Huddinge Brain Bank (Karolinska university Hospital, Sweden) with approval by the Human Ethics Committee of Karolinska University Hospital. The AD cases met the clinical diagnosis of probable AD (Diagnostic and Statistical Manual of Mental Disorders‐IV, DSM‐IV criteria), as well as definitive AD after Consortium to Establish a Register for Alzheimer's Disease neuropathological criteria (33).
For immunoblotting, samples from temporal cortex from five AD brains (two males and three females, 84 ± 10 years old) and four controls (four males, 66 ± 7years old) were used. The brains had a post‐mortem delay between 8 and 34 h. Brain samples were sonicated in a buffer consisting of 50 mM Tris‐HCl (pH 7.4) and 1 mM ethylenediamine tetraacetic acid, with freshly added protease inhibitor cocktail (Sigma‐Aldrich, St. Louis, MO, USA) and phosphatase inhibitors (20 mM β‐glycerophosphate, 2 nM okadaic acid, 50 mM NaF, 1 mM Na3VO4).
Statistical analysis
Analyses of differences of data from immunoblotting and immunohistochemistry were carried out with the Mann–Whitney U‐test, as samples required non‐parametric statistics when checked by the Shapiro–Wilk's test. A value of P < 0.05 was considered statistically significant in all analyses.
RESULTS
HFD affects gene expression in mouse brain
To investigate the contribution of HFD to neurodegeneration, we used cDNA microarrays to monitor the effects on expression of thousands of genes in parallel. HFD was found to induce mild changes in gene expression in the mouse brain in terms of number of regulated genes and the extent of the expression changes registered. The used selection criteria were based in the SAM analysis and the fold change of differential expression. Values with a q > 24% and a fold change between 1.3 and 0.8 (corresponding with log2 transformed values of 0.4 and −0.4) were not considered. Statistical analysis of the changes seen in the selected genes was performed by Student's t‐test. A P‐value < 0.05 was considered significant. Using these criteria, among the 15 000 genes examined, we observed significant changes in only in 37 genes (22 up‐regulated and 15 down‐regulated) in male. The alterations in gene expression ratio changes ranged from 2.36 to 0.24. In female, a high variability was noted, resulting in the absent of significant changes after SAM analysis. Table 2 shows the list and values of genes with significant expression changes in male, together with the values for these genes seen in female. Missing values correspond to probes that provide insufficient signal for quantization or where there is insufficient number of replicates for statistical analysis. The complete list of genes with expression changes that were significant in the student's t‐test (P < 0.05) regardless of the SAM value can be seen in Tables S1 (for male) and S2 (for female).
Table 2.
Genes with altered expression in response to high fat diet.
| Name gene | Male | Female | Function | ||
|---|---|---|---|---|---|
| Fold change | P‐value | Fold change | P‐value | ||
| Up‐regulated | |||||
| S100 calcium binding protein A8 | 2.37 | 0.131 | 0.80 | 0.569 | Inflammation and defense |
| Neutrophilic granule protein | 2.07 | 0.034 | Inflammation and defense | ||
| Arginine vasopressin | 1.94 | 0.016 | Hormone activity | ||
| Pro‐melanin‐concentrating hormone | 1.88 | 0.013 | Signaling | ||
| Plexin C1 | 1.67 | 0.019 | 1.08 | 0.644 | Multi‐cellular organismal development |
| Cortistatin | 1.58 | 0.018 | Hormone activity | ||
| 3‐hydroxy‐3‐methylglutaryl‐Coenzyme A synthase 2 | 1.54 | 0.004 | Cholesterol metabolism | ||
| CD24a antigen | 1.54 | 0.009 | Structural membrane | ||
| DNA primase p58 subunit | 1.51 | 0.061 | Regulation of transcription | ||
| Insulin‐like growth factor binding protein 7 | 1.49 | 0.003 | Signaling | ||
| Bradykinin receptor beta | 1.48 | 0.026 | 0.92 | 0.649 | Signaling |
| Regulator of G‐protein signaling 11 | 1.47 | 0.049 | Signaling | ||
| Spermatogenesis‐associated factor | 1.43 | 0.002 | Signaling | ||
| Ceruloplasmin | 1.43 | 0.044 | Apoptosis | ||
| Interleukin 17 receptor | 1.42 | 0.001 | Signaling | ||
| Aldo‐keto reductase family 1 member B3 (aldose reductase) | 1.38 | 0.021 | 0.95 | 0.428 | Apoptosis |
| DNA primase p49 subunit | 1.38 | 0.035 | Regulation of transcription | ||
| Hspa12b heat shock protein 12B | 1.37 | 0.017 | Genetic susceptibility to atherosclerosis | ||
| TRAF2 and NCK interacting kinase | 1.34 | 0.011 | Signaling | ||
| Glucocorticoid modulatory element binding protein 1 | 1.34 | 0.022 | Apoptosis | ||
| Interferon induced transmembrane protein 3 | 1.34 | 0.014 | 0.65 | 0.531 | Inflammation and defense |
| Kctd6 potassium channel tetramerisation domain containing 6 | 1.32 | 0.007 | Signaling | ||
| Down‐regulated | |||||
| Src homology 3 domain‐containing guanine nucleotide exchange factor | 0.75 | 0.015 | Regulation of transcription | ||
| Sox11 SRY‐box containing gene 11 | 0.74 | 0.000 | Regulation of transcription | ||
| Peptide N‐glycanase homolog (S. cerevisiae) | 0.73 | 0.000 | 1.82 | 0.394 | Proteolysis and Ubiquitin cycle |
| Uridine monophosphate synthetase | 0.72 | 0.021 | UMP biosynthesis process | ||
| Guanine nucleotide binding protein beta 5 | 0.72 | 0.011 | 1.12 | 0.612 | Signalling |
| Fbxo30 F‐box protein 30 | 0.72 | 0.008 | 0.99 | 0.960 | Proteolysis and Ubiquitin cycle |
| Apaf1 apoptotic peptidase activating factor 1 | 0.70 | 0.016 | Apoptosis | ||
| Max binding protein | 0.70 | 0.032 | 0.74 | 0.129 | Apoptosis |
| Fndc3b fibronectin type III domain containing 3B | 0.67 | 0.034 | Fat cell diferentiation | ||
| Ppp2r1b protein phosphatase 2 (formerly 2A), regulatory subunit A | 0.65 | 0.038 | Signalling | ||
| Calpain 10 | 0.62 | 0.008 | 1.22 | 0.326 | Proteolysis and Ubiquitin cycle |
| Arl4d ADP‐ribosylation factor‐like 4D | 0.61 | 0.008 | 0.69 | 0.049 | Signalling |
| Hepatocyte growth factor | 0.58 | 0.011 | 0.70 | 0.096 | Signalling |
| Homeo box C4 | 0.27 | 0.001 | Regulation of transcription | ||
| Activity regulated cytoskeletal‐associated protein | 0.24 | 0.042 | 0.60 | 0.126 | Cytoskeleton |
We used the category assignments in the gene ontology system (http://www.geneontology.org) to functionally characterize the identified genes with altered expression because of HFD included genes involved in apoptosis (13.5%), lipid and cholesterol metabolism (2.7%), inflammation and defense responses (8.1%), regulation of transcription (13.5%), signaling (32.4%), structural function (5.4%), proteolysis (8%) or other functions (16.2%).
It is notable that a number of genes of key importance for cholesterol homeostasis in the brain, such as ApoE, HMG‐CoA‐reductase, Srebp1c, Srebp2, Cyp46a1, Cyp27a1, Cyp7b1, Abca1 and Abcg1, were not affected by the diet.
Real‐time RT‐PCR analysis of selected genes
To confirm the findings from the microarray analysis, we selected five genes of interest and measured their expression changes in RNA samples from a new set of animals.
Some of the selected genes have been linked to AD, including the protein phosphatase 2 regulatory subunit A beta isoform (Ppp2r1b) (49), Arc (12) and the neurohypophyseal hormone arginine‐vasopressin (Avp)(23). The mitochondrial 3‐hydroxy‐3‐methylglutaryl‐coenzyme A synthase 2 (Hmgcs2), an enzyme involved in brain cholesterol metabolism found to be altered by dietary fat in several brain regions in a previous study (7), was also included in our confirmatory study. In addition, we decided to analyze by RT‐PCR the expression of the angiotensin‐converting enzyme (Ace), a molecule of reported importance in AD 2, 4, 21, which values were very close to the criteria for significance in the microarray analysis (Fold change 1.33; P = 0.05).
In agreement with the microarray data (Table 2), relative qRT‐PCR using specific primers showed decreased transcription of Arc and Ppp2r1b and increased transcription of Ace, Avp and Hmgcs2 genes upon HFD (Figure 1B).
Figure 1.
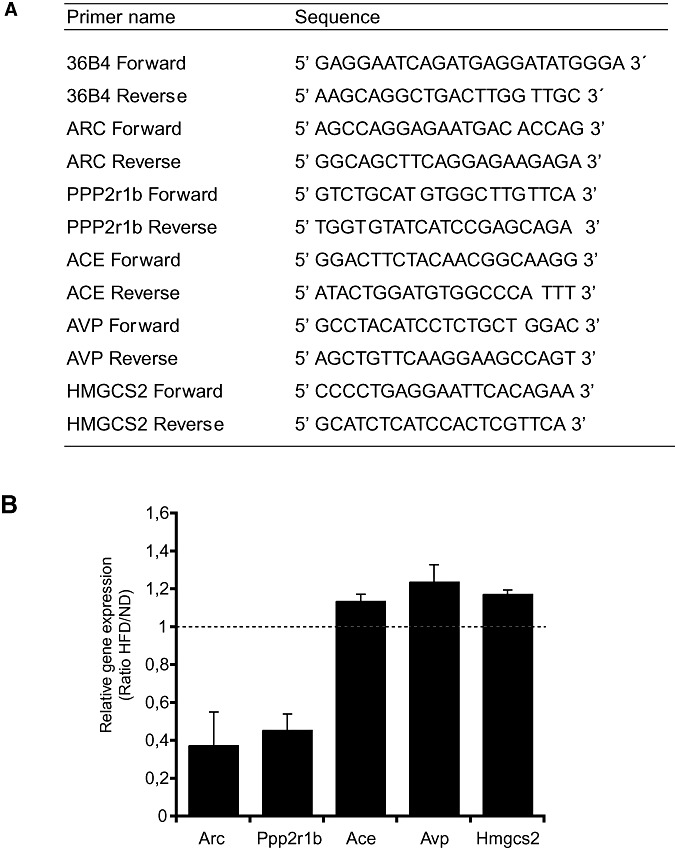
Differential expression of selected genes in mRNA level by qRT‐PCR.A. Primers used in qRT‐PCR analysis. B. Comparison of transcription levels of five selected genes (Arc, Ppp2r1b, Ace, Avp and Hmgcs2) in the brain of mice fed with high fat diet (HFD) and normal diet (ND). Transcription levels were normalized to the level of 36B4 mRNA. The ratio of relative transcription of each gene was calculated as 2−ΔΔCt, where ΔΔCt = (Ct target gene − Ct 36B4)HFD − (Ct target gene − Ct 36B4)ND. The mean of the results was obtained after the 2−ΔΔCt calculations of cDNA for each sample in triplicate. Data are shown as means of relative transcription levels ± SD.
HFD decreases Arc protein levels in brain
We found the down‐regulation of Arc of special interest. Arc is expressed predominantly in cortical and hippocampal glutaminergic neurons and it is required for the maintenance of long‐term potentiation (LTP) and for memory consolidation 15, 26, 28, 45. It has been shown that Arc levels are increased during learning and memory training (48). In contrast, a decrease in Arc expression was found in AD brains (12) and in transgenic mice over‐expressing human amyloid precursor protein (APP) (37).
Immunoblot analysis of mouse brain homogenates showed that protein levels of Arc were reduced in HFD animals, to approximately 66% of controls (Mann–Whitney U‐test, P < 0.05) (Figure 2A).
Figure 2.
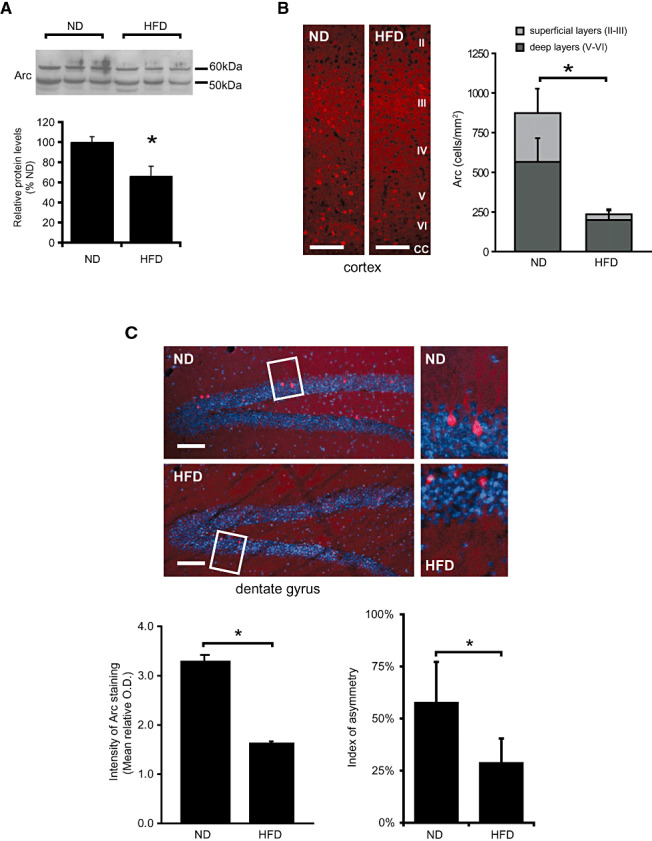
High fat diet (HFD) decreases Arc protein levels in mouse brain. A. Immunoblot of brain homogenates from mice fed with normal diet (ND) or HFD probed using anti‐Arc antibodies. Histogram shows data normalized as ratio to actin levels (showed in Figure 3), and expressed as percentage of values for ND fed animals. Bars represent means ± SD (*P < 0.05). B. Arc immunofluorescence in the cerebral cortex of mice fed with ND or HFD. Histogram shows the quantification Arc‐positive neurons (mean ± SD) in superficial layers (II–III) and deep layers (V–VI) calculated as number of Arc‐positive cells per square millimeter. A significant decrease of Arc positive neurons was found in both areas (Mann–Whitney; *P < 0.05). Cortical layers are identified by Roman numbers (II–VI); Abbreviation: CC = corpus callosum. Scale bar 100 µm.C. Arc immunofluorescence in dentate gyrus (DG) of mice fed with ND or HFD. Histograms show the intensity of Arc immunofluorescence or the asymmetry index of Arc staining in DG blades. Staining intensity was determined normalizing the average optical density of Arc immunofluorescence to the background in the vicinity of each positive neuron. The asymmetry index was calculated as the percentage difference between cell counts in the outer (ob) and inner (ib) blades: (Nob − Nib)/(Nob + Nib) × 100. Bars represent means ± SD (Mann–Whitney; *P < 0.05 compared with controls). Coronal sections were collected at bregma −1.80 mm. Nuclei are stained with DAPI.
Immunohistochemistry of the mouse brain revealed abundant neuronal staining for Arc in hippocampal and cortical areas (Figure 2B and C). In the cerebral cortex, the number of Arc‐positive cells was significantly lower in HFD mice, both in the deep (V–VI) and the superficial (II–III) layers (Figure 2B). In DG, no significant differences were found in the number of Arc‐positive neurons between ND and HFD animals but the intensity of the staining was significantly lower in animals on HFD (Mann–Whitney U‐test, P < 0.05) (Figure 2C). Analysis of the ib and ob of the DG showed that the number of Arc‐positive neurons was higher in the ob than in the ib in both ND and HFD animals (Wilcoxon test, P < 0.05). In the ib, the number of Arc‐positive neurons was higher in animals fed with HFD as compared with those fed with ND (6.8 ± 2.0 vs. 4.3 ± 1.5, Mann–Whitney U‐test, P < 0.05). However, the index of asymmetry between the two blades in the HFD group was half as big as that in the ND group (28.8 ± 19.4% vs. 57.8 ± 11.6%, Mann–Whitney U‐test, P < 0.05) (Figure 2C).
HFD decreases N‐methyl‐D‐aspartate receptor‐1 levels and tyrosine phosphorylation of N‐methyl‐D‐aspartate receptor‐2A in brain
Arc expression has been shown to be regulated positively by N‐methyl‐D‐aspartate receptor (NMDAR) (46) and negatively by α‐amino‐5‐hydroxy‐3‐methyl‐4‐isoxazole propionic acid receptor (AMPAR) activities (40). As shown in Figure 3, analysis of NMDAR1 showed significantly lower levels in the brains of HFD animals (Mann–Whitney U‐test, P < 0.05). A significant decrease in tyrosine 1325 phosphorylation of the NMDAR2A subunit was also found in the brain of HFD‐fed animals compared with controls (Mann–Whitney U‐test, P < 0.01). No significant changes were found in the levels of the AMPAR GluR1 or GluR2 (Figure 3).
Figure 3.
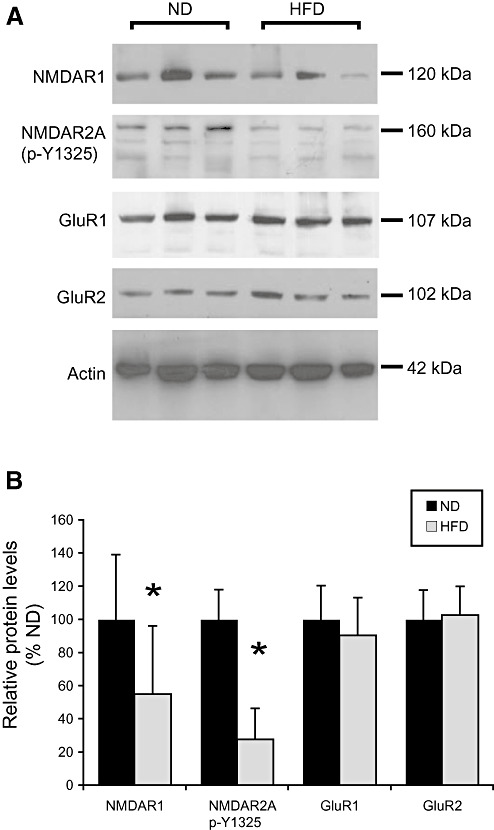
N‐methyl‐D‐aspartate receptor‐1 (NMDAR1) levels and tyrosine phosphorylation of NMDAR2A are decreased in the brain of high fat diet (HFD) fed animals. A. Immunoblots of brain homogenates from mice fed with normal diet (ND) or HFD probed using antibodies against NMDAR1, tyrosine 1325 phosphorylated (p‐Y1325) NMDAR2A and the α‐amino‐5‐hydroxy‐3‐methyl‐4‐isoxazole propionic acid receptor subunits GluR1 and GluR2. Three animals are analyzed from each group. B. Quantification of NMDAR1, p‐Y1325 NMDAR2A, GluR1 and GluR2 levels in ND and HFD mice. Values were normalized as ratio to actin levels, and expressed as percentage of values for ND animals. Bars represent means ± standard deviation (Mann–Whitney; **P < 0.01 and *P < 0.05 compared with controls).
27‐hydroxycholesterol induces similar effects in rat hippocampal neurons than HFD in mouse brain
As the BBB is impermeable to cholesterol but not to 27‐OH (17), we next used primary cultures of rat hippocampal neurons to investigate if this cholesterol metabolite could affect Arc or NMDARs. Treatment with 27‐OH (1 µM, 24 h) resulted in a significant decrease in Arc protein levels to 6% of control (Mann–Whitney U‐test, P < 0.01) (Figure 4). Re‐blotting of the membranes revealed that 27‐OH caused a decrease in NMDAR1 levels (to 33% of control; Mann–Whitney U‐test, P < 0.05) and in the tyrosine 1325 phosphorylation of NMDAR2A (to 40% of control; Mann–Whitney U‐test, P < 0.05). Immunoblotting of NeuN (a structural protein of nuclear membrane) was used for normalization, as treatment with 27‐OH also induced a significant increase in actin expression (data not shown).
Figure 4.
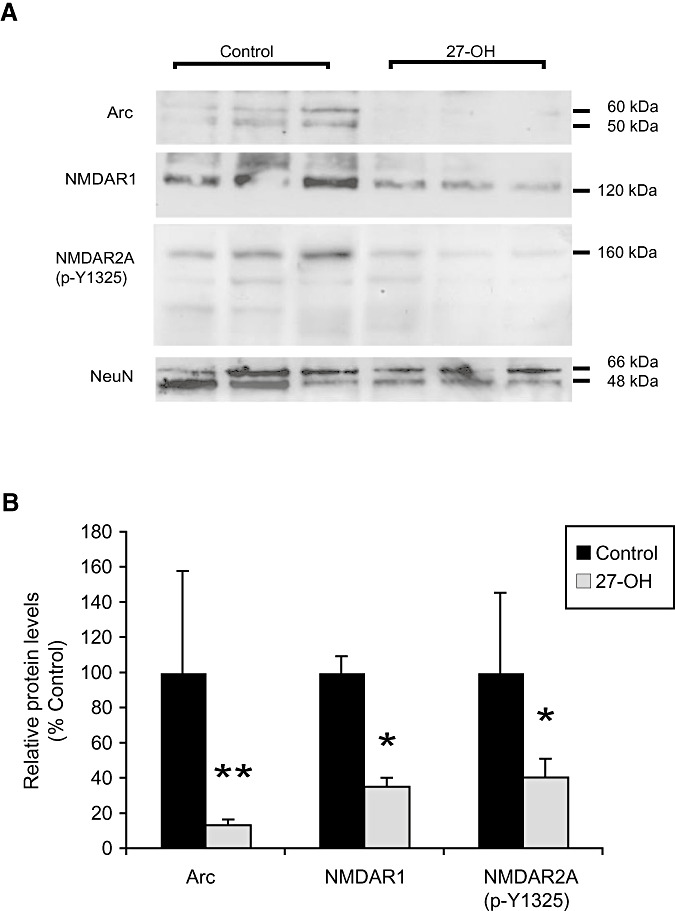
27‐hydroxycholesterol (27‐OH) decreases the levels of Arc, NMDAR1 and tyrosine 1325 phosphorylated NMDA2RA in rat primary hippocampal neurons. A. Immunoblots of cell extracts from rat primary hippocampal neurons treated with 27‐OH (1 µM; 24 h) probed using antibodies against Arc, NMDAR1 and tyrosine 1325 phosphorylated (p‐Y1325) NMDAR2A. B. Quantification of the 27‐OH effects on Arc, NMDAR1 and p‐Y1325 NMDAR2A in rat primary hippocampal neurons. Data were normalized as ratio to NeuN levels, and expressed as percentage of values for control samples. Bars represent means ± standard deviation of three animals per group (Mann–Whitney; *P < 0.05 compared with controls).
27‐hydroxycholesterol decreases Src kinase activity in rat hippocampal neurons
Tyrosine phosphorylation of NMDAR2A is mediated by Src (24), a tyrosine kinase which activity has been shown to be modulated by cholesterol metabolites in some models (35). We next investigated the effects of 27‐OH in Src activity in rat primary hippocampal cultures. Figure 5 shows the same blot than Figure 4 stripped and probed with anti‐active‐Src antibodies. Quantification of the immunoreactivity data showed that 27‐OH treatment significantly decreased the levels of active Src (to 31% of control; Mann–Whitney U‐test, P < 0.05) (Figure 5).
Figure 5.
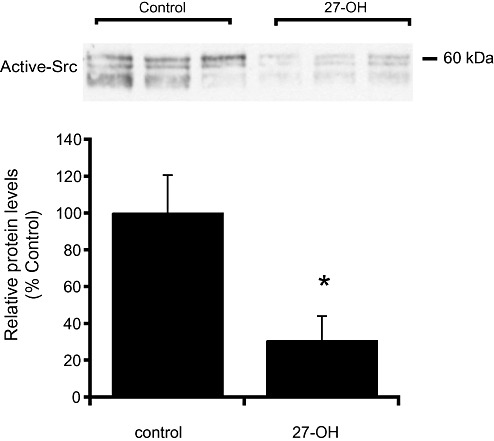
27‐hydroxycholesterol (27‐OH) decreases Src kinase activity in rat primary hippocampal neurons. Immunoblot of cell extracts from rat primary hippocampal neurons treated with 27‐OH (1 µM; 24 h) probed using antibodies against active Src kinase. Histogram shows the quantification of the O.D. data normalized as ratio to NeuN levels (shown in Figure 4), and expressed as percentage of values for control samples. Bars represent means ± standard deviation of three animals per group (Mann–Whitney; *P < 0.05 compared with controls).
Arc levels are decreased in AD brain
A previous report showed that Arc mRNA was decreased in CA1 tangle‐bearing neurons in AD (12). We next analyzed the Arc protein levels in cortical samples from AD and control brains. As shown in Figure 6, levels of Arc were reduced in AD, to approximately 72% of control brains (Mann–Whitney U‐test, *P < 0.05).
Figure 6.
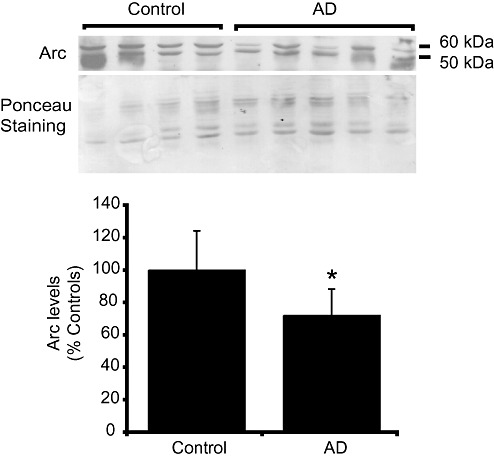
Decrease of Arc levels in Alzheimer's disease (AD). Immunoblot of cortical homogenates from AD and control cases were probed using anti‐Arc antibodies. Total staining of proteins by Ponceau was used as a loading control. Histogram shows data expressed as percentage of values for control brains. Bars represent means ± standard deviation (Mann–Whitney U‐test; *P < 0.05).
DISCUSSION
Accumulating data support the association between high cholesterol in blood and neurodegenerative processes such as AD. However, the mechanisms behind this effect are intriguing and very little is known about the effects that dietary high fat intake may cause in the brain. In this study, we show that long‐term HFD has a mild, but significant effect on the expression of several genes in the mouse brain. Using cDNA microarrays, we found that HFD altered the expression of 37 of the 15 000 analyzed genes in male. To notice is that most of these changes in expression were small. In female, a high variability was found resulting in the absence of significant changes for the same selection criteria used in male. It is possible that this high variability derives from the hormonal variations associated to the estrous cycle. Future studies using larger number of female animals in the different stages of the estrous cycle would be required to measure the changes in gene expression induced by long‐term HFD. The genes found to be regulated by HFD in male are involved in different cellular processes and several of them have been previously linked to AD pathology. The changes in three of the genes up‐regulated by HFD (Ace, Avp and Hmgcs2) and two of the down‐regulated (Ppp2r1b and Arc) genes were confirmed by qRT‐PCR independently in a different set of animals. Polymorphisms in the ACE gene are known susceptibility factors for AD (21) and both levels and activity of ACE have been shown to be increased in different areas of the AD brain 2, 4. Avp has been shown to be increased in the temporal lobe and reduced in the cerebellum of AD and Down's syndrome patients (23). Ppp2r1b is a regulatory subunit of the protein phosphatase 2A, a key molecule in the dephosphorylation of tau and has been shown to be decreased in the AD brain (49). A decrease in Arc mRNA levels was also seen in a previous study in CA1 tangle‐bearing neurons in the AD brain (12). On the basis of the results described, it is tempting to speculate that the alteration in these genes might be part of the mechanisms by which hypercholesterolemia could contribute to AD.
We further investigated the effects of HFD on Arc protein levels. Arc is an immediate early gene that is required for the stabilization of activity‐dependent plasticity and long‐term memory formation (38). We demonstrated that long‐term HFD decreased the number of Arc‐positive neurons in cerebral cortex. In DG, we observed that HFD reduced the intensity of Arc staining and also changed the pattern of Arc expression, reducing the ratio of expression between ob and ib. It had been suggested that different hippocampal regions could have specialized roles in memory function (3). In a previous report, differences in excitability and fiber sprouting between DG blades were induced by kainic acid in a rat model of epilepsy (42), suggesting that DG blades have different roles in activating the hippocampus. Therefore, it is possible that both the decrease in Arc expression and the change in Arc expression pattern seen in DG of HFD‐fed animals might have functional consequences.
Arc expression has been shown to be regulated by two major mechanisms: (i) by glutamate‐gated ion channels, positively by NMDAR (46) and negatively by AMPAR (40); and (ii) by Brain‐derived neurotrophic factor (BDNF), in a manner that depends on the activation of extracelullar regulated kinase (ERK1/2) (52). We next investigated which of these mechanisms could mediate the down‐regulation of Arc by HFD. Increased activity of NMDAR involves changes in the number and the phosphorylation state of NMDAR (24). NMDAR mediated Ca2+ influxes trigger LTP by a mechanism involving the phosphorylation of NMDAR2A by Src tyrosine kinase (14). Therefore, increased tyrosine phosphorylation of NMDAR2A subunit reflects an enhancement in NMDAR activity. We found that HFD decreases the amount of tyrosine 1325 phosphorylation of NMDAR2A, as well as the levels of NMDAR1 in mouse brain. In contrast, no changes were found in AMPAR, suggesting that a loss of balance between these receptors could induce Arc down‐regulation after treatment with HFD. In agreement with our results, a previous report has shown that long‐term cholesterol‐enriched diet reduces the ratio of activation of NMDAR over AMPAR, and induces learning deficits in old animals (8).
Furthermore, BDNF activation of Mitogen‐Activated Protein Kinase (MAPK) signaling has been shown to regulate Arc expression (52). In a previous study we showed that HFD does not alter ERK1/2 phosphorylation (39), indicating that the HFD effects on Arc are independent of this regulatory mechanism.
The mechanisms by which activation of NMDAR and MAPK regulate Arc are not completely known. Activation of these signaling cascades in excitatory synapses has been shown to induce early growth response (Egr) transcription factor 11, 34, and Arc is a target gene regulated by Egr (1). Two of the Egr, Egr1 and Egr4 were down‐regulated (with fold changes of 0.71; P = 0.03 and 0.74; P = 0.04, respectively) upon long‐term HFD (Table S1). However, the role of Egr genes in the regulation of Arc protein levels in this model remains to be investigated.
As the brain cholesterol is separated from the blood cholesterol by the BBB (5), it is intriguing that high serum cholesterol levels influence the prevalence of AD. Metabolites of cholesterol, such as 24S‐hydroxycholesterol and 27‐OH, can pass the BBB, and there is a large up‐take of 27‐OH from the blood to the brain (17). In view of the high correlation between cholesterol and 27‐OH in the circulation, it seems likely that the flux of 27‐OH across the BBB is increased in the hypercholesterolemic state (30). We hypothesized that 27‐OH could be responsible for the HFD‐induced down‐regulation of Arc. Using primary cultures of rat hippocampal neurons, we demonstrated that 27‐OH treatment reduced the levels of Arc, NMDAR1 and tyrosine‐phosphorylated NMDAR2A, supporting this hypothesis. In addition, we showed that 27‐OH decreased the activity of Src kinase. Src has been demonstrated to modulate NMDA‐dependent LTP by phosphorylation of NMDAR2A subunit and rapid insertion of new NMDA channels at synaptic sites (14). It has been previously shown that Src activity can be regulated by cholesterol metabolites in glycosphingolipid‐rich membranes of endothelial cells (35). In this model, cholesterol‐epoxide and 7α‐hydroxycholesterol decreased while 7‐ketocholesterol enhanced Src activity. Our results suggest that 27‐OH is a negative regulator of Src in neurons and, as a consequence, of NMDAR activity and Arc expression. The level of 27‐OH used in these experiments is similar to that of the mammalian brain (16).
We showed that Arc levels are decreased in the temporal cortex of AD brains. This is in agreement with previous findings showing reduced Arc mRNA in CA1 tangle‐bearing neurons (12) and in transgenic mice models for AD (37). Moreover, Aβ‐peptide was found to attenuate NMDA‐dependent signaling (44), on which Arc expression depends. Because neuronal Arc expression is intimately involved in the modification of synapse and the consolidation of memory (15), a decrease of Arc levels could contribute to the impairment of memory seen in AD.
In view of our results, Arc could be involved in mechanisms responsible for the association of high blood cholesterol with this disorder. In agreement with this idea, it has been reported that mice on long‐term HFD failed to perform an operant bar‐pressing task, indicating a significant impairment to procedural learning and consolidation processes (32). Furthermore, brain of deceased patients with AD, as well as APP‐transgenic mice, have significantly higher levels of 27‐OH than control brains (16). Arc down‐regulation, as result of hypercholesterolemia, could result in synaptic impairment of neuronal populations, involved in memory, thereby contributing to AD pathology. Additionally, it is possible that in AD individuals with high blood cholesterol, the memory deficits would occur earlier, exposing this subgroup to be detected in epidemiological studies.
In summary, we have shown that HFD induced mild but significant changes on gene expression in the mouse brain. From the genes with altered expression, we demonstrated that Arc protein levels were decreased in cerebral cortex and DG of HFD‐fed animals. HFD also induced a decrease in NMDAR activity in mouse brain that might account for the effects seen on Arc. We demonstrated that the cholesterol metabolite 27‐OH reduced Arc levels, as well as NMDAR and Src activities in rat hippocampal neurons in vitro. In addition, we showed that Arc levels are decreased in AD brains. Our results suggest that high cholesterol diet may be a negative additive factor in several pathways involved in AD pathology, including the disruption of Arc. A feasible link between 27‐OH and Arc down‐regulation could be part of the mechanisms behind the association between hypercholesterolemia and AD.
Supporting information
Table S1. Genes with significant changes in male in response to high fat diet (HFD).
Table S2. Genes with significant changes in female in response to high fat diet (HFD).
This material is available as part of the online article from: http://www.blackwellsynergy.com
Please note: Blackwell Publishing is not responsible for the content or functionality of any supplementary materials supplied by the authors. Any queries (other than missing material) should be directed to the corresponding author for the article.
Supporting info item
Supporting info item
ACKNOWLEDGMENTS
This research was supported by grants from the following Swedish foundations: Riksbankens jubileumsfond, the Swedish Brain Power project, Loo och Hans Ostermans Stiftelse, Gun och Bertil Stohnes Stiftelse, Karolinska Institutets fund for geriatric research, Åke Wiberg foundation, Demensförbundet, Alzheimerfonden, Lars Hiertas minnesstiftelse, Stiftelsen Gamla Tjänarinnor, the Dementia Foundation and Vetenskapsrådet. L. M is supported by a postdoctoral fellowship from Spanish Foundation “Alfonso Martin Escudero”.
REFERENCES
- 1. Albert Y, Whitehead J, Eldredge L, Carter J, Gao X, Tourtellotte WG (2005) Transcriptional regulation of myotube fate specification and intrafusal muscle fiber morphogenesis. J Cell Biol 169:257–268. [DOI] [PMC free article] [PubMed] [Google Scholar]
- 2. Arregui A, Perry EK, Rossor M, Tomlinson BE (1982) Angiotensin converting enzyme in Alzheimer's disease increased activity in caudate nucleus and cortical areas. J Neurochem 38:1490–1492. [DOI] [PubMed] [Google Scholar]
- 3. Bannerman DM, Rawlins JN, McHugh SB, Deacon RM, Yee BK, Bast T et al (2004) Regional dissociations within the hippocampus—memory and anxiety. Neurosci Biobehav Rev 28:273–283. [DOI] [PubMed] [Google Scholar]
- 4. Barnes NM, Cheng CH, Costall B, Naylor RJ, Williams TJ, Wischik CM (1991) Angiotensin converting enzyme density is increased in temporal cortex from patients with Alzheimer's disease. Eur J Pharmacol 200:289–292. [DOI] [PubMed] [Google Scholar]
- 5. Bjorkhem I, Meaney S (2004) Brain cholesterol: long secret life behind a barrier. Arterioscler Thromb Vasc Biol 24:806–815. [DOI] [PubMed] [Google Scholar]
- 6. Cedazo‐Minguez A, Cowburn RF (2001) Apolipoprotein E: a major piece in the Alzheimer's disease puzzle. J Cell Mol Med 5:254–266. [DOI] [PMC free article] [PubMed] [Google Scholar]
- 7. Cullingford TE, Dolphin CT, Bhakoo KK, Peuchen S, Canevari L, Clark JB (1998) Molecular cloning of rat mitochondrial 3‐hydroxy‐3‐methylglutaryl‐CoA lyase and detection of the corresponding mRNA and of those encoding the remaining enzymes comprising the ketogenic 3‐hydroxy‐3‐methylglutaryl‐CoA cycle in central nervous system of suckling rat. Biochem J 329:373–381. [DOI] [PMC free article] [PubMed] [Google Scholar]
- 8. Dufour F, Liu QY, Gusev P, Alkon D, Atzori M (2006) Cholesterol‐enriched diet affects spatial learning and synaptic function in hippocampal synapses. Brain Res 1103:88–98. [DOI] [PubMed] [Google Scholar]
- 9. Evans RM, Hui S, Perkins A, Lahiri DK, Poirier J, Farlow MR (2004) Cholesterol and ApoE genotype interact to influence Alzheimer disease progression. Neurology 62:1869–1871. [DOI] [PubMed] [Google Scholar]
- 10. Franklin KBJ, Paxinos G (1997) The Mouse Brain in Sterotaxic Coordinates. Academic Press: San Diego, CA. [Google Scholar]
- 11. Ghosh A, Ginty DD, Bading H, Greenberg ME (1994) Calcium regulation of gene expression in neuronal cells. J Neurobiol 25:294–303. [DOI] [PubMed] [Google Scholar]
- 12. Ginsberg SD, Hemby SE, Lee VM, Eberwine JH, Trojanowski JQ (2000) Expression profile of transcripts in Alzheimer's disease tangle‐bearing CA1 neurons. Ann Neurol 48:77–87. [PubMed] [Google Scholar]
- 13. Greenhalgh CJ, Rico‐Bautista E, Lorentzon M, Thaus AL, Morgan PO, Willson TA et al (2005) SOCS2 negatively regulates growth hormone action in vitro and in vivo . J Clin Invest 115:397–406. [DOI] [PMC free article] [PubMed] [Google Scholar]
- 14. Grosshans DR, Clayton DA, Coultrap SJ, Browning MD (2002) LTP leads to rapid surface expression of NMDA but not AMPA receptors in adult rat CA1. Nat Neurosci 5:27–33. [DOI] [PubMed] [Google Scholar]
- 15. Guzowski JF, Lyford GL, Stevenson GD, Houston FP, McGaugh JL, Worley PF, Barnes CA (2000) Inhibition of activity‐dependent arc protein expression in the rat hippocampus impairs the maintenance of long‐term potentiation and the consolidation of long‐term memory. J Neurosci 20:3993–4001. [DOI] [PMC free article] [PubMed] [Google Scholar]
- 16. Heverin M, Bogdanovic N, Lutjohann D, Bayer T, Pikuleva I, Bretillon L et al (2004) Changes in the levels of cerebral and extracerebral sterols in the brain of patients with Alzheimer's disease. J Lipid Res 45:186–193. [DOI] [PubMed] [Google Scholar]
- 17. Heverin M, Meaney S, Lutjohann D, Diczfalusy U, Wahren J, Bjorkhem I (2005) Crossing the barrier: net flux of 27‐hydroxycholesterol into the human brain. J Lipid Res 46:1047–1052. [DOI] [PubMed] [Google Scholar]
- 18. Jarvik GP, Wijsman EM, Kukull WA, Schellenberg GD, Yu C, Larson EB (1995) Interactions of apolipoprotein E genotype, total cholesterol level, age, and sex in prediction of Alzheimer's disease: a case‐control study. Neurology 45:1092–1096. [DOI] [PubMed] [Google Scholar]
- 19. Jick H, Zornberg GL, Jick SS, Seshadri S, Drachman DA (2000) Statins and the risk of dementia. Lancet 356:1627–1631. [DOI] [PubMed] [Google Scholar]
- 20. Kalmijn S, Launer LJ, Ott A, Witteman JC, Hofman A, Breteler MM (1997) Dietary fat intake and the risk of incident dementia in the Rotterdam Study. Ann Neurol 42:776–782. [DOI] [PubMed] [Google Scholar]
- 21. Kehoe PG, Russ C, McIlory S, Williams H, Holmans P, Holmes C et al (1999) Variation in DCP1, encoding ACE, is associated with susceptibility to Alzheimer disease. Nat Genet 21:71–72. [DOI] [PubMed] [Google Scholar]
- 22. Kivipelto M, Helkala EL, Laakso MP, Hanninen T, Hallikainen M, Alhainen K et al (2002) Apolipoprotein E epsilon4 allele, elevated midlife total cholesterol level, and high midlife systolic blood pressure are independent risk factors for late‐life Alzheimer disease. Ann Intern Med 137:149–155. [DOI] [PubMed] [Google Scholar]
- 23. Labudova O, Fang‐Kircher S, Cairns N, Moenkemann H, Yeghiazaryan K, Lubec G (1998) Brain vasopressin levels in Down syndrome and Alzheimer's disease. Brain Res 806:55–59. [DOI] [PubMed] [Google Scholar]
- 24. Lau CG, Zukin RS (2007) NMDA receptor trafficking in synaptic plasticity and neuropsychiatric disorders. Nat Rev Neurosci 8:413–426. [DOI] [PubMed] [Google Scholar]
- 25. Launer LJ, White LR, Petrovitch H, Ross GW, Curb JD (2001) Cholesterol and neuropathologic markers of AD: a population‐based autopsy study. Neurology 57:1447–1452. [DOI] [PubMed] [Google Scholar]
- 26. Link W, Konietzko U, Kauselmann G, Krug M, Schwanke B, Frey U, Kuhl D (1995) Somatodendritic expression of an immediate early gene is regulated by synaptic activity. Proc Natl Acad Sci USA 92:5734–5738. [DOI] [PMC free article] [PubMed] [Google Scholar]
- 27. Livak KJ, Schmittgen TD (2001) Analysis of relative gene expression data using real‐time quantitative PCR and the 2(‐Delta Delta C(T)) Method. Methods 25:402–408. [DOI] [PubMed] [Google Scholar]
- 28. Lyford GL, Yamagata K, Kaufmann WE, Barnes CA, Sanders LK, Copeland NG et al (1995) Arc, a growth factor and activity‐regulated gene, encodes a novel cytoskeleton‐associated protein that is enriched in neuronal dendrites. Neuron 14:433–445. [DOI] [PubMed] [Google Scholar]
- 29. McIntyre CK, Miyashita T, Setlow B, Marjon KD, Steward O, Guzowski JF, McGaugh JL (2005) Memory‐influencing intra‐basolateral amygdala drug infusions modulate expression of Arc protein in the hippocampus. Proc Natl Acad Sci USA 102:10718–10723. [DOI] [PMC free article] [PubMed] [Google Scholar]
- 30. Meaney S, Heverin M, Panzenboeck U, Ekstrom L, Axelsson M, Andersson U et al (2007) Novel route for elimination of brain oxysterols across the blood–brain barrier: conversion into 7alpha‐hydroxy‐3‐oxo‐4‐cholestenoic acid. J Lipid Res 48:944–951. [DOI] [PubMed] [Google Scholar]
- 31. Michikawa M (2003) The role of cholesterol in pathogenesis of Alzheimer's disease: dual metabolic interaction between amyloid beta‐protein and cholesterol. Mol Neurobiol 27:1–12. [DOI] [PubMed] [Google Scholar]
- 32. Mielke JG, Nicolitch K, Avellaneda V, Earlam K, Ahuja T, Mealing G, Messier C (2006) Longitudinal study of the effects of a high‐fat diet on glucose regulation, hippocampal function, and cerebral insulin sensitivity in C57BL/6 mice. Behav Brain Res 175:374–382. [DOI] [PubMed] [Google Scholar]
- 33. Mirra SS, Heyman A, McKeel D, Sumi SM, Crain BJ, Brownlee LM et al (1991) The Consortium to Establish a Registry for Alzheimer's Disease (CERAD). Part II. Standardization of the neuropathologic assessment of Alzheimer's disease. Neurology 41:479–486. [DOI] [PubMed] [Google Scholar]
- 34. Murphy TH, Worley PF, Baraban JM (1991) L‐type voltage‐sensitive calcium channels mediate synaptic activation of immediate early genes. Neuron 7:625–635. [DOI] [PubMed] [Google Scholar]
- 35. Myers SJ, Stanley KK (1999) Src family kinase activation in glycosphingolipid‐rich membrane domains of endothelial cells treated with oxidised low density lipoprotein. Atherosclerosis 143:389–397. [DOI] [PubMed] [Google Scholar]
- 36. Notkola IL, Sulkava R, Pekkanen J, Erkinjuntti T, Ehnholm C, Kivinen P et al (1998) Serum total cholesterol, apolipoprotein E epsilon 4 allele, and Alzheimer's disease. Neuroepidemiology 17:14–20. [DOI] [PubMed] [Google Scholar]
- 37. Palop JJ, Chin J, Bien‐Ly N, Massaro C, Yeung BZ, Yu GQ, Mucke L (2005) Vulnerability of dentate granule cells to disruption of arc expression in human amyloid precursor protein transgenic mice. J Neurosci 25:9686–9693. [DOI] [PMC free article] [PubMed] [Google Scholar]
- 38. Plath N, Ohana O, Dammermann B, Errington ML, Schmitz D, Gross C et al (2006) Arc/Arg3.1 is essential for the consolidation of synaptic plasticity and memories. Neuron 52:437–444. [DOI] [PubMed] [Google Scholar]
- 39. Rahman A, Akterin S, Flores‐Morales A, Crisby M, Kivipelto M, Schultzberg M, Cedazo‐Minguez A (2005) High cholesterol diet induces tau hyperphosphorylation in apolipoprotein E deficient mice. FEBS Lett 579:6411–6416. [DOI] [PubMed] [Google Scholar]
- 40. Rao VR, Pintchovski SA, Chin J, Peebles CL, Mitra S, Finkbeiner S (2006) AMPA receptors regulate transcription of the plasticity‐related immediate‐early gene Arc. Nat Neurosci 9:887–895. [DOI] [PubMed] [Google Scholar]
- 41. Roher AE, Kuo YM, Kokjohn KM, Emmerling MR, Gracon S (1999) Amyloid and lipids in the pathology of Alzheimer disease. Amyloid 6:136–145. [DOI] [PubMed] [Google Scholar]
- 42. Scharfman HE, Sollas AL, Smith KL, Jackson MB, Goodman JH (2002) Structural and functional asymmetry in the normal and epileptic rat dentate gyrus. J Comp Neurol 454:424–439. [DOI] [PMC free article] [PubMed] [Google Scholar]
- 43. Simons M, Schwarzler F, Lutjohann D, Von Bergmann K, Beyreuther K, Dichgans J et al (2002) Treatment with simvastatin in normocholesterolemic patients with Alzheimer's disease: a 26‐week randomized, placebo‐controlled, double‐blind trial. Ann Neurol 52:346–350. [DOI] [PubMed] [Google Scholar]
- 44. Snyder EM, Nong Y, Almeida CG, Paul S, Moran T, Choi EY et al (2005) Regulation of NMDA receptor trafficking by amyloid‐beta. Nat Neurosci 8:1051–1058. [DOI] [PubMed] [Google Scholar]
- 45. Steward O, Worley PF (2001) A cellular mechanism for targeting newly synthesized mRNAs to synaptic sites on dendrites. Proc Natl Acad Sci USA 98:7062–7068. [DOI] [PMC free article] [PubMed] [Google Scholar]
- 46. Steward O, Worley PF (2001) Selective targeting of newly synthesized Arc mRNA to active synapses requires NMDA receptor activation. Neuron 30:227–240. [DOI] [PubMed] [Google Scholar]
- 47. Tusher VG, Tibshirani R, Chu G (2001) Significance analysis of microarrays applied to the ionizing radiation response. Proc Natl Acad Sci USA 98:5116–5121. [DOI] [PMC free article] [PubMed] [Google Scholar]
- 48. Ulloor J, Datta S (2005) Spatio‐temporal activation of cyclic AMP response element‐binding protein, activity‐regulated cytoskeletal‐associated protein and brain‐derived nerve growth factor: a mechanism for pontine‐wave generator activation‐dependent two‐way active‐avoidance memory processing in the rat. J Neurochem 95:418–428. [DOI] [PubMed] [Google Scholar]
- 49. Vogelsberg‐Ragaglia V, Schuck T, Trojanowski JQ, Lee VM (2001) PP2A mRNA expression is quantitatively decreased in Alzheimer's disease hippocampus. Exp Neurol 168:402–412. [DOI] [PubMed] [Google Scholar]
- 50. Wolozin B (2003) Cyp46 (24S‐cholesterol hydroxylase): a genetic risk factor for Alzheimer disease. Arch Neurol 60:16–18. [DOI] [PubMed] [Google Scholar]
- 51. Wolozin B, Kellman W, Ruosseau P, Celesia GG, Siegel G (2000) Decreased prevalence of Alzheimer disease associated with 3‐hydroxy‐3‐methyglutaryl coenzyme A reductase inhibitors. Arch Neurol 57:1439–1443. [DOI] [PubMed] [Google Scholar]
- 52. Ying SW, Futter M, Rosenblum K, Webber MJ, Hunt SP, Bliss TV, Bramham CR (2002) Brain‐derived neurotrophic factor induces long‐term potentiation in intact adult hippocampus: requirement for ERK activation coupled to CREB and upregulation of Arc synthesis. J Neurosci 22:1532–1540. [DOI] [PMC free article] [PubMed] [Google Scholar]
- 53. Zerbinatti CV, Bu G (2005) LRP and Alzheimer's disease. Rev Neurosci 16:123–135. [DOI] [PubMed] [Google Scholar]
Associated Data
This section collects any data citations, data availability statements, or supplementary materials included in this article.
Supplementary Materials
Table S1. Genes with significant changes in male in response to high fat diet (HFD).
Table S2. Genes with significant changes in female in response to high fat diet (HFD).
This material is available as part of the online article from: http://www.blackwellsynergy.com
Please note: Blackwell Publishing is not responsible for the content or functionality of any supplementary materials supplied by the authors. Any queries (other than missing material) should be directed to the corresponding author for the article.
Supporting info item
Supporting info item