

Abstract
Preterm birth is a risk factor for growth failure and development of respiratory disease in children and young adults. Their early exposure to oxygen may contribute to lung disease because adult mice exposed to hyperoxia as neonates display reduced lung function, changes in the host response to respiratory viral infections, and develop pulmonary hypertension and heart failure that shortens their lifespan. Here, we provide new evidence that neonatal hyperoxia also impairs growth by inhibiting fat accumulation. Failure to accumulate fat may reflect a systemic defect in adipogenic potential of stem cells because bone marrow-derived mesenchymal cells (BMSCs) isolated from the mice grew slower and were more oxidized compared to controls. They also displayed reduced capacity to accumulate lipid and differentiate into adipocytes. BMSCs from adult mice exposed to neonatal hyperoxia express lower levels of peroxisome proliferator-activated receptor gamma (PPARγ), a transcription factor that drives adipocyte differentiation. The defect in adipogenesis was rescued by expressing PPARγ in these cells. These findings reveal early life exposure to high levels of oxygen may suppresses fat accumulation and impair adipogenic differentiation upstream of PPARγ signaling, thus potentially contributing to growth failure seen in people born preterm.
Keywords: adipogenesis, hyperoxia, growth failure, mesenchymal stem cells, PPARgamma
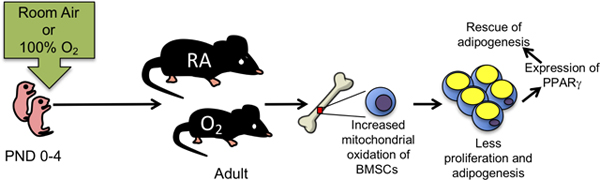
Graphical Abstract
INTRODUCTION
Approximately 10% of births occur before 37 weeks of gestation and are thus considered preterm. While supplemental oxygen, milder ventilation strategies, use of steroids and antibiotics, and other therapies have improved survival, these fragile infants continue to be at risk for a number of diseases as they become children and young adults. Many preterm infants often display growth failure and face an increased risk of reduced lung function, chronic wheezing, and re-hospitalization when infected with respiratory viruses [1–5]. They are also at risk of developing pulmonary and systemic hypertension, and heart failure at very high rates [6, 7]. In fact, the risk of heart failure is 17 times higher in those born prior to 28 weeks (also termed extremely low gestational age newborns; ELGANS) [8]. Pre-term birth is often associated with a period of catch-up growth and accelerated weight gain that may drive obesity and metabolic syndrome [9]. The mechanisms underlying catch-up growth and weight gain in pre-term individuals are not known.
There are many risk factors for diseases attributed to preterm birth, however, therapeutic exposure to concentrated oxygen (hyperoxia) is particularly suspect due to its association with bronchopulmonary dysplasia (BPD), the severe pathologic remodeling of the lungs that can occur in preterm infants [10]. Pre-term baboons and sheep, or term guinea pigs, rats, and mice exposed to hyperoxia have been used to understand how chronic exposure to hyperoxia causes BPD [11–14]. These studies reveal hyperoxia causes alveolar simplifcation in part by inhibiting angiogenesis and altering elastin fiber deposition. But as survival of preterm infants increases, there is a growing need to understand how BPD pathology repairs or contributes to disease later in life [15, 16]. In our model, newborn mice are exposed to room air or hyperoxia (typically 100% oxygen) between postnatal days (PND) 0–4 because this is when their lungs are in the saccular phase of development, which parallels the same developmental stage of the human preterm infant lung (24–34 weeks) [17]. Similar to survivors of preterm birth, adult mice exposed to neonatal hyperoxia develop airway hyperreactivity, display reduced lung function attributed in part to alveolar simplification, and display persistent inflammation and fibrotic lung disease when infected with influenza A virus. They also develop pulmonary capillary rarefaction and diastolic heart failure that shortens their lifespan by 50% [15]. Interestingly, two of these diseases are caused by hyperoxia impairing progenitor cells required for proper alveolar function and blood flow. Hyperoxia causes alveolar simplification by reducing the number of alveolar epithelial type 2 cells [18]. Loss of these cells causes fibrotic repair following influenza A virus infections because they serve as a transient amplifying progenitor cell for themselves and alveolar epithelial type 1 cells. Hyperoxia also permanently inhibits proliferation of cardiomyocytes lining the pulmonary vein and extending into the left atrium [16]. Failure to expand these cells postnatally may disrupt flow of oxygen-rich blood from the lung, thus explaining why the mice develop diastolic heart failure and their lungs have large dilated veins. Taken together, these data reveal neonatal hyperoxia may alter long-term health by permanently altering the proper expansion and/or differentiation of various progenitor cells.
While studying how neonatal hyperoxia affects growth of the mice, we uncovered an unappreciated role for neonatal hyperoxia to permanently reduce proliferation and the adipogenic differentiation of bone marrow derived mesenchymal cells (BMSCs). These multi-lineage cells can self-renew, differentiate into multiple cell types including fat storing adipocytes, and regulate repair and regenerative medicine [19]. Many properties of BMSCs are controlled or altered by reactive oxygen species (ROSs) and cellular redox state [19, 20]. Growth failure in survivors of preterm birth may therefore be mediated, in part, by early exposure to oxygen suppressing self-renewal and adipogenesis.
MATERIALS AND METHODS
Animal model of hyperoxia exposure
All mice were purchased from The Jackson Laboratories (Bar Harbor, ME) and were maintained as inbred colonies on a C57BL/6J background. Newborn mice were exposed to normoxia room air (21% oxygen) or hyperoxia (100% oxygen) between PND0 and PND4 [21]. Dams were cycled between litters exposed to room air and hyperoxia every 24 hours to ensure their lungs were not injured by supplemental oxygen exposure. Neonatal mice exposed to hyperoxia were returned to room air on the morning of PND4. The mice were weighed weekly until weaning and then monthly thereafter. All mice were provided food and water ad libidum and were housed in microisolator cages in a specified pathogen-free environment, according to a protocol approved by the University Committee on Animal Resources at the University of Rochester. All experiments performed with mice were in accordance with the relevant guidelines and regulations of this committee.
Bone Densitometry and micro-computed tomography (Micro CT) analysis
Bone properties were measured using a 10.5-μm resolution VivaCT40 micro-CT scanner (Scanco Medical, Basserdorf, Switzerland), as described previously (Beier et al 2013). For analyses of trabecular bone within the distal femur and proximal tibia, a region equivalent to 8% of the femur height (2.6 mm) was selected beginning 0.3 mm from the most proximal aspect of the growth plate scanned; images were reconstructed to an isotropic voxel size of 15 μm. We segmented trabecular bone from the cortex using a semi- automated contouring algorithm in the axial plane. For cortical analysis, we chose a region of 0.75 mm along the femoral midshaft. We determined areal BMD ex vivo by DXA (Lunar Prodigy Advance; GE Healthcare, Madison, WI). The region of interest (ROI) included the lumbar vertebrae (LV1–LV5) and femur/tibia.
Isolation and culture of bone marrow derived mesenchymal stem cells
Bone marrow derived mesenchymal stem cells (BMSCs) were isolated from leg bones of young adult (8–10 week) mice and adult (6 month or 12 month) mice as previously described [22]. The cells were expanded by culturing in minimal essential medium, alpha modification (Invitrogen, Carlsbad, CA) supplemented with 10% fetal bovine serum (FBS) (Hyclone, Logan UT), Antibiotic-Antimycotic, Glutamax, and Gentamycin. Cells were characterized for the presence of MSC markers and absence of lymphoid markers using primary antibodies (rat-anti-CD105, rat-anti-CD29, rat-anti-CD106, rat-anti-CD73, sheep-anti-CD44, rat-anti-CD45, rat-anti-CD11b, and isotype controls) obtained from R&D Systems (Minneapolis, MN). Conjugated secondary antibodies (goat anti-rat-IgG-BV421 and donkey anti-sheep IgG-PE) were from BD Bioscience (San Jose, CA). Samples were run on an LSR II Flow Cytometer (BD Bioscience) flow cytometer and analyzed using FlowJo software (Tree Star, Ashland OR).
Cell number and viability
Growth and survival of BMSCs was determined by counting cells on days 2, 4, 6, and 8 post-plating. Cells were washed with 1X phosphate-buffered saline (PBS) and then trypsinized for 5 minutes to remove adherent cells. Trypsin was inactivated using serum containing medium. The cells were centrifuged at 100 x g for 3 minutes, re-suspended in serum containing medium and an equal volume of Trypan Blue, and counted with a hemocytometer four separate times. The number of live, dead, and total cells were recorded. Trypan blue viability was calculated by dividing the mean number of dead Trypan blue-positive cells by the mean number of total cells. The experiment was performed in BMSCs isolated from 4 different mice exposed to room air or hyperoxia as neonates.
Cell Proliferation Assay
BMSCs were cultured in a 96-well plate at density of 5×10³ cells/well. Cell proliferation was determined using the bromodeoxyuridine (BrdU) Cell Proliferation Assay kit (Calbiochem, San Diego, CA) following protocol instructions. Cells were treated with a BrdU label at a 1:2000 dilution for 24 hours. Cells were harvested, washed in PBS, and stained for incorporated BrdU that was measured at 450–540nm using a Varioskan Flash microplate reader (Thermo Fisher, Waltham, MA). The experiment was performed in BMSCs isolated from at least three different adult mice exposed to room air or hyperoxia as neonates.
MitoSOX reactive oxygen species (ROS) assay
MSCs from mice exposed to hyperoxia or room air at birth were plated and cultured for 24 hours. Cells were then treated with 5 μM MitoSOX red (Invitrogen, Carlsbad CA) for 20 min at 37°C and then harvested by trypsinization. Cells were resuspended in flow cytometry buffer (BD Bioscience, San Jose CA) and immediately analyzed by flow cytometry on an LSR II Flow Cytometer. Unstained cells (no MitoSOX dye) served as negative control while cells treated with 10 μM Antimycin A (Sigma-Aldrich, St. Louis MO) and MitoSOX Red served as positive control. The experiment was performed in BMSCs from at least three different adult mice who were exposed to room air or hyperoxia as neonates.
Adipogenic differentiation
BMSCs were plated in 6 well or 24-well plates until they reached confluence. Cells were then cultured in adipogenic media containing 0.5 mM 3-isobutyl-1-methylxanthine (IBMX), 1 μM dexamethasone, and 1 μg/ml insulin (Millipore-Sigma, Burlingtion, MA) for 2 days. Cells were washed and fresh adipogenic medium lacking IBMX was added for an additional 10–15 days with fresh media replenished every 2–3 days during differentiation. Cells were analyzed for lipid accumulation and adipogenesis by LipidTox Red (Millipore-Sigma) staining and AdipoRed. Experiments were performed in BMSCs from at least three different adult mice (age 8 weeks or 6 months) exposed to room air or hyperoxia as neonates.
LipidTox staining
BMSCs were seeded into 24-well plates and treated as described above to induce adipogenesis. After differentiation, BMSCs were fixed with 4% paraformaldehyde for 10 minutes at room temperature and then washed 3 times with 1X PBS. Next, cells were stained with LipidTOX red neutral lipid reagent (Invitrogen). Cell nuclei were counterstained with 4 ,6-diamidino-2- phenylindole (DAPI) nucleic acid binding dye (Invitrogen). Fluorescence was visualized on a ZOE Fluorescent Cell Imager (Bio-Rad, Hercules, CA) utilizing the same settings for each image in the experiment.
AdipoRed assay
Lipid accumulation was quantified as previously described[23]. Briefly, BMSCs were seeded into 24-well plates and treated as described above to induce adipogenesis. After treatment, cells were analyzed for triglyceride accumulation using the AdipoRed assay reagent (Cayman Chemical, Ann Arbor MI). Culture medium was removed and the cells were washed in 1X PBS. Plates were incubated with the AdipoRed reagent for 10 min at room temperature to allow for triglyceride-AdipoRed binding. Then, the plates were excited at 485 nm in a Varioskan Flash plate reader, and the fluorescence at 572 nm was quantified.
Western Blot Analysis
Total protein was isolated from 1–2 × 10⁶ cells and lysed in 60 mM Tris (pH 6.8) and 2% SDS containing 1× protease inhibitor mixture (Millipore-Sigma). Protein concentrations were determined using the detergent-compatible protein assay (Bio-Rad). Total protein (5 μg/lane) was subjected to SDS-PAGE. Separated proteins were transferred to a PVDF membrane (Millipore-Sigma) using electrophoresis and probed with antibodies as specified. Antibodies targeting perilipin, C/EBPα, FABP4, and β-tubulin (All from Cell Signaling Technologies, Danvers, MA) were diluted according to manufacturers’ instructions, and membranes were incubated overnight at 4°C. PVDF membranes were washed and probed with anti-rabbit horse radish peroxidase (HRP)-conjugated secondary antibodies (Jackson ImmunoResearch Laboratories, Chester County, PA). Chemiluminescent signal was visualized using Immobilon Western chemiluminescent horseradish peroxidase substrate, and images were obtained using a ChemiDoc System (Bio-Rad). Signal intensities were quantified using ImageLab software (Bio-Rad). Protein expression was normalized to β-tubulin levels.
RNA isolation and quantitative PCR
Cells were lysed in TRIzol (Invitrogen, Carlsbad CA). After lysis, total RNA was extracted per the manufacturer’s protocol. RNA quantification and quality were determined using a DeNovix DS-11 spectrophotometer (DeNovix Inc., Wilmington, DE). cDNA was generated with the iScript Reverse Transcription Kit (Bio-Rad) per manufacturer’s instructions, and 50 ng total RNA was used as a template in each reaction. All primer sets were designed using IDT’s Real Time qPCR Tool and amplified a region spanning an exon-exon boundary and are listed below. 18S rRNA and Actb were used as reference genes.
| Gene | Forward primer | Reverse primer |
|---|---|---|
| Pparg | 5’-CAGGCAGATCGTCACAGAG | 5’-CAATAGAAGGAACACGTTGTCAG |
| Fabp4 | 5’-ATGTGTGATGCCTTTGTGGGAAC | 5’-TCATGTTGGGCTTGGCCATG |
| Plin1 | 5’-CGTGGAGAGTAAGGATGTCAATG | 5’-ACACCCTTCTCATAGGCATTG |
| Cebpa | 5’-CATGCCGGGAGAACTCTAACTC | 5’- GGGAAAGCCAAAGGCGG |
| 18S rRNA | 5’-GTAACCCGTTGAACCCCATT | 5’-CCATCCAATCGGTAGTAGCG |
| Actb | 5’-GAGGGAAATCTGTGCGTGACAT | 5’-ACATCTGCTGGAAGGTGGACA |
Quantitative PCR (qPCR) was performed using SsoAdvanced Universal SYBR Green Supermix and protocol (Bio-Rad). Primer sets were run in triplicate with each cDNA. Expression levels were normalized to reference gene expression. To calculate fold change, the comparative ΔΔCT method was used [20].
PPARγ-lentiviral transduction
BMSCs were infected with the lentiviral constructs LV-empty control or PPARγ-Lv (which encoded human PPARγ) at a multiplicity of infection of 4 with polybrene (6 μg/ml) for 24 hours as previously described [24]. Viral supernatants were then removed and the cells were incubated with normal medium until cultures became confluent. Cells were then cultured for 10 days in adipogenic media to allow lipid accumulation and adipogenesis. Cells were then analyzed for lipid accumulation and protein expression as described above.
Statistical Methods
Statistical analysis was performed using GraphPad Prism (GraphPad Software, Inc, La Jolla, CA). For comparison between groups of three or more, an analysis of variance with a Newman-Keuls multiple comparison test was used to determine differences between treatments. A p value <0.05 was considered significant.
RESULTS
Hyperoxia at birth alters animal growth and adult fat pad size
Newborn mice were exposed to room air or hyperoxia (100% oxygen) between birth and post-natal day 4 (PND4) as previously described [25]. Mice exposed to room air or hyperoxia were then weighed at various times during their lifespan. Interestingly, mice exposed to neonatal hyperoxia failed to gain weight compared to sibling mice exposed to room air (Figure 1A). Neonatal mice exposed to hyperoxia weighed less immediately after hyperoxia compared to siblings exposed to room air. They continued to weigh less than siblings as they became juveniles and adults. These changes were seen in both male and female mice; however, the effects were more evident in males, perhaps because they accumulate more fat and become larger than females as they age [26]. By 12 months of age, PND4 oxygen exposed male mice weighed approximately 6 grams less than room air control male mice reflecting an ~15% decrease in body weight.
Figure 1: Mice exposed to neonatal hyperoxia between postnatal days (PND) 0–4 show growth failure and failure to accumulate white fat compared to control mice exposed to room air.

(A) Male and female mice exposed to room air or hyperoxia (100% O2) at birth from postnatal days (PND) 0 to 4 were weighed at ages shown on the x-axis in the figure. Weights were plotted for male (left chart) and female (right chart) mice. (B) Representative images of epididymal fat pads from 12-month old mice exposed to room air (RA) or neonatal hyperoxia (O2). (C) Average epidydimal fat pad weight was normalized to total body weight in 12-month old male mice. N= at least 8 animals per group. *= p < 0.05, ** = p < 0.01, Student’s T- Test. (D) Neonatal hyperoxia does not affect appearance of bone structure. Representative 3-dimensional and cross-sectional scans of femurs harvested from 12-week old adult mice exposed to room air or hyperoxia between postnatal days 0–4.
There are many reasons why oxygen might cause growth failure. It could disrupt lactation in the dams; however, dams were rotated daily between litters exposed to room air or hyperoxia. It could disrupt levels of pituitary hormones, such as growth hormone, required for growth. But mice lacking growth hormone live longer than controls while neonatal hyperoxia shortens lifespan. As tissues were being harvested to understand how hyperoxia inhibits growth, we discovered that these mice fail to accumulate fat as they age, as exemplified by markedly less epidydimal white fat pad size (Figure 1B, left panel). To quantify this difference, epidydimal fat pads were isolated and weighed from 12-month-old male mice and normalized to total body weight (Figure 1B, right panel). Adult mice exposed to hyperoxia as neonates had ~70% less epidydimal fat than mice exposed to room air. These data reveal that neonatal hyperoxia inhibits weight gain in mice and this is readily seen as failure to accumulate fat.
We also analyzed bone properties and bone structure in control and neonatal hyperoxia exposed mice using microCT and DXA scanning (Figure 1D and Table 1). MicroCT analysis did not reveal significant differences in bone structure. Likewise, comparative analysis of bone properties revealed that neonatal hyperoxia did not significantly change key bone parameters.
Table 1:
Bone Structural Data. Bone structural data was obtained from the femurs of 8- week old mice exposed to room air (RA) or hyperoxia (O2) between postnatal days 0–4 using DXA and micro-CT scans. Values represent mean of 5 mice per group.
| Bone Parameter | Room Air (RA) | Hyperoxia (O2) | P value |
|---|---|---|---|
| Trabecular Bone (vol. / total vol.) | 0.32 ± 0.036 | 0.31 ± 0.05 | 0.78 |
| Trabecular Number (no./mm) | 6.65 ± 0.18 | 6.49 ± 0.19 | 0.55 |
| Trabecular Thickness (mm) | 0.07 ± 0.006 | 0.07 ± 0.008 | 0.92 |
| Trabecular Spacing (mm) | 0.13 ± 0.006 | 0.14 ± 0.006 | 0.66 |
| Connective Density (mm3) | 271.4 ± 13.03 | 291.8 ± 14.96 | 0.33 |
| Bone Mineral Density (g/cm3) | 806.22 ± 8.93 | 807 ± 12.66 | 0.94 |
| Cortical Thickness (mm) | 0.21 ± 0.005 | 0.20 ± 0.008 | 0.18 |
| Cortical Bone Area or BA (mm) | 2.88 ± 0.09 | 2.69 ± 0.08 | 0.15 |
| Structural Model Index (SMI) | 0.99 ± 0.28 | 1.22 ± 0.3 | 0.59 |
Characterization of Bone-Derived Mesenchymal Stem Cells
Mesenchymal stem cells (MSCs), sometimes referred to as multipotent stromal cells, have great potential in regenerative medicine. Several depots of MSCs have been isolated and characterized including MSCs from: adipose tissue (AdMSCs) and bone and bone marrow (BMSCs) (41). BMSCs are often studied as a surrogate for all MSCs and since we could readily obtain bone from these animals, we chose to study BMSCs. BMSCs were isolated from the long bones of 8-week, 6 month, and one-year old mice exposed to room air (normoxia) or PND4 hyperoxia. BMSCs from both groups of mice had similar forward and side scatter properties (Figure 2A). Their purity and quality were characterized by analyzing surface marker expression of mesechymal stem cell markers[27]. (Figure 2B). BMSCs were positive for CD105, CD29, CD106, CD44 and CD73. BMSCs were also negative for leukocyte markers CD45 and CD11b. No significant differences in surface marker expression were observed between BMSCs isolated from adult mice exposed to room air or hyperoxia as neonates. Furthermore, no significant differences were seen when cells were isolated from 8 week, 6 month or 12 month old mice either. Thus, hyperoxia exposure does not appear to change the surface marker expression used to define these cells.
Figure 2: Neonatal hyperoxia does not affect MSC surface marker expression of adult BMSCs.

Characterization of bone marrow-derived mesenchymal stem cells (BMSCs) from 8 week old mice exposed to either room air (RA) or neonatal hyperoxia (O2). BMSCs isolated from 8-week old mice were stained with fluorescently conjugated antibodies and analyzed by flow cytometry. (A) Representative Forward and Side scatter plots of BMSCs from RA and O2 groups. (B) Blue histograms show unstained cells while red histograms show antibody stained cells. BMSCs from room air and neonatal hyperoxia (O2) were positive for the MSC markers, CD105, CD29, CD106, CD44 and CD73 and negative for the leukocyte markers, CD45 and CD11b. The experiment was performed with BMSCs from n = 3 control (room air) and n = 3 mice exposed to hyperoxia (mice were 8 weeks of age). Similar results were observed in all sets.
Neonatal hyperoxia affects proliferation and redox state of adult BMSCs
A key property of MSCs is their ability to continuously self-renew until stimulated to differentiate along distinct lineages [20]. We consistently observed fewer cells in cultures of BMSCs isolated from 8-week, 6 month or 12 month old mice exposed to PND4 oxygen. We therefore studied cells harvested from 8-week-old mice because these mice were more readily available than older mice. Subconfluent populations of BMSCs were harvested on days 4, 6 and 8, stained with trypan blue, and counted with a hemacytometer (Figure 3A). No differences were observed in viability (data not shown), however, there were significantly fewer BMSCs from adult mice exposed to hyperoxia when compared to mice exposed to room air. BrdU nucleotide labeling was used to confirm that neonatal hyperoxia reduced proliferation of these cells. Asynchronously dividing BMSCs from adult mice were incubated with BrdU for 24 hours. The amount of incorporated BrdU label was determined by ELISA (Figure 3B). BMSCs from adult mice exposed to hyperoxia as neonates incorporated significantly less BrdU than control mice exposed to room air, thus demonstrating these cells have a lower rate of proliferation compared to BMSCs from mice exposed to room air.
Figure 3: Cell growth and proliferation rate are reduced in BMSCs isolated from adult mice exposed to neonatal hyperoxia.

BMSCs isolated from adult mice exposed to room air or neonatal hyperoxia (O2) were plated and cultured for 8 days. (A) The number of trypan blue negative cells were quantified in triplicate cultures harvested on days 4, 6, and 8. The experiment was performed with BMSCs from at least n = 4 control (room air) and n = 4 mice exposed to hyperoxia. (B) BMSCs were plated in 96 wells plates in quadruplicate and incubated with BrdU for 24 hours. BrdU incorporation was measured by ELISA and relative incorporation levels were plotted. BMSCs isolated from PND4 oxygen exposed adult mice incorporated significantly less BrdU than corresponding room air exposed control mice. The experiment was performed with BMSCs from n = 3 control (room air) and n = 3 mice exposed to hyperoxia (mice were 8 weeks of age). * p < 0.05, **p < 0.01, Student’s T-Test.
MSC function and fate are markedly influenced by the abundance of reactive oxygen species (ROSs) and cellular redox state [19, 28]. To measure redox state in BMSCs, asynchronously dividing cells were cultured for one hour in the presence of MitoSOX red, a mitochondrial targeted redox sensitive dye that emits fluorescence in the presence of superoxide. Cells were harvested and fluorescence intensity analyzed by flow cytometry. When compared to unstained cells, increased fluorescence was detected in BMSCs isolated from adult mice exposed to room air or hyperoxia as neonates (Figure 4A). Interestingly, BMSCs from oxygen exposed mice oxidized MitoSOX significantly more than control BMSCs as reflected in a greater shift in fluorescence intensity. Quantification of fluorescence intensity using the median fluorescence intensity of MitoSOX staining revealed neonatal hyperoxia significantly increased mitochondrial oxidation ~2-fold (Figure 4B). These data suggest that neonatal hyperoxia drives BMSCs to hold a greater abundance of available superoxide than control BMSCs, thereby creating a state of increased oxidation in these cells.
Figure 4: Neonatal hypereoxia increases the oxidation state of adult BMSCs.

BMSCs from both room air and neonatal hyperoxia exposed adult mice were plated and grown for 2 days. Then, MitoSox Red, a cell permeable dye that emits fluorescence in the presence of superoxide ions, was added. (A) Fluorescent emision of treated (red and blue histograms) and untreated (gray histogram) BMSCs was analyzed by flow cytometry. (B) The median fluorescence intestity was graphed for each treatment. BMSCs from neonatal hyperoxia exposed mice showed a greater fluroescent MitoSox signal than control BMSCs. The experiment was performed with BMSCs from n = 3 control (room air) and n = 3 oxygen mice (mice were 8 weeks of age). Values represent mean ± SEM, *P<0.05
Neonatal hyperoxia inhibits adipogenic differentiation of adult BMSCs.
Neonatal hyperoxia affects redox state of BMSCs and redox state is critical regulator of proliferation and differentiation [20]. Further, our data presented here show that oxygen exposed mice have limited fat pads suggesting a defect in adipogenesis or lipid storage. Therefore, we investigated whether neonatal hyperoxia impacts adipogenesis and osteogenesis of BMSCs harvested from adult mice. BMSCs from adult mice exposed to room air or hyperoxia as neonates were cultured in the presence or absence of adipogenic medium for 15 days. Adipogenesis was analyzed using lipid accumulation assays and expression of adipogenic markers. Treated cells were fixed and stained with LipidTox (red) to assess lipid accumulation and DAPI (blue) as counterstain to visualize nuclei. BMSCs from neonatal hyperoxia exposed mice accumulated less lipid than control BMSCs (Figure 5A). Lipid accumulation was quantified using the fluorescent AdipoRed assay [23]. Lipid levels after treatment with adipogenic medium were significantly lower in BMSCs from adult mice exposed to hyperoxia as neonates compared to control BMSCs (Figure 5B). After differentiation, expression of Perilipin, C/EBPα and FABP4 were all significantly reduced in BMSCs from mice exposed to hyperoxia when compared to controls exposed to room air (Figure 5C). As an additional measure adipogenesis and to complement the study of adipogenic marker protein levels, the expression of plin1 (gene for perilipin), cebpa (gene for C/EBPa) and fabp4 (gene for FABP4) mRNA were analyzed by qPCR (Figure 5D–F). Like protein expression, mRNA levels from adipogenic makers were significantly reduced in BMSCs from oxygen exposed mice treated with adipogenic medium compared to similarly treated control BMSCs. While we found that adipogenesis was significantly impaired in cells isolated from adult mice exposed to hyperoxia as neonates, osteogenic differentiation of BMSCs defined by Alizarin Red S stain of cells cultured in media containing, ascorbate, β-glycerol phosphate, and dexamethasone [29] was not different (data not shown).
Figure 5: Neonatal hyperoxia impairs adipogenesis of Adult BMSCs.

BMSCs from control and neonatal hyperoxia exposed mice were treated with adipognic medium or not as described in the Methods. (A) Lipid accumulation was measured by LipidTox (red) and DAPI (blue) stains nuclei to visualize all cells. (B) Lipid accumulation was quantified using the AdipoRed assay. BMSCs from neonatal hyperoxia exposed adult mice accumulated less lipid than BMSCs from room air control mice. (C) Expression of adipogenic marker proteins was analyzed by Western blot. Perilipin, C/EBPalpha and FABP4 were all significantly reduced in BMSCs from neonatal hyperoxia exposed adult mice. (D-F) Expression levels of adipogenic markers plin1, cebpa and fabp4 mRNA were analyzed by qPCR. The experiment was performed with BMSCs from at least n = 3 control (room air) and n = 3 neonatal hyperoxia mice (mice were 8 weeks of age). Values represent mean ± SEM, **= p < 0.01, *** = p < 0.001.
PPAR γ rescues adipogenesis in BMSCs from mice exposed to neonatal hyperoxia.
Adipogenesis requires the transcription factor, peroxisome proliferator-activated receptor-gamma (PPARγ) [23, 24, 30, 31]. Thus, one mechanism whereby adipogenesis could be impaired in hyperoxia BMSCs is that these cells may have reduced expression of PPARγ. Expression of PPARγ was analyzed by qPCR (Figure 6A). Interestingly, BMSCs from adult mice exposed to hyperoxia as neonates express 40% less PPARγ than control BMSCs isolated from mice exposed to room air. Since BMSCs from mice exposed to neonatal hyperoxia express less PPARγ than controls, we tested whether forced expression of PPARγ could rescue adipogenesis and lipid accumulation. A PPARγ-lentiviral construct (PPARγ-Lv) was used to express PPARγ in BMSCs [23, 32]. BMSCs were transduced with control (control-Lv) or PPARγ-Lv and cultured in adipogenic medium for 10 days. BMSCs transduced with control-Lv showed a response similar to those presented in Figure 5, where BMSCs from oxygen exposed mice failed to form adipocytes and accumulate lipid compared to BMSCs from mice exposed to room air (Figure 6B and C). However, adipogenesis was rescued in BMSCs from oxygen exposed mice transduced with PPARγ-Lv adipogenesis. Control and PPARγ-Lv transduced BMSCs from room air or oxygen mice were incubated in adipogenic medium for 10 days and stained with LipidTox (red) to assess lipid levels (Figure 6B). Transducing with control-Lv did not affect adipogenesis of BMSCs harvested from adult mice exposed to room air or hyperoxia (top panels). In contrast, transducing with PPARγ-Lv stimulate formation of lipid droplets in cells harvested from mice exposed to room air or hyperoxia (bottom panels). Lipid accumulation was also quantified using the AdipoRed assay (Figure 6C). Similar to LipidTox staining, BMSCs from room air and oxygen-exposed mice accumulate AdipoRed staining when tranduced with PPARγ-Lv in the presence of adipogenic medium while only room air BMSCs accumulate significant lipid in the prescence of the control-Lv. Additionally, high levels of perilipin, C/EBPα and FABP4 were detected in BMSCs derived from either room air mice or mice exposed to neonatal hyperoxia transduced with PPARγ-Lv and treated with adipogenic medium (Figure 6D). Likewise, plin1, cebpa andfabp4 mRNA were induced in both oxygen and control BMSCs transduced with PPARγ-Lv and treated with adipogenic medium(Figure 6E–G). These results show that forced PPARγ expression can rescue adipogenesis in BMSCs from adult mice exposed to neonatal hyperoxia. Additionally, these results suggest that impairments in lipid accumulation in hyperoxia BMSCs are at least in part upstream of PPARγ signaling.
Figure 6: PPARγ expression rescues adipogenesis of BMSCs from adult mice exposed to neonatal hyperoxia.

(A) Pparg mRNA was analyzed by qPCR in BMSCs from both room air and neonatal hyperoxia exposed adult mice. Pparg mRNA levels are reduced in BMSCs from PND4 oxygen exposed mice. (B) BMSCs transduced with control -Lv or PPARγ-Lv and treated with adipogenic medium for 10 days were stained with LipidTox (red) to assess lipid levels. (C) Untransduced, control-Lv and PPARγ-Lv transduced cells were analyzed for lipid accumulation using the AdipoRed assay. (D) Adipogenic marker protein expression was measured by Western blot. (E-G) Adipogenic marker mRNA levels were analyzed by qPCR. PPARγ-Lv restored the adipogenic potential in BMSCs from neonatal hyperoxia exposed adult mice. The experiment was performed with BMSCs from at least n = 3 control (room air) and n = 3 mice exposed to hyperoxia. Values represent mean ± SEM, n = 3 (mice were 8 weeks of age).
DISCUSSION
Children who were born preterm often display growth failure and face an increased risk of reduced lung function, chronic wheezing, and re-hospitalization when infected with respiratory viruses [1–5]. As these individuals reach adulthood, they are also developing pulmonary hypertension and heart failure at alarming rates [6, 7]. Mechanisms that drive disease in people born preterm are poorly understood, however, early exposure to excess oxygen is a prime suspect because it can alter postnatal development of the lung, heart, brain and other organs. Using a mouse model where oxygen has been shown to disrupt lung development and respiratory function, we provide new evidence that neonatal hyperoxia also permanently impairs growth of mice and this is associated with failure to accumulate fat with age. BMSCs isolated from these mice grew slowly, were more oxidized, and differentiated poorly into adipocytes via a pathway upstream of PPARγ signaling. Taken together, our findings suggest growth failure seen in people born preterm may be related to their early exposure to oxygen that suppresses adipogenic differentiation of mesenchymal stem cells (MSCs).
Preterm birth is associated with growth failure followed by a period of accelerated catch-up growth with associated metabolic syndrome, obesity and pulmonary hypertension[9]. Why growth failure is often followed by compensatory catchup is not clear. Growth failure is typically treated with increased nutrition and potential over-feeding. It is possible that over-nutrition in pre-term children drives obesity rather than pre-term birth [33]. In the current study, we saw a lack of adipogenesis and adipose accumulation in mice exposed to neonatal hyperoxia. We did not over-feed or provide extra nutrition to treat the observed growth failure. Future studies in which these mice receive additional nutrition in the form of a high fat diet may result in catch-up growth and additional metabolic disorders. Alternatively, mice exposed to hyperoxia may only model a subset of all pre-term human phenotypes. However, it is important to note other studies have found that pre-term birth in humans is associated with lower fat mass later in life. For example, fat mass was lower in 8–12 year old children that were born pre-term compared to age-matched children born full-term [34]. Additionally, a recent study found that pre-term children were lighter and had less body fat than full-term children when analyzed at 4 years old[35]. Why catch up growth is not seen in these studies is not clear, but the results are similar to our findings presented herein for mice exposed to neonatal hyperoxia.
Many facets of MSC biology are controlled or regulated by reactive oxygen species (ROS) and cellular redox state. We found that neonatal hyperoxia increases the availability of superoxide ions within adult BMSCs. While moderate increases in ROSs drive pathways needed for proliferation, differentiation, and function, sustained elevation of superoxide and other ROSs lead to oxidative damage to DNA, RNA, protein and other metabolites [28]. Cellular functions are adversely impacted by this damage and thus, sustained increases in ROS may reduce proliferation and potentially increase senescence or cell death. What is particularly intriguing about the current study is that elevated levels of ROS are seen in BMSCs isolated from adult mice exposed to hyperoxia as neonates. ROS signaling is also important in adipogenic pathways[36]. Moderate ROS levels promote adipogenesis in pre-adipocyte fibroblasts and MSCs. However, sustained ROS and oxidative stress impairs lipid accumulation and fat cell formation[37]. For example, increased mitochondrial derived ROS induces expression of the transcription factor, CHOP10 (also called GADD153 or DDIT3) [38]. CHOP10 then acts as a repressor of adipogenesis, blocking pro-adipogenic CCATT/ enhancer binding proteins, C/EBPβ and C/EBPα. C/EBPβ and C/EBPα normally drive expression of the master regulator of adipogenesis, PPARγ. Since hyperoxia impairs adipogenesis, it somehow causes sustained changes in ROS and oxidative stress in BMSCs that is maintained even after they are removed from their niche in the marrow. How oxidative stress in the lung affects the redox state of cells outside the lung requires further study.
Here we show that PPARγ is reduced in BMSCs from adult mice exposed to neonatal hyperoxia. To our knowledge, this is the first report showing that neonatal oxygen reduces expression of PPARγ in adult BMSCs. It has been shown that hyperoxia suppresses the parathyroid hormone related peptide-PPAR axis resulting in an expansion of lipofibroblasts to myofibroblasts that may contribute to the pathogenesis of bronchopulmonary dysplasia [39]. Interestingly, in an animal model of high-altitude hypoxia during pregnancy, PPARγ expression was reduced in placental tissues[40]. HIF-1α, which is activated by hypoxia, inhibits PPARγ expression in mouse embryonic fibroblasts thereby preventing their adipogenic differentiation in low oxygen conditions[41]. These findings and our results reveal that there are similarities in the cellular responses to both hypoxia and hyperoxia, with PPARγ playing a central role. There is precedence for hypoxia and hyperoxia exerting similar effects on the developing lung. Exposure to hypoxia (12% oxygen) or hyperoxia (>60% oxygen) at birth stimulates proliferation of alveolar epithelial type 2 cells[42]. Hypoxia and hyperoxia both reduce lifespan of Drosophila[43]. HIF-1α can contribute to in cardiac hypertrophy by promoting PPARγ expression in cardiomyocytes, which in turn stimulates pathologic lipid production in the heart [44]. The high oxidative stress seen in BMSCs isolated from oxygen-exposed mice may therefore impair PPARγ signaling and adipogenesis via dysregulated HIF1α signaling.
Our data also show that forced expression of PPARγ can rescue adipogenesis in these cells suggesting that the defect is upstream of PPARγ. Additionally, our studies show that effects of neonatal hyperoxia on BMSC proliferation, redox state and PPARγ persist long into adulthood. Therefore, it is likely that BMSCs are entirely reprogrammed by hyperoxia. Reprogramming likely occurs epigenetically, either by stable histone modifications or DNA methylation. Adipogenesis, PPARγ expression and activity are altered by changes in histone and/or DNA methylation [45, 46]. Additionally, several factors are involved in controlling PPARγ function including HIF-1α, C/EBP proteins, zfp423, Wnt and Erk signaling[30]. Future studies aimed at addressing these factors in addition to epigenetic signals may explain why PPARγ and adipogenesis are impaired in adult BMSCs from mice exposed to neonatal hyperoxia.
MSCs resident to bone and bone marrow are instrumental progenitor cells that have the potential to differentiate into a variety of effector cells besides adipocytes including: osteocytes, chondrocytes, and myofibroblasts [47]. They may also contribute to systemic sources of adipocytes. We focused on adipogenic potential of BMSCs because the mice exposed to hyperoxia did not accumulate fat and because we did not detect changes in bone properties or osteogenic potential of the BMSCs. While BMSCs are mostly thought to provide a source of cartilage and bone, previous studies have shown that BMSCs can form adipocytes in vivo and are a significant source of adipocytes in mice [48, 49] and humans[50, 51]. Interestingly, ~ 10% of adipocytes in the body originate from BMSCs and in obesity, this number can reach 20–25% of total adipocytes[52]. Therefore, it in these studies, it may be that a defect in the ability of BMSCs to undergo adipogenesis is at least partially responsible for the loss of significant fat pads in adult mice exposed to neonatal hyperoxia. It is important to emphasize that our studies do not rule out a direct effect of hyperoxia on adipose-derived MSCs (ADSCs). ADSCs and BMSCs have different capacities to undergo adipogenesis and osteoblastogenesis in vitro and these potentials are related to their tissue of origin[53]. Since fat pad were depleted in mice treated with neonatal hyperoxia, isolation of ADSCs will require increased numbers of animals and further optimization.
MSCs require different extracellular signals to form these lineages and whether or not these pathways and signaling events are impacted by early life exposure to oxygen is unclear. We have previously shown that early life oxygen results in increased fibrosis and myofibroblast deposition in bleomycin treated lungs [54], thus it is likely that MSC to myofibroblast formation is enhanced by hyperoxia. In this context, hyperoxia may shift the balance of MSC lineage formation to favor myofibroblast production over adipocyte formation and lipid storage. This type of lineage shift has been observed in other models of MSC differentiation such as changes in mechanical stimulation and changes in focal adhesion properties[55]. A recent study found that bone marrow adipose tissue, derived from BMSCs, might have a role in systemic energy regulation. Thus, since hyperoxia impairs BMSC adipogenesis, it likely disrupts the bone marrow niche which is involved in many processes such as hematopoietic cell production, energy homeostasis and adipokine production.
CONCLUSIONS
In summary, we have shown that neonatal oxygen exposure alters the function of BMSCs in adult mice. Specifically, neonatal hyperoxia increases adult BMSC ROS levels, reduces their proliferative capacity and impairs their ability to form adipocytes by blunting PPARγ levels. Our findings suggest that hyperoxia at birth disrupts critical cellular functions of progenitor stem cells long after exposure is over. These studies suggest that defects in progenitor cells have implications for growth failure and potentially increased risk of disease later in life.
HIGHLIGHTS.
Mice exposed to neonatal hyperoxia accumulate less fat and weight over their lifespan
Bone marrow derived stem cells (BMSCs) from adult mice exposed to neonatal hyperoxia show elevated reactive oxygen species
These BMSCs show a defect in proliferation and fat cell formation (adipogenesis)
Adipogenesis can be restored in these BMSCs by expressing PPARγ
ACKNOWLEDGEMENTS
The authors would like to thank Mitra Azadniv for starting this project and Robert Gelein for maintaining the oxygen exposure facility. This study was funded in part by NIH grants R01 HL091968 (MAO). NIH Center grant P30 ES001247 supported the animal inhalation facility. The University of Rochester’s Department of Pediatrics supported EEB and EDC through the Perinatal and Pediatric Origins of Disease Program.
Footnotes
Publisher's Disclaimer: This is a PDF file of an unedited manuscript that has been accepted for publication. As a service to our customers we are providing this early version of the manuscript. The manuscript will undergo copyediting, typesetting, and review of the resulting proof before it is published in its final form. Please note that during the production process errors may be discovered which could affect the content, and all legal disclaimers that apply to the journal pertain.
LITERATURE CITED
- [1].Robin B, Kim YJ, Huth J, Klocksieben J, Torres M, Tepper RS, Castile RG, Solway J, Hershenson MB, Goldstein-Filbrun A, Pulmonary function in bronchopulmonary dysplasia, Pediatric pulmonology 37(3) (2004) 236–42. [DOI] [PubMed] [Google Scholar]
- [2].Doyle LW, Respiratory function at age 8–9 years in extremely low birthweight/very preterm children born in Victoria in 1991–1992, Pediatric pulmonology 41(6) (2006) 570–6. [DOI] [PubMed] [Google Scholar]
- [3].Doyle LW, Faber B, Callanan C, Freezer N, Ford GW, Davis NM, Bronchopulmonary dysplasia in very low birth weight subjects and lung function in late adolescence, Pediatrics 118(1) (2006) 108–13. [DOI] [PubMed] [Google Scholar]
- [4].Smith VC, Zupancic JA, McCormick MC, Croen LA, Greene J, Escobar GJ, Richardson DK, Rehospitalization in the first year of life among infants with bronchopulmonary dysplasia, The Journal of pediatrics 144(6) (2004) 799–803. [DOI] [PubMed] [Google Scholar]
- [5].Weisman LE, Populations at risk for developing respiratory syncytial virus and risk factors for respiratory syncytial virus severity: infants with predisposing conditions, The Pediatric infectious disease journal 22(2 Suppl) (2003) S33–7; discussion S37–9. [DOI] [PubMed] [Google Scholar]
- [6].Eber E, Zach MS, Long term sequelae of bronchopulmonary dysplasia (chronic lung disease of infancy), Thorax 56(4) (2001) 317–23. [DOI] [PMC free article] [PubMed] [Google Scholar]
- [7].Bensley JG, De Matteo R, Harding R, Black MJ, The effects of preterm birth and its antecedents on the cardiovascular system, Acta obstetricia et gynecologica Scandinavica 95(6) (2016) 652–63. [DOI] [PubMed] [Google Scholar]
- [8].Carr H, Cnattingius S, Granath F, Ludvigsson JF, Edstedt Bonamy AK, Preterm Birth and Risk of Heart Failure Up to Early Adulthood, J Am Coll Cardiol 69(21) (2017) 2634–2642. [DOI] [PubMed] [Google Scholar]
- [9].Ou-Yang MC, Sun Y, Liebowitz M, Chen CC, Fang ML, Dai W, Chuang TW, Chen JL, Accelerated weight gain, prematurity, and the risk of childhood obesity: A meta-analysis and systematic review, PloS one 15(5) (2020) e0232238. [DOI] [PMC free article] [PubMed] [Google Scholar]
- [10].Jobe AH, Kallapur SG, Long term consequences of oxygen therapy in the neonatal period, Seminars in fetal & neonatal medicine 15(4) (2010) 230–5. [DOI] [PMC free article] [PubMed] [Google Scholar]
- [11].Zhang L, Soni S, Hekimoglu E, Berkelhamer S, Cataltepe S, Impaired Autophagic Activity Contributes to the Pathogenesis of Bronchopulmonary Dysplasia: Evidence from Murine and Baboon Models, Am J Respir Cell Mol Biol (2020). [DOI] [PMC free article] [PubMed] [Google Scholar]
- [12].Das KC, Pahl PM, Guo XL, White CW, Induction of Peroxiredoxin Gene Expression by Oxygen in Lungs of Newborn Primates, Am J Respir Cell Mol Biol 25(2) (2001) 226–232. [DOI] [PubMed] [Google Scholar]
- [13].Bourbon J, Boucherat O, Chailley-Heu B, Delacourt C, Control mechanisms of lung alveolar development and their disorders in bronchopulmonary dysplasia, Pediatr Res 57(5 Pt 2) (2005) 38R–46R. [DOI] [PubMed] [Google Scholar]
- [14].Goss KN, Kumari S, Tetri LH, Barton G, Braun RK, Hacker TA, Eldridge MW, Postnatal Hyperoxia Exposure Durably Impairs Right Ventricular Function and Mitochondrial Biogenesis, Am J Respir Cell Mol Biol 56(5) (2017) 609–619. [DOI] [PMC free article] [PubMed] [Google Scholar]
- [15].Yee M, White RJ, Awad HA, Bates WA, McGrath-Morrow SA, O’Reilly MA, Neonatal hyperoxia causes pulmonary vascular disease and shortens life span in aging mice, Am J Pathol 178(6) (2011) 2601–10. [DOI] [PMC free article] [PubMed] [Google Scholar]
- [16].Yee M, Cohen ED, Domm W, Porter GA Jr., McDavid AN, O’Reilly MA, Neonatal hyperoxia depletes pulmonary vein cardiomyocytes in adult mice via mitochondrial oxidation, Am J Physiol Lung Cell Mol Physiol 314(5) (2018) L846–L859. [DOI] [PMC free article] [PubMed] [Google Scholar]
- [17].Maeda Y, Dave V, Whitsett JA, Transcriptional control of lung morphogenesis, Physiological reviews 87(1) (2007) 219–44. [DOI] [PubMed] [Google Scholar]
- [18].Yee M, Domm W, Gelein R, Bentley KL, Kottmann RM, Sime PJ, Lawrence BP, O’Reilly MA, Alternative Progenitor Lineages Regenerate the Adult Lung Depleted of Alveolar Epithelial Type 2 Cells, Am J Respir Cell Mol Biol 56(4) (2017) 453–464. [DOI] [PMC free article] [PubMed] [Google Scholar]
- [19].Li Q, Gao Z, Chen Y, Guan MX, The role of mitochondria in osteogenic, adipogenic and chondrogenic differentiation of mesenchymal stem cells, Protein Cell 8(6) (2017) 439–445. [DOI] [PMC free article] [PubMed] [Google Scholar]
- [20].Sart S, Song L, Li Y, Controlling Redox Status for Stem Cell Survival, Expansion, and Differentiation, Oxid Med Cell Longev 2015 (2015) 105135. [DOI] [PMC free article] [PubMed] [Google Scholar]
- [21].Yee M, Buczynski BW, O’Reilly MA, Neonatal hyperoxia stimulates the expansion of alveolar epithelial type II cells, Am J Respir Cell Mol Biol 50(4) (2014) 757–66. [DOI] [PMC free article] [PubMed] [Google Scholar]
- [22].Paine A, Woeller CF, Zhang H, de la Luz Garcia-Hernandez M, Huertas N, Xing L, Phipps RP, Ritchlin CT, Thy1 is a positive regulator of osteoblast differentiation and modulates bone homeostasis in obese mice, FASEB J 32(6) (2018) 3174–3183. [DOI] [PMC free article] [PubMed] [Google Scholar]
- [23].Woeller CF, O’Loughlin CW, Pollock SJ, Thatcher TH, Feldon SE, Phipps RP, Thy1 (CD90) controls adipogenesis by regulating activity of the Src family kinase, Fyn, FASEB J 29(3) (2015) 920–31. [DOI] [PMC free article] [PubMed] [Google Scholar]
- [24].Sahler J, Woeller C, Spinelli S, Blumberg N, Phipps R, A novel method for overexpression of peroxisome proliferator-activated receptor-gamma in megakaryocyte and platelet microparticles achieves transcellular signaling, Journal of thrombosis and haemostasis : JTH 10(12) (2012) 2563–72. [DOI] [PMC free article] [PubMed] [Google Scholar]
- [25].Yee M, Chess PR, McGrath-Morrow SA, Wang Z, Gelein R, Zhou R, Dean DA, Notter RH, O’Reilly MA, Neonatal oxygen adversely affects lung function in adult mice without altering surfactant composition or activity, Am J Physiol Lung Cell Mol Physiol 297(4) (2009) L641–9. [DOI] [PMC free article] [PubMed] [Google Scholar]
- [26].Nishikawa S, Yasoshima A, Doi K, Nakayama H, Uetsuka K, Involvement of sex, strain and age factors in high fat diet-induced obesity in C57BL/6J and BALB/cA mice, Exp Anim 56(4) (2007) 263–72. [DOI] [PubMed] [Google Scholar]
- [27].Lindner U, Kramer J, Rohwedel J, Schlenke P, Mesenchymal Stem or Stromal Cells: Toward a Better Understanding of Their Biology?, Transfus Med Hemother 37(2) (2010) 75–83. [DOI] [PMC free article] [PubMed] [Google Scholar]
- [28].Vono R, Jover Garcia E, Spinetti G, Madeddu P, Oxidative Stress in Mesenchymal Stem Cell Senescence: Regulation by Coding and Noncoding RNAs, Antioxid Redox Signal 29(9) (2018) 864–879. [DOI] [PMC free article] [PubMed] [Google Scholar]
- [29].Pittenger MF, Mackay AM, Beck SC, Jaiswal RK, Douglas R, Mosca JD, Moorman MA, Simonetti DW, Craig S, Marshak DR, Multilineage potential of adult human mesenchymal stem cells, Science 284(5411) (1999) 143–7. [DOI] [PubMed] [Google Scholar]
- [30].Tontonoz P, Spiegelman BM, Fat and beyond: the diverse biology of PPARgamma, Annu Rev Biochem 77 (2008) 289–312. [DOI] [PubMed] [Google Scholar]
- [31].Tontonoz P, Hu E, Spiegelman BM, Regulation of adipocyte gene expression and differentiation by peroxisome proliferator activated receptor gamma, Curr Opin Genet Dev 5(5) (1995) 571–6. [DOI] [PubMed] [Google Scholar]
- [32].Sahler J, Woeller CF, Phipps RP, Microparticles Engineered to Highly Express Peroxisome Proliferator-Activated Receptor-gamma Decreased Inflammatory Mediator Production and Increased Adhesion of Recipient Monocytes, PloS one 9(11) (2014) e113189. [DOI] [PMC free article] [PubMed] [Google Scholar]
- [33].Singhal A, Kennedy K, Lanigan J, Fewtrell M, Cole TJ, Stephenson T, Elias-Jones A, Weaver LT, Ibhanesebhor S, MacDonald PD, Bindels J, Lucas A, Nutrition in infancy and long-term risk of obesity: evidence from 2 randomized controlled trials, Am J Clin Nutr 92(5) (2010) 1133–44. [DOI] [PubMed] [Google Scholar]
- [34].Fewtrell MS, Lucas A, Cole TJ, Wells JC, Prematurity and reduced body fatness at 8–12 y of age, Am J Clin Nutr 80(2) (2004) 436–40. [DOI] [PubMed] [Google Scholar]
- [35].Forsum EK, Flinke E, Olhager E, g. body composition study, Premature birth was not associated with increased body fatness in four-year-old boys and girls, Acta Paediatr 109(2) (2020) 327–331. [DOI] [PubMed] [Google Scholar]
- [36].Gummersbach C, Hemmrich K, Kroncke KD, Suschek CV, Fehsel K, Pallua N, New aspects of adipogenesis: radicals and oxidative stress, Differentiation 77(2) (2009) 115–20. [DOI] [PubMed] [Google Scholar]
- [37].Okuno Y, Fukuhara A, Hashimoto E, Kobayashi H, Kobayashi S, Otsuki M, Shimomura I, Oxidative Stress Inhibits Healthy Adipose Expansion Through Suppression of SREBF1-Mediated Lipogenic Pathway, Diabetes 67(6) (2018) 1113–1127. [DOI] [PubMed] [Google Scholar]
- [38].Carriere A, Carmona MC, Fernandez Y, Rigoulet M, Wenger RH, Penicaud L, Casteilla L, Mitochondrial reactive oxygen species control the transcription factor CHOP10/GADD153 and adipocyte differentiation: a mechanism for hypoxia-dependent effect, J Biol Chem 279(39) (2004) 40462–9. [DOI] [PubMed] [Google Scholar]
- [39].Rehan V, Torday J, Hyperoxia augments pulmonary lipofibroblast-to-myofibroblast transdifferentiation, Cell Biochem Biophys 38(3) (2003) 239–50. [DOI] [PubMed] [Google Scholar]
- [40].Lane SL, Dodson RB, Doyle AS, Park H, Rathi H, Matarrazo CJ, Moore LG, Lorca RA, Wolfson GH, Julian CG, Pharmacological activation of peroxisome proliferator-activated receptor gamma (PPAR-gamma) protects against hypoxia-associated fetal growth restriction, FASEB J 33(8) (2019) 8999–9007. [DOI] [PMC free article] [PubMed] [Google Scholar]
- [41].Yun Z, Maecker HL, Johnson RS, Giaccia AJ, Inhibition of PPAR gamma 2 gene expression by the HIF-1-regulated gene DEC1/Stra13: a mechanism for regulation of adipogenesis by hypoxia, Dev Cell 2(3) (2002) 331–41. [DOI] [PubMed] [Google Scholar]
- [42].Yee M, Gelein R, Mariani TJ, Lawrence BP, O’Reilly MA, The Oxygen Environment at Birth Specifies the Population of Alveolar Epithelial Stem Cells in the Adult Lung, Stem Cells 34(5) (2016) 1396–406. [DOI] [PMC free article] [PubMed] [Google Scholar]
- [43].Rascon B, Harrison JF, Lifespan and oxidative stress show a non-linear response to atmospheric oxygen in Drosophila, J Exp Biol 213(Pt 20) (2010) 3441–8. [DOI] [PubMed] [Google Scholar]
- [44].Krishnan J, Suter M, Windak R, Krebs T, Felley A, Montessuit C, Tokarska-Schlattner M, Aasum E, Bogdanova A, Perriard E, Perriard JC, Larsen T, Pedrazzini T, Krek W, Activation of a HIF1alpha-PPARgamma axis underlies the integration of glycolytic and lipid anabolic pathways in pathologic cardiac hypertrophy, Cell Metab 9(6) (2009) 512–24. [DOI] [PubMed] [Google Scholar]
- [45].Kosaka K, Kubota Y, Adachi N, Akita S, Sasahara Y, Kira T, Kuroda M, Mitsukawa N, Bujo H, Satoh K, Human adipocytes from the subcutaneous superficial layer have greater adipogenic potential and lower PPAR-gamma DNA methylation levels than deep layer adipocytes, Am J Physiol Cell Physiol 311(2) (2016) C322–9. [DOI] [PubMed] [Google Scholar]
- [46].Takada I, Mihara M, Suzawa M, Ohtake F, Kobayashi S, Igarashi M, Youn MY, Takeyama K, Nakamura T, Mezaki Y, Takezawa S, Yogiashi Y, Kitagawa H, Yamada G, Takada S, Minami Y, Shibuya H, Matsumoto K, Kato S, A histone lysine methyltransferase activated by non-canonical Wnt signalling suppresses PPAR-gamma transactivation, Nat Cell Biol 9(11) (2007) 1273–85. [DOI] [PubMed] [Google Scholar]
- [47].Singer NG, Caplan AI, Mesenchymal stem cells: mechanisms of inflammation, Annu Rev Pathol 6 (2011) 457–78. [DOI] [PubMed] [Google Scholar]
- [48].Crossno JT Jr., Majka SM, Grazia T, Gill RG, Klemm DJ, Rosiglitazone promotes development of a novel adipocyte population from bone marrow-derived circulating progenitor cells, J Clin Invest 116(12) (2006) 3220–8. [DOI] [PMC free article] [PubMed] [Google Scholar]
- [49].Majka SM, Fox KE, Psilas JC, Helm KM, Childs CR, Acosta AS, Janssen RC, Friedman JE, Woessner BT, Shade TR, Varella-Garcia M, Klemm DJ, De novo generation of white adipocytes from the myeloid lineage via mesenchymal intermediates is age, adipose depot, and gender specific, Proc Natl Acad Sci U S A 107(33) (2010) 14781–6. [DOI] [PMC free article] [PubMed] [Google Scholar]
- [50].Gavin KM, Gutman JA, Kohrt WM, Wei Q, Shea KL, Miller HL, Sullivan TM, Erickson PF, Helm KM, Acosta AS, Childs CR, Musselwhite E, Varella-Garcia M, Kelly K, Majka SM, Klemm DJ, De novo generation of adipocytes from circulating progenitor cells in mouse and human adipose tissue, FASEB J 30(3) (2016) 1096–108. [DOI] [PMC free article] [PubMed] [Google Scholar]
- [51].Ryden M, Uzunel M, Hard JL, Borgstrom E, Mold JE, Arner E, Mejhert N, Andersson DP, Widlund Y, Hassan M, Jones CV, Spalding KL, Svahn BM, Ahmadian A, Frisen J, Bernard S, Mattsson J, Arner P, Transplanted Bone Marrow-Derived Cells Contribute to Human Adipogenesis, Cell Metab 22(3) (2015) 408–17. [DOI] [PubMed] [Google Scholar]
- [52].Arner P, Ryden M, The contribution of bone marrow-derived cells to the human adipocyte pool, Adipocyte 6(3) (2017) 187–192. [DOI] [PMC free article] [PubMed] [Google Scholar]
- [53].Strioga M, Viswanathan S, Darinskas A, Slaby O, Michalek J, Same or not the same? Comparison of adipose tissue-derived versus bone marrow-derived mesenchymal stem and stromal cells, Stem Cells Dev 21(14) (2012) 2724–52. [DOI] [PubMed] [Google Scholar]
- [54].Yee M, Buczynski BW, Lawrence BP, O’Reilly MA, Neonatal hyperoxia increases sensitivity of adult mice to bleomycin-induced lung fibrosis, Am J Respir Cell Mol Biol 48(2) (2013) 258–66. [DOI] [PMC free article] [PubMed] [Google Scholar]
- [55].Mathieu PS, Loboa EG, Cytoskeletal and focal adhesion influences on mesenchymal stem cell shape, mechanical properties, and differentiation down osteogenic, adipogenic, and chondrogenic pathways, Tissue Eng Part B Rev 18(6) (2012) 436–44. [DOI] [PMC free article] [PubMed] [Google Scholar]