

Abstract
Anti–programmed cell death protein 1 (PD-1) therapy provides long-term clinical benefits to patients with advanced melanoma. The composition of the gut microbiota correlates with anti–PD-1 efficacy in preclinical models and cancer patients. To investigate whether resistance to anti–PD-1 can be overcome by changing the gut microbiota, this clinical trial evaluated the safety and efficacy of responder-derived fecal microbiota transplantation (FMT) together with anti–PD-1 in patients with PD-1–refractory melanoma. This combination was well tolerated, provided clinical benefit in 6 of 15 patients, and induced rapid and durable microbiota perturbation. Responders exhibited increased abundance of taxa that were previously shown to be associated with response to anti–PD-1, increased CD8+ T cell activation, and decreased frequency of interleukin-8–expressing myeloid cells. Responders had distinct proteomic and metabolomic signatures, and transkingdom network analyses confirmed that the gut microbiome regulated these changes. Collectively, our findings show that FMT and anti–PD-1 changed the gut microbiome and reprogrammed the tumor microenvironment to overcome resistance to anti–PD-1 in a subset of PD-1 advanced melanoma.
Immune checkpoint blockade with monoclonal antibodies (mAbs) targeting programmed cell death protein 1 (PD-1) provides long-term clinical benefits to nearly 40% of patients with advanced melanoma (1–5). In addition to tumor-intrinsic mechanisms supporting resistance to anti–PD-1 mAbs (anti–PD-1), the gut microbiome is a major tumor-extrinsic regulator of responses to anti–PD-1 (6–9). In mice, composition of the gut microbiome modulates therapeutic activity of anti–PD-1 and anti–programmed death-ligand 1 (PD-L1), and administration of certain gut commensals or fecal microbiota transplantation (FMT) promotes anti–PD-1 efficacy in melanoma-bearing mice (10–12). Although multiple studies have reported that a favorable gut microbiome is associated with response to anti–PD-1 in cancer patients, its precise composition is not yet fully understood (10–12). Specifically in melanoma, key bacterial species belonging to various phyla, including Actinobacteria (Bifidobacteriaceae spp. and Coriobacteriaceae spp.) and Firmicutes (Ruminococcaceae spp. and Lachnospiraceae spp.), are associated with favorable response to mAbs targeting PD-1 in cancer patients, although limited concordance among the identified species has been reported in different studies (10–14). Whether microbiome-based therapy can overcome resistance to anti–PD-1 in patients with advanced melanoma has not been evaluated. To address this question, we designed a single-arm clinical trial to evaluate the safety and efficacy of FMT obtained from individual long-term responder (R) melanoma patients together with anti–PD-1 in PD-1–refractory metastatic melanoma patients (NCT03341143; fig. S1).
A subset of PD-1–refractory melanoma patients respond to fecal microbiota transplant and anti–PD-1 therapy
Sixteen melanoma patients were enrolled between June 2018 and January 2020 (table S1), and the results presented here reflect a data cutoff of 1 September 2020. All melanoma patients were primary refractory to anti–PD-1 therapy, defined as patients who had no prior response to anti–PD-1 alone or in combination with anticytotoxic T lymphocyte–associated protein 4 or investigational agents (table S1) and had confirmed primary progressive disease (PD), as assessed by an independent radiologist using response evaluation criteria in solid tumors (RECIST v1.1) (15, 16). Among PD-1–refractory patients included in the trial, only one had a best response of short-term stable disease (SD) before radiographically confirmed PD. All enrolled patients and candidate donors underwent serial stool sampling and extensive infectious studies to eliminate the possibility of transmitting infectious agents (fig. S2). Seven donors, including four with complete response (CR) and three with partial response (PR), with median progression-free survival (PFS) of 56 months (range: 45 to 70 months) were used to treat 16 patients (table S2). Blood and stool specimens were obtained serially and screened for 32 viral, bacterial, fungal, and protozoan agents before FMT (fig. S2). A single donor–derived FMT was administered along with pembrolizumab (fig. S1), followed by additional pembrolizumab therapy every 3 weeks until disease progression or intolerable toxicity. Radiographic assessments were conducted every 12 weeks (four cycles), and response was classified by using RECIST v1.1. Of the 16 patients enrolled, 15 received FMT and pembrolizumab and had at least one restaging computed tomography (CT) scan and thus were deemed evaluable for response. One patient who had a rapid clinical decline after FMT that was deemed secondary to rapid disease progression was evaluable for safety but not response. Objective responses (ORs) were noted in 3 (PT-18–0032, CR; PT-18–0007 and PT-19–0024, PR) out of 15 patients [OR rate (ORR): 20%], whereas 3 (PT-18–0018, PT-19–0002, and PT-19–0010) out of 15 patients (20%) had durable SD lasting >12 months (Fig. 1, A and B). Representative radiographic examples from all three R patients with ORR are provided (Fig. 1C and figs. S3 and S4). Median PFS and overall survival (OS) in all patients were 3.0 and 7.0 months, respectively, at a median follow-up of 7 months. In six patients with disease control (i.e., OR and SD), median PFS and OS were 14.0 and 14.0 months, respectively (Fig. 1B). Among these patients, one patient (PT-18–0007) exhibited ongoing PR after >2 years and is currently on surveillance, whereas four patients (PT-18–0018, PT-19–0002, PT-19–0010, and PT-19–0024) remain on treatment. One patient (PT-18–0032) with radiographic CR underwent an elective surgical procedure for spinal stenosis but suffered a spinal infarct unrelated to therapy and subsequently passed away. Our study shows that FMT together with anti–PD-1 overcame resistance to anti–PD-1 in a subset of PD-1–refractory melanoma patients. Although these preliminary findings warrant further evaluation in a larger randomized clinical trial, the observed ORR was superior to ORRs reported in melanoma patients primary refractory to anti–PD-1 therapy treated beyond progression (17). Treatment-related adverse events (AEs) were minimal (table S3). Although all patients experienced at least one AE, these were mostly low grade (grade 1, 72.9%; grade 2, 20.0%). Endocrinologic AEs, mostly hypothyroidism, occurred in 17.6% of patients and were easily managed with hormone replacement. Grade 3 AEs occurred in three patients: two instances of fatigue, in which underlying endocrinological issues were excluded and resolved, and one case of peripheral motor neuropathy (PT-19–0024) that required hospitalization, intravenous immunoglobulin, and corticosteroids and resolved with no further sequelae upon reinstitution of pembrolizumab.
Fig. 1. Radiographic responses from a phase 2 study of anti–PD-1 responder–derived FMT and pembrolizumab in PD-1–refractory melanoma.
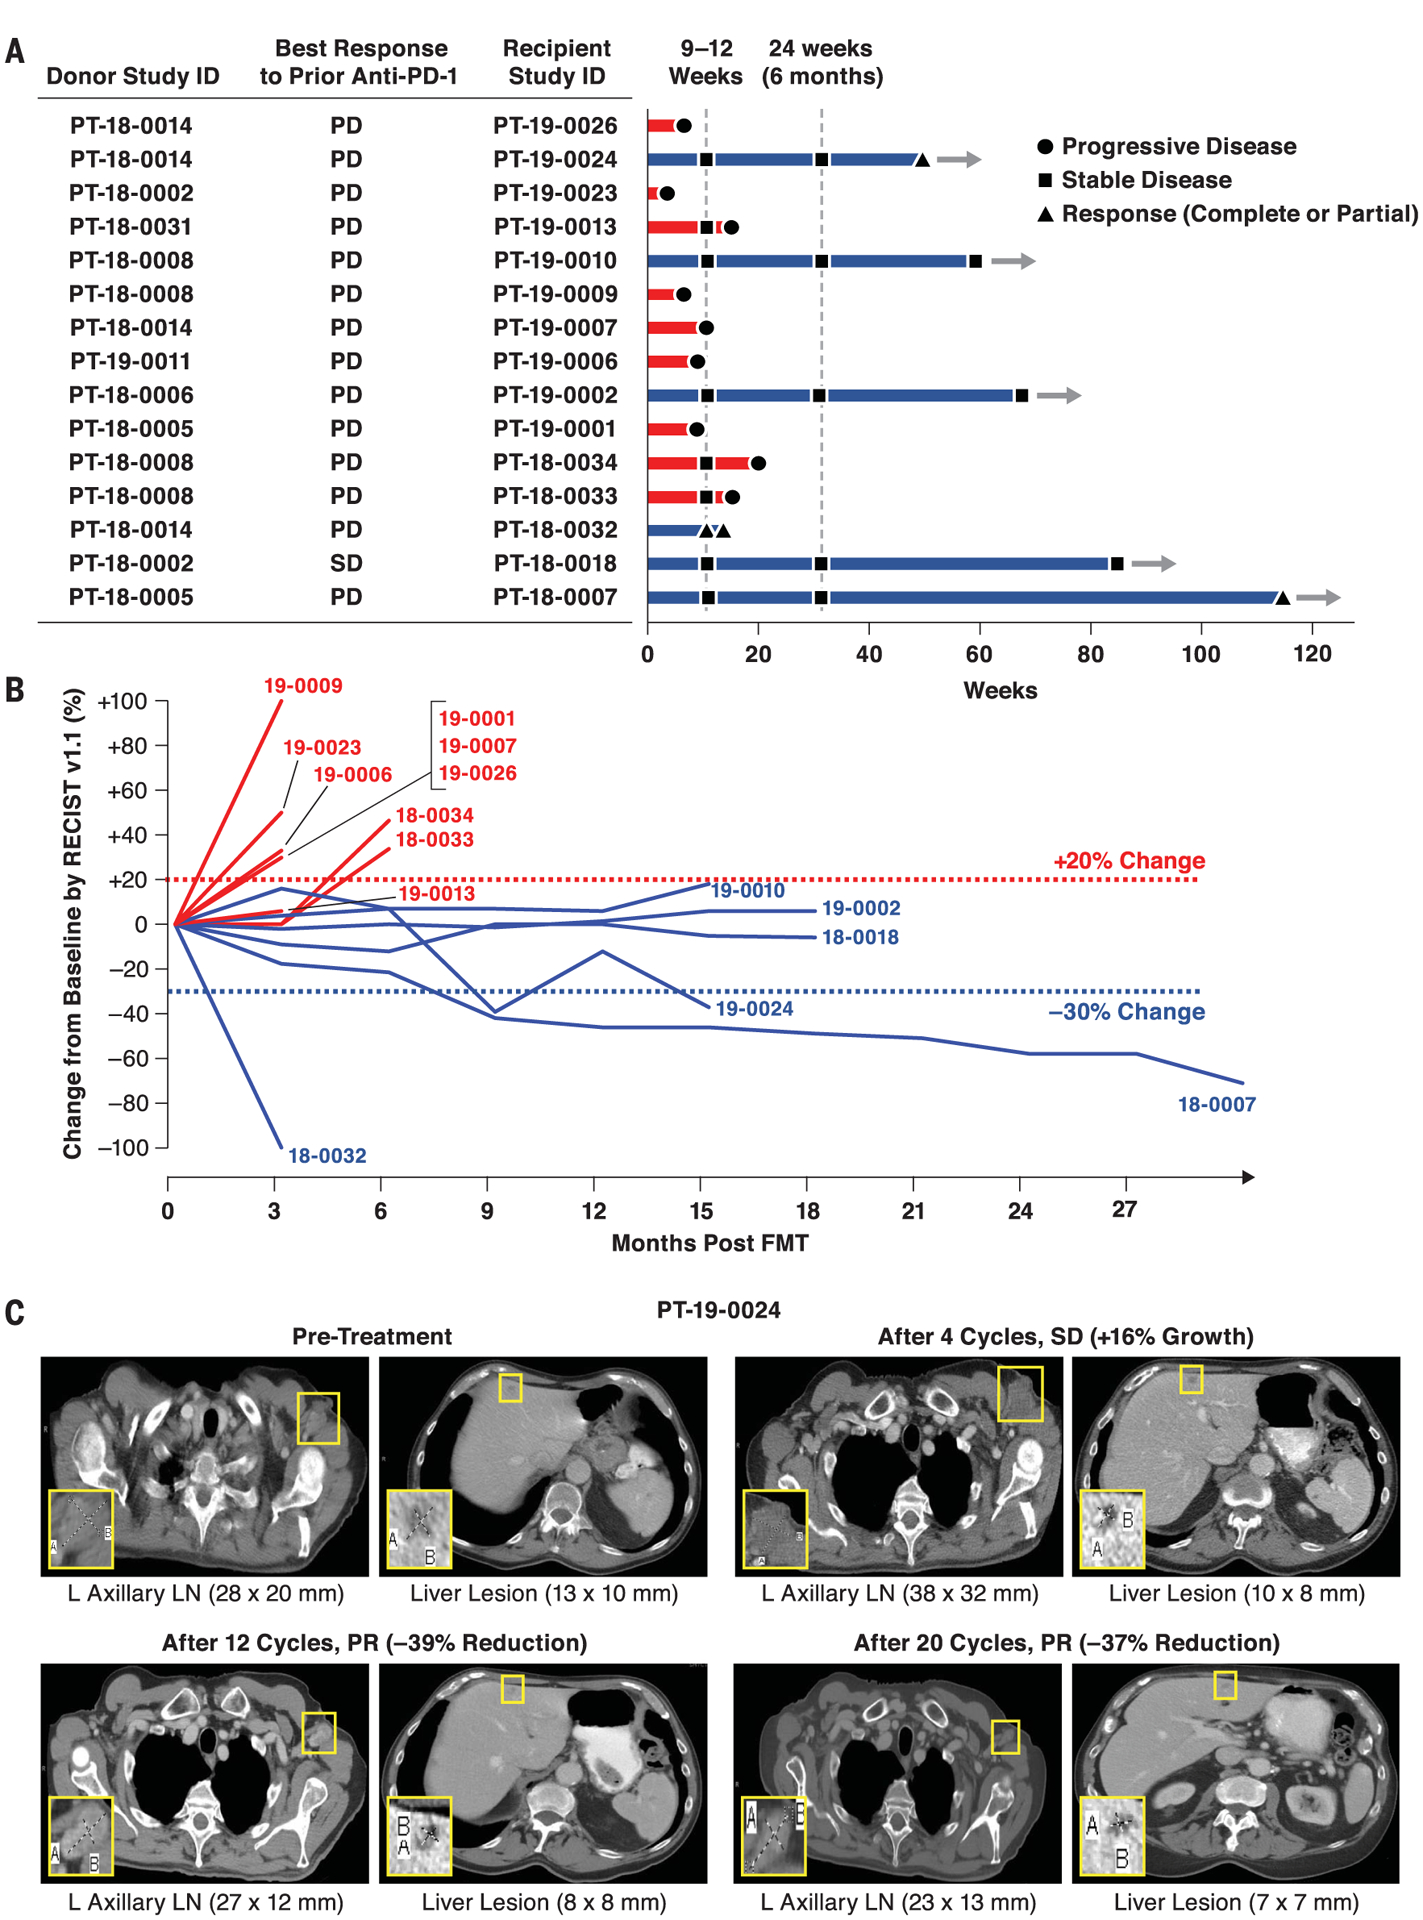
Melanoma patients who had primary refractory disease to anti–PD-1 therapy received FMT derived from individual melanoma patients with durable OR to anti–PD-1 therapy. FMT was administered colonoscopically on day 0 along with pembrolizumab (200 mg). Pembrolizumab was repeated every 3 weeks. Restaging scans were performed at weeks 9 to 12 and repeated every 9 to 12 weeks while in the study. Patients remained in the study until intolerable toxicity, RECIST v1.1–confirmed disease progression, or completion of 35 cycles of pembrolizumab. (A and B) Treatment exposure and response duration by RECIST v1.1 (investigator assessed; n = 15). (A) FMT donor and best response to prior line(s) of anti–PD-(L)1 therapy singly or in combination are shown for each FMT-recipient patient. The length of each bar corresponds to the duration of time that patients received treatment (in weeks). Response status is color coded (R, blue; NR, red). Response symbols represent status at first restaging scan (9 to 12 weeks) and at most recent review. Patients with ongoing response in the study are depicted with horizontal arrows. (B) Radiographic change of tumor burden from baseline (investigator assessed per RECIST v1.1; n = 15). One patient (PT-18–0018) had initial disease stability with subsequent progression after antibiotic therapy and was offered a retransplant with the same donor, with subsequent disease stabilization. (C) Representative CT scans from one responding patient. CT scans from patient PT-19–0024 at four separate time points depict initial tumor growth after FMT followed by eventual PR. L, left; LN, lymph node.
Fecal microbiota transplant induces persistent perturbation of recipients’ gut microbiome
To evaluate the effects of FMT on gut microbiota composition in recipients and the relationship with clinical response, defined as OR or SD >12 months after FMT and anti–PD-1 on the basis of RECIST 1.1 criteria, we performed shotgun metagenomic sequencing of 223 fecal samples obtained from recipients (n = 15) and donors (n = 7). For each recipient, we sequenced one pre-FMT sample (obtained 7 to 21 days before FMT) and all available post-FMT samples (obtained weekly for 12 weeks and then every 3 weeks for as long as the patient remained on trial) (Fig. 2A). For each corresponding FMT, we sequenced the distinctive donor-specific “FMT infusate” obtained from specific FMT donors (table S2 and fig. S5A). Uniform manifold approximation and projection (UMAP) analyses depicted distinct gut microbiota composition in recipients (Fig. 2A) and donors (fig. S5A). No significant difference in response after FMT was observed in patients that received infusates from donors that had either a CR or PR to anti–PD-1 (fig. S5B). The microbiota in CR donors exhibited higher alpha diversity than in PR donors, but no significant differences were observed between donors and recipients before FMT (fig. S5C). In recipients, gut microbiota composition changed after a single FMT in Rs and nonresponders (NRs) (Fig. 2A), an alteration that persisted unless a significant perturbation occurred (e.g., antibiotic use in PT-18–0032 before day 22 and PT-18–0018 before day 84). Of note, all separately collected infusates produced from individual donors were highly similar to each other (fig. S5, A and D). To evaluate intrapatient variability in both donors and recipients, we computed sample variance across all time points and all taxa in all available samples from recipients and donors (only those with at least three samples) (Fig. 2B). Variance was significantly greater in all recipients after FMT compared with that in donors (Fig. 2B), although Rs had a trend toward greater variance compared with NRs (fig. S6). We quantified differences and rate of change in microbiome communities in recipients using multidimensional Euclidean distance. Specifically, the speed of traversion, as inferred from the Euclidean distance traversed per day, trended higher in Rs than NRs (Fig. 2C). Although this parameter did not reach statistical significance (likely because of the limited sample size), the Euclidean distance still notably separated patients who achieved disease control from those who did not.
Fig. 2. Microbiome analyses before and after FMT in melanoma patients.
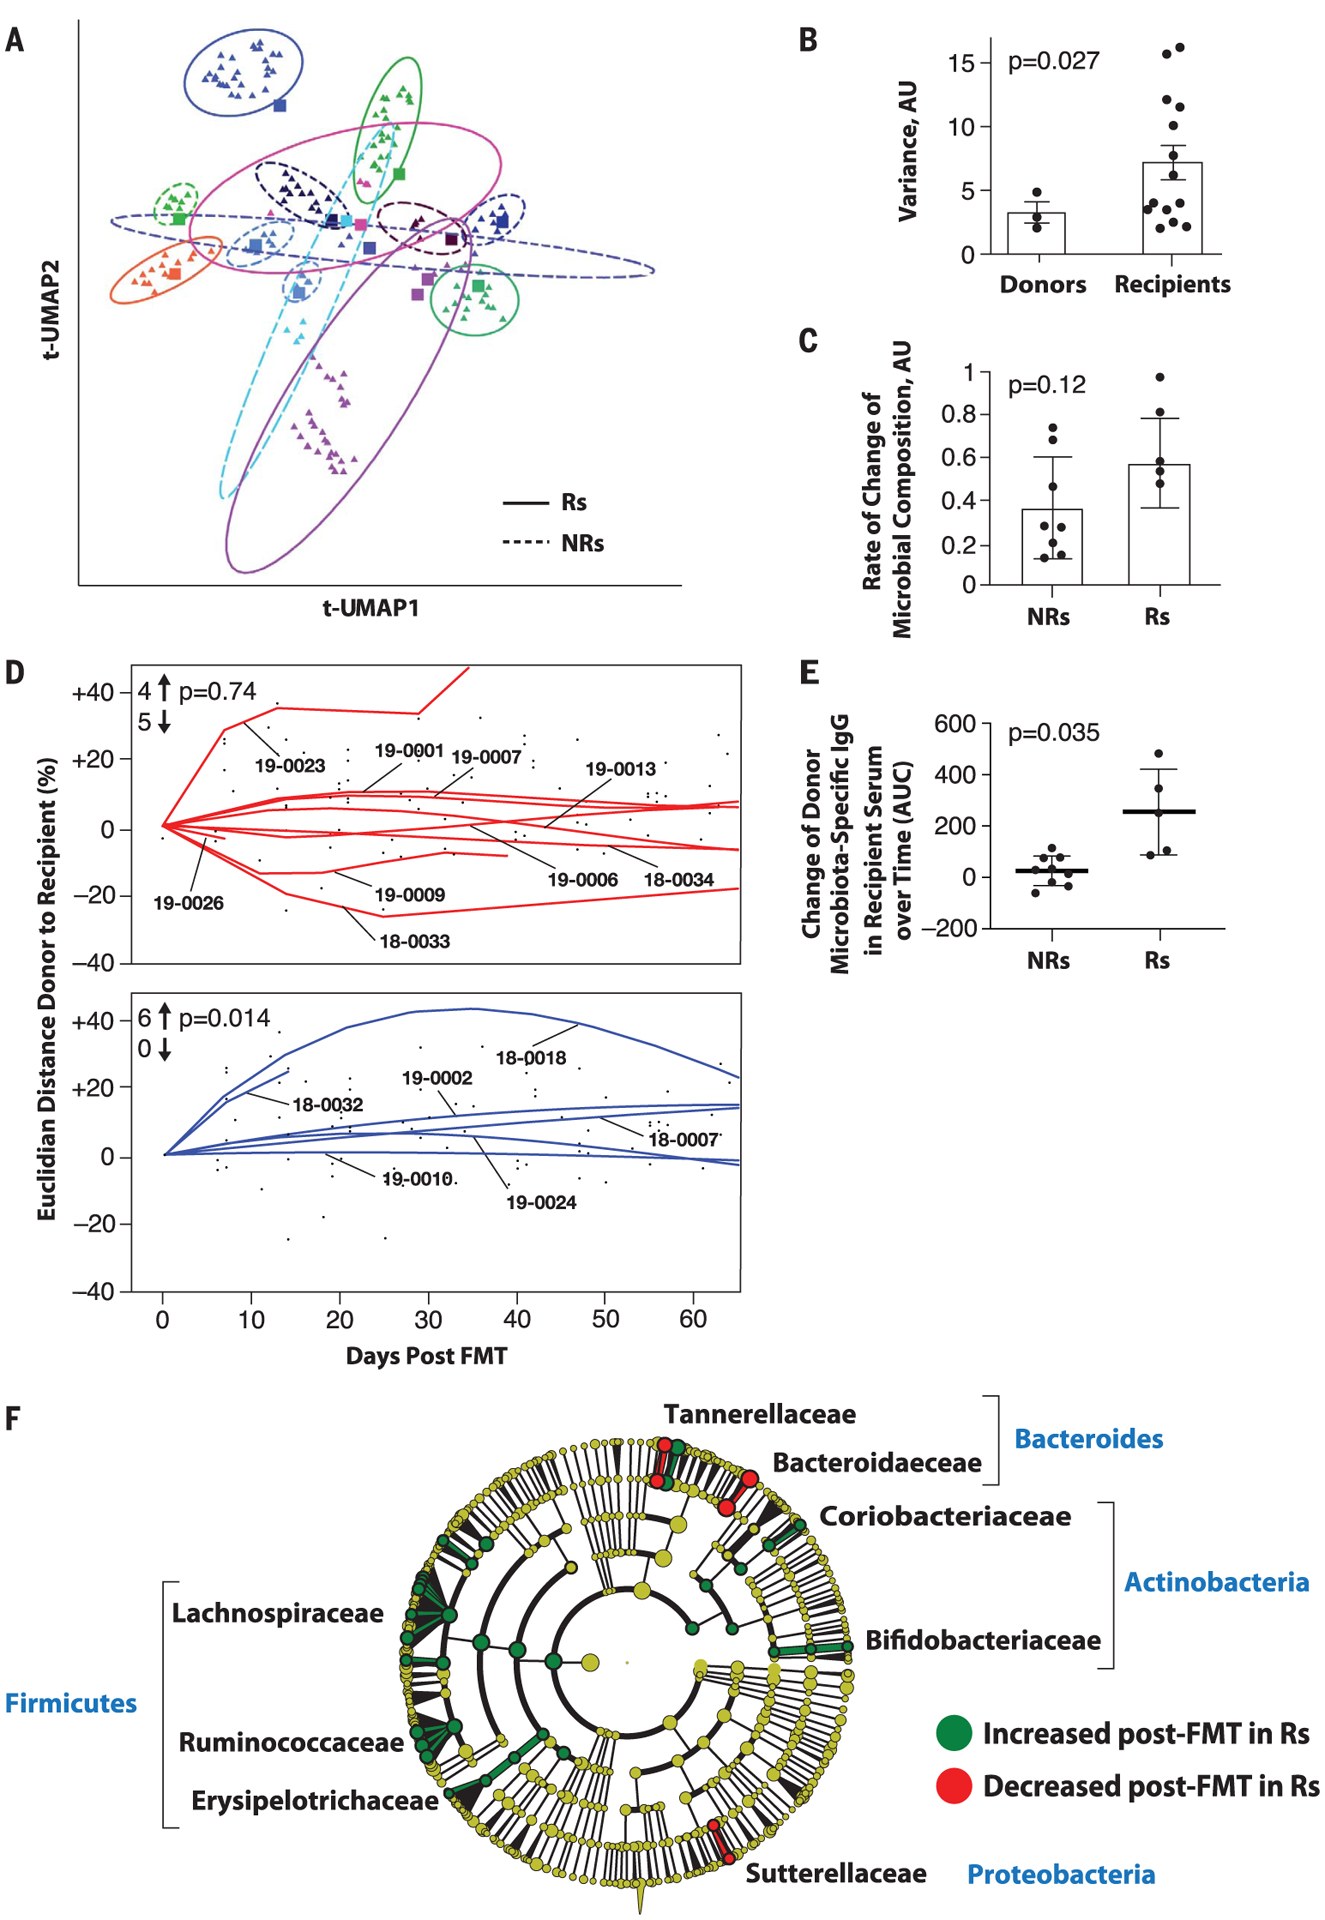
(A) Dimensionality reduction using t-distributed UMAP (t-UMAP) plot of microbial taxa abundances by last known taxon of FMT recipients at different time points. Each color corresponds to a different FMT-treated patient. Pre-FMT stool samples are depicted as squares and post-FMT stool samples as triangles. Ellipses encapsulate each recipient’s pre- and post-FMT samples, and the size of the ellipse spans two standard deviations from the centroid. Rs and NRs are distinguished by solid and dashed lines, respectively. PT-19–0026 (PD) is not depicted because the patient had a single post-FMT sample. (B) Intrapatient variance of stool samples from donors and recipients after standardization and dimensionality reduction. Donors (n = 3) and recipients (n = 15) who contributed at least three fecal samples are depicted. Data were standardized, PCA was performed, PC loading was computed, and variances of patients for every PC loading were calculated as the squared standard deviation divided by the mean and were multiplied by the PC variance contribution. Resultant values were added together to produce a combined variance number, which was compared between donors (n = 3) and recipients (n = 15) by using the nonparametric t test. AU, arbitrary units. (C) Rate of taxonomic change of stool samples sequentially obtained from treated patients. The rate of taxonomic change for each sample sequentially obtained from each patient was calculated by using speed of traversion (Euclidean distances traversed per day), which was calculated by dividing total Euclidean distance traveled by days. Euclidean distance was calculated by using log-transformed normalized taxonomic data from shotgun sequencing between Rs (n = 6) and NRs (n = 9) by using the nonparametric t test. (D) Plot of Euclidean distance over time from patients’ gut microbiota to corresponding FMT donor’s microbiota. To assess the efficiency of FMT engraftment, Euclidean fitted curves were generated by using points on the graph in both NRs (red, above) and Rs (blue, below). A positive percentage of each curve indicates similarity to the corresponding donor, whereas a negative percentage indicates changes in the recipient microbiota even further from the donor microbiota. Graphs were normalized by truncating at 60 days in both Rs and NRs. The chi-square test was calculated by using an even distribution as null hypothesis. (E) Recipient IgG response against donor microbiota induced by FMT. Donor fecal bacteria were incubated with recipient sera at 1:200 dilutions, washed and stained with phycoerythrin-labeled antihuman IgG, and fixed and analyzed on a flow cytometer. Change in IgG positivity of donor fecal bacteria for each FMT recipient was calculated in relation to the first FMT recipient serum sample available compared with the subsequent two time points up to 50 days later. Percent IgG-positive donor fecal bacteria was assessed, and area under the curve (AUC) for percent IgG-positive donor bacteria was calculated, adjusting all recipient time points relative to the baseline time point set to zero. Difference in reactivity between sera from Rs and NRs was evaluated by Student’s t test. (F) Cladogram visualization of phylogenetic distribution of differentially abundant taxa before and after FMT in responding patients. Fisher’s method for meta-analyses was used to validate statistical significance and calculate effect size of the differential abundances of taxa in Rs (fig. S10). Differentially abundant taxa are color coded on the basis of relative abundance in post-compared with pretransplant samples (green, higher; yellow, unchanged; red, lower). The most significantly associated taxa are highlighted at the family level.
To investigate the degree of donor microbial implantation and its relationship to response in patients over time, we evaluated the acquired similarity of the recipient microbiota to the donor microbiota by measuring the Euclidian distance between donor microbial composition and every available time point of the corresponding recipients, starting from the pretreatment sample (Fig. 2D). We observed that the gut microbiota composition shifted significantly toward donor microbiota in Rs but not in NRs (Fig. 2D and fig. S7, left). FMT implantation was clearly heterogeneous in the NR group (n = 9), in which about half of the recipients had samples that were similar and the other half had samples that were dissimilar to corresponding donors (Fig. 2D, top). By contrast, the gut microbiota in Rs (n = 6) uniformly shifted toward donor samples (Fig. 2D, bottom). We also evaluated the humoral immune response to donor bacteria using recipient serum and donor feces and observed that FMT administration induced donor bacteria–specific immunoglobulin G (IgG) to a greater extent in Rs compared with NRs (Fig. 2E and fig. S8), suggesting that successful implantation and mucosal trans-location of the transplanted bacteria, known to induce an IgG response against commensal bacteria, may preferentially occur in Rs (18).
The use of systemic antibiotics was prohibited on study; however, PT-18–0018 developed a soft-tissue infection that required antibiotics (fig. S9). During this period, pembrolizumab was withheld, although stool samples and imaging were obtained at protocol-specified intervals. Initial microbiome after FMT shifted toward the donor’s microbiome with SD. After antibiotics, metagenomic data revealed pronounced changes in microbial community composition (loss of Faecalibacterium prausnitzii, Alistipes spp., and Ruminococcaceae spp.), which correlated with clinical progression. A second transplant from the same donor was performed nearly 1 year after initial FMT and resulted in rapid gut colonization associated with ongoing SD (fig. S9). Overall, although successful colonization after FMT did not always resensitize PD-1–refractory melanoma patients to anti–PD-1, clinical response was associated with FMT implantation and donor microbiota–specific IgG response. Furthermore, the changes of microbiome composition after FMT were rapidly disturbed by use of antibiotics, which depleted beneficial taxa (i.e., F. prausnitzii, Alistipes spp., and Ruminococcaceae spp.), in accordance with previously reported deleterious effects of antibiotic use with regards to anti–PD-1 in cancer patients (12, 19).
To analyze the bacterial species most commonly associated with clinical benefit to FMT, we first performed statistical analyses between pre- and post-FMT samples in Rs, followed by a meta-analysis using Fisher’s method to identify common features among all samples (Fig. 2G and fig. S10). Several bacterial species associated with clinical response have been previously reported (Bifidobacterium longum, Colinsella aerofaciens, and F. prausnitzii) (10, 11). Most of the significantly enriched taxa in Rs belonged to the phyla Firmicutes (Lachnospiraceae and Ruminococcaceae families) and Actinobacteria (Bifidobacteriaceae and Coriobacteriaceae families), whereas most of the bacteria decreased in Rs belonged to phylum Bacteroidetes.
Fecal microbiota transplant and anti–PD-1 modulate immune responses peripherally and intratumorally
To evaluate the immunological effects of FMT and anti–PD-1 in treated patients, we performed multiparameter flow cytometry and single-cell RNA sequencing (scRNA-seq) analysis from peripheral blood mononuclear cells (PBMCs) and tumor samples, respectively, collected before and after treatment. Unsupervised single-cell analysis on spectral flow cytometry of PBMCs was performed at three consecutive time points before and after treatment (Fig. 3, A and B, and fig. S11, A and B) (20, 21). Compared with NRs, Rs displayed higher percentages of CD56+CD8+ T cells after treatment (day 42), which represent a subset of activated CD8+ T cells with higher cytolytic functions (Fig. 3B) (22–24). CD8+CD56+ T cells expressed high levels of TIGIT, CD57, 2B4, OX40, ICOS, 4–1BB, CD16, NKp46, NKp30, granzyme B, perforin, and CD103 compared with total CD8+ T cells (fig. S11C). These findings are in line with previous reports in cancer patients responding to immunotherapy, including radioimmunotherapy (25) or PD-1 blockade (26). In Rs, CD8+ T cells up-regulated TIGIT (day 21) as well as T-bet and LAG-3 (day 42) and down-regulated CD27 (day 21) compared with NRs at these time points (Fig. 3C). Rs exhibited lower percentages of naïve CD8+ T cells (day 21) and higher percentages of terminally differentiated effector memory CCR7−CD45RA+ (TEMRA) cells (day 42) compared with NRs (Fig. 3D). These observations suggest that circulating CD8+ T cells are more activated and differentiated in Rs, as previously shown in cancer patients who respond to PD-1 blockade (27, 28). Mucosal-associated invariant T (MAIT) cells, which respond to bacterial antigens and inflammatory cytokines, expressed more granzyme B (day 42) and less CD27 (day 42) in Rs compared with NRs, suggesting a more differentiated phenotype (Fig. 3E). We observed no significant differences in the frequencies of circulating myeloid cell subsets before and after treatment (fig. S11, D and E). Our data show that FMT together with anti–PD-1 expanded activated CD56+CD8+ T cells and increased activation of CD8+ T and MAIT cells in PBMCs of Rs.
Fig. 3. Single-cell analyses of circulating and tumor-infiltrating immune cells.
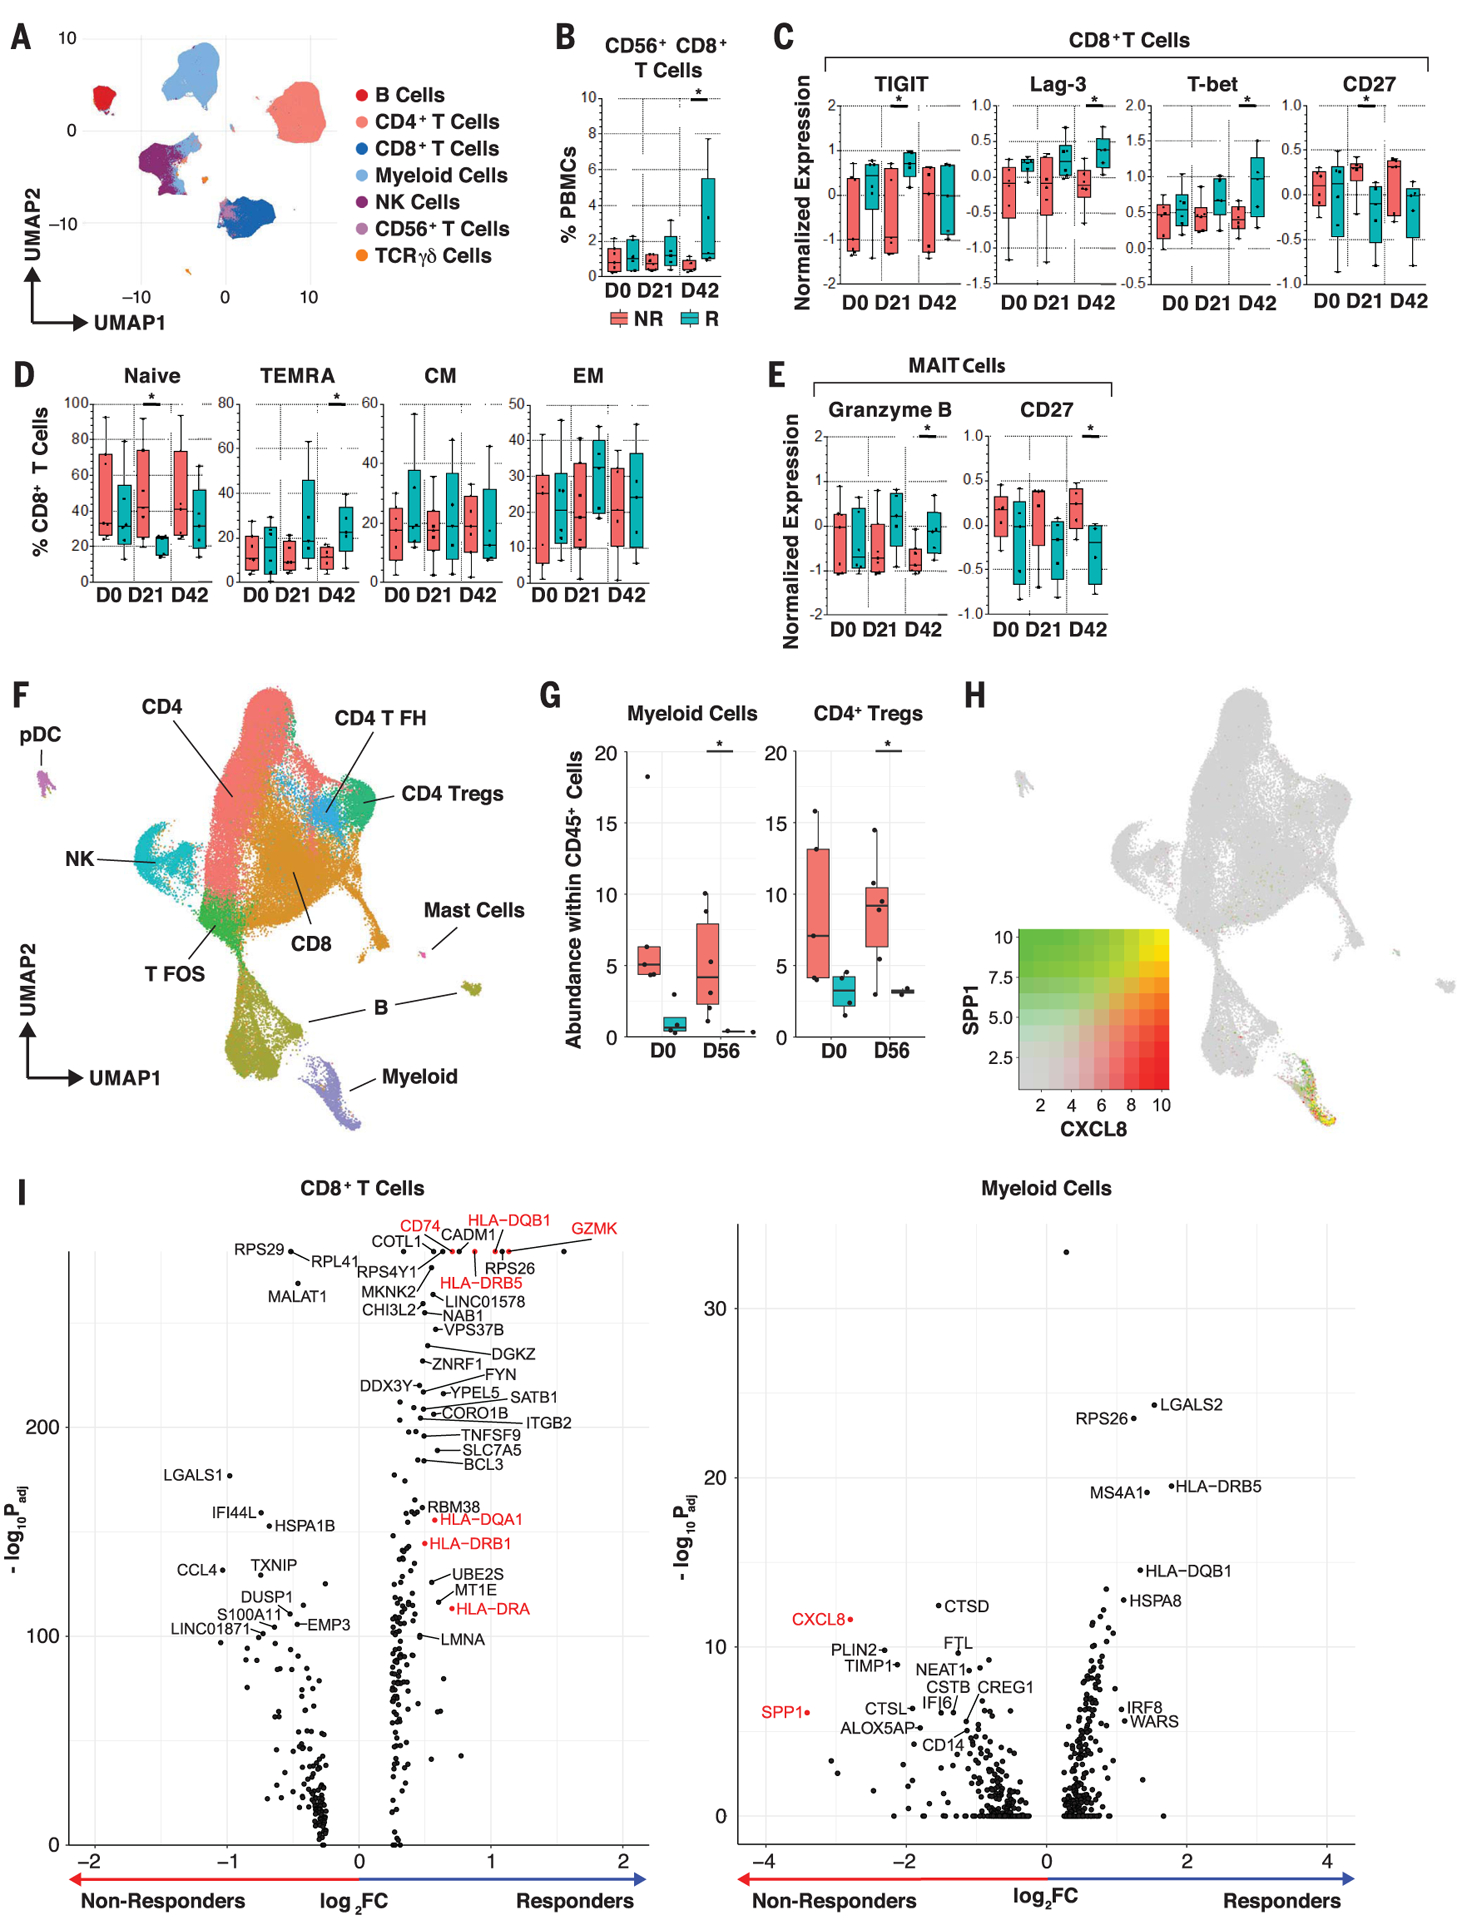
(A) Unsupervised multiparameter flow cytometry analysis of circulating immune cells. UMAP visualization of 100,000 live single cells from Rs and NRs at three time points—pretreatment (D0), day 21 (D21), and D42—from 30-parameter flow panel analysis (n = 14) after merging clusters on the basis of expression of CD3, CD4, CD8, CD19, CD14, CD56, Tγδ1, and Tγδ2. Myeloid cells were identified as lineage-negative cell clusters on the basis of presence or absence of CD14+ cells. (B) Frequency of CD56+CD8+ clustered T cells in PBMCs of patients. Whisker boxes show frequencies of CD56+CD8+ clustered T cells in PBMCs between Rs and NRs at D0, D21, and D42. We observed a significant increase of CD56+CD8+ T cells in Rs at D42 using the unpaired t test. *p < 0.05. (C and D) Phenotypic analysis of circulating CD8+ T cells. Whisker boxes show markers that are significantly differentially expressed (normalized mean fluorescence intensity) in CD8+ T cells (C) and CCR7+CD45RA+-naïve, TEMRA, CCR7+CD45RA− effector memory (EM), and CCR7−CD45RA− central memory (CM) cells (D) between Rs (n = 5 to 6) and NRs (n = 5 to 7) at the three time points. Analysis was performed on live single CD3+ and TCRgd− T cells. In Rs, we observed up-regulation of TIGIT, Lag-3, and T-bet after treatment and down-regulation of CD27 in CD8+ T cells using the unpaired t test. *p < 0.05. (E) Phenotypic analysis of circulating MAIT cells. Whisker boxes comparing MAIT cells between Rs (n = 5 to 6) and NRs (n = 5 to 7) at the three time points. Analysis was performed on live single CD3+ and TCRgd− T cells. In Rs, MAIT cells up-regulated granzyme B expression and down-regulated CD27 after treatment using the unpaired t test. *p < 0.05. (F) scRNA-seq analysis of tumor-infiltrating immune cells. UMAP projection of 64,000 CD45+ cells that were clustered and manually identified on the basis of their expression profile. NK, natural killer; pDC, plasmacytoid dendritic cell; T FH, T follicular helper; T FOS, T cells expressing FOS; Tregs, T regulatory cells. (G) Whisker boxes showing the abundance of myeloid cells and CD4+ Tregs in CD45+ tumor-infiltrating cells. We observed decreased abundance of myeloid cells and CD4+ Tregs in Rs compared with NRs using the unpaired t test. *p < 0.05. (H) Cell-associated expression of two markers (CXCL8 and SPP1) in UMAP projection. These markers are predominantly expressed in suppressive myeloid cells. (I) Volcano plots showing the differences in phenotype of CD8+ T cells and myeloid cells between Rs and NRs after FMT. Rs show a CD8+ T phenotype with increased activation markers (GZMK, class II HLA genes, CD74), whereas NRs show a myeloid phenotype with an increased suppressive signature (CXCL8 and SPP1) at day 56 after treatment. Adjusted p values were obtained by Wilcoxon rank sum test.
CD45+ cells were sorted from single-cell suspension obtained from tumor biopsies used for scRNA-seq analysis (10X Genomics Chromium). In total, 64,340 cells from 17 tumor samples were collected before (four Rs and five NRs) and after treatment (two Rs and six NRs). After normalization and batch-effect removal (29), cells were clustered into 26 groups. Each cluster was manually labeled by gene expression profile (table S4) to identify 10 distinct cell types (Fig. 3F). We observed a high frequency of myeloid cells (p = 0.026) and CD4+ regulatory T cells (P = 0.02) among CD45+ cells in NRs compared with Rs after treatment, whereas the other clusters did not exhibit significant changes (Fig. 3G and fig. S12). Myeloid cells expressed high levels of CXCL8 [interleukin-8 (IL-8)] and SPP1 (osteopontin), which increased after FMT in NRs compared with Rs, suggesting a myeloid gene signature previously associated with tumor progression (Fig. 3, H and I) (30, 31). CD8+ T cells up-regulated human leucocyte antigen (HLA) class II genes CD74 and GZMK in Rs compared with NRs after treatment, supporting increased T cell activation at tumor sites (Fig. 3I, left). Together, our findings demonstrate that FMT and anti–PD-1 counteract myeloid-induced immunosuppression to augment CD8+ T cell activation in the tumor microenvironment of Rs. Insufficient tumor tissue was available to evaluate the role of tumor mutation burden, PD-L1 expression, and interferon-γ (IFN-γ) gene expression signature in predicting clinical outcome.
Fecal microbiota transplant alters serum metabolome and cytokines in responders
To assess the impact of FMT on systemic parameters of the host and its relationship with response to therapy, we performed multi-omics analysis of serum samples, including analyses of serum cytokines and chemokines, as well as serum metabolomics and lipidomics analyses. Although Rs and NRs exhibited similar composition of serum cytokines and chemokines, Luminex multiparameter proteomics profiling showed a prominent shift in levels of circulating cytokines and chemokines in Rs, whereas NRs had little or no change [Fig. 4A, principal components analysis (PCA)]. Multiple circulating cytokines and chemokines decreased after FMT in Rs, including CCL2 (MCP1), CXCL8 (IL-8), and IL-18 that have been associated with negative outcomes to anti–PD-1 (32, 33), and IL-12p70 and IFN-γ (Fig. 4A, heatmap). These latter two cytokines are usually associated with antitumor effector T cell responses. However, chronic activation of the IL-12–IFN-γ axis, as may occur in refractory patients treated with anti–PD-1, could induce a multigenic resistance program in tumor cells and could disrupt T cell response, differentiation, and exhaustion through production of nitric oxide and down-regulation of TCF1 (34–36). The cytokines and chemokines that were most prominently up-regulated are associated with follicular helper T and B cell signatures found in tertiary lymphoid structures, such as IL-21 and CXCL13 (BCP1). We also observed up-regulation of type II cytokines such as IL-5, IL-13, and IL-10; the tumor necrosis factor (TNF) family of cytokines such as TNF and TRAIL; and cytokines promoting monocyte cell migration (CX3CL1) and dendritic cell expansion (FLT3L). Altogether, our findings show that Rs down-regulated multiple circulating cytokines and chemokines associated with resistance to anti–PD-1 while up-regulating circulating biomarkers that are associated with favorable clinical outcome. In particular, Rs exhibited decreased circulating IL-8 and decreased frequencies of IL-8–producing myeloid cells in tumors. IL-8 is an immunosuppressive cytokine secreted by intratumoral and circulating myeloid cells, levels of which correlate adverse prognosis to anti–PD-1 in multiple cancers, including melanoma (30, 37).
Fig. 4. Serum proteomics, metabolomics, and lipidomics signatures before and after FMT.
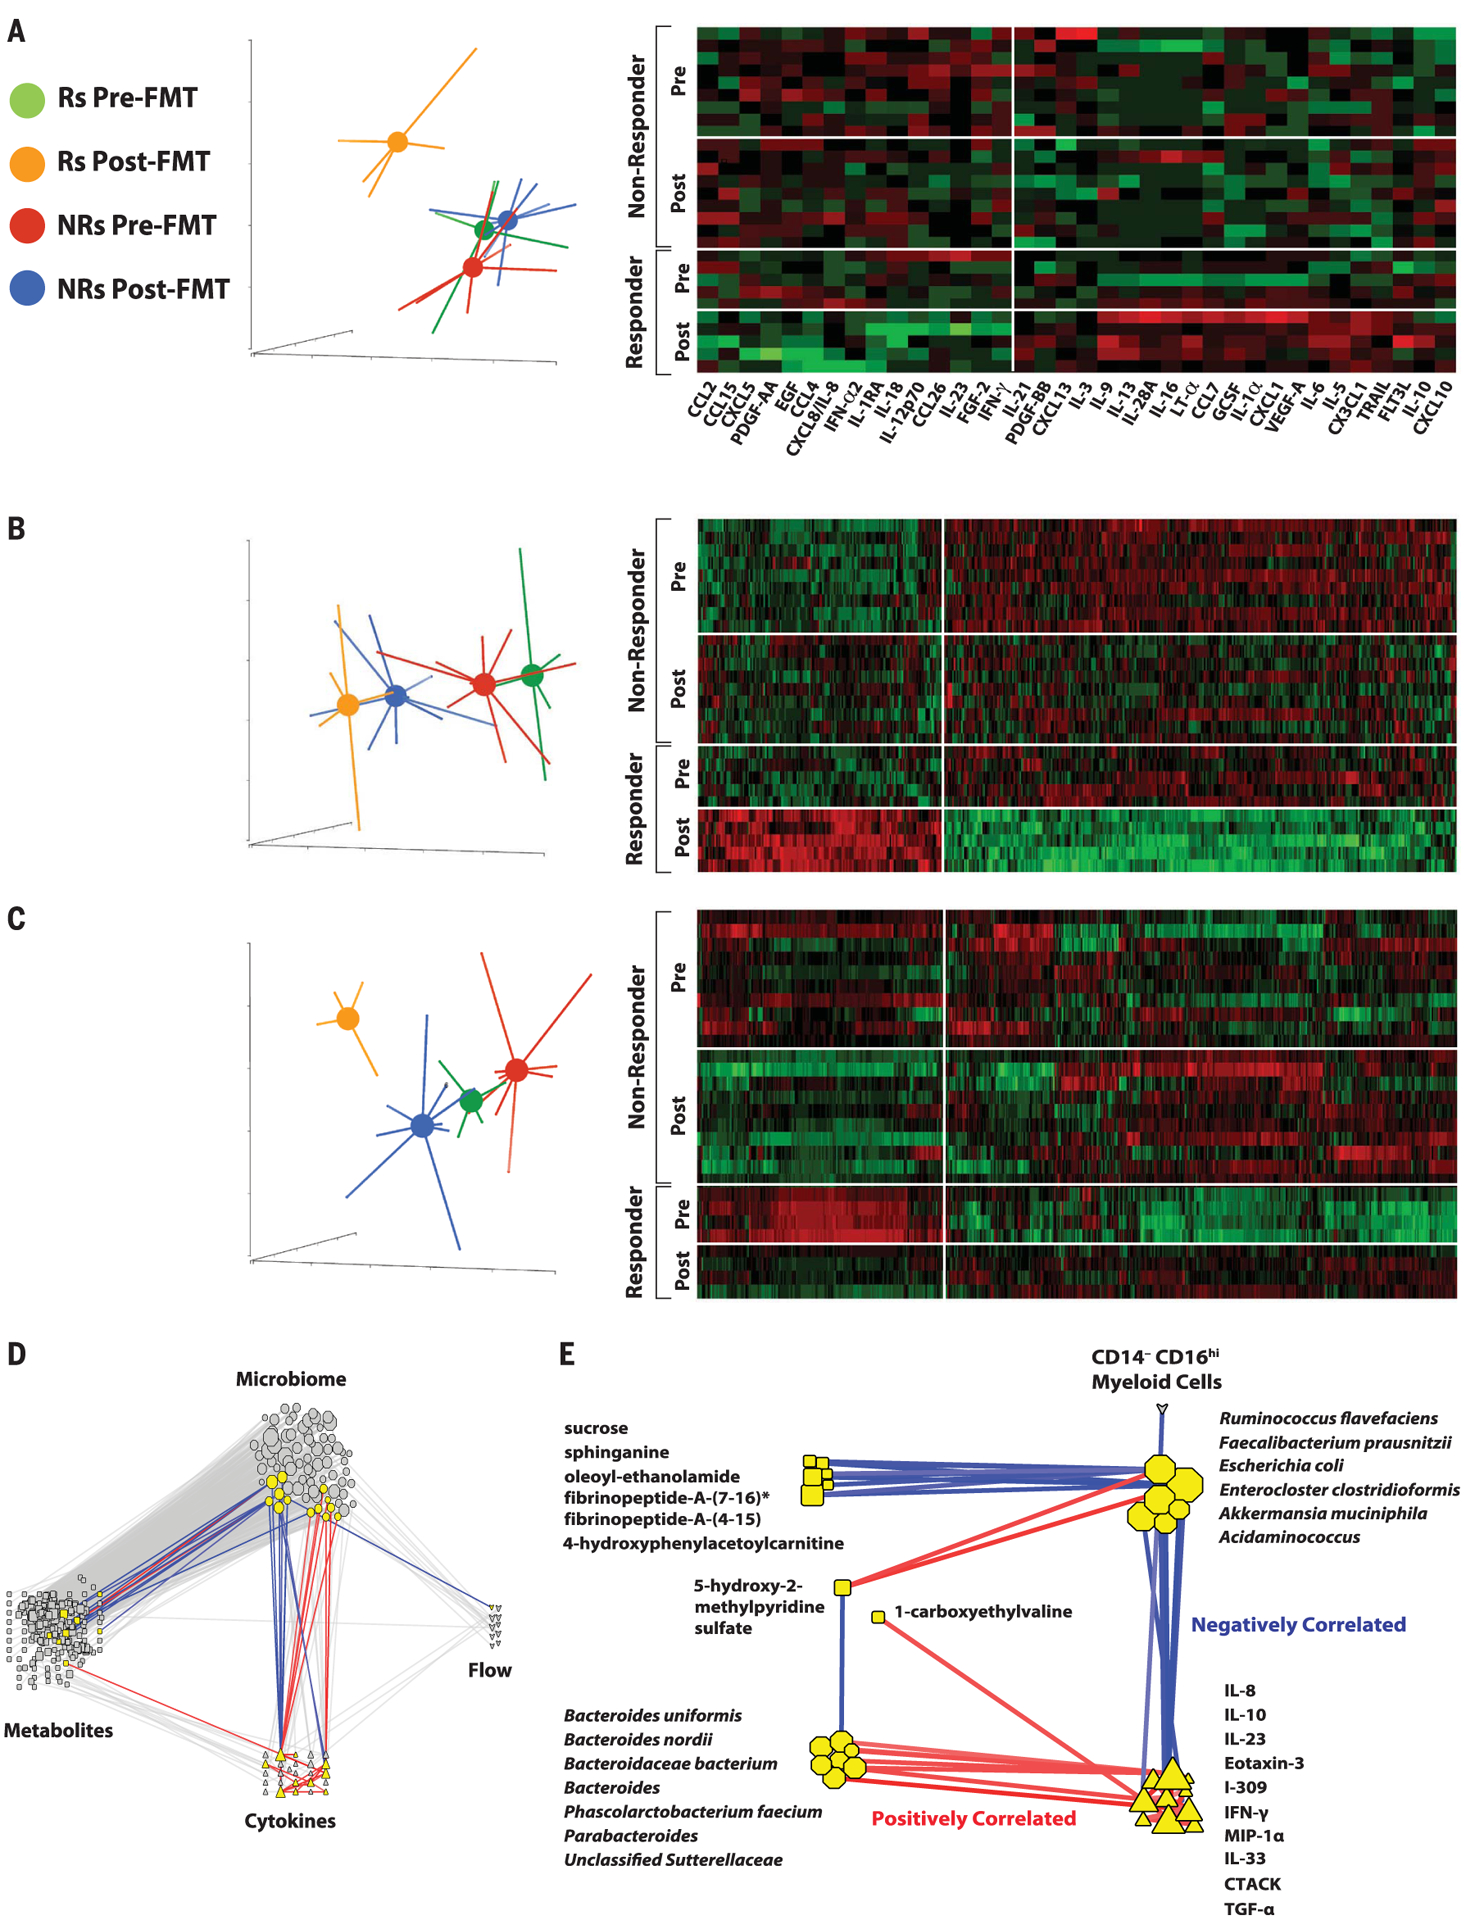
(A) PCA and heatmap of serum cytokines of Rs and NRs before and after FMT. Data show that Rs after treatment (orange) separate from Rs before treatment (green), along with NRs before (red) and after (blue) treatment, as assessed by two-way analysis of variance (ANOVA; *p < 0.05). (B) PCA and heatmap of serum metabolites of Rs and NRs before and after FMT. Data show that Rs after treatment (orange) separate from Rs before treatment (green), along with NRs before (red) and after treatment (blue), as assessed by using two-way ANOVA (q < 0.05). (C) PCA and heatmap of serum lipidomics of Rs and NRs before and after FMT. Serum lipidomic analyses show that Rs after treatment (orange) distinctly clustered separately from Rs before treatment (green), along with NRs before (red) and after (blue) treatment, as assessed by using two-way ANOVA (q < 0.05). (D) Transkingdom network analysis of multi-omic data. Data for microbial (octagons), metabolites (squares), cytokines (triangles), and multiparameter flow cytometry (hearts) were analyzed to identify highly differentially abundant elements between Rs and NRs to FMT and pembrolizumab. To identify nodes (i.e., any of these four types of elements) and their groups with potential contribution to a regulatory activity, a “transkingdom” network integrating -omics data was constructed by using their correlations within the different groups (Rs or NRs, before or after FMT and pembrolizumab). Network interrogation revealed that “microbiome” and “metabolite” as well as “microbiome” and “cytokine” subnetworks were the most interconnected. We identified a dense subnetwork (module) containing the highest number of nodes from different -omics data (nodes highlighted in yellow, positively correlated edges in red, and negatively correlated edges in blue). (E) Subnetwork identified in (D). Network analyses established that CXCL8 (IL-8), IL-10, and CCL3 (MIP-1α) were positively correlated with organisms enriched in NRs before treatment (Bacteroides uniformis, Bacteroides nordii, Phascolarctobacterium faecium, etc.) and negatively correlated with organisms enriched in Rs after treatment (e.g., Ruminococcus flavefaciens and F. prausnitzii).
FMT and anti–PD-1 resulted in significant changes in the serum metabolomic profile of both Rs and NRs (Fig. 4B and fig. S13), although the most pronounced metabolomic shifts occurred in Rs (Fig. 4B, PCA plot). The most significant and pronounced changes after FMT affected metabolites that are usually associated with gut microbiota (38). Serum bile acids were increased after FMT with more efficient transformation of primary to secondary bile acids in Rs versus NRs (fig. S14). In addition, the levels of bacterial catabolism products of aromatic compounds through benzoate degradation were higher in Rs than in NRs. Some of these compounds, including hippurate, p-cresol sulfate, and hydrocinnamate, have been described as biomarkers of microbiome diversity and correlated with the presence of taxa associated with response to anti–PD-1 (figs. S13 and S14) (39). Whereas pre-FMT samples from Rs and NRs had very similar lipidomic profiles, significant changes were observed in post-FMT samples from Rs but not NRs (Fig. 4C and fig. S15), including higher levels of triacylglycerols and lower levels of monoacylglycerols and diacylglycerols, possibly reflecting microbiome-controlled differences in lipid absorption (40).
The gut microbiome regulates the biological signatures observed in responders
To identify causal relationships between host and microbes independent of a particular group or patient, we created a statistical model of robust interactions between the different players—”transkingdom network” analyses—using different types of -omics data (41, 42). The transkingdom network consisted of 371 nodes and 819 edges, in which nodes represented individual elements of -omics datasets (metagenomic, metabolomic, lipidomic, flow cytometric, and proteomic) and edges represented positive and negative correlations between those elements (Fig. 4D). Most of the interomic edges belonged to the microbial metagenome dataset, which had a large number of positive (red) and negative (blue) network connections with the metabolomic and proteomic datasets. Microbial nodes were more densely connected to other -omics datasets than any other node, suggesting their central role in governing interomic changes after FMT and anti–PD-1. Some nodes in the transkingdom network analysis were highly interconnected, forming subnetworks. These subnetworks were identified by using the MCODE plugin of Cytoscape (43), and one subnetwork connected all four -omics datasets (Fig. 4E). In particular, we observed that gut bacterial commensals that were previously shown to increase (F. prausnitzii and Akkermansia muciniphila) and decrease (Bacteroides genus) responses to anti–PD-1 (10) were negatively and positively correlated with CXCL8 (IL-8), respectively.
Conclusion
Our findings show that a single FMT administered colonoscopically together with PD-1 blockade successfully colonized the gut of Rs and reprogrammed the tumor microenvironment to overcome primary resistance to anti–PD-1 in a subset of patients with advanced melanoma. FMT shifted microbiome composition toward taxa favoring anti–PD-1 efficacy to induce clinical responses to anti–PD-1 in PD-1–refractory melanoma patients, who had an immunological ability to respond to the treatment but exhibited an unfavorable microbiota composition. Conversely, PD-1–refractory patients may not respond to FMT for various reasons, including (i) an inability to respond to the tumor regardless of microbiota composition because of the patient’s immunodeficient status or lack of tumor immunogenicity, (ii) an absence of taxa needed for anti–PD-1 therapy effectiveness in the FMT, or (iii) failure of the FMT to successfully implant into the recipient and induce perturbations of host microbiota favoring anti–PD-1. Our findings warrant further investigation in larger clinical trials to better identify microbial, circulating, and intratumoral biomarkers to select patients most likely to benefit from microbiome-based therapy of melanoma. We expect that such studies will lead to the identification of a bacterial consortium capable of converting a subset of melanoma patients primary refractory to anti–PD-1 therapy into R patients.
Supplementary Material
ACKNOWLEDGMENTS
We acknowledge all patients and families affected by metastatic melanoma. We acknowledge the input of E. Chu for design and conduct of this study.
Funding:
The clinical trial (NCT03341143) was supported by a research contract from Merck MSD to D.D. D.D. is supported by the Melanoma Breakthrough Foundation Breakthrough Consortium. H.M.Z. is supported by the National Cancer Institute (NCI) of the National Institutes of Health (NIH) (award numbers R01 CA228181 and R01 CA222203) and the James W. and Frances G. McGlothlin Chair in Melanoma Immunotherapy Research. Work of the UPMC Hillman Cancer Center Microbiome Shared Facility and Cytometry Facility is supported by the NIH NCI Comprehensive Cancer Center Support CORE grant (P30 CA047904). This research was supported in part by the University of Pittsburgh Center for Research Computing and Unified Flow Cytometry Core of the University of Pittsburgh’s Department of Immunology through the resources provided. This work was supported in part by the Intramural Research Program of the NIH, NIAID, and NCI Center for Cancer Research.
Footnotes
Competing interests: D.D. reports the following disclosures: Merck, Bristol-Myers Squibb, Checkmate Pharmaceuticals, CellSight Technologies, MedPacto, and GlaxoSmithKline (research support); Array Biopharma, Checkmate Pharmaceuticals, Incyte, Immunocore, and Merck; Shionogi (consulting); and Vedanta Biosciences (scientific advisory board). Y.G.N. reports the following disclosures: Merck, Pfizer, and Bristol-Myers Squibb (research support). J.M.K. reports the following disclosures: Amgen, Bristol-Myers Squibb, Castle Biosciences, Checkmate Pharmaceuticals, Immunocore LLC, Iovance, and Novartis (research support) and Amgen, Bristol-Myers Squibb, Checkmate Pharmaceuticals, and Novartis (consulting). H.M.Z. reports the following disclosures: Bristol-Myers Squibb, Checkmate Pharmaceuticals, and GlaxoSmithKline (research support) and Bristol-Myers Squibb, Checkmate Pharmaceuticals, GlaxoSmithKline, and Vedanta (consulting). The other authors declare no competing interests.
Data and materials availability: The data reported in this paper are tabulated in the main text and supplementary materials. Sequencing data and metadata have been deposited with the BioProject database, ID PRJNA672867 (www.ncbi.nlm.nih.gov/bioproject/672867).
SUPPLEMENTARY MATERIALS
science.sciencemag.org/content/371/6529/595/suppl/DC1
Materials and Methods
Figs. S1 to S15
Tables S1 to S4
References (44–51)
MDAR Reproducibility Checklist
REFERENCES AND NOTES
- 1.Larkin J et al. , JAMA Oncol. 1, 433–440 (2015). [DOI] [PubMed] [Google Scholar]
- 2.Ribas A et al. , JAMA 315, 1600–1609 (2016). [DOI] [PubMed] [Google Scholar]
- 3.Robert C et al. , N. Engl. J. Med 372, 320–330 (2015). [DOI] [PubMed] [Google Scholar]
- 4.Robert C et al. , Lancet Oncol. 20, 1239–1251 (2019). [DOI] [PubMed] [Google Scholar]
- 5.Robert C et al. , N. Engl. J. Med 372, 2521–2532 (2015). [DOI] [PubMed] [Google Scholar]
- 6.Dzutsev A, Goldszmid RS, Viaud S, Zitvogel L, Trinchieri G, Eur. J. Immunol 45, 17–31 (2015). [DOI] [PubMed] [Google Scholar]
- 7.Finlay BB et al. , Nat. Rev. Immunol 20, 522–528 (2020). [DOI] [PubMed] [Google Scholar]
- 8.Goldszmid RS et al. , Cancer Immunol. Res 3, 103–109 (2015). [DOI] [PMC free article] [PubMed] [Google Scholar]
- 9.Zarour HM, Clin. Cancer Res 22, 1856–1864 (2016). [DOI] [PMC free article] [PubMed] [Google Scholar]
- 10.Gopalakrishnan V et al. , Science 359, 97–103 (2018). [DOI] [PMC free article] [PubMed] [Google Scholar]
- 11.Matson V et al. , Science 359, 104–108 (2018). [DOI] [PMC free article] [PubMed] [Google Scholar]
- 12.Routy B et al. , Science 359, 91–97 (2018). [DOI] [PubMed] [Google Scholar]
- 13.Frankel AE et al. , Neoplasia 19, 848–855 (2017). [DOI] [PMC free article] [PubMed] [Google Scholar]
- 14.Peters BA et al. , Genome Med. 11, 61 (2019). [DOI] [PMC free article] [PubMed] [Google Scholar]
- 15.Eisenhauer EA et al. , Eur. J. Cancer 45, 228–247 (2009). [DOI] [PubMed] [Google Scholar]
- 16.Kluger HM et al. , J. Immunother. Cancer 8, e000398 (2020).32238470 [Google Scholar]
- 17.Ribas A, Kirkwood JM, Flaherty KT, Lancet Oncol. 19, e219 (2018). [DOI] [PubMed] [Google Scholar]
- 18.Zeng MY et al. , Immunity 44, 647–658 (2016). [DOI] [PMC free article] [PubMed] [Google Scholar]
- 19.Pinato DJ et al. , JAMA Oncol. 5, 1774–1778 (2019). [DOI] [PMC free article] [PubMed] [Google Scholar]
- 20.Krieg C et al. , Nat. Med 24, 144–153 (2018). [DOI] [PubMed] [Google Scholar]
- 21.Nowicka M et al. , F1000Res. 6, 748 (2017). [DOI] [PMC free article] [PubMed] [Google Scholar]
- 22.Pittet MJ, Speiser DE, Valmori D, Cerottini JC, Romero P, J. Immunol 164, 1148–1152 (2000). [DOI] [PubMed] [Google Scholar]
- 23.Ohkawa T et al. , Immunology 103, 281–290 (2001). [DOI] [PMC free article] [PubMed] [Google Scholar]
- 24.Guia S et al. , Blood 111, 5008–5016 (2008). [DOI] [PubMed] [Google Scholar]
- 25.Hasumi K, Aoki Y, Wantanabe R, Mann DL, OncoImmunology 2, e26381 (2013). [DOI] [PMC free article] [PubMed] [Google Scholar]
- 26.Ribas A et al. , Cancer Immunol. Res 4, 194–203 (2016). [DOI] [PMC free article] [PubMed] [Google Scholar]
- 27.Kamphorst AO et al. , Proc. Natl. Acad. Sci. U.S.A 114, 4993–4998 (2017). [DOI] [PMC free article] [PubMed] [Google Scholar]
- 28.Kunert A et al. , J. Immunother. Cancer 7, 149 (2019). [DOI] [PMC free article] [PubMed] [Google Scholar]
- 29.Stuart T et al. , Cell 177, 1888–1902.e21 (2019). [DOI] [PMC free article] [PubMed] [Google Scholar]
- 30.Schalper KA et al. , Nat. Med 26, 688–692 (2020). [DOI] [PMC free article] [PubMed] [Google Scholar]
- 31.Alshetaiwi H et al. , Sci. Immunol 5, eaay6017 (2020). [DOI] [PMC free article] [PubMed] [Google Scholar]
- 32.Gok Yavuz B et al. , Sci. Rep 9, 3172 (2019). [DOI] [PMC free article] [PubMed] [Google Scholar]
- 33.Terme M et al. , Cancer Res. 71, 5393–5399 (2011). [DOI] [PubMed] [Google Scholar]
- 34.Benci JL et al. , Cell 167, 1540–1554.e12 (2016). [DOI] [PMC free article] [PubMed] [Google Scholar]
- 35.Danilo M, Chennupati V, Silva JG, Siegert S, Held W, Cell Rep. 22, 2107–2117 (2018). [DOI] [PubMed] [Google Scholar]
- 36.Koblish HK, Hunter CA, Wysocka M, Trinchieri G, Lee WM, J. Exp. Med 188, 1603–1610 (1998). [DOI] [PMC free article] [PubMed] [Google Scholar]
- 37.Sanmamed MF et al. , Ann. Oncol 28, 1988–1995 (2017). [DOI] [PMC free article] [PubMed] [Google Scholar]
- 38.Vernocchi P, Del Chierico F, Putignani L, Front. Microbiol 7, 1144 (2016). [DOI] [PMC free article] [PubMed] [Google Scholar]
- 39.Pallister T et al. , Sci. Rep 7, 13670 (2017). [DOI] [PMC free article] [PubMed] [Google Scholar]
- 40.Martinez-Guryn K et al. , Cell Host Microbe 23, 458–469.e5 (2018). [DOI] [PMC free article] [PubMed] [Google Scholar]
- 41.Rodrigues RR, Shulzhenko N, Morgun A, Methods Mol. Biol 1849, 227–242 (2018). [DOI] [PMC free article] [PubMed] [Google Scholar]
- 42.Yambartsev A et al. , Biol. Direct 11, 52 (2016). [DOI] [PMC free article] [PubMed] [Google Scholar]
- 43.Shannon P et al. , Genome Res. 13, 2498–2504 (2003). [DOI] [PMC free article] [PubMed] [Google Scholar]
Associated Data
This section collects any data citations, data availability statements, or supplementary materials included in this article.