Abstract
Friedreich ataxia is an autosomal recessive, neurodegenerative disease characterized by the deficiency of the iron‐sulfur cluster assembly protein frataxin. Loss of this protein impairs mitochondrial function. Mitochondria alter their morphology in response to various stresses; however, such alterations to morphology may be homeostatic or maladaptive depending upon the tissue and disease state. Numerous neurodegenerative diseases exhibit excessive mitochondrial fragmentation, and reversing this phenotype improves bioenergetics for diseases in which mitochondrial dysfunction is a secondary feature of the disease. This paper demonstrates that frataxin deficiency causes excessive mitochondrial fragmentation that is dependent upon Drp1 activity in Friedreich ataxia cellular models. Drp1 inhibition by the small peptide TAT‐P110 reverses mitochondrial fragmentation but also decreases ATP levels in frataxin‐knockdown fibroblasts and FRDA patient fibroblasts, suggesting that fragmentation may provide a homeostatic pathway for maintaining cellular ATP levels. The cardiolipin‐stabilizing compound SS‐31 similarly reverses fragmentation through a Drp1‐dependent mechanism, but it does not affect ATP levels. The combination of TAT‐P110 and SS‐31 does not affect FRDA patient fibroblasts differently from SS‐31 alone, suggesting that the two drugs act through the same pathway but differ in their ability to alter mitochondrial homeostasis. In approaching potential therapeutic strategies for FRDA, an important criterion for compounds that improve bioenergetics should be to do so without impairing the homeostatic response of mitochondrial fragmentation.
Keywords: ATP, Drp1, Drp1‐dependent small peptides, frataxin, Friedreich ataxia, mitochondrial fragmentation, mitochondrial homeostasis
Drp1 inhibition by the small peptide TAT‐P110 reverses mitochondrial fragmentation but also decreases ATP levels in FRDA cellular models, suggesting that fragmentation may provide a homeostatic pathway for maintaining cellular ATP levels. The cardiolipin‐stabilizing compound SS‐31 similarly reverses fragmentation through a Drp1‐dependent mechanism, but it does not affect ATP levels. In approaching potential therapeutic strategies for FRDA, an important criterion for compounds that improve bioenergetics should be to do so without impairing the homeostatic response of mitochondrial fragmentation.

Abbreviations
- ETC
electron transport chain
- FRDA
Friedreich ataxia
- ICC
immunocytochemistry
- IMM
inner mitochondrial membrane
1. INTRODUCTION
Friedreich ataxia (FRDA) is an autosomal recessive, neurodegenerative disease with no approved therapy. 1 , 2 The disease results from the decreased transcription of the gene encoding frataxin (FXN), a nuclear‐encoded mitochondrial protein critical for iron‐sulfur cluster biosynthesis. 3 , 4 FXN deficiency thus causes numerous metabolic abnormalities, including the decreased activity of metabolic enzymes that rely on iron‐sulfur cluster prosthetic groups. 5 , 6 A rational approach to developing a treatment for FRDA, therefore, includes the study of compounds that may ameliorate patients’ metabolic deficiencies.
The degree of mitochondrial network fragmentation is one biomarker of mitochondrial health. 7 , 8 Under normal conditions, mitochondria fuse into a tubular network that optimizes ATP synthesis and efficiently transports mtDNA to mitochondria throughout the cell. 9 When a cell prepares to divide, the mitochondrial network fragments, ensuring that each of the daughter cells receives a sufficient number of mitochondria. Additionally, mitochondrial fission isolates dysfunctional mitochondria, preparing the mitochondria for mitophagy. 10 , 11 However, excessive mitochondrial fragmentation occurs in numerous neurodegenerative disease models, even in cells not preparing for division. 12 , 13 Depending upon the tissue type and disease state, this increased mitochondrial fragmentation is associated with impaired ATP synthesis, increased apoptosis through cytochrome c release, upregulated mitophagy, or other physiological abnormalities. 14 Thus, increased mitochondrial fragmentation may serve as a biomarker of the disease state.
Dynamin‐related protein 1 (Drp1) executes mitochondrial fragmentation. 15 , 16 When this GTPase is phosphorylated at its (Ser616) residue, it translocates to the outer mitochondrial membrane where it binds to mitochondrial fission protein 1 (Fis1). 17 Here, it oligomerizes with other copies of this phospho‐protein, surrounds the mitochondria, and mechanically severs it. As increased mitochondrial fragmentation is a feature of numerous disease models, 18 the Drp1 inhibitor P110 was developed to prevent or reverse excessive mitochondrial fragmentation. 19 This small peptide, sometimes fused to the cell‐penetrating peptide TAT, specifically prevents the interaction between Drp1 and Fis1 in addition to inhibiting Drp1’s GTPase activity. P110 improves bioenergetics and ameliorates oxidative stress in several models of neurodegenerative diseases, 20 , 21 , 22 but its effects in FRDA have not previously been studied.
Szeto‐Schiller Compound 31 (SS‐31, elamipretide) shows promise as a drug that may improve mitochondrial functioning in numerous disease models, likely through decreasing oxidative damage. 23 , 24 This compound interacts with cardiolipin (CL), a four‐tailed derivative of phosphatidic acid that primarily localizes to the inner mitochondrial membrane (IMM). 24 CL forms cristae in the IMM and anchors components of the electron transport chain (ETC) to the IMM. 25 The interaction between CL and ETC Complex II is disrupted by oxidative stress, resulting in the release of cytochrome c from the IMM. 26 SS‐31 stabilizes the interaction between CL and ETC Complex II, thereby preventing cytochrome c release after exposure to oxidative stress. SS‐31 improves mitochondrial functioning and ameliorates oxidative damage in several disease models, including FRDA. 27 , 28 , 29 , 30 , 31 Certain biomarkers may be quantified to determine the effectiveness of drugs like SS‐31. Drp1 interacts with CL, and these interactions are essential for mitochondrial fission in vivo. 32 SS‐31 may thus affect Drp1‐CL interaction and mitochondrial fragmentation.
Intraperitoneal injection of SS‐31 in a mouse model of Alzheimer Disease decreases mitochondrial fission, while maintaining mitochondrial function 33 ; similarly, SS‐31 decreases mitochondrial fission and increases mitochondrial fusion in primary neuron cultures derived from an Alzheimer Disease mouse model. 34 This compound decreases the levels of mitochondrial fission proteins, while simultaneously increasing mitochondrial fusion protein levels in a neuronal cell culture model of Huntington Disease. 35 Additionally, SS‐31 ameliorates mitochondrial dysfunction in a type 2 diabetes mouse model. 36 SS‐31 treatment qualitatively improves cristae morphology in FRDA patient‐derived lymphoblasts. 28 These studies demonstrate the effectiveness of SS‐31 in improving mitochondrial morphology and function in a number of disease models. Further investigation of SS‐31’s mechanism of action, quantitative analysis of SS‐31 on mitochondrial morphology in other cell types, and the SS‐31’s impact on ATP levels will provide more insight into this compound's therapeutic potential for FRDA.
Mitochondrial fragmentation, the number of (Ser616) phospho‐Drp1 clusters at the mitochondria, ATP levels, and various protein levels may be used as biomarkers of the disease state. In the present work, these biomarkers are utilized to quantify the effectiveness of SS‐31 in treating FRDA patient fibroblasts and FXN‐knockdown fibroblasts. The effects of SS‐31 are compared to those of TAT‐P110 to determine whether these drugs act independently or on the same pathway.
2. MATERIALS AND METHODS
2.1. Cell culture
Primary skin fibroblasts were provided by Marek Napierala. The cells were derived from five FRDA patients and one healthy control individual following an IRB‐approved protocol. The fibroblasts were cultured in DMEM/F12 medium supplemented with 1% Penicillin/Streptomycin, 1% non‐essential amino acids, and 10% fetal bovine serum. For all experiments, the cells were seeded at a density of 5 × 10⁴ cells/well in a 12‐well plate. The cells were incubated at 37°C with 5% CO2.
2.2. siRNA knockdown
Cells (5 × 10⁴) were seeded in each well of a 12‐well plate with DMEM/F12 medium supplemented with 1X non‐essential amino acids, and 10% fetal bovine serum. The sequence for siRNA targeting FXN is GAACCUAUGUGAUCAACAAGCAGAC (Integrated DNA Technology), and control is Stealth RNAi siRNA Negative Control (Invitrogen, 12935100). Transfection of siRNA was performed 24 h after plating the cells. siRNA (2.5 μl, 20 μM) and Lipofectamine RNAi Max (5 μl) were mixed with 275 µl of Opti‐MEM and incubated at room temperature for 10 min. 85 µl of the mixture was added to each well, and cells were incubated at 37°C with 5% CO2 for 72 h before collecting lysates for Western blots, mounting to coverslips for ICC, or performing the ATP assay.
2.3. FXN transfection
A plasmid encoding untagged human FXN was obtained from OriGene (catalog #120073). XL10‐Gold Ultracompetent Cells (Agilent, catalog #200314) were transformed with the plasmid following the included protocol. The plasmid was isolated from these bacteria using the QIAprep Spin Miniprep kit (QIAGEN, catalog #27104) following the included protocol. Plasmids were stored at −20°C until use. The FXN‐encoding plasmid was transfected in FRDA patient fibroblasts using Lipofectamine 2000 (Thermo Fisher Scientific, catalog #11668019) following the included protocol. As a negative control, FRDA patient cells were transfected with an empty vector (pcDNA 3.1, Invitrogen V79020). Seventy‐two hours after transfection, lysates were collected for Western blots, cells were mounted to coverslips for ICC, or the ATP assay was performed.
2.4. SS‐31 in cell culture
SS‐31 was received from Stealth BioTherapeutics. The drug was immediately reconstituted in sterile water to a concentration of 1 mM, and aliquots were stored at −20°C until use. Cell cultures were treated with 1 µM SS‐31 or water as the vehicle control for 72 h.
2.5. Drp1 inhibitor TAT‐P110
The Drp1 inhibitor peptide P110 and a scrambled version of this peptide were obtained from GenScript. P110 sequence: YGRKKRRQRRRGGDLLPRGT with C‐terminal amidation. Scrambled‐P110 sequence: YGRKKRRQRRRGGTLGRLPD with C‐terminal amidation. Both peptides contain a TAT‐targeting sequence on the N‐terminal (amino acid residues 1–13). Cells were treated with 1 µM TAT‐P110 or the scrambled peptide for 72 h. For experiments involving the combination of SS‐31 and TAT‐P110, cells were simultaneously treated with 1 µM SS‐31 and 1 µM TAT‐P110 for 72 h.
2.6. Cell lysate preparation
One hundred and fifty microliters of RIPA buffer (150 mM Sodium chloride, 1 mM EDTA, 100 mM Tris–HCl pH 7.4, 1% Triton‐X 100, 0.5% Sodium deoxycholate, and on the day of use 1:500 EDTA‐free protease inhibitor cocktail III) were added to each well of the 12‐well plate. The wells were scraped vigorously and the cell lysates were collected in microcentrifuge tubes. Lysates were stored at −20° for less than 1 week before being used for Western blot analysis.
2.7. Antibodies
α‐actin (Abcam, Cell Signaling Technology, 3700S, 1:1000 for WB), α‐Drp1 (Abcam, ab184247, 1:250 for ICC, 1:1000 for WB), α‐phospho Drp1(S616) (Cell Signaling Technology, 3455S, 1:250 for ICC, 1:1000 for WB), α‐FXN (Abcam, ab110328, 1:1000 for WB), α‐GRP75 (Abcam, ab2799, 1:250 for ICC).
2.8. Western blot
Twenty micrograms of cell lysate were loaded into each well of a 10‐well polyacrylamide gel (NuPAGE, 4–12% gradient). The gel was run at 120 V for 1 h 30 min using NuPAGE MES SDS Running Buffer. The proteins were transferred to a 0.45 µm membrane using a wet transfer apparatus (Bio‐Rad) running at 95 V for 1 h 15 min. The membrane was blocked in 3% milk (diluted in TBS‐T) for 1 h at room temperature. The membrane was incubated with the listed dilution of primary antibody overnight at 4°C, washed three times with TBS‐T, and incubated with the listed dilution of the secondary antibody for 1 h at room temperature. The membrane was washed their times with TBS‐T then incubated with 2 ml of ECL for 5 min before developing using autoradiography film. Protein levels detected via Western blot were quantified using ImageJ software (NIH).
2.9. ATP level assay
The CellTiter‐Glo Luminescent Cell Viability Assay (Promega, G7570) was utilized to assess the number of viable, metabolically active cells. 5 × 10⁴ fibroblasts were seeded in each well of a 12 well plate. Following the experimental conditions, the cells were trypsinized (500 µl of 0.05% trypsin at 37°C for 5 min.), centrifuged (1000 rcf for 10 min.), and resuspended in 1 ml of cell culture media. 5x10³ cells were added to each well of a 96 well plate. The directions included with the assay kit were followed as written. Luminescence was measured using a Synergy 2 Multi‐Mode microplate reader using the CellTiter‐Glo protocol (measure luminescence with 0.5 s. integration time). The amount of luminescence produced from this assay is directly proportional to the amount of ATP in the sample, thus serving as a proxy for the number of viable, metabolically active cells that are present in the sample.
2.10. Immunocytochemistry and fluorescence imaging
Primary fibroblasts were fixed for 10 min at 4°C with 4% paraformaldehyde in phosphate‐buffered saline (PBS) (pH 7.4), and then subjected to immunostaining. For immunostaining, the coverslips were blocked with 5% normal goat serum, 1% bovine serum albumin, and 0.3% (vol/vol) Triton X‐100 in PBS at room temperature for 1 h. The coverslips were incubated with primary antibodies at 4°C overnight and then secondary antibodies conjugated to Alexa Fluor 488 or 568 (Invitrogen) at room temperature for 60–90 min. Following three, 5 min washes with PBS, cells were mounted to slides using VECTASHIELD with DAPI (Vector Laboratories). Fluorescence images were obtained with Leica laser scanning confocal microscope. The slides were sequentially imaged for (Ser616) phospho‐Drp1 and GRP75 staining.
2.11. Quantification of mitochondrial fragmentation
We also developed and utilized a novel, rigorous, and reproducible method to quantify mitochondrial fragmentation. A confocal immunofluorescence image of a cell's mitochondrial network was imported to NIH ImageJ software and is converted to black and white. A threshold was set to eliminate any background; this setting was kept constant for all images analyzed via this method. A single cell is demarcated, and the software quantified the number of mitochondrial fragments (processed as a group of black pixels surrounded by white pixels). At least 20 cells per group from each of three replicates were quantified in this way.
2.12. (Ser616) phospho‐Drp1 cluster quantification
The number of (Ser616) phospho‐Drp1 clusters was quantified using NIH ImageJ software in a similar way to the method for quantifying mitochondrial fragmentation. A confocal immunofluorescence image of cells’ (Ser616) phospho‐Drp1 clusters was imported to ImageJ. The image was converted to black and white, and a threshold was set to eliminate background (which is kept constant for all images). A single cell was demarcated and ImageJ quantified the number of (Ser616) phospho‐Drp1 clusters in the cell (each grouping of black pixels surrounded by white pixels was counted as a single protein cluster). At least 20 cells of each group from three replicates were quantified.
2.13. Statistical analysis
All experimental data were collected and analyzed according to a preset plan. Graphs display the mean ± SEM. Mitochondrial fragmentation and (Ser616) phospho‐Drp1 clustering were analyzed using two‐tailed, independent samples t test. Western blot quantifications and ATP assay results were analyzed in R using Wilcoxon rank‐sum test. Significance was set at p < .05, and a non‐significant trend was set at p < .2. Three replicates were performed for all siRNA knockdown experiments. For protein level analysis in FRDA patient‐derived cells, five replicates were performed across three individual cell lines. For the analysis of the number of mitochondrial fragments and (Ser616) phospho‐Drp1 clusters per cell in FRDA patient‐derived cells, three replicates were performed across three individual cell lines. For ATP level experiments in FRDA patient‐derived cells, a total of 10 replicates were performed across five individual cell lines.
3. RESULTS
First, we examined the effects of sub‐acute FXN deficiency on markers of cell viability and metabolism. Healthy fibroblasts transfected with FXN‐targeted siRNA exhibited significantly more mitochondrial fragments than those transfected with non‐targeting siRNA (2135 vs. 1225 fragments per cell, p < .01, Figure 1A–C). Western blot analysis confirmed FXN knockdown (0.36 times the level of FXN in control, n = 3, p < .01, Figure 1D and E). Moreover, FXN knockdown significantly increased the number of (Ser616) phospho‐Drp1 clusters (1790 vs. 758 clusters per cell, p < .05, Figure 1F–H); however, the overall levels of levels Drp1 and (Ser616) phospho‐Drp1 were not affected (n = 3, Figure 1I and J). Additionally, FXN knockdown did not significantly impact ATP levels (n = 3, Figure 1K).
FIGURE 1.
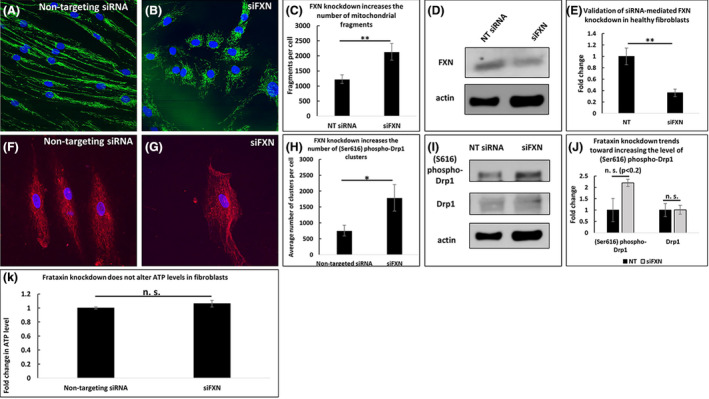
Frataxin knockdown increases mitochondrial fragmentation but does not affect ATP levels in frataxin‐knockdown fibroblasts. FXN knockdown increases the number of mitochondrial fragments (A–C), and FXN knockdown is validated (D–E). FXN knockdown decreases (Ser616) phospho‐Drp1 clustering (F–H) but does not significantly affect the levels of (Ser616) phospho‐Drp1 or Drp1 (I–J). ATP levels are unaffected (K). *p < .05, **p < .01, n.s. not significant
To compare the effects of sub‐acute and chronic FXN deficiency, we next investigated FRDA patient‐derived fibroblasts. These cells exhibited significantly more mitochondrial fragments than healthy fibroblasts (580 vs. 182 fragments per cell, p < .05, Figure 2A–C) and significantly lower levels of FXN (0.17 times the level of FXN in control cells, n = 5, p < .05, Figure 2D and E). Furthermore, FRDA patient fibroblasts exhibited increased (Ser616) phospho‐Drp1 clusters (1448 vs. 828 clusters per cell, p < .05, Figure 2F–H), but the levels of (Ser616) phospho‐Drp1 and Drp1 were unaffected (n = 5, Figure 2I and J). In contrast to cells with acute FXN knockdown, FRDA patient fibroblasts exhibited significantly lower levels of ATP than healthy fibroblasts (0.9 times the amount of ATP in healthy control fibroblasts, n = 10, p < .05) (Figure 2K).
FIGURE 2.
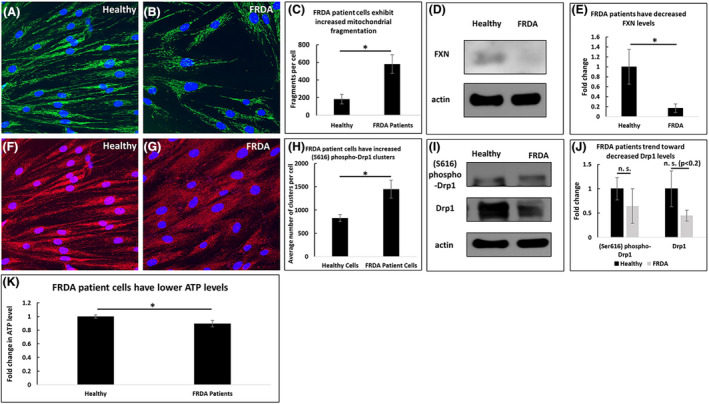
FRDA patient fibroblasts exhibit increased mitochondrial fragmentation and decreased ATP levels compared to healthy fibroblasts. FRDA patient cells have an increased number of mitochondrial fragments (A–C) and lower levels of FXN (D–E). They have an increased number of (Ser616) phospho‐Drp1 clusters (F–H) but no significant change to (Ser616) phospho‐Drp1 or Drp1 levels (I–J). 0 ATP levels are decreased (K). *p < .05, n.s. not significant
We then studied whether the effects of chronic FXN deficiency are reversible by overexpressing exogenous FXN in FRDA patient fibroblasts. Transfecting FRDA patient fibroblasts with FXN decreased the number of mitochondrial fragments compared to patient fibroblasts transfected with vector alone (594 vs. 335 fragments per cell, p < .01, Figure 3A–C). Western blot analysis confirmed FXN overexpression (2.6 times the level of FXN in vector controls, p < .05, n = 5, Figure 3D and E). Moreover, FXN overexpression decreased the number of (Ser616) phospho‐Drp1 clusters (2261 vs. 856 clusters per cell, p < .001, Figure 3F–H), but it did not significantly affect the overall level of Drp1 or (Ser616) phospho‐Drp1 (n = 5, Figure 3I and J). Additionally, FXN overexpression did not impact ATP levels (n = 10, Figure 3K).
FIGURE 3.
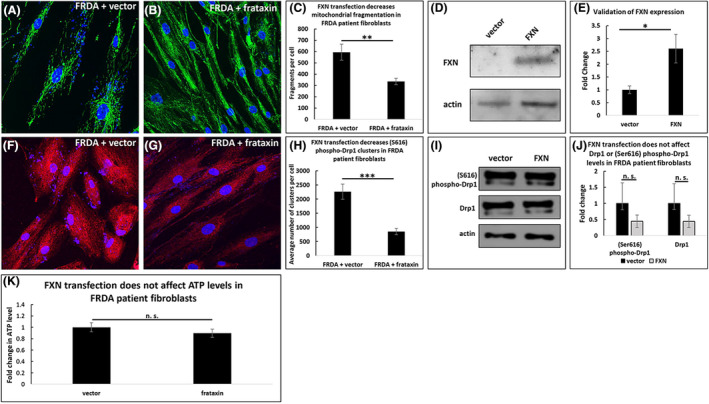
Transfecting FRDA patient fibroblasts with frataxin decreases mitochondrial fragmentation but does not affect ATP levels. FRDA patient cells transfected with exogenous FXN have fewer mitochondrial fragments (A–C) and increased levels of FXN (D–E) at 72 h post‐transfection. FXN expression decreases the number of (Ser616) phospho‐Drp1 clusters (F–H) but does not impact (Ser616) phospho‐Drp1 or Drp1 levels (I–J). ATP levels are unaffected by FXN transfection (K). *p < .05, **p < .01, ***p < .001, n.s. not significant
To determine which effects of sub‐acute FXN deficiency are dependent upon Drp1 activity, we treated FXN knockdown fibroblasts with TAT‐P110, a Drp1 inhibitor. This drug decreased the number of mitochondrial fragments in fibroblasts with siRNA‐knockdown of FXN (284 vs. 164 fragments per cell, p < .05, Figure 4A–C), but this drug did not significantly alter the level of FXN (n = 3, Figure 4D and E). While TAT‐P110 decreased the number of (Ser616) phospho‐Drp1 clusters (1208 vs. 872 clusters per cell, p < .01, Figure 4F–H), this drug did not significantly affect the total levels of Drp1 or (Ser616) phospho‐Drp1 levels (n = 3, Figure 4I and J). TAT‐P110 decreased the level of ATP in FXN‐knockdown cells (0.64 times the amount of ATP in cells treated with a non‐targeting siRNA, n = 3, p < .01, Figure 4K).
FIGURE 4.
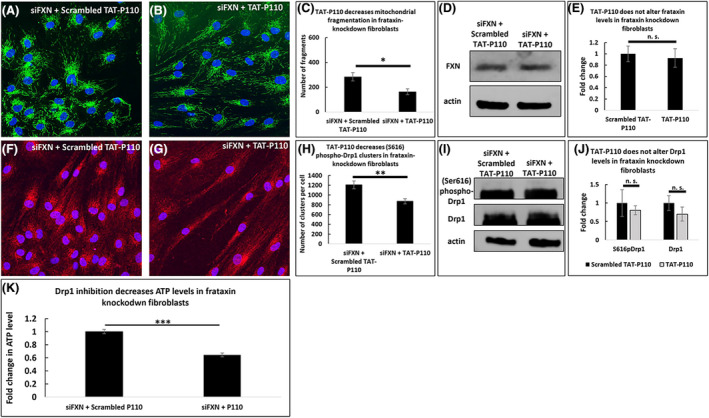
Drp1‐inhibition decreases both mitochondrial fragmentation and ATP levels in frataxin knockdown fibroblasts. At 72 h, 1 µM TAT‐P110 decreases the number of mitochondrial fragments in FXN‐knockdown fibroblasts (A–C) but does not impact the level of FXN (D–E). This drug decreases the number of (Ser616) phospho‐Drp1 clusters (F–H) but not the levels of (Ser616) phospho‐Drp1 or Drp1 (I–J). TAT‐P110 decreases ATP levels (K). *p < .05, **p < .01, ***p < .001, n.s. not significant
We then compared the effects of TAT‐P110 on sub‐acutely FXN deficient cells to FRDA patient cells that are chronically deficient in FXN. Treatment with TAT‐P110 trended toward decreasing the number of mitochondrial fragments in FRDA patient‐derived fibroblasts (700 vs. 511 fragments per cell, p < .2, Figure 5A–C), and did not affect the level of FXN (n = 5, Figure 5D and E). Additionally, TAT‐P110 decreased the number of (Ser616) phospho‐Drp1 clusters (3476 vs. 2095 clusters per cell, p < .05, Figure 5F–H), but it did not alter the overall levels of Drp1 or (Ser616) phospho‐Drp1 (n = 5, Figure 5I and J). Additionally, TAT‐P110 trended toward decreasing ATP levels in FRDA patient‐derived fibroblasts (0.57 times the amount of ATP in cells treated with an inactive form of this drug, p ~.1, n = 10, Figure 5K).
FIGURE 5.
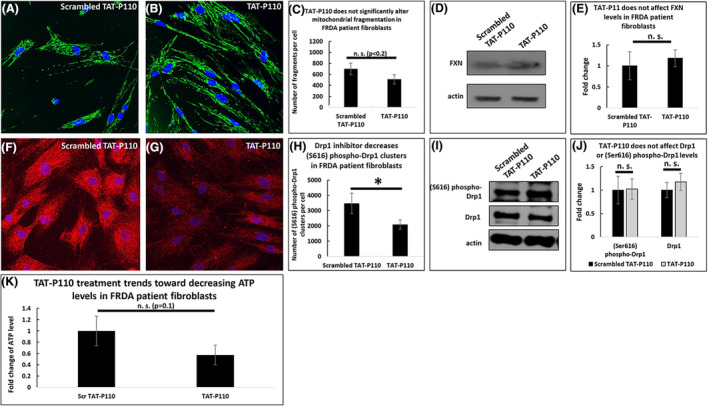
Drp1‐inhibition in FRDA patient fibroblasts trends toward decreasing both mitochondrial fragmentation and ATP levels. At 72 h, 1 µM TAT‐P110 trends toward decreasing the number of mitochondrial fragments in FRDA patient fibroblasts (A–C) but does not impact the level of FXN (D–E). This drug decreases the number of (Ser616) phospho‐Drp1 clusters (F–H) but does not impact the levels of (Ser616) phospho‐Drp1 or Drp1 (I–J). TAT‐P110 trends toward decreasing ATP levels (K). *p < .05, n.s. not significant
FRDA patient‐derived fibroblasts treated with SS‐31 exhibit significantly less mitochondrial fragmentation compared to the vehicle control (419 vs. 150 fragments per cell, p < .001, Figure 6A–C), and SS‐31 treatment decreased FXN levels to 42% of control levels (n = 10, Figure 6D–E). Additionally, SS‐31 decreased the number of (Ser616) phospho‐Drp1 clusters in FRDA patient‐derived fibroblasts (892 vs. 479 clusters per cell, p < .05, Figure 6F–H), but it did not affect the overall levels of Drp1 or (Ser616) phospho‐Drp1 (n = 10, Figure 6I and J). Moreover, SS‐31 did not alter the level of ATP in FRDA patient fibroblasts after 72 h of treatment (n = 10, Figure 6K).
FIGURE 6.
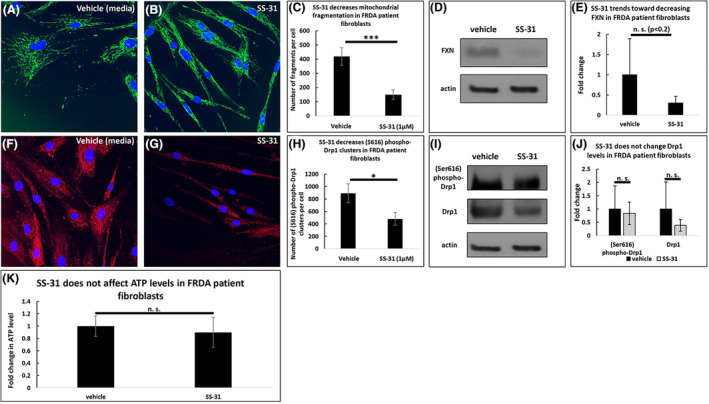
SS‐31 in FRDA patient fibroblasts decreases mitochondrial fragmentation but does not affect ATP levels. At 72 h, 1 µM SS‐31 decreases the number of mitochondrial fragments in FRDA patient fibroblasts (A–C) and trends toward decreasing the level of FXN (D–E). This drug decreases the number of (Ser616) phospho‐Drp1 clusters (F–H) but does not affect the levels of (Ser616) phospho‐Drp1 or Drp1 (I–J). SS‐31 does not affect the level of ATP at this concentration and time point (K). *p < .05, ***p < .001, n.s. not significant
Finally, to determine whether TAT‐P110 and SS‐31 affect these changes by acting on the same pathway, we treated FRDA patient‐derived fibroblasts with these drugs simultaneously and compared the results to treating these cells with SS‐31 alone. The combination of SS‐31 and TAT‐P110 in FXN knockdown fibroblasts did not impact mitochondrial fragmentation any more than SS‐31 alone (1410 vs. 1523 fragments per cell, not significant, Figure 7A–C). Similarly, this drug combination did not affect FXN levels differently from SS‐31 alone (n = 5, Figure 7D and E). Furthermore, this drug combination had the same effect on (Ser616) phospho‐Drp1 clustering as SS‐31 alone in FXN knockdown fibroblasts (727 vs. 739 clusters per cell, not significant, Figure 7F–H). Likewise, in FRDA patient fibroblasts, the drug combination did not alter Drp1 or (S616) phospho‐Drp1 levels from those observed with SS‐31 alone (n = 5, Figure 7I and J). The combination of SS‐31 and TAT‐P110 trended toward decreasing the ATP levels of FRDA patient fibroblasts (0.49 times the amount of ATP in cells treated with SS‐31 alone, p < .2, n = 10, Figure 7K).
FIGURE 7.
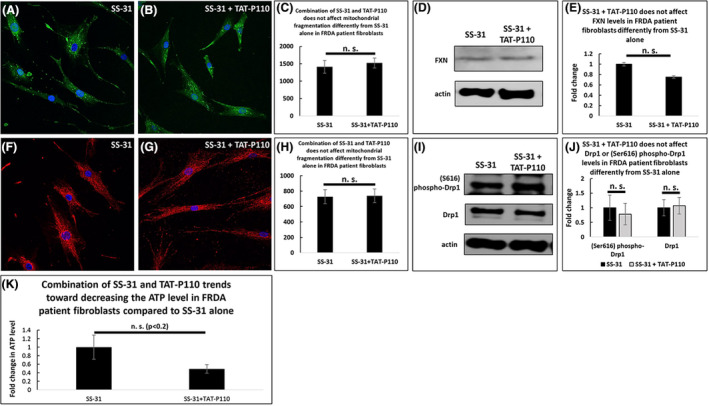
Combination of SS‐31 and P110 in FRDA Patient fibroblasts does not impact mitochondrial fragmentation more than SS‐31 alone. At 72 h, 1 µM SS‐31 and 1 µM TAT‐P110 do not impact the number of mitochondrial fragments (A–C) or the level of FXN (D–E) more than SS‐31 alone. The number of (Ser616) phospho‐Drp1 clusters (F–H) and the levels of (Ser616) phospho‐Drp1 and Drp1 (I–J) were similarly unchanged. The combination trends toward decreasing ATP levels compared to SS‐31 alone (K). *n.s. not significant
4. DISCUSSION
The present study demonstrates that biomarkers of FRDA include decreased levels of FXN, increased clustering of (Ser616) phospho‐Drp1, excessive mitochondrial fragmentation, and decreased ATP levels; additionally, this study demonstrates that the combination of such markers is crucial for evaluating the potential therapeutic benefit of agents, including P110 and SS‐31, in model systems. Both FRDA patient‐derived fibroblasts and healthy fibroblasts with FXN knockdown exhibit increased (Ser616) phospho‐Drp1 clustering and increased mitochondrial fragmentation. These effects depend upon FXN levels since transfecting patient cells with a plasmid encoding FXN reverses mitochondrial fragmentation and (Ser616) phospho‐Drp1 clustering. However, while FRDA patient fibroblasts have decreased ATP levels, FXN knockdown does not impact ATP levels in healthy fibroblasts. This discrepancy likely reflects the inherent differences between chronic and sub‐acute models of disease; potentially, cells may compensate for FXN deficiency acutely, but become less able to accommodate for chronic FXN deficiency. A limitation of the present study includes the inherent difference between in vitro fibroblasts models and other tissue types or whole organisms. While the results of this study provide insight into the molecular mechanisms at play and parse out differences between sub‐acute and chronic FXN deficiency, it is possible that the results do not directly translate to other tissue types, in vivo models, or to humans.
FXN overexpression does not impact the ATP levels in FRDA patient fibroblasts, suggesting that the cells make long‐term modifications to accommodate their FXN deficiency. It is possible that a longer time course of FXN overexpression might affect ATP levels; alternatively, the pathway modifications the cells make may not be easily reversed simply by overexpressing FXN. Therefore, an optimal therapeutic approach would likely target other metabolic pathways instead of simply restoring FXN levels (e.g., through FXN gene therapy).
In numerous neurodegenerative disease models, mitochondrial fragmentation is dependent upon Drp1 activity. 13 , 20 , 21 , 22 Mitochondrial fragmentation in FRDA similarly appears to be dependent upon Drp1; TAT‐P110, a small peptide that inhibits Drp1 binding to and severing of the mitochondria, decreases (Ser616) phospho‐Drp1 clustering and mitochondrial fragmentation in both FRDA patient‐derived and FXN knockdown fibroblasts. Mitochondrial fragmentation is thus dependent upon Drp1 activity in both of these models. While FXN knockdown alone does not affect ATP levels in healthy fibroblasts, treating these FXN knockdown fibroblasts with TAT‐P110 decreases the ATP levels. This suggests that mitochondrial fragmentation may initially be a homeostatic mechanism necessary to maintain ATP levels, and therefore, solely targeting mitochondrial fragmentation may not be a viable therapeutic strategy in FRDA. Reversing mitochondrial fragmentation in other neurodegenerative diseases, including Parkinson's disease, may improve bioenergetics 20 ; however, mitochondrial dysfunction is most likely a secondary effect in such diseases rather than a primary defect leading to disease. This suggests that mitochondrial fragmentation is a deleterious, rather than a homeostatic mechanism, in those diseases.
While SS‐31 and TAT‐P110 individually decrease mitochondrial fragmentation and (Ser616) phospho‐Drp1 clustering, there are no additional effects when cells are treated with both drugs simultaneously. This suggests that the effects of SS‐31 on the mitochondria are dependent upon Drp1 activity. The combination trends toward decreasing ATP level in FRDA patient fibroblasts compared to SS‐31 alone; as SS‐31 does not impact ATP levels and TAT‐P110 trends toward decreasing ATP, it is unsurprising to see this same trend when treating cells with both drugs. TAT‐P110 exerts its effect directly on Drp1, thereby reversing fragmentation and consequently reversing ATP levels. In contrast, SS‐31 exerts its effect on cardiolipin; SS‐31 similarly reverses fragmentation, but it does not alter ATP levels. Since SS‐31 improves ETC functioning and bioenergetics, 24 , 37 , 38 it is possible that the improved ETC functioning counteracts the ATP deficit resulting from reversed fragmentation. Because cardiolipin facilitates Drp1 oligomerization at sites of mitochondrial fission, depending upon other proteins present on the OMM, 39 it is possible that SS‐31 interferes with Drp1 binding to the mitochondria. Thus, while SS‐31 and TAT‐P110 exert their effects on different targets, they may functionally overlap at Drp1 binding to the mitochondria.
While numerous conditions result in decreased (Ser616) phospho‐Drp1 clustering, no conditions alter the overall levels of Drp1 or (Ser616) phospho‐Drp1 in this study. As neither SS‐31 nor TAT‐P110 directly affects the transcription, translation, or degradation of these proteins, this result is unsurprising. It is possible that the turnover for these proteins is slower than the 72 h during which these experiments were conducted, so perhaps changes to these protein levels could be observed during a longer time course.
Seventy‐two hours of SS‐31 treatment decreases FXN levels in FRDA patient fibroblasts, although another group reports that 24 h of treatment with SS‐31 increases FXN and ATP levels in lymphoblasts derived from one FRDA patient. 28 It is conceivable that SS‐31 causes a transient upregulation of FXN that decreases over the 72‐h time course. It is also possible that SS‐31 exerts concentration‐ and tissue‐specific effects; additionally, individual patient data (i.e., age, sex, and GAA repeat length) may alter the patient cells’ reactions to SS‐31 treatment.
As FXN overexpression does not impact ATP levels, a high level of FXN does not appear to be necessary for bioenergetic maintenance in FRDA patient fibroblasts. Perhaps improving ETC function through other pathways, like stabilizing CL via SS‐31, will be more beneficial to improve bioenergetics in FRDA patients than simply increasing the level of FXN. Furthermore, mitochondrial fragmentation appears to be a homeostatic mechanism in FRDA, so this may not be a suitable target for potential FRDA therapeutics.
DISCLOSURE
The authors declare no conflict of interest.
AUTHOR CONTRIBUTIONS
Participated in research design: Johnson, Lin, Lynch. Conducted experiments: Johnson, Clark, Lin. Contributed new analytic tools: Johnson. Performed data analysis: Johnson, Mercado‐Ayón. Wrote or contributed to the writing of the manuscript: Johnson, Lynch, Lin.
ACKNOWLEDGEMENTS
Amy Salovin performed a preliminary experiment. Marek Napierala provided FRDA patient fibroblasts. Robert B. Wilson provided valuable insights in reviewing this work. The studies were supported by MDA Research Grant (MDA515617) to Dr. David Lynch and Dr. Hong Lin, FARA Research Grant to Dr. Hong Lin, FARA Center of Excellence Grant to Dr. David Lynch.
David Lynch and Hong Lin are contributed equally to this work.
Contributor Information
David Lynch, Email: lynchd@pennmedicine.upenn.edu.
Hong Lin, Email: hong.lin@pennmedicine.upenn.edu.
DATA AVAILABILITY STATEMENT
The data that support the findings of this study are available from the corresponding author upon reasonable request.
REFERENCES
- 1. Bürk K. Friedreich Ataxia: current status and future prospects. Cerebellum Ataxias. 2017;4:4. [DOI] [PMC free article] [PubMed] [Google Scholar]
- 2. Delatycki MB, Corben LA. Clinical features of Friedreich ataxia. J Child Neurol. 2012;27(9):1133‐1137. [DOI] [PMC free article] [PubMed] [Google Scholar]
- 3. Pastore A, Puccio H. Frataxin: a protein in search for a function. J Neurochem. 2013;126(s1):43‐52. [DOI] [PubMed] [Google Scholar]
- 4. Stemmler TL, Lesuisse E, Pain D, et al. Frataxin and mitochondrial FeS cluster biogenesis. J Biol Chem. 2010;285(35):26737‐26743. [DOI] [PMC free article] [PubMed] [Google Scholar]
- 5. Rötig A, de Lonlay P, Chretien D, et al. Aconitase and mitochondrial iron–sulphur protein deficiency in Friedreich ataxia. Nat Genet. 1997;17(2):215–217. [DOI] [PubMed] [Google Scholar]
- 6. Rouault TA. Biogenesis of iron‐sulfur clusters in mammalian cells: new insights and relevance to human disease. Dis Models Mech. 2012;5(2):155‐164. [DOI] [PMC free article] [PubMed] [Google Scholar]
- 7. Meyer JN, Leuthner TC, Luz AL. Mitochondrial fusion, fission, and mitochondrial toxicity. Toxicology. 2017;391:42‐53. [DOI] [PMC free article] [PubMed] [Google Scholar]
- 8. Wai T, Langer T. Mitochondrial dynamics and metabolic regulation. Trends Endocrinol Metab. 2016;27(2):105‐117. [DOI] [PubMed] [Google Scholar]
- 9. Karbowski M, Youle RJ. Dynamics of mitochondrial morphology in healthy cells and during apoptosis. Cell Death Differ. 2003;10(8):870‐880. [DOI] [PubMed] [Google Scholar]
- 10. Burman JL, Pickles S, Wang C, et al. Mitochondrial fission facilitates the selective mitophagy of protein aggregates. J Cell Biol. 2017;216(10):3231‐3247. [DOI] [PMC free article] [PubMed] [Google Scholar]
- 11. Yoo SM, Jung YK. A molecular approach to mitophagy and mitochondrial dynamics. Mol Cells. 2018;41(1):18‐26. [DOI] [PMC free article] [PubMed] [Google Scholar]
- 12. Itoh K, Nakamura K, Iijima M, et al. Mitochondrial dynamics in neurodegeneration. Trends Cell Biol. 2013;23(2):64‐71. [DOI] [PMC free article] [PubMed] [Google Scholar]
- 13. Oliver D, Reddy PH. Dynamics of dynamin‐related protein 1 in Alzheimer's disease and other neurodegenerative diseases. Cells. 2019;8(9):961. [DOI] [PMC free article] [PubMed] [Google Scholar]
- 14. Sheridan C, Martin SJ. Mitochondrial fission/fusion dynamics and apoptosis. Mitochondrion. 2010;10(6):640‐648. [DOI] [PubMed] [Google Scholar]
- 15. Taguchi N, Ishihara N, Jofuku A, et al. Mitotic phosphorylation of dynamin‐related GTPase Drp1 participates in mitochondrial fission. J Biol Chem. 2007;282(15):11521‐11529. [DOI] [PubMed] [Google Scholar]
- 16. Tilokani L, Nagashima S, Paupe V, et al. Mitochondrial dynamics: overview of molecular mechanisms. Essays Biochem. 2018;62(3):341‐360. [DOI] [PMC free article] [PubMed] [Google Scholar]
- 17. Atkins K, Dasgupta A, Chen K‐H, et al. The role of Drp1 adaptor proteins MiD49 and MiD51 in mitochondrial fission: implications for human disease. Clin Sci. 2016;130(21):1861‐1874. [DOI] [PubMed] [Google Scholar]
- 18. Hu C, Huang Y, Li L. Drp1‐dependent mitochondrial fission plays critical roles in physiological and pathological progresses in mammals. Int J Mol Sci. 2017;18(1):144. [DOI] [PMC free article] [PubMed] [Google Scholar]
- 19. Qi X, Qvit N, Su Y‐C, et al. A novel Drp1 inhibitor diminishes aberrant mitochondrial fission and neurotoxicity. J Cell Sci. 2013;126(Pt 3):789‐802. [DOI] [PMC free article] [PubMed] [Google Scholar]
- 20. Filichia E, Hoffer B, Qi X, Luo Y. Inhibition of Drp1 mitochondrial translocation provides neural protection in dopaminergic system in a Parkinson's disease model induced by MPTP. Sci Rep. 2016;6:32656. [DOI] [PMC free article] [PubMed] [Google Scholar]
- 21. Luo F, Herrup K, Qi X, et al. Inhibition of Drp1 hyper‐activation is protective in animal models of experimental multiple sclerosis. Exp Neurol. 2017;292:21‐34. [DOI] [PMC free article] [PubMed] [Google Scholar]
- 22. Guo X, Disatnik M‐H, Monbureau M, et al. Inhibition of mitochondrial fragmentation diminishes Huntington's disease‐associated neurodegeneration. J Clin Invest. 2013;123(12):5371‐5388. [DOI] [PMC free article] [PubMed] [Google Scholar]
- 23. Szeto HH. First‐in‐class cardiolipin‐protective compound as a therapeutic agent to restore mitochondrial bioenergetics. Br J Pharmacol. 2014;171(8):2029‐2050. [DOI] [PMC free article] [PubMed] [Google Scholar]
- 24. Birk AV, Chao WM, Bracken C, Warren JD, Szeto HH. Targeting mitochondrial cardiolipin and the cytochrome c/cardiolipin complex to promote electron transport and optimize mitochondrial ATP synthesis. Br J Pharmacol. 2014;171(8):2017‐2028. [DOI] [PMC free article] [PubMed] [Google Scholar]
- 25. Horvath SE, Daum G. Lipids of mitochondria. Prog Lipid Res. 2013;52(4):590‐614. [DOI] [PubMed] [Google Scholar]
- 26. Ott M, Zhivotovsky B, Orrenius S. Role of cardiolipin in cytochrome c release from mitochondria. Cell Death Differ. 2007;14(7):1243‐1247. [DOI] [PubMed] [Google Scholar]
- 27. Machiraju P, Wang X, Sabouny R, et al. SS‐31 peptide reverses the mitochondrial fragmentation present in fibroblasts from patients with DCMA, a mitochondrial cardiomyopathy. Front Cardiovasc Med. 2019;6:167. [DOI] [PMC free article] [PubMed] [Google Scholar]
- 28. Zhao H, Li H, Hao S, et al. Peptide SS‐31 upregulates frataxin expression and improves the quality of mitochondria: implications in the treatment of Friedreich ataxia. Sci Rep. 2017;7(1):9840. [DOI] [PMC free article] [PubMed] [Google Scholar]
- 29. Zhao W, Xu Z, Cao J, et al. Elamipretide (SS‐31) improves mitochondrial dysfunction, synaptic and memory impairment induced by lipopolysaccharide in mice. J Neuroinflammation. 2019;16(1):230. [DOI] [PMC free article] [PubMed] [Google Scholar]
- 30. Allen ME, Pennington ER, Perry JB, et al. The cardiolipin‐binding peptide elamipretide mitigates fragmentation of cristae networks following cardiac ischemia reperfusion in rats. Commun Biol. 2020;3(1):389. [DOI] [PMC free article] [PubMed] [Google Scholar]
- 31. Rohani L, Machiraju P, Sabouny R, et al. Reversible mitochondrial fragmentation in iPSC‐derived cardiomyocytes from children with DCMA, a mitochondrial cardiomyopathy. Can J Cardiol. 2020;36(4):554‐563. [DOI] [PubMed] [Google Scholar]
- 32. Stepanyants N, Macdonald PJ, Francy CA, et al. Cardiolipin's propensity for phase transition and its reorganization by dynamin‐related protein 1 form a basis for mitochondrial membrane fission. Mol Biol Cell. 2015;26(17):3104‐3116. [DOI] [PMC free article] [PubMed] [Google Scholar]
- 33. Reddy PH, Manczak M, Kandimalla R. Mitochondria‐targeted small molecule SS31: a potential candidate for the treatment of Alzheimer's disease. Hum Mol Genet. 2017;26(8):1597. [DOI] [PMC free article] [PubMed] [Google Scholar]
- 34. Calkins MJ, Manczak M, Mao P, et al. Impaired mitochondrial biogenesis, defective axonal transport of mitochondria, abnormal mitochondrial dynamics and synaptic degeneration in a mouse model of Alzheimer's disease. Hum Mol Genet. 2011;20(23):4515‐4529. [DOI] [PMC free article] [PubMed] [Google Scholar]
- 35. Yin X, Manczak M, Reddy PH. Mitochondria‐targeted molecules MitoQ and SS31 reduce mutant huntingtin‐induced mitochondrial toxicity and synaptic damage in Huntington's disease. Hum Mol Genet. 2016;25(9):1739‐1753. [DOI] [PMC free article] [PubMed] [Google Scholar]
- 36. Bhatti JS, Thamarai K, Kandimalla R, et al. Mitochondria‐targeted small peptide, SS31 ameliorates diabetes induced mitochondrial dynamics in male TallyHO/JngJ mice. Mol Neurobiol. 2021;58(2):795‐808. [DOI] [PMC free article] [PubMed] [Google Scholar]
- 37. Chatfield KC, Sparagna GC, Chau S, et al. Elamipretide improves mitochondrial function in the failing human heart. JACC Basic Transl Sci. 2019;4(2):147‐157. [DOI] [PMC free article] [PubMed] [Google Scholar]
- 38. Birk AV, Liu S, Soong YI, et al. The mitochondrial‐targeted compound SS‐31 re‐energizes ischemic mitochondria by interacting with cardiolipin. J Am Soc Nephrol. 2013;24(8):1250‐1261. [DOI] [PMC free article] [PubMed] [Google Scholar]
- 39. Francy CA, Clinton RW, Fröhlich C, et al. Cryo‐EM studies of Drp1 reveal cardiolipin interactions that activate the helical oligomer. Sci Rep. 2017;7(1):10744. [DOI] [PMC free article] [PubMed] [Google Scholar]
Associated Data
This section collects any data citations, data availability statements, or supplementary materials included in this article.
Data Availability Statement
The data that support the findings of this study are available from the corresponding author upon reasonable request.


