

Abstract
To further explore genetic links between complex traits, we developed a comprehensive framework to harmonize and integrate extensive genotype and phenotype data from the four well-characterized cohorts with the focus on cardiometabolic diseases deposited to the database of Genotypes and Phenotypes (dbGaP). We generated a series of polygenic risk scores (PRS) to investigate pleiotropic effects of loci that confer genetic risk for 19 common diseases and traits on body height, type 2 diabetes (T2D), and myocardial infarction (MI). In a meta-analysis of 20,021 subjects, we identified shared genetic determinants of Crohn’s Disease (CD), a type of inflammatory bowel disease, and body height (p=5.5×10⁻⁵). The association of PRS-CD with height was replicated in UK Biobank (p=1.1×10⁻⁵) and an independent cohort of 510 CD cases and controls (1.57 cm shorter height per PRS-CD interquartile increase, p=5.0×10⁻³ and a 28% reduction in CD risk per interquartile increase in PRS-height, p=1.1×10⁻³, with the effect independent of CD diagnosis). A pathway analysis of the variants overlapping between PRS-height and PRS-CD detected significant enrichment of genes from the inflammatory, immune-mediated and growth factor regulation pathways. This finding supports the clinical observation of growth failure in patients with childhood-onset CD and demonstrates the value of using individual level data from dbGaP in searching for shared genetic determinants. This information can help provide a refined insight into disease pathogenesis and may have major implications for novel therapies and drug repurposing.
Introduction
Over the last decade, genome-wide association studies (GWAS) have identified thousands of genomic variants associated with numerous complex traits in pursuit of understanding the genetic predisposition to common diseases (1). A number of the detected loci were implicated in multiple phenotypes suggesting genetic pleiotropy, whereby one gene may affect multiple phenotypes, igniting a search for pathophysiologically related diseases (2). Notably, pleiotropic variants were more likely to be structurally functional than non-pleiotropic ones (15% versus 5%, respectively) (2), suggesting that identification of shared genetic risks may provide a better understanding of biological mechanisms underlying various conditions. Previous studies have reported genetic pleiotropy for phenotypes with prior evidence for a shared pathogenesis, such as autoimmune diseases (3), psychiatric disorders (4), cardiovascular disease risk factors (5, 6), and bone-related traits (7), among others, as well as for seemingly unrelated conditions, such as cancers and metabolic and inflammatory traits (8, 9), neurodegenerative, psychiatric, and intestinal immune-mediated diseases (10, 11), hematologic and blood pressure traits (12), and others. A comprehensive evaluation of genetic variants associated with 42 traits and diseases identified 341 loci associated with multiple phenotypes (13). Several of these were previously unsuspected associations, such as those between the well-established Alzheimer’s disease APOE gene region and nearsightedness, waist-hip ratio, and several lipid traits. Our earlier work described a genetic link between Parkinson’s disease and Crohn’s disease (CD) through LRRK2 gene variants (11), further supporting the gut-brain axis hypothesis of neurodegenerative diseases and inspiring drug repurposing (14).
Pleiotropic variants associated with common diseases and traits have in many cases been identified using summary-level GWAS data (15, 16). While convenient and largely accessible, this approach does not allow for the calculation of individual polygenic risk scores (PRS), which quantify the genetic risk burden of the disease across multiple susceptibility loci in each individual. In addition, GWAS summary-level data do not permit adjustment for covariates that are not included in the original GWAS, and have limited ability to distinguish between the independent effects of the gene/variant on various traits versus mediation, where a variant affects one trait, which then affects the second trait (17).
While identifying genetic correlations between complex traits and diseases can provide useful etiological insights and new opportunities to improve genetic risk prediction in the future (18, 19), only a handful of studies have conducted systematic analyses of PRS, largely using proprietary cohorts (20–22). Therefore, the goal of this study was two-fold: to 1) develop a data workflow and analytic pipeline to combine publicly available individual-level data and 2) examine the ability of PRS, representing 19 common diseases and traits, including anthropometric traits, educational attainment, lipid levels, as well as cardiovascular, metabolic, immune-mediated, and mental and neurodegenerative diseases, to explain phenotypic variability of the selected frequently studied phenotypes, body height, myocardial infarction (MI) or type 2 diabetes (T2D). A better understanding of the genetic risks shared across various diseases may have important clinical implications, particularly in the era of personalized medicine (23), and help develop novel targets for drug development and repurposing.
Results
PRS Calculation across the traits and diseases in the discovery dataset
We obtained approval to access the four cardiovascular disease-based prospective cohort studies with genetic and phenotype data deposited to the database of Genotypes and Phenotypes (dbGaP), a public repository of anonymized phenotypic and genetic information from a large collection of diverse cohorts with appropriate consent (24): the Atherosclerosis Risk in Communities (ARIC) Study, the Framingham Heart Study (FHS), the Coronary Artery Risk Development in Young Adults (CARDIA) Study and the Multi-Ethnic Study of Atherosclerosis (MESA) (Table 1; Figure 1; Supplemental Material). After quality control and filtering, we retained 11,046,342 SNPs available in 20,021 subjects of European ancestry. We tested the association of MI, T2D and body height, with 19 PRS, educational attainment, body mass index (BMI); body height; T2D; cardiovascular disease (CVD); triglycerides (TG); total cholesterol (TC); low and high-density lipoproteins (LDL and HDL, respectively); inflammatory bowel disease (IBD) and its subtypes, ulcerative colitis (UC) and Crohn’s disease (CD); asthma, rheumatoid arthritis, celiac disease; schizophrenia; major depressive disorder; attention deficit hyperactivity disorder, and Alzheimer’s disease, all calculated at 8 different GWAS p-value thresholds (Table S1).
Table 1.
Discovery cohorts description
| Myocardial Infarction | Type 2 Diabetes | Body Height (cm) | |||||||
|---|---|---|---|---|---|---|---|---|---|
| Study | N | N of cases | N of controls | % cases | N of cases | N of controls | % cases | Mean | SE |
| ARIC | 8,086 | 1,950 | 5,898 | 24.8 | 891 | 5,328 | 14.3 | 168.7 | 0.11 |
| CARDIA | 220 | 41 | 179 | 18.6 | 10 | 198 | 4.8 | 170.6 | 0.64 |
| FHS | 9,030 | 194 | 6,656 | 2.8 | 462 | 6,037 | 7.1 | 169.1 | 0.20 |
| MESA | 2,685 | 94 | 2,591 | 3.5 | 353 | 2,332 | 13.1 | 168.9 | 0.19 |
ARIC, Atherosclerosis Risk in Communities (phs000280.v2.p1, longitudinal cohort study); CARDIA, Coronary Artery Risk Development in Young Adults (phs000285.v3.p2, longitudinal study); FHS, Framingham Heart Study (phs000007.v25.p9, longitudinal study); MESA, Multi-Ethnic Study of Atherosclerosis (phs000209.v13.p3, longitudinal study). SE, standard error.
Figure 1. Study Design.
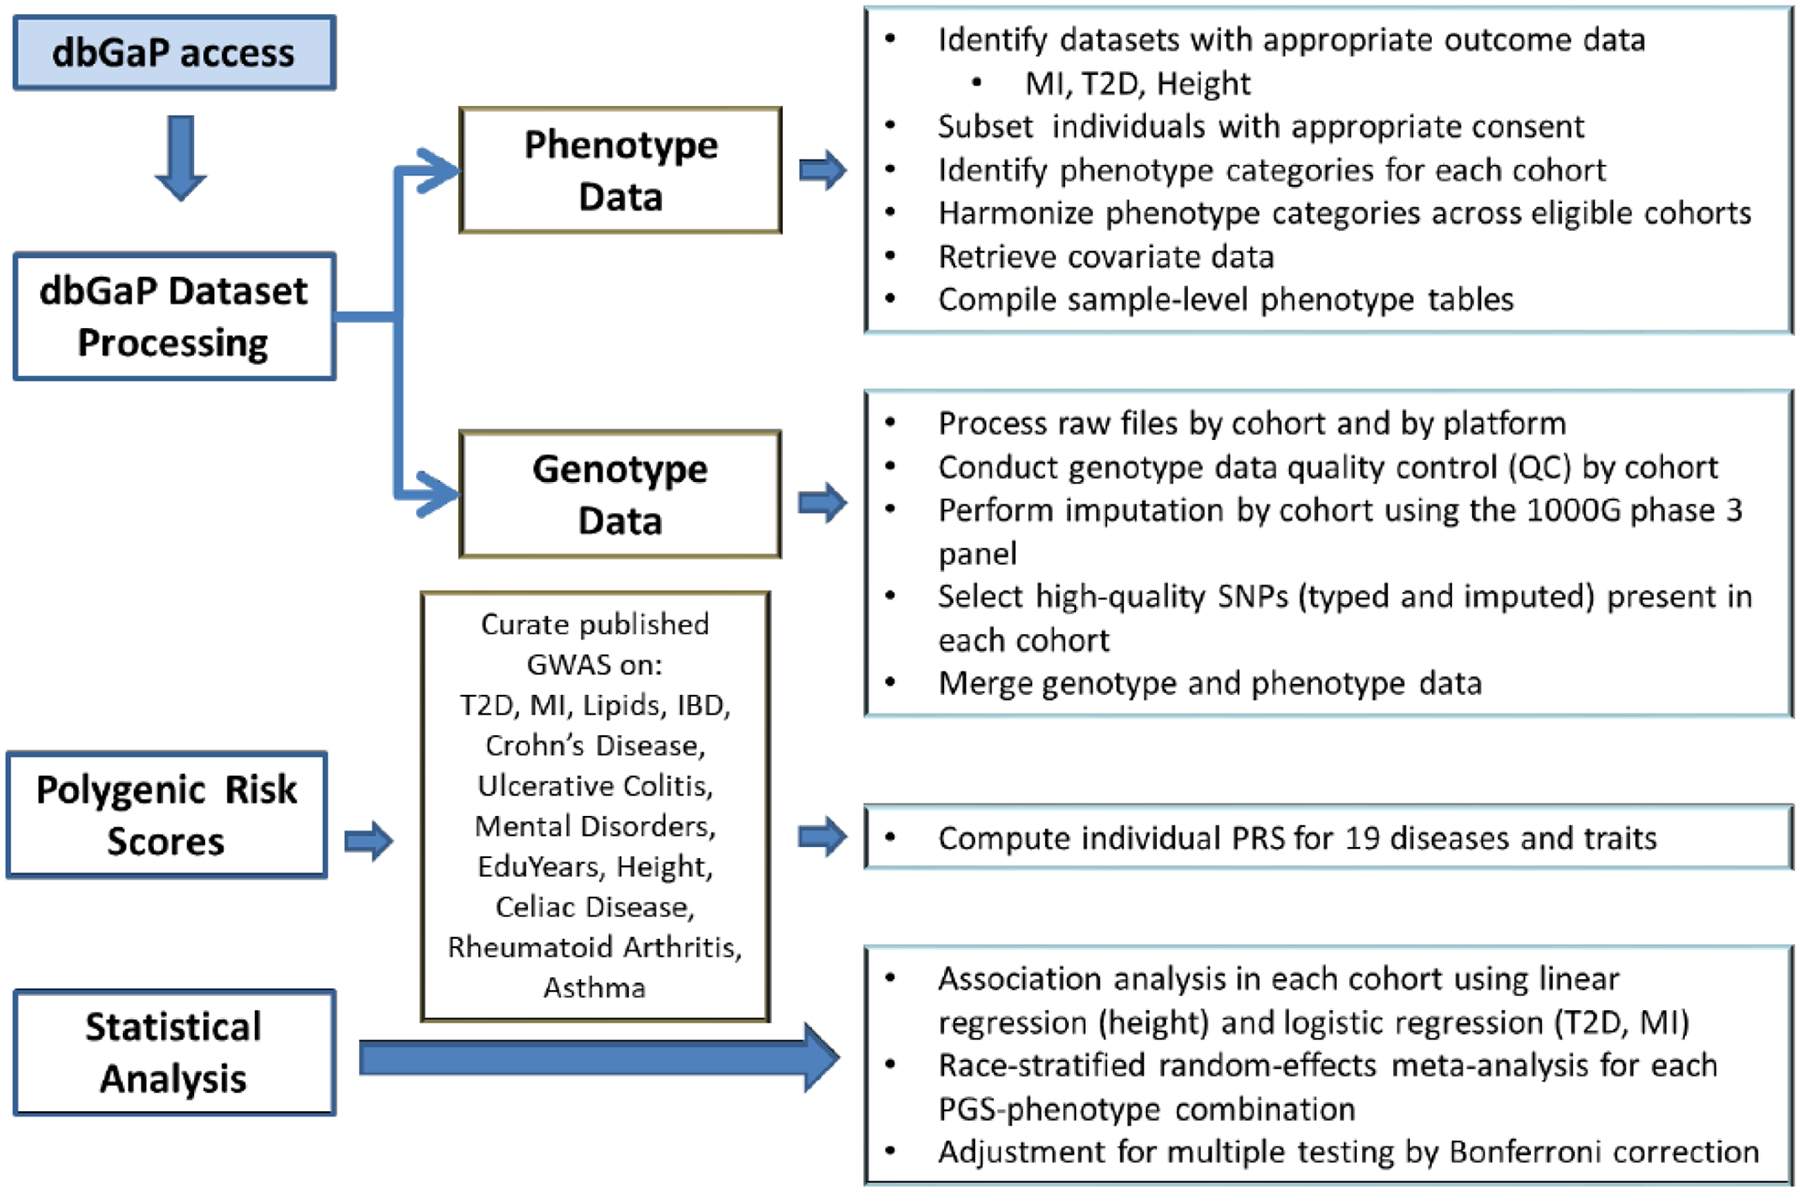
dbGAP, database of Genotypes and Phenotypes; T2D, type 2 diabetes; MI, myocardial infarction; GWAS, genome-wide association study; IBD, inflammatory bowel disease; EduYear, years of education.
Novel genetic link between body height and Crohn’s disease risk
We detected a strong correlation between observed height and PRS-CD, reaching study-wise statistical significance at the threshold of CD GWAS of p≤0.001 (Figure 2A; Table S2) demonstrating a 0.58 cm decrease in body height per interquartile range (IQR) increase in PRS-CD (95% confidence interval, CI: [−0.87; −0.3], Bonferroni-adjusted p=0.02). The direction of the effect was consistent across various p-value thresholds (Figure 2A) and dbGaP datasets (Figure 2B). Except for PRS-CD, there was no association found between our outcomes of interest and PRS for other immune-mediated diseases or mental disorders.
Figure 2. Associations of polygenic risk scores (PRS) for 19 traits constructed using various GWAS p-value thresholds with type 2 diabetes (T2D), myocardial infarction (MI), and body height.
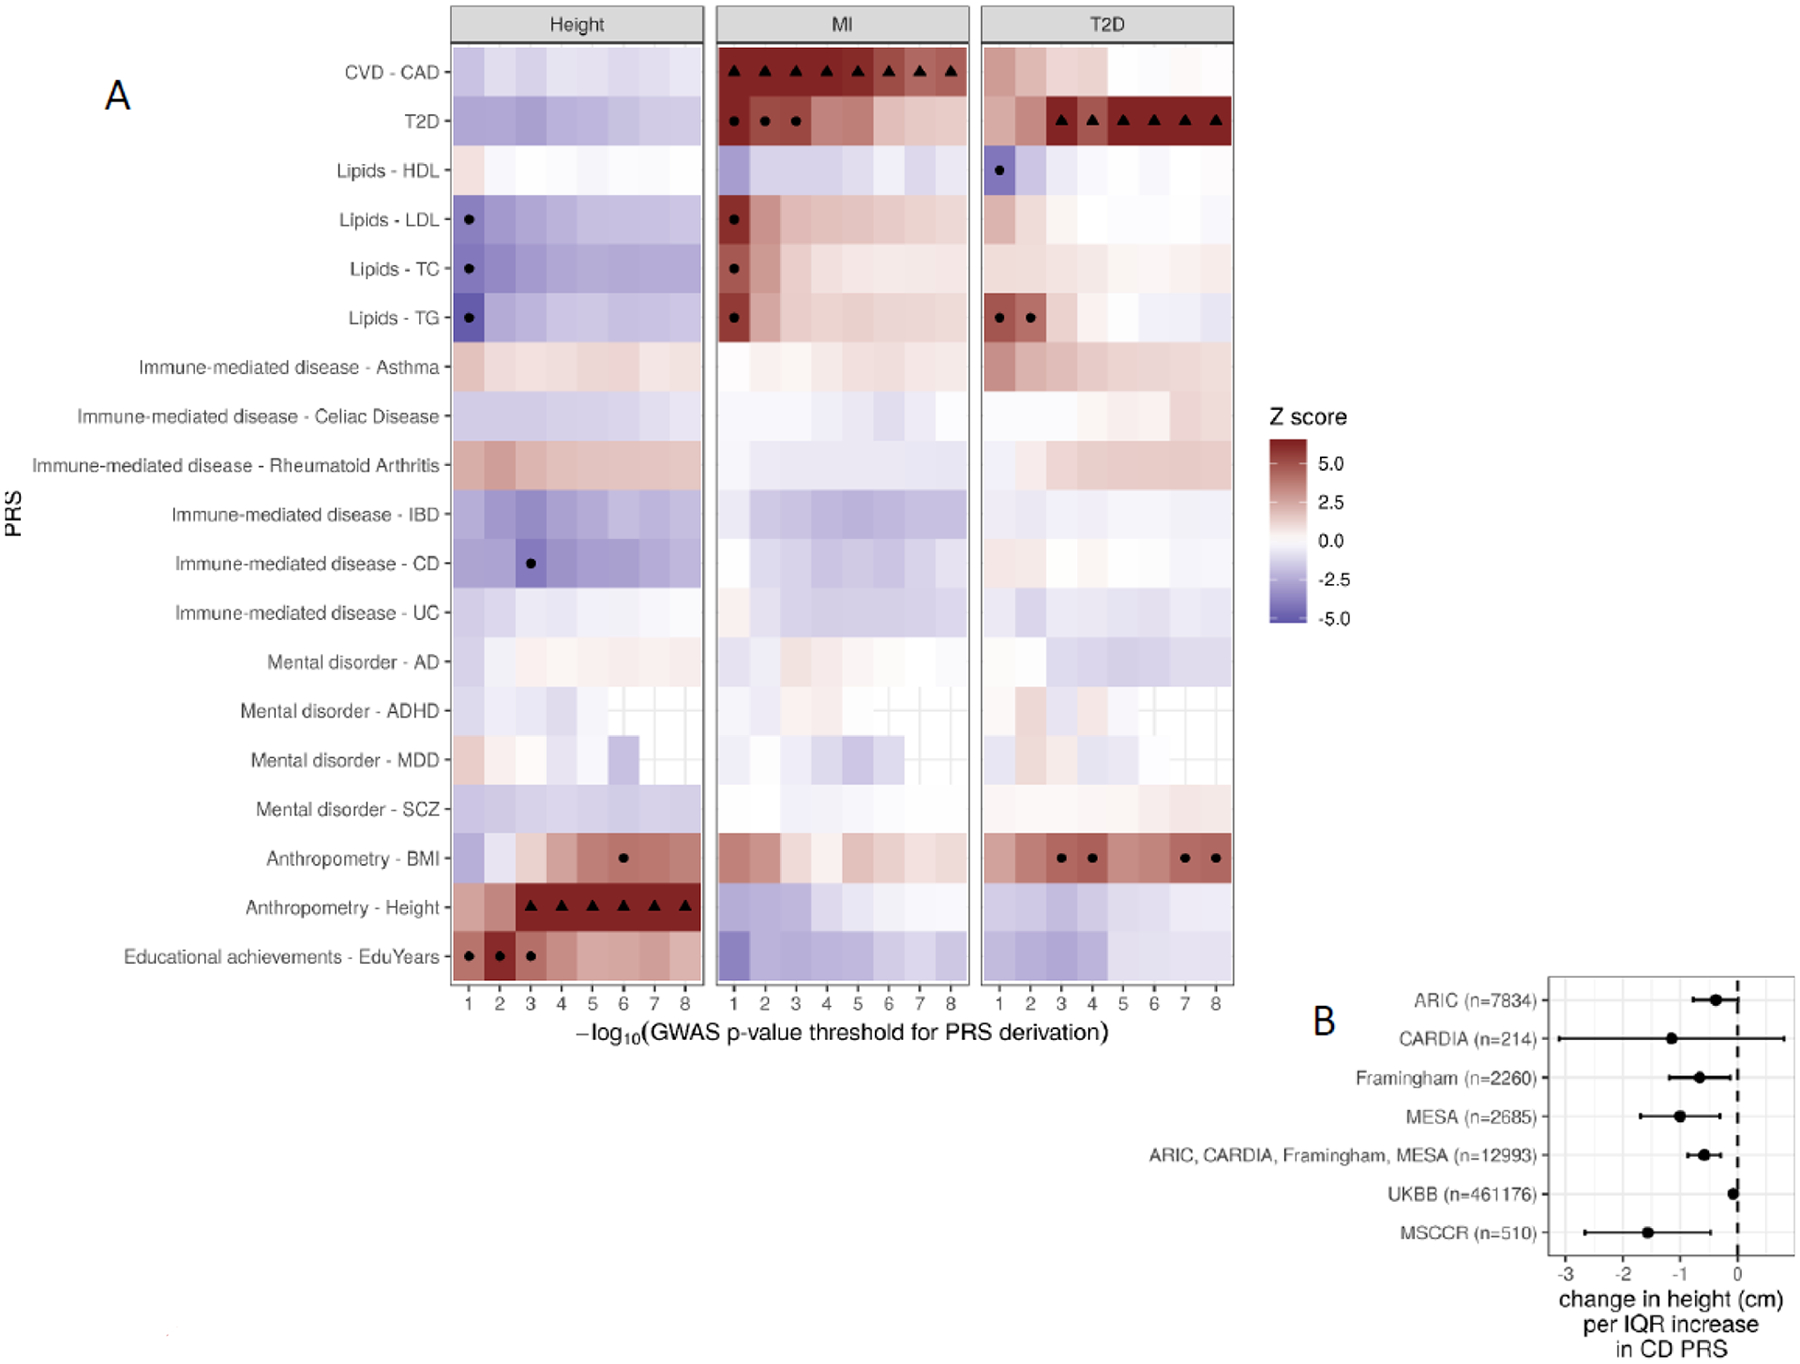
A. Z scores of association between polygenic scores and height for different genetically determined traits (vertical axis) computed at different GWAS p-value cutoffs (horizontal axis). Associations with nominal p < 0.001 are marked with a black dot. B. Forest plot of association coefficients (β in cm, x-axis) between PRS for Crohn’s disease (CD, p-value threshold ≤ 1E-3) and observed body height in the discovery and replication cohorts. ARIC, the Atherosclerosis Risk in Communities Study; Framingham, the Framingham Heart Study; CARDIA, the Coronary Artery Risk Development in Young Adults Study; MESA, the Multi-Ethnic Study of Atherosclerosis; MSCCR, Mount Sinai Crohn’s and Colitis Registry; UKBB, UK Biobank.
To validate the finding of the shared genetic link between body height and PRS-CD, where a higher genetic burden for CD risk is associated with shorter stature, we used two independent cohorts: the UK Biobank (UKBB) and the Mount Sinai Crohn’s and Colitis Registry (MSCCR). In a subset of 461,176 UKBB participants of European ancestry, we found a 0.08 cm decrease in body height per interquartile (IQR) increase in PRS-CD (95% confidence interval, CI: [−0.12; −0.04], p=1.12e-5; Figure 2B). In the MSCCR cohort containing 356 CD cases and 154 unaffected controls, all of European ancestry (Table S3), we observed that CD patients were on average 2.43±0.67 cm shorter than controls (Wilcoxon test p=0.02; Table S3). Also, as expected, PRS-height strongly correlated with observed height, while PRS-CD significantly correlated with CD diagnosis (Table S4). Specifically, at GWAS p-value threshold of p<1E-3, an interquartile range IQR increase in PRS-height associated with a 3.67 cm greater height (p=4.30E-9), whereas an IQR increase in PRS-CD was associated with a 4.7-fold higher CD risk (p=4.0E-18; Table 2). Moreover, IQR increase in PRS-CD was associated with a 1.6 cm shorter height (p=5.1E-3); this association remained significant after adjustment for CD diagnosis. Further, body height was significantly associated with PRS-CD (p= 5.1E-3; Table 2; Figure 2B; Table S4); this association remained significant after adjustment for CD diagnosis (p=3.9E-2) indicating that the link between body height and PRS-CD is likely beyond the presence of CD. Lastly, we found that at GWAS p-value threshold of p<1E-3, an IQR increase in PRS-height was associated with a 38% decrease in CD risk (odds ratio, OR=0.62, 95% confidence interval, 95%CI, 0.46–0.82; p=1.1E-3), this association remained significant after adjustment for observed body height (OR=0.65, 95CI 0.48–0.88; p=4.8E-3; Table 2; Table S4), further supporting a pleiotropic effect between height and risk of CD.
Table 2.
Associations of Crohn’s disease diagnosis and height with polygenic risk scores for Crohn’s disease risk and height in the Mount Sinai Crohn’s and Colitis Registry.
| Observed Trait/Disease | Adjustment | Effect size for PRS | p-value | |
|---|---|---|---|---|
| PRS | Other covariates | |||
| Beta, cm | ||||
| Height | PRS-CD | - | −1.57 (0.56) | 5.00E-03 |
| Height | PRS-CD | CD | −1.28 (0.62) | 3.87E-02 |
| Height | PRS-height | - | 3.67 (0.61) | 4.28E-09 |
| Height | PRS-height | CD | 3.54 (0.62) | 1.89E-08 |
| OR (95%CI) | ||||
| CD | PRS-CD | - | 4.69 (3.31–6.65) | 4.01E-18 |
| CD | PRS-CD | Height | 4.62 (3.26–6.56) | 9.68E-18 |
| CD | PRS-height | - | 0.62 (0.46–0.82) | 1.00E-03 |
| CD | PRS-height | Height | 0.65 (0.48–0.88) | 5.00E-03 |
PRS, polygenic risk score; PRS-CD PRS for Crohn’s Disease (CD); PRS-height, PRS for body height, both computed at the genome-wide association studies’ p-value threshold of p<1E-3. OR, odds ratio; 95%CI, 95% confidence interval. Beta and OR represent changes per interquartile increase in PRS.
Gene-set enrichment analysis
To explore the biological mechanisms underlying the observed shared genetic effects between CD risk and height, we conducted a pathway enrichment analysis of 510 genes containing or in the proximity of the 4,333 variants that overlapped between PRS-height and PRS-CD at p≤1E-3 (25, 26) (Figure 3A). We detected significant enrichment of genes from the inflammatory and immune-mediated pathways, especially cytokine signaling and immune response, antigen processing, and cytokine production, as well as growth factor regulation pathways (Figure 3B–3C). We also generated gene sets that intersect between PRS-height and PRS for other immune-mediated diseases and looked for the genes that overlap across the gene sets (Figure 4). We found that a large number of genes in the PRS for immune-mediated diseases uniquely overlapped with PRS-height: PRS-CD (260 genes), PRS-UC (238 genes), PRS-asthma (104 genes), PRS for rheumatoid arthritis (RA) (139 genes), and PRS-Celiac disease (32 genes), while other genes were present in PRS-height and PRS for several immune-mediated diseases (Figure 4). We then used Enrichr’s Kyoto Encyclopedia of Genes and Genomes (KEGG) pathway library to perform gene-set enrichment analyses of the genes overlapping between PRS-height and PRS for immune-mediated diseases. We found that the top terms enriched among the overlapping genes across all PRS (height, CD, UC, asthma, RA and Celiac disease) were very similar and belonged to the immune-mediated pathways, including Th1 and Th2 cell differentiation, phagosome, Th17 cell differentiation allograft rejection, and IBD. The Type I diabetes mellitus, human T-cell leukemia virus 1 infection, autoimmune thyroid disease, asthma, graft-versus-host disease, and antigen processing and presentation pathways were also significantly enriched for all PRS but PRS for Celiac disease (Table S5). Interestingly, the osteoclast differentiation pathway was only significantly enriched among the genes overlapping between PRS-height and PRS-CD and not PRS for other immune-mediated diseases (Table 3).
Figure 3. Intersection between Crohn’s disease and height-associated variants in the respective polygenic risk scores and their enrichment in biological pathways.
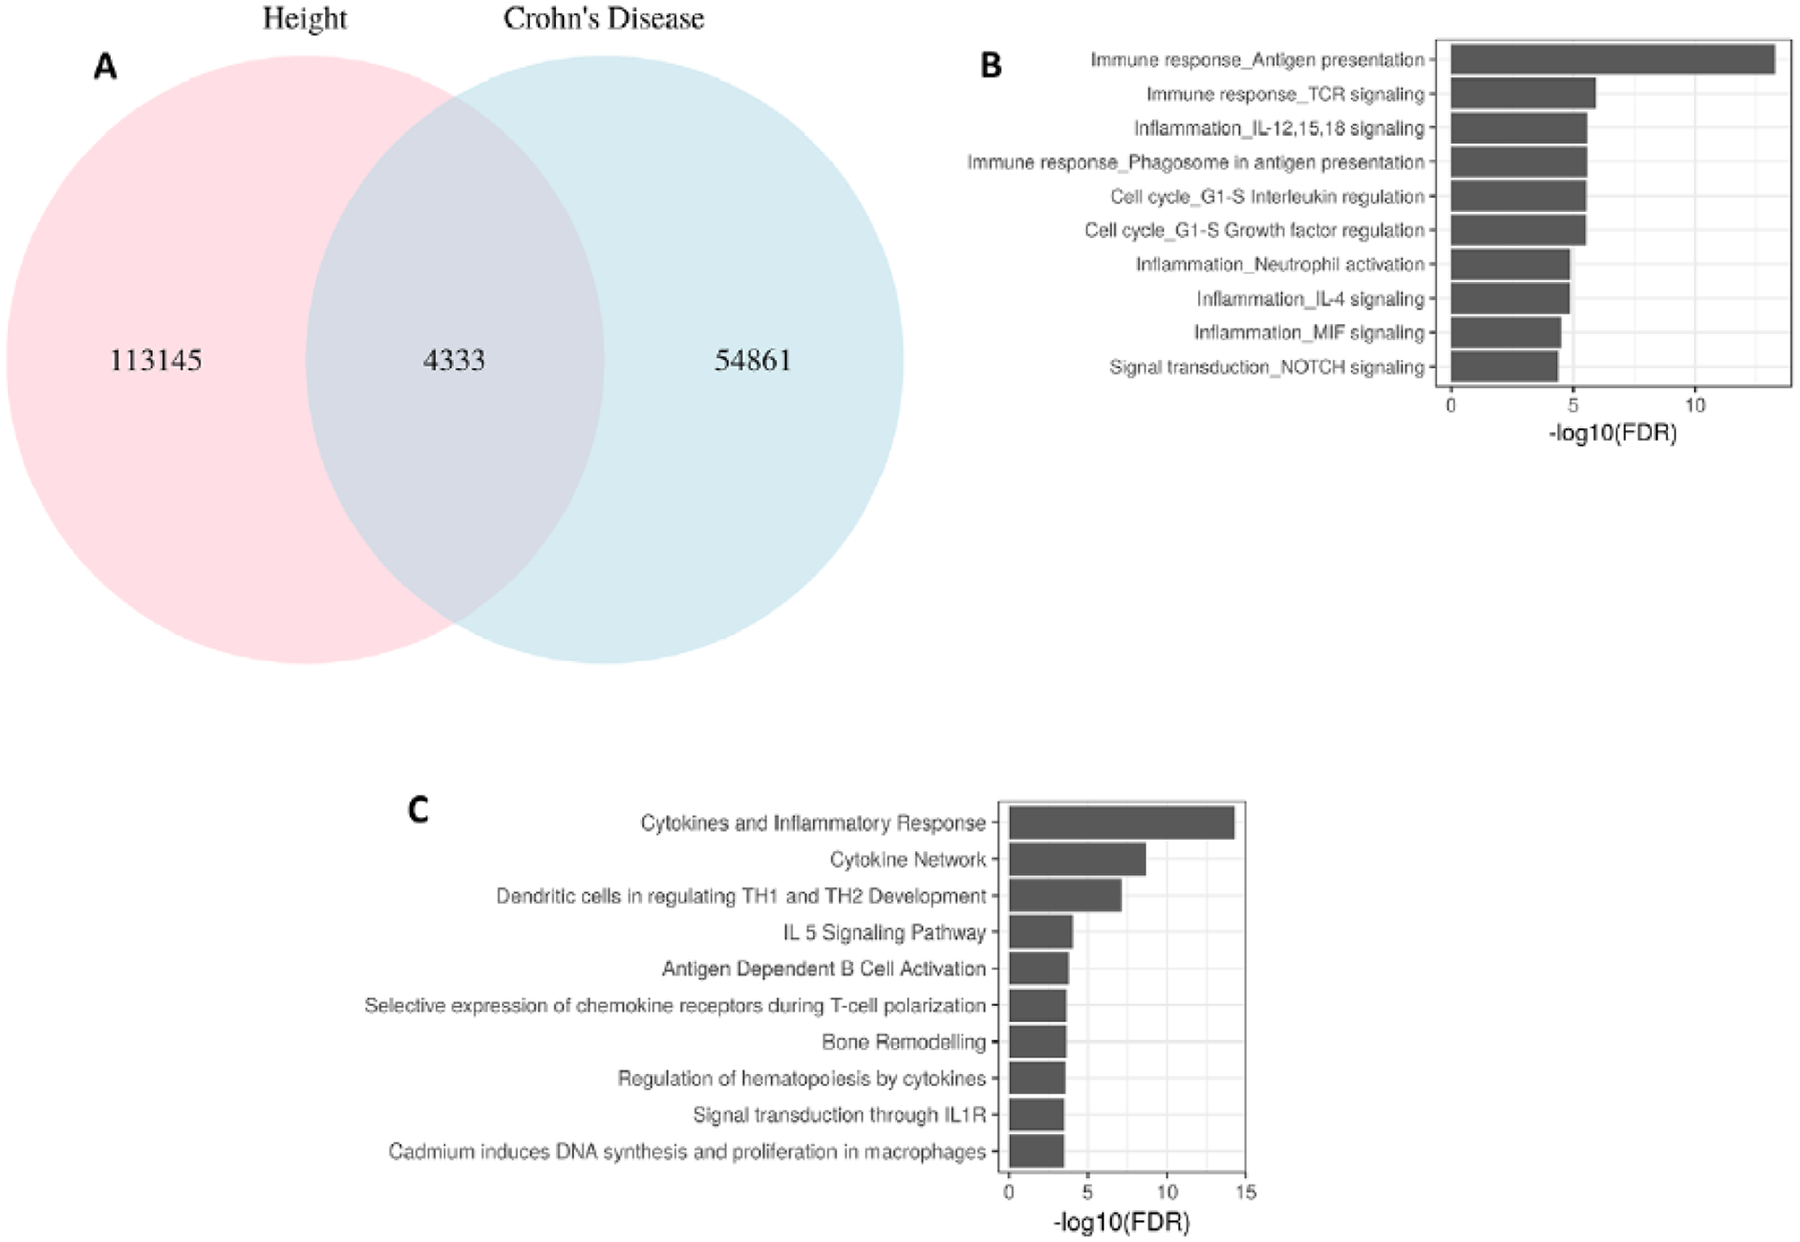
A. Number of overlapping variants for Crohn’s disease (CD) and height at GWAS p ≤ 0.001; B. Top enriched biological process networks by MetaCore (Thomson Reuters); C. Gene-set enrichment analysis (GSEA) using Biocarta in Molecular Signatures Database, MSigDB.
Figure 4. Summary of genes intersecting between polygenic risk scores for immune-mediated diseases and adult height.
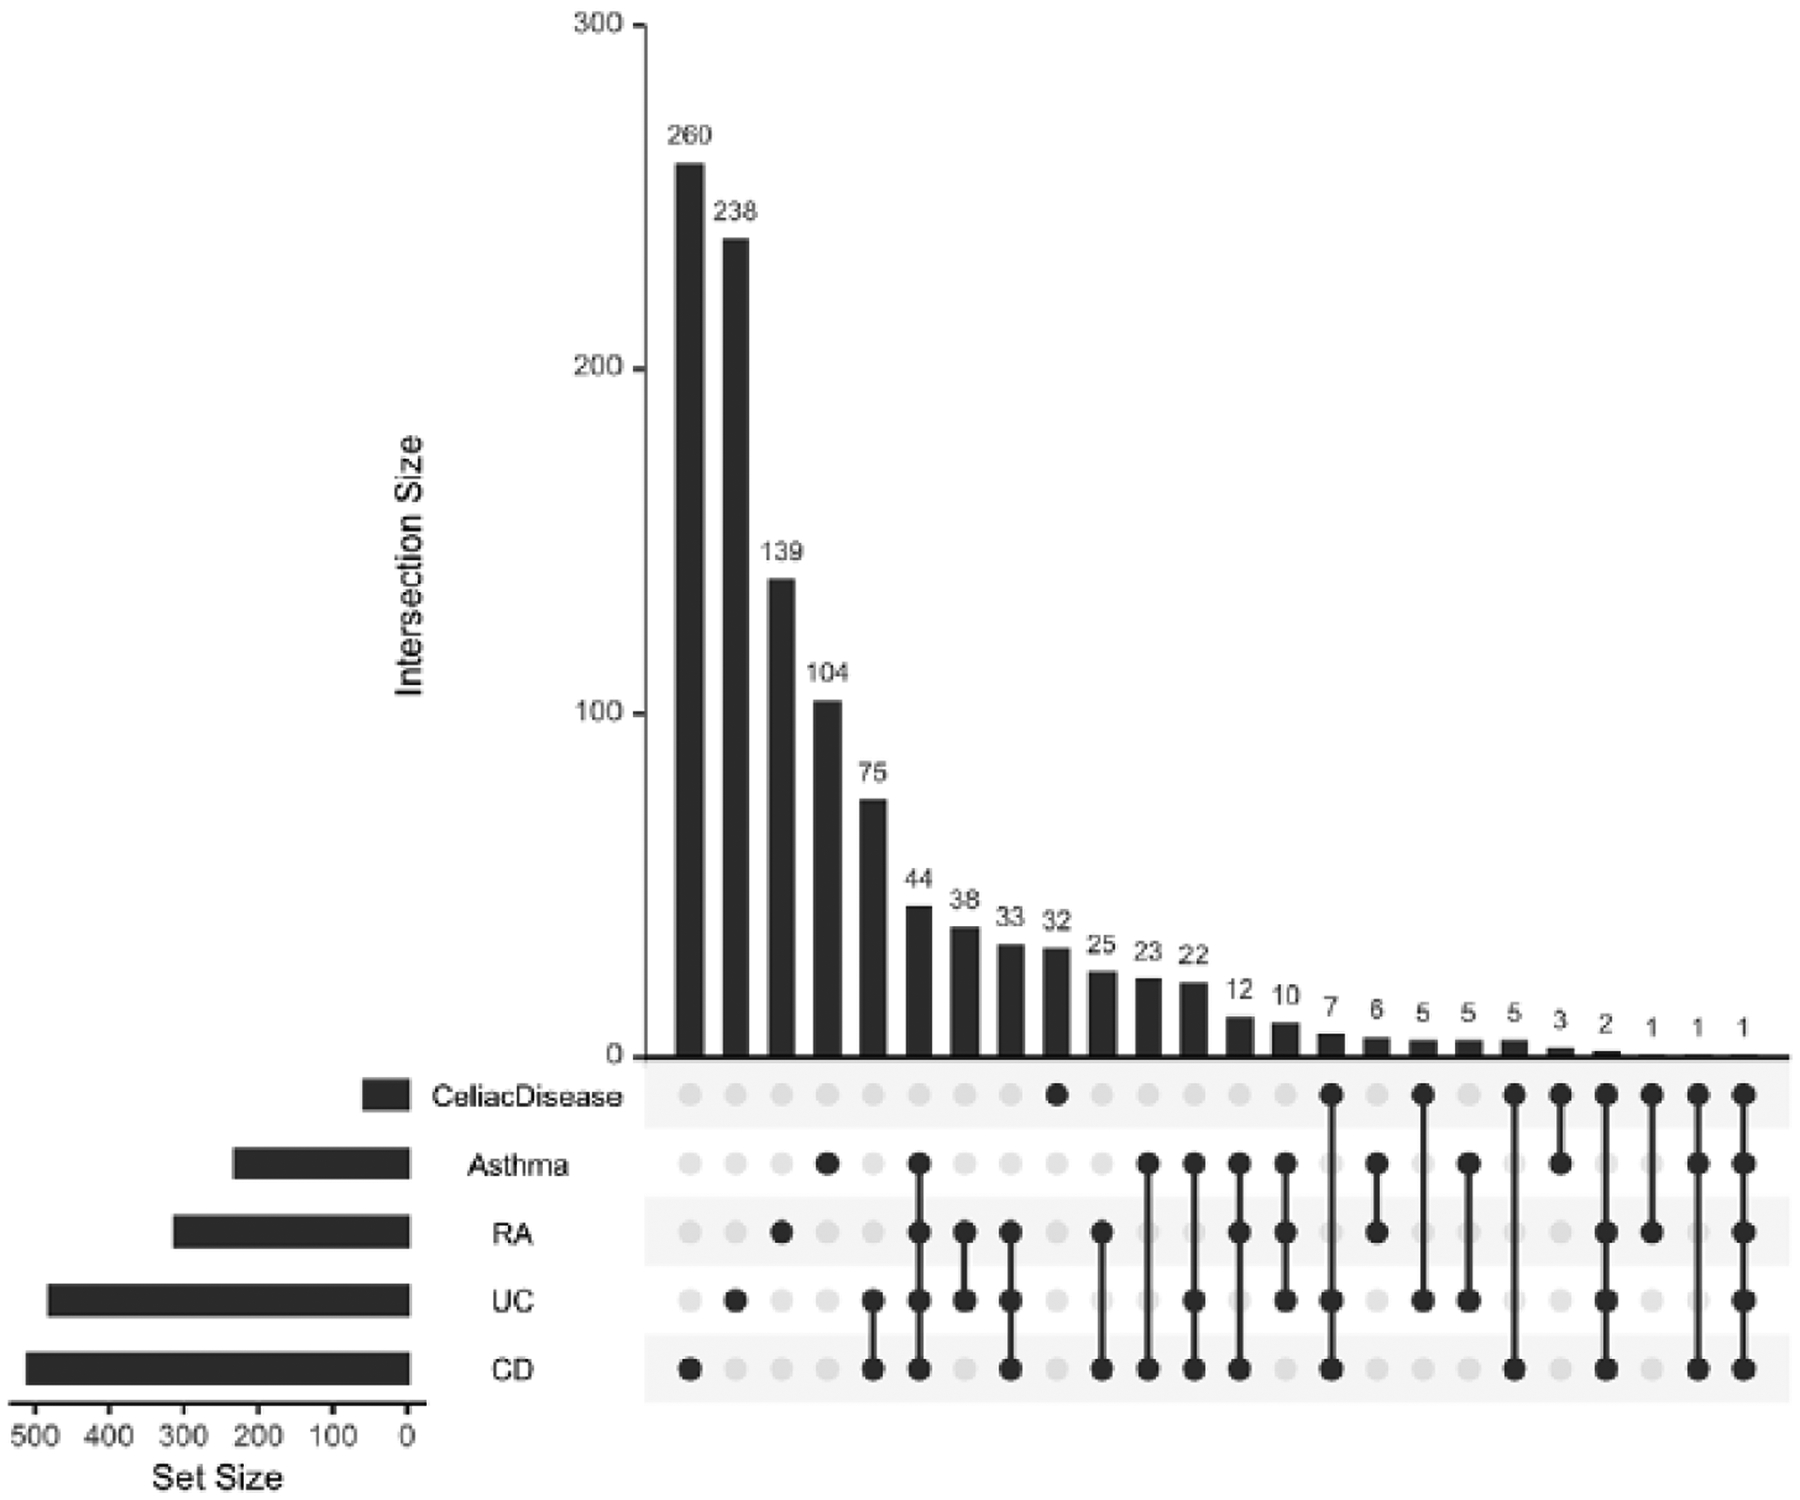
RA, rheumatoid arthritis; UC, ulcerative colitis; CD, Crohn’s disease.
Table 3.
Osteoclast differentiation pathway enrichment among the genes intersecting between polygenic risk scores of immune mediated diseases and body height
| Genes overlapping between PRS for height and PRS for other diseases | Gene overlap | P-value | Adjusted P-value | Overlapping genes |
|---|---|---|---|---|
| CD | 10 out of 127 | 0.002 | 0.01 | FOSL1;NFKBIA;CYLD;TGFB2;AKT1;TAB1;FOS;TNF;NFKB1;FOSL2 |
| UC | 6 out of 127 | 0.09 | 0.29 | NFKBIA;NFATC1;PIK3R1;NFKB1;FOSL2;MAPK3 |
| Asthma | 2 out of 127 | 0.43 | 1.0 | CYLD;NFKB1 |
| Celiac disease | 2 out of 127 | 0.05 | 1.0 | NCF2;NFATC1 |
| RA | 2 out of 127 | 0.59 | 1.0 | PPARG;TNF |
PRS, polygenic risk score; CD, Crohn’s disease; UC, ulcerative colitis; RA, rheumatoid arthritis.
Tissue-specific gene expression analysis of genes overlapping between PRS-height and PRS for immune-mediated diseases
We tested if the genes overlapping between PRS-height and PRS for CD and other immune mediated diseases are overexpressed in particular tissues or cells using GTEx, the Genotype-Tissue Expression project and DICE, the Database of Immune Cell eQTLs, Expression, and Epigenomics. Many of the overlapping genes were highly expressed in numerous tissues and cells (Table S6) with significant differences in expression patterns between gene intersecting between PRS-height and PRS-CD compared to PRS-height and other diseases (Table S7).
Genetic pleiotropy modeling
We also detected a number of previously reported and novel cross-trait associations that reached statistical significance (Bonferroni-corrected p<0.05). Importantly, PRS for MI, T2D and height strongly correlated with respective observed MI, T2D and height regardless of the GWAS p-value threshold used to derive PRS (Figure 2A; Table S2). In addition, as expected, T2D risk was positively associated with PRS for TG levels and BMI, and negatively associated with PRS for HDL level. Except for PRS-BMI, the strongest associations were observed between T2D status and PRS derived at the most liberal GWAS p-value thresholds (p≤0.01). MI risk was positively associated with PRS for T2D, TG, TC and LDL levels reaching study-wise statistical significance at the GWAS threshold of p≤0.001. Body height positively correlated with PRS for attained education years (most strongly at GWAS threshold of p≤0.001) and BMI (most strongly at GWAS threshold of p≤E-6), and negatively with PRS for CD, T2D, TG, TC and LDL levels (most strongly at GWAS threshold of p≤0.1).
The individual level phenotype and genotype data allowed for the opportunity to test different genetic models (Figure S1). The comorbidity of T2D and MI has been previously recognized (27), and therefore, we followed up on the shared genetic risk that we detected between T2D and MI (Figure 2A). MI status was associated with the PRS for T2D at all T2D GWAS p-value thresholds, with the most significant results detected at p≤1E-1 cutoff (OR=1.60 per IQR increase in PRS-T2D; 95%CI 1.38–1.86; p=4.16E-10). We then tested whether this result could be explained by the effect of underlying T2D on MI risk (i.e., mediation model). In the conditional analysis, MI status remained significantly associated with the PRS-T2D after adjustment for T2D diagnosis (Table 3; Table S2); however, the magnitude of effect and the level of significance decreased compared to the unadjusted model (OR=1.27; 95%CI 1.10–1.46; p=8.79E-04). These findings imply both a mediating effect of T2D comorbidity, as well as an additional pleiotropic effect of T2D-associated loci, independent of T2D diagnosis, on MI risk.
Discussion
We used the sample-level data in the dbGaP database to investigate pleiotropic effects of loci that confer genetic risk for 19 common diseases and traits with MI, T2D and height and found that PRS-CD was inversely correlated with body height. Moreover, we confirmed previously reported genetic pleiotropy between cardiometabolic and anthropometric traits and demonstrated that T2D and MI comorbidity cannot be fully explained by shared genetic risks.
CD is a type of inflammatory bowel disease that results from excessive immune response to commensal bacteria in genetically susceptible individuals, causing chronic inflammation of the gastrointestinal tract (28). Growth failure is common in patients with childhood-onset CD, with 11–30% having shorter adult height (29–32). A recent large study has reported that patients with childhood-onset CD attain on average 1.3 cm shorter adult height than their healthy peers (33). While the exact mechanisms by which growth impairment occurs in CD patients are not fully understood, inadequate caloric intake and circulating inflammatory cytokines, often coupled with corticosteroid treatment, have been considered to have major effects. However, it has been shown that ~30–40% of linear growth impairment in experimental colitis occurs as a direct result of the inflammatory process, which is independent of undernutrition (34). Importantly, in our study we observed that the link between genetically-determined inflammation, as reflected by PRS-CD, and body height was observed among individuals without CD, suggesting an inverse relationship between the growth and inflammation processes, rather than the effects of an established disease. When validated in an independent cohort of CD patients and controls, we demonstrated an even stronger association between PRS-CD and body height, which remained significant after the adjustment for CD diagnosis. This observation suggests that the correlation between PRS-CD and height cannot be fully explained by CD diagnosis and remains significant, though to a lesser extent, in unaffected individuals, and that certain genes associated with both phenotypes may affect height in the absence of CD diagnosis (Table 3). Also, PRS-height was a significant predictor of CD risk, further supporting the link between growth and inflammatory factors contributing to CD.
Furthermore, the pathway-based analysis of the overlapping genes shared between PRS-CD and PRS-height at the GWAS p-value threshold of <1E-3 detected significant enrichment of the genes in the immune system response and inflammation-related pathways, particularly those associated with interferon-γ signaling and antigen processing, among others (Figure 3). There have been multiple efforts to restore the deficit in adult height in patients with early onset CD. For example, clinical trials with recombinant human growth hormone in short children with IBD produced controversial results (35, 36) and have not been extended. However, anti-tumor necrosis factor α (TNF) therapy, directed at reducing systemic inflammation, prevented loss of height without fully restoring the genetic growth potential in a group of patients with CD (37, 38); yet, their effects on adult height are still unknown. Future studies are warranted to identify inflammatory biomarkers that are elevated in children with high inflammatory genetic burden (high PRS-CD), which could serve as novel targets to improve the growth outcomes.
Interestingly, we did not observe the same association between PRS-UC, another type of IBD, and height. While there is a genetic overlap between CD and UC, multiple loci are unique to each of these diseases (39). Growth impairment has been reported in only 12% of UC cases (32). Moreover, no correlation was detected between height and PRS for RA, asthma or Celiac disease. Previous studies have reported that the attained adult height of patients with childhood onset asthma (40) or RA (41), is not different from the adult height of age- and sex-matched controls in the absence of the prolonged corticosteroid therapy, while the effect of Celiac disease on adult height is inconclusive (42–44). We demonstrated significant, but modest, differences in the patterns of gene expression across multiple tissues and cell types between the gene sets overlapping between PRS-height and PRS-CD and those overlapping between PRS-height and PRS for other immune mediated diseases. Also, while many of the overlapping genes between PRS-height and PRS for CD, UC, asthma, RA or Celiac disease were enriched in the same inflammatory and immune-mediated pathways, only genes intersecting between PRS-CD and PRS-height were significantly enriched in the osteoclast differentiation pathway. Osteoclasts are multinucleated cells that resorb bone and play important roles in bone growth. Loss of functional osteoprotegerin, a member of the TNF receptor family expressed by osteoclasts, has been linked to short stature (45).
Our statistical power in testing the association between height and PRS of autoimmune diseases was affected by multiple factors, including sample size of the testing datasets and power of the GWAS used to derive PRS. First, we used the same datasets (e.g. FHS and ARIC) to test associations between body height and PRS of each auto-immune disease, therefore, all tests had the same sample size. Second, the power of a GWAS is governed by its sample size and the genetic architecture of the disease (e.g., monogenic vs. oligogenic, effect sizes for various loci). While the sample sizes for CD (40,266) (46), UC (45,975) (46), and RA (58,284) (47) GWAS were comparable, GWAS for asthma (N=26,475) (48) and Celiac disease (10,602) (49) were relatively smaller. Future studies are needed to validate our findings once larger GWAS become available.
In this study, we also confirmed previously reported shared genetic associations for height and total cholesterol (50), height and TG (50, 51), height and LDL (50), MI and T2D (52, 53), MI and total cholesterol (54, 55), MI and LDL (56), MI and TG (57), T2D and TG (58), T2D and HDL (59), and T2D and BMI (60). A better understanding of independent versus mediating genetic effects (17) between comorbidities may help improve therapeutic approaches by determining whether certain biological pathways directly underlying disease pathogenesis (in case of independent genetic effects) or through comorbidities (in case of mediation) or both should be targeted to improve disease outcomes. We discovered that PRS-T2D significantly correlated with MI diagnosis regardless of the T2D GWAS p-value threshold, demonstrating a 1.6-fold increase in MI risk per IQR increase in the PRS-T2D; the results were attenuated but remained significant even after controlling for T2D diagnosis. These findings are consistent with previous epidemiological reports of increased CVD burden in patients with T2D (27, 61) and suggest that PRS-T2D could be used to stratify individuals with or without T2D who are at risk of MI. Future research is warranted to further assess the shared genetic risks between T2D, MI, obesity-related traits, lipid levels, and other related traits.
One of the strengths of our study is leveraging multiple datasets with individual-level genotype and phenotype data. Individual-level data ensures a uniform analysis across multiple datasets, as it relates to application of quality control filters, imputation methods and ancestry determination. Moreover, while methods to conduct conditional analyses are available based on summary-level data and have similar statistical power based on a simulation study (62), they are constrained to the covariate adjustment used in the original GWAS.
This study has several limitations. Specifically, dbGaP datasets used different ascertainment approaches to recruit subjects, which could contribute to overall phenotypic heterogeneity. Moreover, our analyses were constrained to individuals of European ancestry because the large GWAS used for PRS derivation were carried out predominantly in European populations (63), thereby potentially limiting the generalizability of our findings to non-white populations. Predictive performance of European ancestry-derived PRS has been reported to be lower in non-European samples (64), as the optimal choice of SNPs and weights for PRS may differ between populations due to different linkage disequilibrium and allele frequency patterns. Large-scale GWAS in diverse human cohorts are warranted to improve predictive value of PRS in minority populations. Also, gene expression data were not available in the tissues or cell types most relevant to growth, including the bone tissue, osteoblasts, osteoclasts, and others to better understand the mechanism of the observed association.
In summary, for the first time, we report the genetic link between shorter stature and higher genetic risk for CD. The direction and magnitude of the effect were consistent across all discovery cohorts of European ancestry, and replicated in UKBB and in an independent CD case-control study, where CD patients had shorter heights than controls. Importantly, the association between PRS-CD and height was independent of CD diagnosis suggesting an inverse relationship between the growth and inflammation processes, rather than the effects of an established disease. This work demonstrates the value of using individual level data from dbGaP in searching for shared genetic determinants, which could help provide refined insight into disease pathogenesis and may have major implications for novel therapies and drug repurposing.
Materials and Methods
Discovery analysis
Study Cohorts
The workflow for phenotype and genotype data retrieval and processing is shown in Figure 1 and the detailed study protocol provided in Supplemental Material. Briefly, for each study, phenotype metadata was extracted and summary statistics generated on all variables of interest. We then manually inspected the merged phenotype tables and assigned each variable to a broad phenotype category (e.g., cardiovascular diseases, metabolic diseases). Variables representing three endpoints of interest: body height, T2D, and MI, were selected for each study. To ensure phenotype data quality and consistency across the studies, we applied strict phenotype definitions that were then manually reviewed by clinicians. Ambiguous cases were treated as missing data. Genotype data from each study were first converted into binary plink format (65), while the single nucleotide polymorphism (SNP) coordinates to hg19 when necessary, and processed using standard quality control procedures followed by SNP imputation using the 1000 Genomes Project reference panel as implemented in the MaCH-minimac imputation pipeline on the Michigan Imputation Server(66) (Supplemental Material). Principal component analysis (PCA) was performed with EIGENSOFT (67) in ARIC, CARDIA, and FHS. Individual ethnicity was assigned through visual inspection of the samples’ projection on the PC space defined by HapMap3 genotypes. In MESA, where the genotype data was stratified by self-reported ethnicity, the ethnicity was confirmed by PCA. Only subjects of European ancestry were included, for a total of 20,021 individuals. After excluding low imputation quality SNPs, we retained 11,046,342 variants, which were successfully imputed in all 4 cohorts for downstream analysis.
PRS Derivation
The PRS, representing estimated genetic burden for 19 diseases and traits, were computed for each of the 20,021 individuals from the four dbGaP cohorts as linear combinations of the imputed genotype dosages, using regression coefficients from the respective GWAS summary statistics retrieved from published studies (17) (Table S1). For each disease/trait, we calculated 8 PRS using various GWAS p-value thresholds: 1E-1, 1E-2, 1E-3, 1E-4, 1E-5, 1E-6, 1E-7, 1E-8 for including SNPs in PRS derivation. Prior to calculation, for each threshold, the retrieved SNPs underwent linkage disequilibrium (LD)-pruning using the 1000 Genomes European reference (68) as implemented in PLINK software (65), where highly redundant SNPs (r2≥0.5) were removed. PRS were generated similarly in the UKBB and MSCCR cohorts.
Statistical Analysis
Association tests between a PRS for each of the 19 traits or diseases and one of the endpoints (height, MI and T2D) were conducted within each cohort using a univariate regression, with the endpoint as the outcome and the PRS as the predictor. Association statistics from the five datasets were then combined using random-effects meta-analysis, implemented in the ‘meta’ R package (69). As a positive control, we also tested associations between the observed phenotype and its corresponding PRS generated from published GWAS (e.g. observed body height versus PRS for body height). Given that 384 tests were run (one test per each combination of endpoint, PRS and p-value cutoff), the study-wise significance was set at 1×10⁻⁴ (0.05/384) after applying Bonferroni correction.
Replication Analysis
To validate the association between PRS-CD and body height, we used the UKBB dataset, a large long-term biobank study in the United Kingdom. We included 461,176 adult individuals of European ancestry, for whom both imputed genotypes and body heights were available. Details on subject recruitment, genotyping and imputation are reported elsewhere (70). To assess the association between the PRS-CD and observed body height in the presence or absence of CD, we used data from a cross-sectional cohort recruited at the Mount Sinai Medical Center, New York, NY as part of an ongoing registry. Five hundred and ten CD cases and healthy control were matched for age and gender, and only individuals of European descent were included (Table S3). Body height was reported at recruitment and genotyping was conducted using Illumina Multi-Ethnic Global Array (MEGAEX), followed by quality control and imputation using the same set-up described for the dbGaP studies. PRS-CD and PRS-height were calculated as described above. Linear and logistic regression analyses were used to validate the associations with observed height and CD diagnosis, respectively.
Pathway enrichment analysis
To further investigate the biological pathways encompassing the shared genetic component of CD risk and body height, we retrieved the variants that appeared on both CD-PRS and height-PRS, and mapped them to official gene symbols by hg19 position, while only including intergenic SNPs. We then conducted pathway enrichment analysis as implemented in MetaCore (Thomson Reuters) and Molecular Signatures Database (MSigDB) (71) using Biocarta. We then used Enrichr (25, 26) to look for enrichment of genes overlapping between PRS-height and PRS for immune-mediated diseases in the KEGG_2019_Human gene-set library which contains 308 terms covering 7,802 genes (92 genes per term). Adjusted p-values calculated using the false discovery rate (FDR) for correction for multiple hypotheses testing (72) were reported for each term and each set of comparisons (e.g., PRS-height – PRS-CD overlap). An adjusted p<0.05 was considered statistically significant.
Tissue-specific gene expression analysis
To assess the expression patterns of the gene sets overlapping between PRS-height and PRS for other immune mediated diseases we pooled expression data for each gene from GTEx (https://gtexportal.org/home/) and DICE (https://dice-database.org/). We then compared the proportion of genes in each gene set expressed in each tissue and cell type across the overlapping gene sets using a Walds test.
Conditional Regression
To test for genetic pleiotropy, along with respective PRS, we included CD diagnosis as a covariate while modeling height and height while modeling CD status (Figure S1). We considered two genetic pleiotropy models previously described (17): a mediation model (Figure S1A) and an independent effect model (Figure S1B), which can be distinguished with conditional regression (Figure S1C). In the presence of genetic pleiotropy, observed trait 1 is associated with PRS-trait 2 (i.e., β≠0), and vice versa (Figure S1C, formula 1 and 2). Under the mediation model, after adjusting for the observed trait, PRS for that trait would no longer be associated with the second trait (non-significant β1 in formula 3 and 4, Figure S1C). In contrast, under the independent model, PRS-trait 2 would still be associated with trait 1 even when adjusted for observed trait 2, while PRS-trait 1 would still be associated with trait 2 even when adjusted for observed trait 1. Using this strategy, we applied conditional regression and investigated the genetic pleiotropy models for body height and CD.
Supplementary Material
Table 4.
Associations between myocardial infarction risk and polygenic risk score for type 2 diabetes, with and without adjustment for type 2 diabetes diagnosis
| Model with MI as outcome | Covariates | p-value | OR (95% CI) |
|---|---|---|---|
| Univariate | PRS-T2D | 4.16E-10 | 1.60 (1.38–1.86) |
| Multivariate | PRS-T2D | 8.79E-04 | 1.27 (1.10–1.46) |
| T2D diagnosis | 2.88E-02 | 1.87 (1.07–3.28) |
Results from logistic regression analysis of myocardial infarction (MI, outcome) as a function of polygenic risk score for type 2 diabetes (PRS-T2D), calculated at genome-wise association study p-value threshold of p<0.1, with and without adjustment for observed T2D diagnosis; OR, odds ratio of MI risk per interquartile range increase in PRS-T2D.
Funding
This work was supported by the National Heart, Lung, And Blood Institute [R01HL125027 to IP and HMC], National Human Genome Research Institute [R01HG010649 to IP and HMC], National Institute on Drug Abuse [R01DA047045 to HMC and IP], National Institute of Diabetes and Digestive and Kidney [U24DK062429 and R01DK106593] The funders had no role in study design, data collection and analysis, decision to publish, or preparation of the manuscript.
Footnotes
Conflict of Interests
The authors declare no competing interests.
Ethics Approval
The study was approved by the Icahn School of Medicine Institutional Review Board.
Consent to Participate
Study participants for the Mount Sinai Crohn’s and Colitis Registry were consented using a written informed consent.
Consent for Publication
N/A
Availability of Data and Material
Database of Genotypes and Phenotypes (dbGaP, https://www.ncbi.nlm.nih.gov/gap)
MetaCore (Thomson Reuters; https://portal.genego.com)
Molecular Signatures Database, MSigDB (http://software.broadinstitute.org/gsea/msigdb)
Code Availability
The code is available upon request.
References
- 1.MacArthur J, Bowler E, Cerezo M, Gil L, Hall P, Hastings E, Junkins H, McMahon A, Milano A and Morales J (2017) The new NHGRI-EBI Catalog of published genome-wide association studies (GWAS Catalog). Nucleic acids research, 45, D896–D901. [DOI] [PMC free article] [PubMed] [Google Scholar]
- 2.Sivakumaran S, Agakov F, Theodoratou E, Prendergast JG, Zgaga L, Manolio T, Rudan I, McKeigue P, Wilson JF and Campbell H (2011) Abundant pleiotropy in human complex diseases and traits. Am J Hum Genet, 89, 607–618. [DOI] [PMC free article] [PubMed] [Google Scholar]
- 3.Cotsapas C, Voight BF, Rossin E, Lage K, Neale BM, Wallace C, Abecasis GR, Barrett JC, Behrens T, Cho J et al. (2011) Pervasive sharing of genetic effects in autoimmune disease. PLoS genetics, 7, e1002254. [DOI] [PMC free article] [PubMed] [Google Scholar]
- 4.Lichtenstein P, Yip BH, Bjork C, Pawitan Y, Cannon TD, Sullivan PF and Hultman CM (2009) Common genetic determinants of schizophrenia and bipolar disorder in Swedish families: a population-based study. Lancet, 373, 234–239. [DOI] [PMC free article] [PubMed] [Google Scholar]
- 5.Gottesman O, Drill E, Lotay V, Bottinger E and Peter I (2012) Can genetic pleiotropy replicate common clinical constellations of cardiovascular disease and risk? PLoS ONE, 7, e46419. [DOI] [PMC free article] [PubMed] [Google Scholar]
- 6.Ligthart S, de Vries PS, Uitterlinden AG, Hofman A, group C.I.w., Franco OH, Chasman DI and Dehghan A (2015) Pleiotropy among Common Genetic Loci Identified for Cardiometabolic Disorders and C-Reactive Protein. PLoS One, 10, e0118859. [DOI] [PMC free article] [PubMed] [Google Scholar]
- 7.Estrada K, Styrkarsdottir U, Evangelou E, Hsu YH, Duncan EL, Ntzani EE, Oei L, Albagha OM, Amin N, Kemp JP et al. (2012) Genome-wide meta-analysis identifies 56 bone mineral density loci and reveals 14 loci associated with risk of fracture. Nature genetics, 44, 491–501. [DOI] [PMC free article] [PubMed] [Google Scholar]
- 8.Pierce BL and Ahsan H (2011) Genome-wide “pleiotropy scan” identifies HNF1A region as a novel pancreatic cancer susceptibility locus. Cancer Res, 71, 4352–4358. [DOI] [PMC free article] [PubMed] [Google Scholar]
- 9.Panagiotou OA, Travis RC, Campa D, Berndt SI, Lindstrom S, Kraft P, Schumacher FR, Siddiq A, Papatheodorou SI, Stanford JL et al. (2015) A genome-wide pleiotropy scan for prostate cancer risk. European urology, 67, 649–657. [DOI] [PMC free article] [PubMed] [Google Scholar]
- 10.Nalls MA, Saad M, Noyce AJ, Keller MF, Schrag A, Bestwick JP, Traynor BJ, Gibbs JR, Hernandez DG, Cookson MR et al. (2014) Genetic comorbidities in Parkinson’s disease. Human molecular genetics, 23, 831–841. [DOI] [PMC free article] [PubMed] [Google Scholar]
- 11.Hui KY, Fernandez-Hernandez H, Hu J, Schaffner A, Pankratz N, Hsu NY, Chuang LS, Carmi S, Villaverde N, Li X et al. (2018) Functional variants in the LRRK2 gene confer shared effects on risk for Crohn’s disease and Parkinson’s disease. Science translational medicine, 10. [DOI] [PMC free article] [PubMed] [Google Scholar]
- 12.Huang J, Johnson AD and O’Donnell CJ (2011) PRIMe: a method for characterization and evaluation of pleiotropic regions from multiple genome-wide association studies. Bioinformatics, 27, 1201–1206. [DOI] [PMC free article] [PubMed] [Google Scholar]
- 13.Pickrell JK, Berisa T, Liu JZ, Segurel L, Tung JY and Hinds DA (2016) Detection and interpretation of shared genetic influences on 42 human traits. Nature genetics, 48, 709–717. [DOI] [PMC free article] [PubMed] [Google Scholar]
- 14.Takagawa T, Kitani A, Fuss I, Levine B, Brant SR, Peter I, Tajima M, Nakamura S and Strober W (2018) An increase in LRRK2 suppresses autophagy and enhances Dectin-1-induced immunity in a mouse model of colitis. Science translational medicine, 10. [DOI] [PMC free article] [PubMed] [Google Scholar]
- 15.Bulik-Sullivan BK, Loh PR, Finucane HK, Ripke S, Yang J, Patterson N, Daly MJ, Price AL and Neale BM (2015) LD Score regression distinguishes confounding from polygenicity in genome-wide association studies. Nature genetics, 47, 291–295. [DOI] [PMC free article] [PubMed] [Google Scholar]
- 16.Luo W, Obeidat M, Di Narzo AF, Chen R, Sin DD, Pare PD and Hao K (2016) Airway Epithelial Expression Quantitative Trait Loci Reveal Genes Underlying Asthma and Other Airway Diseases. American journal of respiratory cell and molecular biology, 54, 177–187. [DOI] [PMC free article] [PubMed] [Google Scholar]
- 17.Zhang J, Peng S, Cheng H, Nomura Y, Di Narzo AF and Hao K (2017) Genetic Pleiotropy between Nicotine Dependence and Respiratory Outcomes. Scientific reports, 7, 16907. [DOI] [PMC free article] [PubMed] [Google Scholar]
- 18.Andreassen OA, Djurovic S, Thompson WK, Schork AJ, Kendler KS, O’Donovan MC, Rujescu D, Werge T, van de Bunt M, Morris AP et al. (2013) Improved detection of common variants associated with schizophrenia by leveraging pleiotropy with cardiovascular-disease risk factors. Am J Hum Genet, 92, 197–209. [DOI] [PMC free article] [PubMed] [Google Scholar]
- 19.Li C, Yang C, Gelernter J and Zhao H (2014) Improving genetic risk prediction by leveraging pleiotropy. Human genetics, 133, 639–650. [DOI] [PMC free article] [PubMed] [Google Scholar]
- 20.Krapohl E, Euesden J, Zabaneh D, Pingault JB, Rimfeld K, von Stumm S, Dale PS, Breen G, O’Reilly PF and Plomin R (2016) Phenome-wide analysis of genome-wide polygenic scores. Molecular psychiatry, 21, 1188–1193. [DOI] [PMC free article] [PubMed] [Google Scholar]
- 21.Bulik-Sullivan B, Finucane HK, Anttila V, Gusev A, Day FR, Loh PR, ReproGen C, Psychiatric Genomics C, Genetic Consortium for Anorexia Nervosa of the Wellcome Trust Case Control, C., Duncan L et al. (2015) An atlas of genetic correlations across human diseases and traits. Nature genetics, 47, 1236–1241. [DOI] [PMC free article] [PubMed] [Google Scholar]
- 22.Socrates A, Bond T, Karhunen V, Auvinen J, Rietveld C, Veijola J, Jarvelin M-R and O’Reilly P (2017) Polygenic risk scores applied to a single cohort reveal pleiotropy among hundreds of human phenotypes. bioRxiv, in press., 203257. [Google Scholar]
- 23.Gratten J and Visscher PM (2016) Genetic pleiotropy in complex traits and diseases: implications for genomic medicine. Genome medicine, 8, 78. [DOI] [PMC free article] [PubMed] [Google Scholar]
- 24.Mailman MD, Feolo M, Jin Y, Kimura M, Tryka K, Bagoutdinov R, Hao L, Kiang A, Paschall J, Phan L et al. (2007) The NCBI dbGaP database of genotypes and phenotypes. Nature genetics, 39, 1181–1186. [DOI] [PMC free article] [PubMed] [Google Scholar]
- 25.Chen EY, Tan CM, Kou Y, Duan Q, Wang Z, Meirelles GV, Clark NR and Ma’ayan A (2013) Enrichr: interactive and collaborative HTML5 gene list enrichment analysis tool. BMC bioinformatics, 14, 128. [DOI] [PMC free article] [PubMed] [Google Scholar]
- 26.Kuleshov MV, Jones MR, Rouillard AD, Fernandez NF, Duan Q, Wang Z, Koplev S, Jenkins SL, Jagodnik KM, Lachmann A et al. (2016) Enrichr: a comprehensive gene set enrichment analysis web server 2016 update. Nucleic acids research, 44, W90–97. [DOI] [PMC free article] [PubMed] [Google Scholar]
- 27.Fox CS, Coady S, Sorlie PD, D’Agostino RB Sr., Pencina MJ, Vasan RS, Meigs JB, Levy D and Savage PJ (2007) Increasing cardiovascular disease burden due to diabetes mellitus: the Framingham Heart Study. Circulation, 115, 1544–1550. [DOI] [PubMed] [Google Scholar]
- 28.Torres J, Mehandru S, Colombel JF and Peyrin-Biroulet L (2017) Crohn’s disease. Lancet, 389, 1741–1755. [DOI] [PubMed] [Google Scholar]
- 29.Sawczenko A, Ballinger AB, Savage MO and Sanderson IR (2006) Clinical features affecting final adult height in patients with pediatric-onset Crohn’s disease. Pediatrics, 118, 124–129. [DOI] [PubMed] [Google Scholar]
- 30.Markowitz J, Grancher K, Rosa J, Aiges H and Daum F (1993) Growth failure in pediatric inflammatory bowel disease. Journal of pediatric gastroenterology and nutrition, 16, 373–380. [DOI] [PubMed] [Google Scholar]
- 31.Harstad EB, Weaver AL, Katusic SK, Colligan RC, Kumar S, Chan E, Voigt RG and Barbaresi WJ (2014) ADHD, stimulant treatment, and growth: a longitudinal study. Pediatrics, 134, e935–e944. [DOI] [PMC free article] [PubMed] [Google Scholar]
- 32.Lee JJ, Escher JC, Shuman MJ, Forbes PW, Delemarre LC, Harr BW, Kruijer M, Moret M, Allende-Richter S and Grand RJ (2010) Final adult height of children with inflammatory bowel disease is predicted by parental height and patient minimum height Z-score. Inflammatory bowel diseases, 16, 1669–1677. [DOI] [PMC free article] [PubMed] [Google Scholar]
- 33.Mouratidou N, Malmborg P, Sachs MC, Askling J, Ekbom A, Neovius M, Smedby KE, Savendahl L, Ludvigsson JF and Olen O (2020) Adult height in patients with childhood-onset inflammatory bowel disease: a nationwide population-based cohort study. Aliment Pharmacol Ther, 51, 789–800. [DOI] [PubMed] [Google Scholar]
- 34.Ballinger AB, Azooz O, El-Haj T, Poole S and Farthing MJ (2000) Growth failure occurs through a decrease in insulin-like growth factor 1 which is independent of undernutrition in a rat model of colitis. Gut, 46, 694–700. [DOI] [PMC free article] [PubMed] [Google Scholar]
- 35.Mauras N, George D, Evans J, Milov D, Abrams S, Rini A, Welch S and Haymond MW (2002) Growth hormone has anabolic effects in glucocorticosteroid-dependent children with inflammatory bowel disease: a pilot study. Metabolism: clinical and experimental, 51, 127–135. [DOI] [PubMed] [Google Scholar]
- 36.Calenda KA, Schornagel IL, Sadeghi-Nejad A and Grand RJ (2005) Effect of recombinant growth hormone treatment on children with Crohn’s disease and short stature: a pilot study. Inflammatory bowel diseases, 11, 435–441. [DOI] [PubMed] [Google Scholar]
- 37.Malik S, Ahmed SF, Wilson ML, Shah N, Loganathan S, Naik S, Bourke B, Thomas A, Akobeng AK, Fagbemi A et al. (2012) The effects of anti-TNF-alpha treatment with adalimumab on growth in children with Crohn’s disease (CD). Journal of Crohn’s & colitis, 6, 337–344. [DOI] [PubMed] [Google Scholar]
- 38.Borrelli O, Bascietto C, Viola F, Bueno de Mesquita M, Barbato M, Mancini V, Bosco S and Cucchiara S (2004) Infliximab heals intestinal inflammatory lesions and restores growth in children with Crohn’s disease. Digestive and liver disease : official journal of the Italian Society of Gastroenterology and the Italian Association for the Study of the Liver, 36, 342–347. [DOI] [PubMed] [Google Scholar]
- 39.Jostins L, Ripke S, Weersma RK, Duerr RH, McGovern DP, Hui KY, Lee JC, Schumm LP, Sharma Y, Anderson CA et al. (2012) Host-microbe interactions have shaped the genetic architecture of inflammatory bowel disease. Nature, 491, 119–124. [DOI] [PMC free article] [PubMed] [Google Scholar]
- 40.Silverstein MD, Yunginger JW, Reed CE, Petterson T, Zimmerman D, Li JT and O’Fallon WM (1997) Attained adult height after childhood asthma: effect of glucocorticoid therapy. J Allergy Clin Immunol, 99, 466–474. [DOI] [PubMed] [Google Scholar]
- 41.Wang SJ, Yang YH, Lin YT, Yang CM and Chiang BL (2002) Attained adult height in juvenile rheumatoid arthritis with or without corticosteroid treatment. Clin Rheumatol, 21, 363–368. [DOI] [PubMed] [Google Scholar]
- 42.Esmaeilzadeh A, Ganji A, Goshayeshi L, Ghafarzadegan K, Afzal Aghayee M, Mosanen Mozafari H, Saadatniya H, Hayatbakhs A and Ghavami Ghanbarabadi V (2016) Adult Celiac Disease: Patients Are Shorter Compared with Their Peers in the General Population. Middle East J Dig Dis, 8, 303–309. [DOI] [PMC free article] [PubMed] [Google Scholar]
- 43.Parnanen A, Kaukinen K, Helakorpi S, Uutela A, Lahdeaho ML, Huhtala H, Collin P, Maki M and Kurppa K (2012) Symptom-detected and screen-detected celiac disease and adult height: a large cohort study. European journal of gastroenterology & hepatology, 24, 1066–1070. [DOI] [PubMed] [Google Scholar]
- 44.Weiss B, Skourikhin Y, Modan-Moses D, Broide E, Fradkin A and Bujanover Y (2008) Is adult height of patients with celiac disease influenced by delayed diagnosis? Am J Gastroenterol, 103, 1770–1774. [DOI] [PubMed] [Google Scholar]
- 45.Grasemann C, Unger N, Hovel M, Arweiler-Harbeck D, Herrmann R, Schundeln MM, Muller O, Schweiger B, Lausch E, Meissner T et al. (2017) Loss of Functional Osteoprotegerin: More Than a Skeletal Problem. J Clin Endocrinol Metab, 102, 210–219. [DOI] [PubMed] [Google Scholar]
- 46.de Lange KM, Moutsianas L, Lee JC, Lamb CA, Luo Y, Kennedy NA, Jostins L, Rice DL, Gutierrez-Achury J, Ji SG et al. (2017) Genome-wide association study implicates immune activation of multiple integrin genes in inflammatory bowel disease. Nat Genet, 49, 256–261. [DOI] [PMC free article] [PubMed] [Google Scholar]
- 47.Okada Y, Wu D, Trynka G, Raj T, Terao C, Ikari K, Kochi Y, Ohmura K, Suzuki A, Yoshida S et al. (2014) Genetics of rheumatoid arthritis contributes to biology and drug discovery. Nature, 506, 376–381. [DOI] [PMC free article] [PubMed] [Google Scholar]
- 48.Moffatt MF, Gut IG, Demenais F, Strachan DP, Bouzigon E, Heath S, von Mutius E, Farrall M, Lathrop M, Cookson W et al. (2010) A large-scale, consortium-based genomewide association study of asthma. N Engl J Med, 363, 1211–1221. [DOI] [PMC free article] [PubMed] [Google Scholar]
- 49.Dubois PC, Trynka G, Franke L, Hunt KA, Romanos J, Curtotti A, Zhernakova A, Heap GA, Adany R, Aromaa A et al. (2010) Multiple common variants for celiac disease influencing immune gene expression. Nat Genet, 42, 295–302. [DOI] [PMC free article] [PubMed] [Google Scholar]
- 50.Nelson CP, Hamby SE, Saleheen D, Hopewell JC, Zeng L, Assimes TL, Kanoni S, Willenborg C, Burgess S, Amouyel P et al. (2015) Genetically Determined Height and Coronary Artery Disease. New England Journal of Medicine, 372, 1608–1618. [DOI] [PMC free article] [PubMed] [Google Scholar]
- 51.Jelenkovic A, Bogl LH, Rose RJ, Kangas AJ, Soininen P, Ala-Korpela M, Kaprio J and Silventoinen K (2013) Association of Height and Pubertal Timing with Lipoprotein Subclass Profile: Exploring the Role of Genetic and Environmental Effects. American journal of human biology : the official journal of the Human Biology Council, 25, 465–472. [DOI] [PMC free article] [PubMed] [Google Scholar]
- 52.Sousa AG, Selvatici L, Krieger JE and Pereira AC (2011) Association Between Genetics of Diabetes, Coronary Artery Disease, and Macrovascular Complications: Exploring a Common Ground Hypothesis. The Review of Diabetic Studies : RDS, 8, 230–244. [DOI] [PMC free article] [PubMed] [Google Scholar]
- 53.Shea J, Agarwala V, Philippakis AA, Maguire J, Banks E, DePristo M, Thomson B, Guiducci C, Onofrio RC, The Myocardial Infarction Genetics, C. et al. (2011) Comparing strategies to fine-map the association of common SNPs at chromosome 9p21 with type 2 diabetes and myocardial infarction. Nature genetics, 43, 801. [DOI] [PMC free article] [PubMed] [Google Scholar]
- 54.Watkins H and Farrall M (2006) Genetic susceptibility to coronary artery disease: from promise to progress. Nature Reviews Genetics, 7, 163. [DOI] [PubMed] [Google Scholar]
- 55.Helgadottir A, Gretarsdottir S, Thorleifsson G, Hjartarson E, Sigurdsson A, Magnusdottir A, Jonasdottir A, Kristjansson H, Sulem P, Oddsson A et al. (2016) Variants with large effects on blood lipids and the role of cholesterol and triglycerides in coronary disease. Nature genetics, 48, 634. [DOI] [PMC free article] [PubMed] [Google Scholar]
- 56.Dai X, Wiernek S, Evans JP and Runge MS (2016) Genetics of coronary artery disease and myocardial infarction. World Journal of Cardiology, 8, 1–23. [DOI] [PMC free article] [PubMed] [Google Scholar]
- 57.TG T, HDL Working Group of the Exome Sequencing Project, N.H., Lung, and Institute, B. (2014) Loss-of-Function Mutations in APOC3, Triglycerides, and Coronary Disease. New England Journal of Medicine, 371, 22–31. [DOI] [PMC free article] [PubMed] [Google Scholar]
- 58.Klimentidis YC, Chougule A, Arora A, Frazier-Wood AC and Hsu C-H (2015) Triglyceride-Increasing Alleles Associated with Protection against Type-2 Diabetes. PLoS genetics, 11, e1005204. [DOI] [PMC free article] [PubMed] [Google Scholar]
- 59.Gong S, Xu C, Wang L, Liu Y, Owusu D, Bailey BA, Li Y and Wang K (2017) Genetic association analysis of polymorphisms in PSD3 gene with obesity, type 2 diabetes, and HDL cholesterol. Diabetes research and clinical practice, 126, 105–114. [DOI] [PubMed] [Google Scholar]
- 60.Goodarzi MO Genetics of obesity: what genetic association studies have taught us about the biology of obesity and its complications. The Lancet Diabetes & Endocrinology, in press. [DOI] [PubMed] [Google Scholar]
- 61.Liang H, Vallarino C, Joseph G, Manne S, Perez A and Zhang S (2014) Increased risk of subsequent myocardial infarction in patients with type 2 diabetes: a retrospective cohort study using the U.K. General Practice Research Database. Diabetes care, 37, 1329–1337. [DOI] [PubMed] [Google Scholar]
- 62.Deng Y and Pan W (2017) Testing Genetic Pleiotropy with GWAS Summary Statistics for Marginal and Conditional Analyses. Genetics, 207, 1285–1299. [DOI] [PMC free article] [PubMed] [Google Scholar]
- 63.Mills MC and Rahal C (2019) A scientometric review of genome-wide association studies. Communications biology, 2, 9. [DOI] [PMC free article] [PubMed] [Google Scholar]
- 64.Duncan L, Shen H, Gelaye B, Meijsen J, Ressler K, Feldman M, Peterson R and Domingue B (2019) Analysis of polygenic risk score usage and performance in diverse human populations. Nature communications, 10, 3328. [DOI] [PMC free article] [PubMed] [Google Scholar]
- 65.Purcell S, Neale B, Todd-Brown K, Thomas L, Ferreira MA, Bender D, Maller J, Sklar P, de Bakker PI, Daly MJ et al. (2007) PLINK: a tool set for whole-genome association and population-based linkage analyses. Am J Hum Genet, 81, 559–575. [DOI] [PMC free article] [PubMed] [Google Scholar]
- 66.Howie B, Fuchsberger C, Stephens M, Marchini J and Abecasis GR (2012) Fast and accurate genotype imputation in genome-wide association studies through pre-phasing. Nature genetics, 44, 955–959. [DOI] [PMC free article] [PubMed] [Google Scholar]
- 67.Price AL, Patterson NJ, Plenge RM, Weinblatt ME, Shadick NA and Reich D (2006) Principal components analysis corrects for stratification in genome-wide association studies. Nature genetics, 38, 904–909. [DOI] [PubMed] [Google Scholar]
- 68.Genomes Project C, Auton A, Brooks LD, Durbin RM, Garrison EP, Kang HM, Korbel JO, Marchini JL, McCarthy S, McVean GA et al. (2015) A global reference for human genetic variation. Nature, 526, 68–74. [DOI] [PMC free article] [PubMed] [Google Scholar]
- 69.Schwarzer G (2007) Meta: An R package for meta-analysis. R news, 7, 40–45. [Google Scholar]
- 70.Sudlow C, Gallacher J, Allen N, Beral V, Burton P, Danesh J, Downey P, Elliott P, Green J, Landray M et al. (2015) UK biobank: an open access resource for identifying the causes of a wide range of complex diseases of middle and old age. PLoS Med, 12, e1001779. [DOI] [PMC free article] [PubMed] [Google Scholar]
- 71.Liberzon A, Birger C, Thorvaldsdottir H, Ghandi M, Mesirov JP and Tamayo P (2015) The Molecular Signatures Database (MSigDB) hallmark gene set collection. Cell systems, 1, 417–425. [DOI] [PMC free article] [PubMed] [Google Scholar]
- 72.Benjamini Y and Hochberg A (1995) Controlling the False Discovery Rate: A Practical and Powerful Approach to Multiple Testing Journal of the Royal Statistical Society, 57, 289–300. [Google Scholar]
Associated Data
This section collects any data citations, data availability statements, or supplementary materials included in this article.