

SUMMARY
Understanding the mechanisms underlying how T cells become dysfunctional in tumor microenvironment (TME) will greatly benefit cancer immunotherapy. We found that increased CD36 expression in tumor-infiltrating CD8+ T cells, which was induced by TME-cholesterol, was associated with tumor progression and poor survival in human and murine cancers. Genetic ablation of Cd36 in effector CD8+ T cells exhibited increased cytotoxic cytokine production and enhanced tumor eradication. CD36 mediated uptake of fatty acid by tumor-infiltrating CD8+ T cells in TME, induced lipid peroxidation and ferroptosis, and led to reduced cytotoxic cytokine production and impaired antitumor ability. Blocking CD36 or inhibiting ferroptosis in CD8+ T cells effectively restored their antitumor activity and more importantly, possessed greater antitumor efficacy in combination with anti-PD-1 antibodies. This study reveals a new mechanism of CD36 regulating the function of CD8+ effector T cells and therapeutic potential of targeting CD36 or inhibiting ferroptosis to restore T cell function.
eTOC blurb
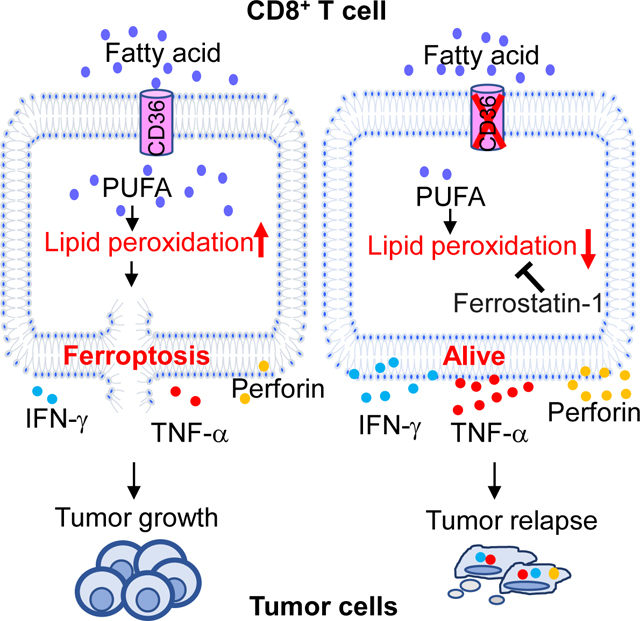
Ma et al. identified that fatty acid in the tumor microenvironment induces CD8+ T-cell ferroptosis in a CD36-dependent manner. Reducing CD36 expression or ferroptosis on CD8+ T cells enhanced CD8+ T-cell anti-tumor function, highlighting potential targets that can be therapeutically exploited.
Graphical Abstract
INTRODUCTION
Cancer immunotherapy using immune checkpoint inhibitors (ICB) to enhance endogenous antitumor responses and administration of specific antitumor immune cells via adoptive cell therapy have achieved unprecedented success in the treatment of multiple malignancies(Met et al., 2019). However, taking melanoma patients as an example, despite recent successes in obtaining objective clinical responses, such benefits are typically short, with durable complete responses observed in only 5% −15% of treated patients(Wolchok et al., 2010). One of the major problems is that CD8+ T cells become dysfunctional when encountering the immunosuppressive tumor microenvironment (TME)(Joyce and Fearon, 2015, Mohamed et al., 2018).
The immunosuppressive signals in TME include but are not limited to the expression of inhibitory ligands, suppressive soluble mediator gradients, metabolic factors and suppressive compounds(Zarour, 2016, Thommen and Schumacher, 2018, Gajewski et al., 2013, Speiser et al., 2016). These signals shape the dysfunctional state of tumor-infiltrating T cells by influencing the expression of inhibitory receptors, changing metabolic pathways .etc. However, both the multifaceted suppressive signals and their accompanied consequences remain incompletely understood.
Metabolism is the driving force that shapes the extent and nature of T-cell differentiation, function and fate(Chang and Pearce, 2016). Emerging evidence highlights the importance of maintaining T cell metabolic fitness in securing the functional state of T cells(Almeida et al., 2016). Our group previously showed that regulation of cholesterol metabolism enhances the function of CD8+ T cells(Ma et al., 2019). We reported that cholesterol inhibits IL-9-producing CD8+ T (Tc9) cell differentiation and antitumor activity, and reducing cholesterol significantly increases Tc9 antitumor response(Ma et al., 2018). We also showed that cholesterol in TME induces CD8+ T cell functional exhaustion, and inhibition of cholesterol metabolism enhances CD8+ T cell antitumor function(Ma et al., 2019, Ma and Yi, 2019).
CD36 is a scavenger receptor that functions in lipid metabolism and has been reported to be involved in angiogenesis, inflammatory responses, atherothrombotic diseases as well as metabolic disorders such as diabetes and obesity(Silverstein and Febbraio, 2009). In immune system, CD36 has been reported to mediate dendritic cell antigen acquisition and presentation(Tagliani et al., 2008, Perry et al., 2018), and support regulatory T cell function(Wang et al., 2020). However, little is known about its role in CD8+ T cells. In this study, we showed that CD8+ T cells lost their antitumor effector function in TME by uptaking fatty acid through CD36, which induced ferroptosis and resulted in decreased cytotoxic cytokine production in the cells. Inhibition of CD36-mediated ferroptosis, and also in combination with ICB greatly enhanced the antitumor effects of CD8+ T cells.
RESULTS
CD36 expression on tumor-infiltrating CD8+ T cells is associated with tumor progression and poor survival in human cancers
We have been studying lipid metabolism in T cells(Ma et al., 2018, Ma et al., 2019). When we were analyzing melanoma patient-derived tumor-infiltrating CD8+ T cells(Sade-Feldman et al., 2019) using Ingenuity Pathway Analysis (IPA) canonical pathway analysis, we found that tumor-infiltrating CD8+ T cells from long-survival patients had significantly upregulated LXR/RXR and PPARα/RXRα and downregulated TREM1 signaling pathways (Fig. 1A). When we looked into LXR/RXR and PPARα/RXRα signaling pathways, we found that in both pathways, CD36, which is a downstream molecule of these two pathways, was downregulated (Fig. S1A and S1B). TREM-1 signaling was reported to exacerbate atherosclerosis and upregulate CD36 expression(Zysset et al., 2016). Thus, downregulated TREM-1 signaling suggests decreased CD36 expression. In addition, we analyzed RNAseq data of melanoma patients with response or no response to PD-1 treatment(Hugo et al., 2017). We found that PD-1 responding patients showed the most significant upregulation of the LXR/RXR activation signaling pathway compared to non-responders (Fig. S1C), and CD36 was downregulated in this pathway (Fig. S1D). PD-1 responders had higher CD8+ T cell infiltration than PD-1 non-responders(Tumeh et al., 2014). These findings suggest a negative correlation between the expression of CD36 and patient outcome.
Figure 1. Increased CD36 expression on tumor-infiltrating CD8+ T cells is associated with tumor progression and poor survival in human and murine cancers.

(A) IPA analysis of canonical pathway changes and (B) CD36 expression in tumor-infiltrating CD8+ T cells from long- and short-survival melanoma patients. (C) CD8+ T cells from MM and MGUS patient’s bone marrow analyzed for the expression of CD36. (D) CD36 expression of CD8+ T cells from MM patient’s bone marrow and blood. (E) Tumor volume of the mice and CD36 expression on tumor-infiltrating CD8+ T cells at days 7 and 14 after tumor injection. (F) Tumor burden of the mice and CD36 expression on tumor-infiltrating CD8+ T cells after Vk*MYC MM cell injection. (G and H) CD36 expression on cultured CD8+ T cells with tumor tissue (20 or 50 μl at 1 mg/ml), βCD, or cholesterol treatment. (I and J) Tumor growth curves, tumor burden at week 3, and survival of B16 bearing WT and CD36−/− B6 mice. (K and L) WT and CD36−/− B6 mice were injected with anti-CD8 antibodies 1 day before B16 tumor injection and every 3 days for a total of 5 injections. Tumor growth curves, tumor volumes at week 4, and mouse survival are shown. Differences in survival curves between the groups were analyzed by log-rank (Mantel–Cox) test. Data are presented as mean ± SEM. *p < 0.05; **p < 0.01; ***p < 0.001. See also Figure S1.
By further analyzing lipid metabolism-related gene expression in patient-derived tumor-infiltrating CD8+ T cells, we found that melanoma patients with long survival had lower CD36 expression on the cells compared to cells from short survival patients (Fig. 1B). Similar phenomenon was found in multiple myeloma (MM) patients. We collected bone marrow samples from patients with MM or monoclonal gammopathy of undetermined significance (MGUS), a precursor to MM(Ocqueteau et al., 1998). MGUS patients had a much higher survival probability than MM patients(Fagerberg et al., 1999, Yi et al., 1997). We found that tumor-infiltrating CD8+ T cells from MGUS patients had lower CD36 expression compared with the cells from MM patients (Fig. 1C). We also found that in non-small-cell lung cancer patients(Guo et al., 2018), tumor-infiltrating CD8+ T cells had higher CD36 expression compared to CD8+ T cells from normal adjacent tissue (Fig. S1E). Furthermore, by analyzing MM patient’s bone marrow (tumor bed) and peripheral blood, we found that tumor-infiltrating CD8+ T cells had higher CD36 expression than CD8+ T cells from peripheral blood (Fig. 1D). When staining PBMC and MGUS or MM patients’ tumor-infiltrating CD8+ T cells with CCR7 and CD45RA antibodies, these cells can be separated into four populations; central memory, naive, effector memory and terminally differentiated effector CD8+ T cells. By comparing the effector memory population in PBMC and in MGUS or MM tumor-infiltrating CD8+ T cells, we found that T cells from MM patients had higher CD36 expression compared to T cells from MGUS patients, and T cells from MGUS patients had higher CD36 expression than those in PBMC (Fig. S1F). Thus, these results demonstrate that cancer patient’s tumor-infiltrating CD8+ T cells have an increased CD36 expression compared to T cells in normal tissues and patients with low CD36 expression on tumor-infiltrating CD8+ T cells have better prognosis.
CD36 expression on tumor-infiltrating CD8+ T cells is upregulated with tumor progression and CD36 deficiency results in better antitumor response in murine cancers
We used mouse melanoma model B16 and mouse MM model Vk*MYC to determine the expression and role of CD36 on tumor-infiltrating CD8+ T cells. In B16 tumors, tumor volume increased from week 1 to week 2 after tumor inoculation (Fig. 1E). In Vk*MYC tumors, the intensity of M-spike (MM secreted IgG protein, surrogate for tumor burden) bands increased from week 3 to week 4 (Fig. 1F). As tumors progressed, we examined CD36 expression on tumor-infiltrating T cells at different time points. Tumor-infiltrating CD8+ T cells from 2-week B16 tumors had higher CD36 expression than those from 1-week B16 tumors (Fig. 1E), whereas the expression of CD36 on CD4+ T cells at different time points was not changed (Fig. S1G). Similarly, tumor-infiltrating CD8+ T cells from 4-week Vk*MYC tumors had higher CD36 expression than those from 3-week Vk*MYC tumors (Fig. 1F). These results indicate that in mouse tumor models, CD36 expression on tumor-infiltrating CD8+ T cells increases as tumors establish and is positively associated with tumor progression.
Next, we sought to determine the mechanisms underlying CD36 upregulation in tumor-infiltrating CD8+ T cells. Previously, we found that TME was accumulated with cholesterol(Ma et al., 2019). To determine whether cholesterol in TME is responsible for upregulated CD36 expression on tumor-infiltrating CD8+ T cells, we used βCD (β-cyclodextrin) to deplete cholesterol in TME. We found that untreated tumors, but not cholesterol depleted tumors, induced CD36 expression on CD8+ T cells (Fig. 1G). Moreover, cholesterol directly induced CD36 expression on CD8+ T cells (Fig. 1H) and MM patients’ bone marrow had higher cholesterol compared to those of MGUS patients (Fig. S1H). These results indicate that cholesterol in TME upregulates CD36 expression on CD8+ T cells.
To determine whether CD36 expression on CD8+ T cells affects their antitumor function, we used wildtype (WT) and CD36-deficient (CD36−/−) mice with or without CD8+ T cell depletion. B16 tumors grew slower in CD36−/− mice as compared with WT mice, and tumor-bearing CD36−/− mice survived longer than WT mice (Fig. 1I and 1J). However, when CD8+ T cells were depleted in these mice, the difference in tumor growth and mouse survival between WT and CD36−/− mice disappeared (Fig. 1K and 1L). These results suggest that CD36−/− CD8+ T cells have stronger antitumor function than CD36+ CD8+ T cells in vivo.
CD36 expression is associated with decreased cytotoxic cytokine production and impaired antitumor activity in human and murine CD8+ T cells
To determine why CD36 expression on CD8+ T cells is associated with dampened antitumor function and poor prognosis, we analyzed the relationship between CD36 and cytotoxic cytokine-associated gene expressions in tumor-infiltrating CD8+ T cells in melanoma patients. Results showed that the expression of CD36 on tumor-infiltrating CD8+ T cells was negatively associated with expression of many cytotoxic cytokine-related genes and also with their transcription factors, such as IFNG, PRF1, GZMB, and TBX21 (Fig. 2A).
Figure 2. CD36 expression decreases cytotoxic cytokine production and impairs antitumor function of human and murine CD8+ T cells.

(A) Correlation between CD36 and cytotoxic cytokine expressions in melanoma patient’s tumor-infiltrating CD8+ T cells. (B) Expression of IFNγ and TNFα by tumor-infiltrating CD8+ T cells at days 7 and 14 after B16 tumor injection. (C-E) Tumor-infiltrating (C), spleen (D), draining lymph node and lymph node (E) CD8+ T cells were analyzed for the expression of IFNγ or TNFα at day 14 after tumor injection in WT and CD36−/− B6 mice. (F-H) Tumor-infiltrating lung (F), spleen (G), draining lymph node and lymph node (H) CD8+ T cells were analyzed for the expression of IFNγ and TNFα at day 14 after tumor injection in WT and CD36−/− B6 mice. (I) Tumor foci in the lung were counted after 2 weeks of B16 tumor injection in WT and CD36−/− B6 mice. (J) Expression of IFNγ and TNFα at day 28 by tumor-infiltrating CD8+ T cells after Vk*MYC cell injection in WT or CD36−/− B6 mice. (K) Tumor development at day 28 in WT and CD36−/− B6 mice after Vk*MYC cell injection. (L) At day 16 after lung B16 tumor inoculation, adoptively transferred WT or CD36−/− CD8+ Pmel-1 T cells in tumor, lymph nodes, and spleen were analyzed for IFNγ expression. (M) Adoptively transferred WT or CD36−/− CD8+ Pmel-1 T cells in s.c. B16 tumor were analyzed for IFNγ and TNFα expression at day 17 after tumor inoculation. (N) B16 tumor burden and survival of mice treated with WT or CD36−/− CD8+ Pmel-1 T cells. Data are presented as mean ± SEM. *p < 0.05; **p < 0.01; ***p < 0.001. See also Figure S2.
We then examined tumor-infiltrating CD8+ T cells from 1-week and 2-week subcutaneously (s.c.) grown B16 tumors. We found that 2-week tumor-infiltrating CD8+ T cells had lower IFNγ and TNFα production (Fig. 2B) as compared with T cells from 1-week tumor. In addition, we also found that 2-week tumor-infiltrating CD8+ T cells had lower Ki67 expression compared to T cells from 1-week tumor, suggesting that 2-week tumor-infiltrating CD8+ T cells are less proliferative compared to 1-week tumor-infiltrating T cells (Fig. S2A). These results indicate that CD36 expression on CD8+ T cells is positively associated with tumor progression and negatively associated with T cell cytotoxic cytokine production and proliferation.
We then examined T cell IFNγ and TNFα production from s.c. grown B16 tumors in WT and CD36−/− mice. We found that tumor-infiltrating CD8+ T cells from CD36−/− mice had higher IFNγ and TNFα production and higher proliferation rate compared to T cells from WT mice (Fig. 2C and S2B), suggesting that intratumoral CD8+ T cells from tumor-bearing CD36−/− mice have stronger effector function than those from tumor-bearing WT mice. These results are in line with our findings that B16 tumors grew slower in CD36−/− mice compared to WT mice (Fig. 1I). In vitro differentiated CD36−/− CD8+ T cells had slightly higher or similar expression of IFNγ, TNFα Gzmb and perforin compared to WT CD8+ T cells under a cytotoxic T cell differentiation condition (Fig. S2D). In addition, CD8+ T cells from tumor bearing mice had higher IFNγ or TNFα production compared to T cells from tumor free mice (Fig. S2C). CD8+ T cells from spleen (Fig. 2D), draining lymph node, and lymph node (Fig. 2E) of tumor-bearing CD36−/− mice also had higher IFNγ or TNFα production compared to T cells from same organs of tumor-bearing WT mice.
Moreover, we examined IFNγ TNF α Gzmb, and perforin production in CD4 + T cells and observed that IFNγ and TNFα, but not Gzmb or perforin, production was slightly increased in splenic, but not in tumor-infiltrating, CD4+ T cells from CD36−/− mice compared to cells from WT mice (Fig. S2E, S2F and S2G), indicating that CD36 deficiency mainly affects CD8+ but not CD4+ effector cell function.
To confirm our results, we studied T cells in B16 lung metastasis tumor model. Consistent with the results of s.c. grown B16 tumors, CD8+ T cells from lung (tumor bed), spleen, draining lymph node, and lymph node of tumor-bearing CD36−/− mice had higher IFNγ and TNFα production compared to T cells from same organs of tumor-bearing WT mice (Fig. 2F–H). These results suggest that CD8+ T cells from lung tumor-bearing CD36−/− mice have stronger effector function than T cells from tumor-bearing WT mice. Consequently, we found that there were fewer tumor foci in the lung of CD36−/− mice compared to WT mice (Fig. 2I). Our results also showed that tumor-infiltrating CD8+ T cells from bone marrow of Vk*MYC MM-bearing CD36−/− mice had higher IFNγ and TNFα production compared to T cells from bone marrow of tumor-bearing WT mice (Fig. 2J). Again, we observed smaller tumor burdens, detected as percentage of CD138+ MM cells in the bone marrow (Fig. 2K) and intensity of M-spike bands (Fig. S2H), in Vk*MYC MM-bearing CD36−/− mice compared to WT mice. These results indicate that CD36 expression on CD8+ T cells impairs their cytotoxic cytokine production and dampens their antitumor function.
To further confirm our results, we adoptively transferred tumor-specific T cells into both B16 lung metastasis and s.c. grown B16 tumor models. Adoptively transferred Pmel-1 CD36−/− CD8+ T cells had higher IFNγ production in lung, spleen and lymph node of B16 lung tumor-bearing mice compared to Pmel-1 WT CD8+ T cells (Fig. 2L). Similar phenomenon was observed in s.c. grown B16 tumors. Adoptively transferred tumor-infiltrating CD36−/− Pmel-1 CD8+ T cells not only had higher IFNγ and TNFα production (Fig. 2M) but also exerted a better antitumor function and prolonged mouse survival (Fig. 2N) in comparison with WT Pmel-1 CD8+ T cells. These results indicate that reduced CD36 expression on CD8+ T cells increases their cytotoxic cytokine production and enhances their antitumor activity in vivo.
CD36 expression is associated with activation of lipid peroxidation and ferroptosis in murine and human tumor-infiltrating CD8+ T cells
To elucidate the mechanism underlying CD36-mediated inhibition of cytotoxic cytokine production in CD8+ T cells, we analyzed RNAseq data of endogenous lung metastasis B16 tumor-infiltrating CD8+ T cells from WT and CD36−/− mice. Using IPA to analyze all canonical pathways that show changes between CD36−/− and WT CD8+ T cells, we found that, among the most significantly changed pathways, sirtuin pathway was activated and oxidative phosphorylation pathway was downregulated (Fig. 3A). Sirtuin pathway protects cells from oxidative stress and has a complex interplay between reactive oxygen species (ROS)(Verdin et al., 2010, Singh et al., 2018). Oxidative phosphorylation pathway is essential for cell energy metabolism and can produce ROS and cause oxidative damage(Hroudova and Fisar, 2013, Guo et al., 2013). The results showed that CD36−/− CD8+ T cells had a lower expression of genes associated with oxidative stress and ROS production than WT CD8+ T cells. Moreover, using pathway enrichment analysis focusing on metabolism-associated pathways, we found that, compared to WT CD8+ T cells, CD36−/− CD8+ T cells, while displaying gene expression patterns associated with a reduced oxidative stress response, lower response to ROS and fewer cell death in response to oxidative stress, also had enhanced gene expression patterns associated with lipid homeostasis and metabolic processes (Fig. 3B). Thus, these findings suggest that CD36−/− CD8+ T cells may have lower oxidative stress, reduced ROS production, and fewer oxidative stress-induced cell death in comparison with WT CD8+ T cells.
Figure 3. CD36 regulates transcriptional and metabolic programs, including lipid peroxidation, in tumor-infiltrating human and murine CD8+ T cells.

(A and B) Pathway analysis of changes between tumor-infiltrating CD36−/− CD8+ and WT CD8+ T cells. (C) Heatmap and (D) gene-set enrichment analysis of lipid peroxidation- and ferroptosis-related genes. (E-G) Single cell sequencing analysis of signaling pathway (E), gene set enrichment (F) and gene expression of melanoma patient’s tumor-infiltrating CD8+ T cells (G). (H-K) Tumor-infiltrating CD8+ T cells from WT or CD36−/− mice were analyzed for lipid peroxidation (H), cell death (I), iron (J) and cytosolic ROS (K) 2 weeks after tumor inoculation. Data are presented as mean ± SEM. **p < 0.01; ***p < 0.001. See also Figure S3 and Table S1.
Lipid peroxidation, a process by which lipids are attacked by oxidants, can be induced by oxidative stress and ROS(Ayala et al., 2014). Based on the results of above multiple pathway analysis, we speculated that CD36−/− CD8+ T cells may have a lower lipid peroxidation than WT CD8+ T cells. As ferroptosis is a type of cell death caused by lipid peroxidation(Yang and Stockwell, 2016), we thus hypothesized that CD36−/− CD8+ T cells have lower ferroptosis level than WT CD8+ T cells. Indeed, gene expression analysis of RNAseq data of B16 tumor-infiltrating CD8+ T cells showed that CD36−/− CD8+ T cells had lower expression of genes associated with lipid peroxidation or ferroptosis activation, while at the same time had higher expression of genes(Yang et al., 2014) associated with lipid peroxidation or ferroptosis inhibition (Fig. 3C and Table S1) in comparison with WT CD8+ T cells. Similar gene expression patterns were observed in CD8+ T cells from spleen of B16 tumor-bearing WT and CD36−/− mice (Fig. S3A). Genes associated with lipid peroxidation or ferroptosis activation were less enriched in tumor-infiltrating CD8+ T cells from CD36−/− mice compared to T cells from WT mice (Fig. 3D). Moreover, tumor-infiltrating CD8+ T cells from CD36−/− mice had higher expression of genes associated with cytotoxicity of T cells, such as Ifng and Prf1 (Fig. S3B), which is consistent with our results in Fig. 2. These results clearly show that CD36−/− CD8+ T cells have a reduced expression of genes associated with the activation of lipid peroxidation and ferroptosis than WT CD8+ T cells.
To confirm the clinical relevance of our results, we analyzed single cell sequencing data of melanoma patient tumor-infiltrating CD8+ T cells(Sade-Feldman et al., 2019). Similarly to what we observed in mouse tumor-infiltrating CD8+ T cells, we found that patient tumor-infiltrating CD36high CD8+ T cells had higher activation of signaling pathways involved in cellular response to ROS and oxidative stress, and also had higher activation of cell death in response to oxidative stress compared to tumor-infiltrating CD36low CD8+ T cells (Fig. 3E). Gene expression enrichment analysis showed that genes associated with lipid peroxidation or ferroptosis activation(Yang et al., 2014) were enriched in patient tumor-infiltrating CD36high CD8+ T cells compared to CD36low CD8+ T cells (Fig. 3F–G). In addition, tumor-infiltrating CD36high CD8+ T cells had a lower expression of genes associated with cytotoxicity of T cells, such as IFNG and PRF1 (Fig. 3G), than tumor-infiltrating CD36low T cells. These results suggest that patient-derived intratumoral CD36high CD8+ T cells possess gene expression patterns associated with higher levels of lipid peroxidation and ferroptosis and reduced cytotoxicity function compared to CD36low CD8+ T cells.
We used a lipid peroxidation assay kit and cell death ratio to evaluate the level of ferroptosis in the cells. The sensor in the lipid peroxidation kit changes its fluorescence from PE to FITC upon peroxidation by lipid ROS in cells, thus enabling ratiometric measurement of lipid peroxidation. As the ratio of PE/FITC drops, the level of lipid peroxidation increases. We found that tumor-infiltrating CD8+ T cells from CD36−/− mice had lower lipid peroxidation (Fig. 3H), lower cell death ratio (Fig. 3I), lower iron level (higher fluorescence intensity means lower iron level) (Fig. 3J), and lower cytosolic ROS level (Fig. 3K) compared to T cells from WT mice. These results demonstrate that tumor-infiltrating CD8+ T cells from CD36−/− mice have less ferroptosis than cells from WT mice. We also found that adoptively transferred tumor-infiltrating Pmel-1 CD36−/− CD8+ T cells had lower lipid peroxidation, lower cell death ratio, lower cytosolic ROS level, and lower iron level compared to Pmel-1 WT CD8+ T cells in both lung (Fig. S3C–F) and s.c. grown B16 tumor models (Fig. S3G–J).
CD36-mediated ferroptosis is responsible for reduced production of cytotoxic cytokines in both murine and human CD8+ T cells
To determine whether CD36-mediated ferroptosis is required for decreased cytotoxic cytokine production in CD8+ T cells, we first analyzed lipid peroxidation in s.c. grown B16 tumor-infiltrating CD8+ T cells. We separated tumor-infiltrating CD8+ T cells into CD36high and CD36low populations and observed that tumor-infiltrating CD36high CD8+ T cells had much higher lipid peroxidation and ferroptosis than CD36low CD8+ T cells (Fig. 4A, 4B and S4A). Second, we analyzed tumor-infiltrating CD8+ T cells from 1-week and 2-week s.c. grown B16 tumors, and found that 2-week tumor-infiltrating CD8+ T cells with high CD36 expression in Fig. 1E had significantly higher lipid peroxidation and ferroptosis level compared to T cells from 1-week tumor (Fig. 4C and 4D). Moreover, B16 tumor-infiltrating CD8+ T cells had higher levels of CD36 expression, lipid peroxidation, cell death, iron and cytosolic ROS compared to splenic CD8+ T cells (Fig. 4E–G and S4B). These results show that CD36 expression on CD8+ T cells is positively associated with their ferroptosis induction in TME. Furthermore, we treated in vitro differentiated CD8+ T cells with B16 tumor. Culture of CD8+ T cells in the presence of tumor significantly upregulated CD36 expression and induced lipid peroxidation (Fig. 4H, 4I), and inhibited IFNγ and TNFα production in the T cells (Fig. 4J).
Figure 4. CD36 mediates ferroptosis and reduces cytotoxic cytokine production in human and murine CD8+ T cells.

(A and B) Tumor-infiltrating CD8+ T cells were analyzed for CD36 expression, lipid peroxidation and 7-AAD 12 days after tumor inoculation. (C-F) Tumor-infiltrating CD8+ T cells were analyzed for lipid peroxidation and cell death at days 7 and 14 after tumor injection (C and D). Spleen and tumor-infiltrating CD8+ T cells were analyzed for CD36 expression (E), lipid peroxidation (F) and cell death (G) at day 14 after tumor injection. (H-J) Cultured CD8+ T cells were treated with tumor tissue (50 μl at 1 mg/ml) for 1 day before analyzed for CD36 expression (H), lipid peroxidation (I), and IFNγ or TNFα expression (J). (K and L) Cultured WT or CD36−/− CD8+ T cells were analyzed for lipid peroxidation, cell death (K) and IFNγ expression (L) after culture with tumor tissue for 1 day (50 μl at 1 mg/ml). (M) Cultured T cells were analyzed for lipid peroxidation and IFNγ or TNFα expression with or without tumor tissue (50 μl at 1 mg/ml) and ferrostatin-1 (5 μM) treatment. (N) Bone marrow tumor-infiltrating CD8+ T cells were analyzed for lipid peroxidation and cell death at days 10, 20 or 30 after Vk*MYC cell injection. (O and P) Tumor-infiltrating CD8+ T cells from MM patients were analyzed for CD36 expression, lipid peroxidation and cell death. (Q-S) CD8+ T cells from MM or MGUS patient’s bone marrow and blood were analyzed for lipid peroxidation and cell death. (T and U) Cultured human CD8+ T cells were treated with MM patient bone marrow plasma (100 μl) and analyzed for CD36 expression (T), and lipid peroxidation (U). (V) Cultured human CD8+ T cells were treated with MM patients’ bone marrow plasma (100 μl) and CD36-blocking antibodies (15 μg/ml) before analyzed for lipid peroxidation and cell death. Ferro: ferrostatin-1; S: supernatant. Data are presented as mean ± SEM. *p < 0.05; **p < 0.01; ***p < 0.001. See also Figure S4.
We used CD36−/− CD8+ T cells to further determine the role of CD36 in tumor-induced lipid peroxidation, ferroptosis and reduced IFNγ and TNFα production in CD8+ T cells. Tumor-treated CD36−/− CD8+ T cells had much lower ferroptosis level and higher IFNγ and TNFα production compared to tumor-treated WT CD8+ T cells (Fig. 4K, 4L and S4C), indicating that CD8+ T cell-expressed CD36 is responsible for tumor-induced lipid peroxidation, ferroptosis and reduced production of cytotoxic cytokines. Our studies also showed that addition of ferroptosis inhibitor (ferrostatin-1) partially abrogated tumor-induced ferroptosis and restored IFNγ and TNFα production in the cells (Fig. 4M), indicating that ferroptosis is required for CD36-mediated inhibition of cytotoxic cytokine production in CD8+ T cells.
Similar results were obtained from Vk*MYC tumor model and MM patients. We found that as tumors progressed, 30-day Vk*MYC tumor-infiltrating CD8+ T cells had significantly higher lipid peroxidation and ferroptosis level compared to T cells from 20-day tumors, and 20-day Vk*MYC tumor-infiltrating CD8+ T cells had significantly higher lipid peroxidation and ferroptosis level compared to T cells from 10-day tumors (Fig. 4N and S4D). We also analyzed the spleen of Vk*MYC tumor model, where tumor cells accumulate besides bone marrow(Cooke et al., 2016). The splenic CD8+ T cells from 4-week Vk*MYC tumor-bearing mice had higher lipid peroxidation and ferroptosis than cells from normal spleen (Fig. S4E). Similarly, in tumor-infiltrating CD8+ T cells from bone marrow of MM patients, CD36high CD8+ T cells had much higher lipid peroxidation and ferroptosis level than CD36low CD8+ T cells (Fig. 4O and 4P). Tumor-infiltrating CD8+ T cells from MM patients also had higher lipid peroxidation and ferroptosis level than those from MGUS patients (Fig. 4Q and 4S). In addition, tumor-infiltrating CD8+ T cells from MM patients had higher CD36 expression in Fig. 1D and lipid peroxidation and ferroptosis than CD8+ T cells from peripheral blood (Fig. 4R and 4S).
To further determine whether these findings are relevant to human cancers, we used human CD8+ T cells. We treated in vitro differentiated human CD8+ T cells with human MM bone marrow plasma. Culture of human CD8+ T cells with addition of MM patient’s bone marrow plasma significantly upregulated CD36 expression (Fig. 4T), induced lipid peroxidation and ferroptosis (Fig. 4U, 4V), and inhibited cytotoxic cytokine production (Fig. S4F) in the T cells. CD36-blocking antibodies, but not IgG control, abrogated plasma-induced lipid peroxidation and ferroptosis in CD8+ T cells (Fig. 4V). Addition of β-CD to tumor supernatant also abrogated the induction of ferroptosis in CD8+ T cells (Fig. S4G). These results further confirmed the role of CD36 in mediating the induction of lipid peroxidation and ferroptosis in human CD8+ T cells.
CD36 mediates ferroptosis and reduces cytotoxic cytokine production through fatty acid uptake in murine and human CD8+ T cells
We sought to elucidate the mechanisms underlying CD36-mediated ferroptosis in CD8+ T cells. In the s.c. grown or lung metastatic B16 tumor models, we found that tumor tissues had a higher fatty acid content than normal skin or spleen (Fig. 5A), and metastatic lung tissues had much higher fatty acid content compared to normal lung (Fig. 5B). In Vk*MYC tumor model, MM-bearing bone marrow had much higher fatty acid content compared to normal bone marrow (Fig. 5C). B16 tumors were surrounded and infiltrated by adipocytes (Fig. S5A) that were enriched with lipids and fatty acids(Zhang et al., 2018). These results indicate that tumor tissues are enriched with fatty acid. As fatty acids consist of different forms, we analyzed fatty acid composition in spleen, tumor tissue, and adjacent skin tissue by LC-MS analysis. Results showed that compared to adjacent skin tissue, tumors tissues were enriched with fatty acids, especially free poly-unsaturated fatty acid (PUFA) and phosphatidylethanolamines (PE) containing poly-unsaturated fatty acyl (PUFA-PE) (Fig. S5B–D), which were reported as executors of cell ferroptosis(Doll et al., 2017, Yang et al., 2016). As CD36 mediates lipid uptake(Su et al., 2020), we speculated that fatty acid uptake via CD36 induces CD8+ T cell ferroptosis, resulting in decreased cytotoxic cytokine production. To test this hypothesis, we first examined the effects of fatty acid mixture on CD8+ T-cell ferroptosis and cytotoxic cytokine production. Fatty acid induced CD8+ T-cell ferroptosis (Fig. 5D). RSL-3 and Fin56, ferroptosis inducers(Stockwell et al., 2017), were used as positive controls and significantly induced CD8+ T-cell ferroptosis (Fig. 5E, S5E). Fatty acid, RSL-3 and Fin56 all significantly inhibited CD8+ T-cell cytotoxic cytokine production (Fig. 5F, S5F and S5G). Fatty acid also significantly inhibited CD8+ T-cell proliferation (Fig. S5H). Addition of ferroptosis inhibitors ferrostatin-1, SRS16–86 or liproxstatin-1 rescued fatty acid-induced ferroptosis (Fig. 5G and S5I) and restored IFNγ and TNFα production in the T cells (Fig. 5H, 5I, S5J, S5K and S5L). Similar phenomenon was observed in human CD8+ T cells. Fatty acid induced human CD8+ T-cell ferroptosis (Fig. 5J), inhibited their IFNγ and TNFα production (Fig. 5K), and reduced their proliferation (Fig. S5M). Again, ferrostatin-1 rescued fatty acid-induced ferroptosis (Fig. 5L) and restored IFNγ and TNFα production in human CD8+ T cells (Fig. 5M). These results clearly show that tumor tissues are enriched with fatty acid, and fatty acid induces CD8+ T-cell ferroptosis and loss of effector function.
Figure 5. CD36 mediates ferroptosis and reduces cytotoxic cytokine production in CD8+ T cells through uptake of fatty acid.

(A-C) Fatty acid contents of tumor, spleen and normal adjacent skin 2 weeks after tumor inoculation (A), tumor-bearing lung (2 weeks after tumor inoculation) and normal lung tissues (B), tumor-bearing bone marrow (4 weeks after tumor inoculation) and normal bone marrows from tumor free B6 mice (C). (D-F) Lipid peroxidation, cell death (D and E), IFNγ or TNFα expression (F) of the T cells measured after fatty acid (μl) or RSL-3 (10 μM) treatment during T cell differentiation. RSL-3 (10 μM) served as a positive control for inducing ferroptosis (E). (G-I) Cultured T cells were analyzed for lipid peroxidation, cell death (G) and IFNγ or TNFα expression (H and I) after treatment with fatty acid (5 μl) or ferrostatin-1 (μM). (J and K) Lipid peroxidation, cell death (J), and IFNγ or TNFα expression (K) of human T cells measured after treatment with fatty acid (5 μl). (L and M) Lipid peroxidation (L) and IFNγ or TNFα expression (M) of human T cells measured after treatment with fatty acid (5 μl) and ferrostatin-1 (5 μM). (N) Fatty acid uptake assay was performed on cultured WT or CD36−/− CD8+ T cells using fatty acid uptake kit. (O-R) Lipid peroxidation (O), cell death (P), and IFNγ or TNFα expression (Q and R) of WT or CD36−/− CD8+ T cells measured after treatment with fatty acid (5 μl). (S and T) Lipid peroxidation, cell death (S), and IFNγ or TNFα expression (T) of human T cells measured after treatment with fatty acid (5 μl) and CD36-blocking antibodies (10 μg/ml). FA: fatty acid; Ferro: ferrostatin-1. Data are presented as mean ± SEM. *p < 0.05; **p < 0.01; ***p < 0.001. See also Figure S5 and S6.
Second, we examined the role of CD36 in CD8+ T cell uptake of fatty acid, activation of ferroptosis, and production of cytotoxic cytokines. We observed that CD36−/− CD8+ T cells had less fatty acid uptake compared to WT CD8+ T cells (Fig. 5N). In culture with fatty acid, CD36−/− CD8+ T cells displayed less ferroptosis (Fig. 5O and 5P), and produced more IFNγ and TNFα (Fig. 5Q and 5R) compared to WT CD8+ T cells. Similarly, human CD8+ T cells treated with CD36-blocking antibodies had less ferroptosis (Fig. 5S) and more IFNγ and TNFα production (Fig. 5T) compared to CD8+ T cells treated with IgG control. These results confirmed our hypothesis that fatty acid induces ferroptosis and decreases cytotoxic cytokine production in CD8+ T cells via CD36. Moreover, we analyzed fatty acid composition in tumor-treated CD36−/− CD8+ T cells and WT CD8+ T cells. Similar with Fig. S5B–D, WT CD8+ T cells also had a higher content of fatty acids, especially free PUFA and PUFA-PE compared to CD36−/− CD8+ T cells (Fig. S5N and S5O).
Fatty acids is a mixture(A et al., 2019).
To determine which fatty acid(s) are responsible for inducing ferroptosis in CD8+ T cells, we used myristic acid (MA, saturated fatty acid), palmitic acid (PA, saturated fatty acid), oleic (OA, mono-unsaturated fatty acid), arachidonic acid (AA, ω−6 poly-unsaturated fatty acid), or eicosapentaenoic acid (EPA, ω−3 poly-unsaturated fatty acid) to treat T cells. These are the major components of fatty acids and comprise the fatty acids that were used in our studies. Results showed that only AA induced increased lipid peroxidation and ferroptosis in WT CD8+ T cells but not in CD36−/− CD8+ T cells (Fig. S6A–D). Further analysis showed that AA also induced increased iron and cytosolic ROS levels, and reduced cytotoxic cytokine production in WT CD8+ T cells but not in CD36−/− CD8+ T cells (Fig. S6E–G). Moreover, high levels of AA and other ω−6 poly-unsaturated fatty acid levels were detected in tumor tissues compared to spleen or normal adjacent skin tissues and in tumor-treated WT CD8+ T cells compared to CD36−/− CD8+ T cells (Fig. S5B–D, S5N, and S5O). Taken together, these results indicate that AA (the representative of ω−6 poly-unsaturated fatty acid) is the major component of the fatty acids in tumor tissues to induce T cell ferroptosis.
Targeting ferroptosis or CD36 enhances CD8+ T cell- and ICB-based tumor immunotherapy
To investigate whether ferroptosis level in CD8+ T cells affects their antitumor function, we compared antitumor effects of control, ferroptosis inducer RSL-3-, fatty acid-, or ferroptosis inhibitor ferrostatin-1-treated CD8+ T cells in tumor-bearing mice. After adoptive transfer, significantly higher numbers of ferrostatin-1-treated CD8+ T cells were detected in peripheral blood of mice than those infused with control CD8+ T cells, whereas the numbers of control CD8+ T cells were significantly higher than those infused with RSL-3- or fatty acid-treated CD8+ T cells on days 7 and 14 (Fig. 6A and 6B). Ferrostatin-1-treated CD8+ T cells in peripheral blood also displayed lower ferroptosis and higher IFNγ production and proliferation than control CD8+ T cells, while control CD8+ T cells had lower ferroptosis and higher IFNγ production and proliferation than RSL-3- or fatty acid-treated CD8+ T cells (Fig. 6B–6D). Mice infused with ferrostatin-1-treated CD8+ T cells displayed the smallest tumor burden and best survival among all groups, while fatty acid- or RSL-3-treated CD8+ T cells exerted impaired antitumor effect in the mice (Fig. 6E). These results demonstrate that ferroptosis in CD8+ T cells dampens, while inhibiting ferroptosis in CD8+ T cells enhances their antitumor function in vivo. These results also show that fatty acid, which induces ferroptosis, reduces CD8+ T cell antitumor function.
Figure 6. Targeting ferroptosis or CD36 enhances the efficacy of CD8+ T cell- and ICB-based cancer immunotherapy.

Fatty acid (5 μl), RSL-3 (10 μM), or ferrostatin-1 (5 μM) was added during T cell differentiation. (A-D) Relative numbers of transferred T cells measured by flow cytometry on day 7 (A) or 14 (B) after T cell transfer. Lipid peroxidation and 7-AAD of transferred T cells were measured by flow cytometry on day 14 (B). IFNγ or Ki67 expression of transferred T cells were measured by flow cytometry on day 7 (C and D). (E and F) B16 tumor growth and survival of mice treated with adoptive transfer of control CD8+ Pmel-1 T cells, fatty acid-, RSL-3-, or ferrostatin-1- treated Pmel-1 T cells (E), and tumor growth and survival of mice treated with IgG control, anti-PD-1 antibodies, CD8+ Pmel-1 T cells, CD36−/− CD8+ Pmel-1 T cells, CD8+ Pmel-1 T cells in combination with anti-PD-1 antibodies, or CD36−/− CD8+ Pmel-1 T cells in combination with anti-PD-1antibodies (F). (G) Schematic diagram showing the mechanism underlying fatty acid-induced dysfunction in CD8+ effector T cells in TME. FA: fatty acid; Ferro: ferrostatin-1. Differences in survival curves between the groups were analyzed by log-rank (Mantel–Cox) test. Data are presented as mean ± SEM. *p < 0.05; **p < 0.01; ***p < 0.001.
We showed that CD36−/− CD8+ T cells had lower ferroptosis and stronger antitumor function compared to WT CD8+ T cells (Fig. 2N, 3H and 3I). Furthermore, when CD36−/− CD8+ T cells were combined with anti-PD-1 antibodies, they achieved better antitumor effects and extended mouse survival as compared to WT CD8+ T cells combined with PD-1 antibodies, or CD36−/− CD8+ T cells or PD-1 antibodies alone (Fig. 6F). These results suggest that blocking CD36 on CD8+ T cells enhances ICB-based immunotherapy.
DISCUSSION
As a membrane glycoprotein, CD36 has been studied in many mammalian cell types, such as adipocytes, macrophages, and hepatocytes(Silverstein and Febbraio, 2009, Pepino et al., 2014). However, little is known about its role in T cells. In this study, we found that CD36-mediated ferroptosis dampens intratumoral CD8+ T-cell effector function and impairs their antitumor ability.
Recently, Ho et al(Wang et al., 2020) reported that CD36 was selectively upregulated in intratumoral T regulatory (Treg) cells. CD36 maintained the mitochondrial fitness of Treg cells in TME via peroxisome proliferator-activated receptor-β signaling pathway. In addition, absence of CD36 in Treg cells suppressed tumor growth. Their study showed that CD36 expression on Treg cells sustains their function. In addition, it has been reported that CD36 expression on dendritic cells facilitated Treg cell TCR repertoire development(Perry et al., 2018). Together with our study, the reasons why tumor grew slowly in CD36−/− mice could be explained by a better CD8+ effector T cells and less Treg cell-mediated immunosuppression due to CD36 deficiency in T cells.
Ferroptosis is a type of regulated cell death caused by accumulation of lipid peroxide(Stockwell et al., 2017). Wang et al. recently showed that immunotherapy-activated CD8+ T cells enhanced ferroptosis-specific lipid peroxidation in tumor cells that contributed to the antitumor efficacy of immunotherapy(Wang et al., 2019). Matsushita et al. showed that Gpx4, a ferroptosis suppressor gene, was critical for T cell expansion and protection from viral and parasitic infection(Matsushita et al., 2015). However, it is unclear whether and how ferroptosis is involved in T cell-based cancer immunotherapy. Here, we demonstrate that inhibition of ferroptosis in CD8+ T cells enhanced the antitumor function of the cells, while inducing ferroptosis in the T cells compromised their antitumor function. Furthermore, we found that deletion of CD36 in CD8+ T cells in combination with anti-PD-1 antibodies achieved better antitumor effects than either of them alone. Thus, our study suggests that targeting CD36 and ferroptosis may be an effective strategy to improve the antitumor efficacy of T cell-based immunotherapy. Our study also highlights the importance of manipulating lipid metabolism or lipid peroxidation in T cells to improve the clinical effectiveness of cancer immunotherapies.
Limitations of Study
While our finding demonstrates that AA from tumor and TME induce tumor-infiltrating CD8+ T-cell ferroptosis through CD36, this work does have some limitations. It remains unclear how AA is accumulated in tumor and TME and how AA mediates CD8+ T-cell ferroptosis. Detailed mechanisms remain to be investigated.
STAR Methods
RESOURCE AVAILABILITY
Lead Contact
Further information and requests for resources and reagents should be directed to and will be fulfilled by the Lead Contact, Qing Yi (QYi@houstonmethodist.org).
Materials Availability
All reagents are available from the Lead Contact under a material transfer agreement with Houston Methodist Research Institute.
Data and Code Availability
All data and code to understand and assess the conclusion of this research are available in the main text, supplementary materials, or GEO Database (accession number GSE151160).
EXPERIMENTAL MODEL AND SUBJECT DETAILS
Mice
B6 mice were purchased from the National Cancer Institute. B6.Cg-Thy1a/Cy Tg (TcraTcrb)8Rest/J (Pmel-1) and B6.129S1-Cd36tm1Mfe/J (CD36−/−) mice were purchased from the Jackson Laboratory. CD36−/− Pmel mice were generated by crossing Pmel-1 mice with CD36−/− mice. All experiments complied with protocols approved by the Institutional Animal Care and Use Committee at the Houston Methodist Research Institute.
METHOD DETAILS
Cell purification and culture
Murine B16 cell line was purchased from ATCC and maintained in the indicated medium. T cells were isolated using the EasySep Mouse CD8+ T Cell Isolation Kit (STEMCELL Technologies, Inc.). Cells were stimulated and cultured with plate-bound anti-CD3 (2 μg/ml) and soluble anti-CD28 (1 μg/ml) antibodies under Tc1 (IL-2) cell-polarizing conditions with or without the indicated treatments. After 3 days of differentiation, cells were transferred to new wells and cultured in standard T-cell medium for another 2 days. In some experiments, splenocytes from Pmel-1 mice were directly stimulated with hgp10025–33 peptide (Genscript).
For FA and ferroptosis inhibitors, indicated FA and inhibitors were added into medium on day 4 and cultured for another 24 hours. For ferroptosis inducers, indicated inducer was added into culture medium on day 5 and cultured for another 6–8 hours.
Vk*MYC MM cells were kindly provided by Leif P. Bergsagel (Mayo Clinic in Arizona, Phoenix, Arizona, USA) and maintained in Rag2–/– Il2rg–/– mice. Splenocytes containing greater than 50% of malignant plasma cells were frozen and used for experiments.
Human CD8+ T cell isolation and culture
Buffy coats of healthy donors were purchased from Gulf Coast Regional Blood Center. Informed consent was obtained for all subjects. PBMCs were isolated from blood by density gradient cell separation. Naive CD8+ T cells were isolated from PBMCs using a negative selection kit (STEMCELL) and stimulated with human T-activator CD3/CD28 Dynabeads (Invitrogen) plus human IL-2 (10 ng/ml) with or without indicated treatments.
RNAseq
RNAseq analysis was performed using Illumina equipment at Cancer Genomics Center, The University of Texas Health Science Center at Houston. RNA was transferred to cDNA followed by ligation of adapters and the cDNA was sequenced. For PD-1-response and non-response melanoma patients’ information, published RNAseq data (GEO: GSE78220.) from Hugo et al.(Hugo et al., 2017) were re-analyzed. Selected genes were compared by heatmap. Expression value were row z-scored in the heatmap. Kallisto was used to quantify abundances of transcripts with default parameters. Deseq2 was used for differential gene expression analysis.
Single cell RNAseq analysis
Single cell RNAseq data were re-analyzed from Moshe et al. and Guo et al. (Sade-Feldman et al., 2019, Guo et al., 2018) Count matrix was filtered for CD8+ T cells. To examine CD36 expression in CD8+ cells in melanoma patients, published melanoma single cell RNAseq data were downloaded from the GEO database (GEO: GSE120575), in which patients with survival days less than 550 days were categorized into “short” survival group, while the rest were put into “long” survival group. Only CD8+CD36+ cells were kept for the study (in which expression of CD8A or CD8B larger then 0, and CD36 larger than 0). Correlation between CD36 expression and cytotoxic cytokine production was calculated by Pearson’s Correlation Coefficient. In some analyses, we divided cells into CD36high and CD36low groups. Cells with top 40% CD36 expression were used as CD36high group, and cells with bottom 40% CD36 expression were used as CD36low group. We tested the relationship by Wilcoxon Rank-Sum Test. Fold changes of gene expression were used to calculate pathway enrichment in GSEA(Subramanian et al., 2005). For Non-small-cell lung cancer patients (GSE99254), “NTC” means CD8+ T cells in adjacent normal tissue. “TTC” means CD8+ T cells in tumor tissue.
Lipid peroxidation and cytosolic ROS measurement
Experiments were performed according to the manufacturer’s protocol. Briefly, cells were incubated in a humidified chamber at 37°C with 5% CO2 for 30 minutes with Lipid Peroxidation Sensor or CM-H2DCFDA in cell culture medium. After incubation, cells were washed and examined by flow cytometry within 2 hours of staining.
Cellular iron staining
Cells were washed with PBS twice and stained with 10 nM of Phen Green™ SK for 15 minutes in 37°C. After staining, cells were centrifuged and re-suspended in PBS and the fluorescence profile of the sample was monitored using a BD aka Fortessa X30 system. Higher fluorescence intensity indicates lower iron level.
Flow cytometry
Surface staining was conducted according to manufacturer’s instructions. For intracellular staining, cells were stimulated with phorbol myristate acetate and ionomycin and treated with brefeldin A (Biolegend) for 4–5 hours before staining for intracellular cytokines using the BD Fixation/Permeabilization Solution Kit. Results were then acquired using BD aka Fortessa X30 systems. Data were analyzed with FlowJo_V10 software (TreeStar).
Serum Protein Electrophoresis (SPEP)
Blood was collected from mouse tail vein, followed by centrifugation and serum collection. Assay was conducted according to the manufacturer’s protocols. Briefly, serum was diluted 5-fold in PBS before loaded on a QuickGel SPE Gel (Helena Laboratories, catalog 3505T). Electrophoresis was run at 400 V for 5 minutes. Gels were dried with a QuickGel Chamber (Helena Laboratories, catalog 1284) for 15 minutes followed by staining with Acid Blue for 2 minutes and de-staining with Destain solution for 10 minutes.
Tumor models
Mice (4–5/group) were injected s.c. in the right back flank with 1 × 10⁶ B16 tumor cells. After 7 to 14 days, tumors formed and were collected for flow cytometry analysis. In some mice, tumor growth was monitored till the end point, and CD8-depleting antibodies (200 μg per mice) were injected one day before tumor injection, followed by 4 consecutive injections every 3 days. In B16 melanoma lung metastatic model, mice were injected i.v. with 2 × 10⁵ B16 cells. At days 12–16 after tumor injection, mice were sacrificed, and mouse lungs were collected and analyzed by flow cytometry.
For adoptive transfer experiments, mice (5/group) were injected s.c. in the right rear flank with 1 × 10⁶ B16 tumor cells. After 12–14 days, tumor-bearing mice were injected i.v. with 2 × 10⁶ indicated CD8+ T cells (Fig. 2M, S3G–J). Mice were sacrificed and analyzed 3 to 5 days after CD8+ T-cell transfer. In B16 melanoma lung metastatic model, mice were injected i.v. with 2 × 10⁵ B16 cells 12 days before transfer of 2 × 10⁶ indicated CD8+ T cells. At day 15 or 16 after tumor injection, mice were sacrificed and metastatic lung foci were counted (Fig. 2L, S3C–F).
In B16 s.c. tumor model, mice were injected with 0.8 × 10⁶ B16 cells in the right back flank. At day 9, 1 dose of CTX was given i.p. at 250 mg/kg body weight. At day 10 after tumor injection, mice (5/group) were treated with i.v. injection of 2 × 10⁶ indicated CD8+ T cells, followed by i.v. injection of 5 × 10⁵ peptide-pulsed bone marrow-derived dendritic cells and 4 doses of rhIL-2 as previously described(Ma et al., 2018). In some mice, anti-PD-1 antibodies (200 μg per mice) were injected at indicated time points. Tumor size was calculated as: 0.5 × L (length) × W (width)2. (Fig. 2N and Fig. 6)
In Vk* MM model, 1.5 × 10⁶ Vk*MYC cells were injected i.v.. Mouse tail vein blood was collected as indicated for SPEP to monitor tumor development using QuickGel SPE Kit. Mouse bone marrow was collected at indicated time points for flow cytometry analysis. All mouse experiments were repeated three times.
Human patient samples
Bone marrow aspirates from patients with newly diagnosed MM or MGUS were obtained at the Cleveland Clinic and Houston Methodist Cancer Center. Participated patients all provided written informed consent. Collection and analysis of the clinical samples were approved by the Institutional Review Board of the Cleveland Clinic Foundation and Houston Methodist Research Institute.
LC-MS analysis of free and esterified fatty acids
LS-MS analysis was conducted at the Metabolomics Core at UT MD Anderson Cancer Center. For free fatty acid detection, samples were homogenized using a liquid nitrogen cooled Precellys Evolution bead mill homogenizer and mixed with internal standard mixture in ice-cold methanol. Extracted free fatty acid acids were converted to acyl chloride intermediates and further derivatized. Dried derivatization products were reconstituted in 100 μL ethanol, transferred to glass auto-sampler vial inserts and supernatants were next transferred to fresh vial inserts for analysis.
Mobile phase A (MPA) was water containing 0.1 % formic acid, and mobile phase B (MPB) was acetonitrile containing 0.1 % formic acid. The chromatographic method includes a Thermo Fisher Scientific Accucore C30 column (2.6 μm, 150 × 2.1 mm) maintained at 15 °C, autosampler tray chilling at 8 °C, a mobile phase flow rate of 0.500 mL/min, and a gradient elution program as follows: 0–5 min, 5% MPB; 5–40 min, 5–95% MPB; 40–85 min, 95% MPB; 85–85.1, 95–5% MPB; 85.1–90 min, 5% MPB. A Thermo Fisher Scientific Orbitrap Fusion Tribrid mass spectrometer with heated electrospray ionization source was operated in data dependent acquisition mode with a scan range of 150 – 550 m/z. Orbitrap resolutions of 120,000 (FWHM) and 30,000 for MS1 and MS2 were used, respectively. The instrument was operated in positive ionization mode with a spray voltage of 3,600 V, and vaporizer and capillary temperatures set at 350 and 325 °C, respectively. The sheath, auxiliary and sweep gas pressures were 50, 10, and 1 (arbitrary units), respectively. Ions were fragmented using assisted HCD with stepped collision energies of 25, 30, and 35%.
For PE detection, Samples were extracted using ice-cold ethanol containing 1% (v/v) 10 mM butylated hydroxytoluene and 1% (v/v) Avanti SPLASH® LIPIDOMIX® Mass Spec Standard (330707), both in methanol. Samples were then homogenized using a liquid nitrogen cooled Precellys Evolution bead mill homogenizer. Supernatants were transferred to glass autosampler vials for immediate analysis. Mobile phase A (MPA) was 60:40 acetonitrile:water, containing 0.1 % formic acid and 10 mM ammonium acetate. Mobile phase B (MPB) was 90:9:1 isopropanol:acetonitrile:water, containing 0.1 % formic acid and 10 mM ammonium acetate. The chromatographic method includes a Thermo Fisher Scientific Accucore C30 column (2.6 μm, 150 × 2.1 mm) maintained at 40 °C, autosampler tray chilling at 15 °C, a mobile phase flow rate of 0.200 mL/min, and a gradient elution program as follows: 0–3 min, 30% MPB; 3–13 min, 30–43% MPB; 13–13.1 min, 43–50% MPB; 13.1–33 min, 50–70% MPB; 33–48 min, 70–99% MPB; 48–55 min, 99% MPB; 55–55.1 min, 99–30% MPB; 55.1–60 min, 30% MPB.A Thermo Fisher Scientific Orbitrap Fusion Lumos Tribrid mass spectrometer with heated electrospray ionization source was operated in data dependent acquisition mode, in negative ionization mode, with a scan range of 400 – 1,000 m/z. Orbitrap resolutions of 120,000 and 30,000 (FWHM) were used for MS1 and MS2–3 acquisitions, respectively, and a spray voltage of −2900 V was used. Vaporizer and ion transfer tube temperatures were set at 275 and 300°C, respectively. The sheath, auxiliary and sweep gas pressures were 35, 7, and 0 (arbitrary units), respectively. For MS2 and MS3 fragmentation a hybridized HCD/CID approach was used. Data were analyzed using Thermo Scientific LipidSearch software (version 4.2.27) and R scripts written in house.
Immunohistochemistry staining
Tumor tissues were aseptically removed, fixed in 4% neutral buffered formalin and embedded in paraffin. Serial sections (5 μm thick) were stained with hematoxylin-eosin for histopathology evaluation. For adipocyte staining, perilipin was detected. Images were photographed by a digital camera DP21.
QUANTIFICATION AND STATISTICAL ANALYSIS
For statistical analysis, Student’s t-test was used. A P value less than 0.05 was considered statistically significant. Results are presented as mean ± SEM unless otherwise indicated. Differences in survival curves between the groups were analyzed by log-rank (Mantel–Cox) test. All experiments were performed with at least three biological replicates, and data shown are representative of at least three independent experiments.
Supplementary Material
Table S1. Names and changes of gene sets or genes used for bioinformatic analysis. Related to Figure 3.
KEY RESOURCES TABLE
| REAGENT or RESOURCE | SOURCE | IDENTIFIER |
|---|---|---|
| Antibodies | ||
| APC, FITC Anti-Mouse CD8a | BD Pharmingen | Cat# 553035; RRID:AB_398527 Cat# 553031 RRID:AB_394569 |
| APC, BV421 Anti-Rat CD90/Mouse CD90.1 | BD Pharmingen | Cat# 561409; RRID:AB_10683163; Cat# 563770; RRID:AB_2738416 |
| eFluor 450 Anti-Mouse IFN-g | eBioscience | Cat# 48-7311-82; RRID:AB_1834366 |
| PerCP-Cy™5 .5 Rat Anti-Mouse TNF | BD Pharmingen | Cat# 560659; RRID: AB_1727580 |
| eFluor 450 Anti-Mouse Granzyme B | eBioscience | Cat# 48-8898-82 RRID: AB_11149362 |
| APC Anti-Mouse Perforin | eBioscience | Cat# 17-9392-80 RRID: AB_469514 |
| APC, BV421 Anti-Mouse Ki-67 | Biolegend | Cat# 652406; RRID:AB_2561930; Cat# 652411; RRID:AB_2562663 |
| APC Anti-Mouse CD36 | Biolegend | Cat# 102612 RRID:AB_2072639 |
| FITC Anti-Mouse CD4 | Biolegend | Cat# 100406 RRID:AB_312691 |
| 7-AAD | Biolegend | Cat# 420404 |
| DAPI | Biolegend | Cat# 422801 |
| InVivoPlus anti-mouse PD-1 | Bio X cell | Cat# BP0146 RRID:AB_ 10949053 |
| InVivoPlus rat IgG2a isotype control | Bio X cell | Cat# BP0089 RRID:AB_ 1107769 |
| Anti-CD8-depleting antibodies | Bio X cell | Cat# BE0061 RRID:AB_ 1125541 |
| InVivoMAb rat IgG2b isotype control | Bio X cell | Cat# BE0090 RRID:AB_ 1107780 |
| InVivoMAb anti-mouse CD3 | Bio X cell | Cat# BE0002 RRID:AB_ 1107630 |
| InVivoMAb anti-mouse CD28 | Bio X cell | Cat# BE0015-1 RRID:AB_ 1107624 |
| Anti-CD36 (Clone JC63.1) | Cayman | 188150 |
| BV421 Anti-human CD36 | Biolegend | Cat# 336230 RRID:AB_2814228 |
| Alexa Fluor 700 Anti-human CD8 | Biolegend | Cat# 344724 RRID:AB_2562790 |
| BV421 Anti-human CD45RA | Biolegend | Cat# 304130 RRID:AB_10965547 |
| Alexa Fluor 647 Anti-human CCR7 | Biolegend | Cat# 353218 RRID:AB_10917385 |
| APC/Cyanine7 anti-human IFN-γ | Biolegend | Cat# 506524 RRID:AB_2566136 |
| PE anti-human TNF-α | Biolegend | Cat# 502908 RRID:AB_315260 |
| Alexa Fluor 488 anti-human Perforin | Biolegend | Cat# 353320 RRID:AB_2783255 |
| Perilipin-1 (D1D8) | Cell signaling technology | Cat# 9349 RRID: AB_10829911 |
| Pacific Blue anti-human/mouse Granzyme B | Biolegend | Cat# 515408 RRID:AB_2562196 |
| Bacterial and Virus Strains (should we delete this row) | ||
| Biological Samples | ||
| Buffy coats of healthy donors | Gulf Coast Regional Blood Center | N/A |
| Bone marrow aspirates from patients with multiple myeloma or MGUS | Cleveland Clinic and Houston Methodist Cancer Center | N/A |
| Chemicals, Peptides, and Recombinant Proteins | ||
| Human IL-2 | R&D Systems | 202-IL-010 |
| Recombinant Mouse IL-12 Protein | R&D Systems | 419-ML-010 |
| Cholesterol | Sigma-Aldrich | C4951 |
| β-cyclodextrin | Sigma-Aldrich | C4555; CAS: 128446-36-6 |
| Hgp10025-33 | Genscript | N/A |
| Fatty acid supplement | Sigma-Aldrich | F7050 |
| myristic acid | Sigma-Aldrich | M3128 |
| palmitic acid | Sigma-Aldrich | P0500; CAS: 57-10-3 |
| oleic acid | Sigma-Aldrich | O1257 |
| arachidonic acid | Sigma-Aldrich | 10931; CAS: 506-32-1 |
| cis-5,8,11,14,17-eicosapentaenoic acid | Sigma-Aldrich | E2011; CAS: 10417-94-4 |
| 1S,3R-RSL3 | Sigma-Aldrich | SML2234; CAS: 1219810-16-8 |
| FIN56 | Sigma-Aldrich | SML1740; CAS: 1083162-61-1 |
| Ferrostatin-1 | Sigma-Aldrich | SML0583; CAS: 347174-05-4 |
| Liproxstatin-1 | Sigma-Aldrich | SML1414; CAS: 950455-15-9 |
| SRS16-86 | Cayman Chemical | 26752; CAS: 1793052-96-6 |
| Phen Green™ SK | ThermoFisher | P14313 |
| CM-H2DCFDA | ThermoFisher | C6827 |
| phorbol myristate acetate | Sigma-Aldrich | P1585; CAS: 16561-29-8 |
| ionomycin | Sigma-Aldrich | I0634; CAS: 56092-82-1 |
| Brefeldin A | Biolegend | 420601 |
| Critical Commercial Assays | ||
| EasySep™ Mouse CD8+ T Cell Isolation Kit | STEMCELL Technologies | 19853 |
| EasySep™ Human CD8+ T Cell Isolation Kit | STEMCELL Technologies | 17953 |
| Dynabeads™ Human T-Activator CD3/CD28 for T Cell Expansion and Activation | Invitrogen | 11131D |
| Amplex™ Red Cholesterol Assay Kit | Invitrogen | A12216 |
| Fixation/Permeabilization Solution Kit | BD Biosciences | 554714 |
| Fatty acid uptake kit | Sigma-Aldrich | MAK156 |
| Free Fatty Acid Quantitation Kit | Sigma-Aldrich | MAK044 |
| Lipid Peroxidation Assay Kit | Abcam | ab243377 |
| QuickGel SPE Gel | Helena Laboratories | 3505T |
| Deposited Data | ||
| The RNA sequence data | This paper | GSE151160 |
| melanoma single cell RNAseq data | Sade-Feldman, M. et al | GSE120575 |
| Non-small-cell lung cancer single cell RNAseq data | Guo, X. et al | GSE99254 |
| Metastatic Melanoma PD-1 therapy | Hugo, W. et al | GSE78220 |
| Experimental Models: Cell Lines | ||
| B16 | Qing Yi | N/A |
| Vk*MYC | Qing Yi | N/A |
| Experimental Models: Organisms/Strains | ||
| C57BL/6 | Jackson Laboratories | 000664 |
| B6.Cg-Thy1a/Cy Tg(TcraTcrb)8Rest/J | Jackson Laboratories | 005023 |
| B6.129S1-Cd36tm1Mfe/J | Jackson Laboratories | 019006 |
| CD36−/− Pmel | Qing Yi | |
| Oligonucleotides | ||
| Recombinant DNA | ||
| Software and Algorithms | ||
| FlowJo_V10 software | TreeStar | N/A |
| GraphPad Prsim 5 | GraphPad | N/A |
| Other | ||
Highlights.
Tumor microenvironment is enriched with fatty acid
Fatty acid in the tumor microenvironment induces CD8+ T-cell ferroptosis
CD36 expression is required for AA-induced CD8+ T-cell ferroptosis
CD36 expression impairs CD8+ T-cell cytotoxic cytokine production and antitumor function
ACKNOWLEDGMENTS
This work was supported by NCI R01 CA239255 and Cancer Prevention & Research Institute of Texas Recruitment of Established Investigator Award (RR180044). Q.Y. and his research group are also supported by NCI R01s (CA211073, CA200539, and CA214811).
Footnotes
DECLARATION OF INTERESTS
The authors have declared that no conflicts of interest exist.
Publisher's Disclaimer: This is a PDF file of an unedited manuscript that has been accepted for publication. As a service to our customers we are providing this early version of the manuscript. The manuscript will undergo copyediting, typesetting, and review of the resulting proof before it is published in its final form. Please note that during the production process errors may be discovered which could affect the content, and all legal disclaimers that apply to the journal pertain.
ADDITIONAL RESOURCES
None.
Reference
- A, I. S. S., C, A. B. & A, J. S. 2019. Changes in Plasma Free Fatty Acids Associated with Type-2 Diabetes. Nutrients, 11. [DOI] [PMC free article] [PubMed] [Google Scholar]
- ALMEIDA L, LOCHNER M, BEROD L. & SPARWASSER T. 2016. Metabolic pathways in T cell activation and lineage differentiation. Semin Immunol, 28, 514–524. [DOI] [PubMed] [Google Scholar]
- AYALA A, MUNOZ MF & ARGUELLES S. 2014. Lipid peroxidation: production, metabolism, and signaling mechanisms of malondialdehyde and 4-hydroxy-2-nonenal. Oxid Med Cell Longev, 2014, 360438. [DOI] [PMC free article] [PubMed] [Google Scholar]
- CHANG CH & PEARCE EL 2016. Emerging concepts of T cell metabolism as a target of immunotherapy. Nat Immunol, 17, 364–8. [DOI] [PMC free article] [PubMed] [Google Scholar]
- COOKE RE, GHERARDIN NA, HARRISON SJ, QUACH H, GODFREY DI, PRINCE M, KOLDEJ R. & RITCHIE DS 2016. Spontaneous onset and transplant models of the Vk*MYC mouse show immunological sequelae comparable to human multiple myeloma. J Transl Med, 14, 259. [DOI] [PMC free article] [PubMed] [Google Scholar]
- DOLL S, PRONETH B, TYURINA YY, PANZILIUS E, KOBAYASHI S, INGOLD I, IRMLER M, BECKERS J, AICHLER M, WALCH A, PROKISCH H, TRUMBACH D, MAO G, QU F, BAYIR H, FULLEKRUG J, SCHEEL CH, WURST W, SCHICK JA, KAGAN VE, ANGELI JP & CONRAD M. 2017. ACSL4 dictates ferroptosis sensitivity by shaping cellular lipid composition. Nat Chem Biol, 13, 91–98. [DOI] [PMC free article] [PubMed] [Google Scholar]
- FAGERBERG J, YI Q, GIGLIOTTI D, HARMENBERG U, RUDEN U, PERSSON B, OSTERBORG A. & MELLSTEDT H. 1999. T-cell-epitope mapping of the idiotypic monoclonal IgG heavy and light chains in multiple myeloma. Int J Cancer, 80, 671–80. [DOI] [PubMed] [Google Scholar]
- GAJEWSKI TF, SCHREIBER H. & FU YX 2013. Innate and adaptive immune cells in the tumor microenvironment. Nat Immunol, 14, 1014–22. [DOI] [PMC free article] [PubMed] [Google Scholar]
- GUO C, SUN L, CHEN X. & ZHANG D. 2013. Oxidative stress, mitochondrial damage and neurodegenerative diseases. Neural Regen Res, 8, 2003–14. [DOI] [PMC free article] [PubMed] [Google Scholar]
- GUO X, ZHANG Y, ZHENG L, ZHENG C, SONG J, ZHANG Q, KANG B, LIU Z, JIN L, XING R, GAO R, ZHANG L, DONG M, HU X, REN X, KIRCHHOFF D, ROIDER HG, YAN T. & ZHANG Z. 2018. Global characterization of T cells in non-small-cell lung cancer by single-cell sequencing. Nat Med, 24, 978–985. [DOI] [PubMed] [Google Scholar]
- HROUDOVA J. & FISAR Z. 2013. Control mechanisms in mitochondrial oxidative phosphorylation. Neural Regen Res, 8, 363–75. [DOI] [PMC free article] [PubMed] [Google Scholar]
- HUGO W, ZARETSKY JM, SUN L, SONG C, MORENO BH, HU-LIESKOVAN S, BERENT-MAOZ B, PANG J, CHMIELOWSKI B, CHERRY G, SEJA E, LOMELI S, KONG X, KELLEY MC, SOSMAN JA, JOHNSON DB, RIBAS A. & LO RS 2017. Genomic and Transcriptomic Features of Response to Anti-PD-1 Therapy in Metastatic Melanoma. Cell, 168, 542. [DOI] [PubMed] [Google Scholar]
- JOYCE JA & FEARON DT 2015. T cell exclusion, immune privilege, and the tumor microenvironment. Science, 348, 74–80. [DOI] [PubMed] [Google Scholar]
- MA X, BI E, HUANG C, LU Y, XUE G, GUO X, WANG A, YANG M, QIAN J, DONG C. & YI Q. 2018. Cholesterol negatively regulates IL-9-producing CD8(+) T cell differentiation and antitumor activity. J Exp Med, 215, 1555–1569. [DOI] [PMC free article] [PubMed] [Google Scholar]
- MA X, BI E, LU Y, SU P, HUANG C, LIU L, WANG Q, YANG M, KALADY MF, QIAN J, ZHANG A, GUPTE AA, HAMILTON DJ, ZHENG C. & YI Q. 2019. Cholesterol Induces CD8(+) T Cell Exhaustion in the Tumor Microenvironment. Cell Metab, 30, 143–156 e5. [DOI] [PMC free article] [PubMed] [Google Scholar]
- MA X. & YI Q. 2019. Cholesterol induces T cell exhaustion. Aging (Albany NY), 11, 7334–7335. [DOI] [PMC free article] [PubMed] [Google Scholar]
- MATSUSHITA M, FREIGANG S, SCHNEIDER C, CONRAD M, BORNKAMM GW & KOPF M. 2015. T cell lipid peroxidation induces ferroptosis and prevents immunity to infection. J Exp Med, 212, 555–68. [DOI] [PMC free article] [PubMed] [Google Scholar]
- MET O, JENSEN KM, CHAMBERLAIN CA, DONIA M. & SVANE IM 2019. Principles of adoptive T cell therapy in cancer. Semin Immunopathol, 41, 49–58. [DOI] [PubMed] [Google Scholar]
- MOHAMED E, AL-KHAMI AA & RODRIGUEZ PC 2018. The cellular metabolic landscape in the tumor milieu regulates the activity of myeloid infiltrates. Cellular & Molecular Immunology, 15, 421–427. [DOI] [PMC free article] [PubMed] [Google Scholar]
- OCQUETEAU M, ORFAO A, ALMEIDA J, BLADE J, GONZALEZ M, GARCIA-SANZ R, LOPEZ-BERGES C, MORO MJ, HERNANDEZ J, ESCRIBANO L, CABALLERO D, ROZMAN M. & SAN MIGUEL JF 1998. Immunophenotypic characterization of plasma cells from monoclonal gammopathy of undetermined significance patients. Implications for the differential diagnosis between MGUS and multiple myeloma. Am J Pathol, 152, 1655–65. [PMC free article] [PubMed] [Google Scholar]
- PEPINO MY, KUDA O, SAMOVSKI D. & ABUMRAD NA 2014. Structure-function of CD36 and importance of fatty acid signal transduction in fat metabolism. Annu Rev Nutr, 34, 281–303. [DOI] [PMC free article] [PubMed] [Google Scholar]
- PERRY JSA, RUSSLER-GERMAIN EV, ZHOU YW, PURTHA W, COOPER ML, CHOI J, SCHROEDER MA, SALAZAR V, EGAWA T, LEE BC, ABUMRAD NA, KIM BS, ANDERSON MS, DIPERSIO JF & HSIEH CS 2018. Transfer of Cell-Surface Antigens by Scavenger Receptor CD36 Promotes Thymic Regulatory T Cell Receptor Repertoire Development and Allo-tolerance. Immunity, 48, 1271. [DOI] [PMC free article] [PubMed] [Google Scholar]
- SADE-FELDMAN M, YIZHAK K, BJORGAARD SL, RAY JP, DE BOER CG, JENKINS RW, LIEB DJ, CHEN JH, FREDERICK DT, BARZILY-ROKNI M, FREEMAN SS, REUBEN A, HOOVER PJ, VILLANI AC, IVANOVA E, PORTELL A, LIZOTTE PH, AREF AR, ELIANE JP, HAMMOND MR, VITZTHUM H, BLACKMON SM, LI B, GOPALAKRISHNAN V, REDDY SM, COOPER ZA, PAWELETZ CP, BARBIE DA, STEMMER-RACHAMIMOV A, FLAHERTY KT, WARGO JA, BOLAND GM, SULLIVAN RJ, GETZ G. & HACOHEN N. 2019. Defining T Cell States Associated with Response to Checkpoint Immunotherapy in Melanoma. Cell, 176, 404. [DOI] [PMC free article] [PubMed] [Google Scholar]
- SILVERSTEIN RL & FEBBRAIO M. 2009. CD36, a scavenger receptor involved in immunity, metabolism, angiogenesis, and behavior. Sci Signal, 2, re3. [DOI] [PMC free article] [PubMed] [Google Scholar]
- SINGH CK, CHHABRA G, NDIAYE MA, GARCIA-PETERSON LM, MACK NJ & AHMAD N. 2018. The Role of Sirtuins in Antioxidant and Redox Signaling. Antioxid Redox Signal, 28, 643–661. [DOI] [PMC free article] [PubMed] [Google Scholar]
- SPEISER DE, HO PC & VERDEIL G. 2016. Regulatory circuits of T cell function in cancer. Nat Rev Immunol, 16, 599–611. [DOI] [PubMed] [Google Scholar]
- STOCKWELL BR, FRIEDMANN ANGELI JP, BAYIR H, BUSH AI, CONRAD M, DIXON SJ, FULDA S, GASCON S, HATZIOS SK, KAGAN VE, NOEL K, JIANG X, LINKERMANN A, MURPHY ME, OVERHOLTZER M, OYAGI A, PAGNUSSAT GC, PARK J, RAN Q, ROSENFELD CS, SALNIKOW K, TANG D, TORTI FM, TORTI SV, TOYOKUNI S, WOERPEL KA & ZHANG DD 2017. Ferroptosis: A Regulated Cell Death Nexus Linking Metabolism, Redox Biology, and Disease. Cell, 171, 273–285. [DOI] [PMC free article] [PubMed] [Google Scholar]
- SU P, WANG Q, BI E, MA X, LIU L, YANG M, QIAN J. & YI Q. 2020. Enhanced Lipid Accumulation and Metabolism Are Required for the Differentiation and Activation of Tumor-Associated Macrophages. Cancer Res, 80, 1438–1450. [DOI] [PMC free article] [PubMed] [Google Scholar]
- SUBRAMANIAN A, TAMAYO P, MOOTHA VK, MUKHERJEE S, EBERT BL, GILLETTE MA, PAULOVICH A, POMEROY SL, GOLUB TR, LANDER ES & MESIROV JP 2005. Gene set enrichment analysis: a knowledge-based approach for interpreting genome-wide expression profiles. Proc Natl Acad Sci U S A, 102, 15545–50. [DOI] [PMC free article] [PubMed] [Google Scholar]
- TAGLIANI E, GUERMONPREZ P, SEPULVEDA J, LOPEZ-BRAVO M, ARDAVIN C, AMIGORENA S, BENVENUTI F. & BURRONE OR 2008. Selection of an antibody library identifies a pathway to induce immunity by targeting CD36 on steady-state CD8 alpha(+) dendritic cells. Journal of Immunology, 180, 3201–3209. [DOI] [PubMed] [Google Scholar]
- THOMMEN DS & SCHUMACHER TN 2018. T Cell Dysfunction in Cancer. Cancer Cell, 33, 547–562. [DOI] [PMC free article] [PubMed] [Google Scholar]
- TUMEH PC, HARVIEW CL, YEARLEY JH, SHINTAKU IP, TAYLOR EJ, ROBERT L, CHMIELOWSKI B, SPASIC M, HENRY G, CIOBANU V, WEST AN, CARMONA M, KIVORK C, SEJA E, CHERRY G, GUTIERREZ AJ, GROGAN TR, MATEUS C, TOMASIC G, GLASPY JA, EMERSON RO, ROBINS H, PIERCE RH, ELASHOFF DA, ROBERT C. & RIBAS A. 2014. PD-1 blockade induces responses by inhibiting adaptive immune resistance. Nature, 515, 568–71. [DOI] [PMC free article] [PubMed] [Google Scholar]
- VERDIN E, HIRSCHEY MD, FINLEY LW & HAIGIS MC 2010. Sirtuin regulation of mitochondria: energy production, apoptosis, and signaling. Trends Biochem Sci, 35, 669–75. [DOI] [PMC free article] [PubMed] [Google Scholar]
- WANG H, FRANCO F, TSUI YC, XIE X, TREFNY MP, ZAPPASODI R, MOHMOOD SR, FERNANDEZ-GARCIA J, TSAI CH, SCHULZE I, PICARD F, MEYLAN E, SILVERSTEIN R, GOLDBERG I, FENDT SM, WOLCHOK JD, MERGHOUB T, JANDUS C, ZIPPELIUS A. & HO PC 2020. CD36-mediated metabolic adaptation supports regulatory T cell survival and function in tumors. Nat Immunol, 21, 298–308. [DOI] [PMC free article] [PubMed] [Google Scholar]
- WANG W, GREEN M, CHOI JE, GIJON M, KENNEDY PD, JOHNSON JK, LIAO P, LANG X, KRYCZEK I, SELL A, XIA H, ZHOU J, LI G, LI J, LI W, WEI S, VATAN L, ZHANG H, SZELIGA W, GU W, LIU R, LAWRENCE TS, LAMB C, TANNO Y, CIESLIK M, STONE E, GEORGIOU G, CHAN TA, CHINNAIYAN A. & ZOU W. 2019. CD8(+) T cells regulate tumour ferroptosis during cancer immunotherapy. Nature, 569, 270–274. [DOI] [PMC free article] [PubMed] [Google Scholar]
- WOLCHOK JD, NEYNS B, LINETTE G, NEGRIER S, LUTZKY J, THOMAS L, WATERFIELD W, SCHADENDORF D, SMYLIE M, GUTHRIE T JR., GROB JJ, CHESNEY J, CHIN K, CHEN K, HOOS A, O’DAY SJ & LEBBE C. 2010. Ipilimumab monotherapy in patients with pretreated advanced melanoma: a randomised, double-blind, multicentre, phase 2, dose-ranging study. Lancet Oncol, 11, 155–64. [DOI] [PubMed] [Google Scholar]
- YANG WS, KIM KJ, GASCHLER MM, PATEL M, SHCHEPINOV MS & STOCKWELL BR 2016. Peroxidation of polyunsaturated fatty acids by lipoxygenases drives ferroptosis. Proc Natl Acad Sci U S A, 113, E4966–75. [DOI] [PMC free article] [PubMed] [Google Scholar]
- YANG WS, SRIRAMARATNAM R, WELSCH ME, SHIMADA K, SKOUTA R, VISWANATHAN VS, CHEAH JH, CLEMONS PA, SHAMJI AF, CLISH CB, BROWN LM, GIROTTI AW, CORNISH VW, SCHREIBER SL & STOCKWELL BR 2014. Regulation of ferroptotic cancer cell death by GPX4. Cell, 156, 317–331. [DOI] [PMC free article] [PubMed] [Google Scholar]
- YANG WS & STOCKWELL BR 2016. Ferroptosis: Death by Lipid Peroxidation. Trends Cell Biol, 26, 165–176. [DOI] [PMC free article] [PubMed] [Google Scholar]
- YI Q, ERIKSSON I, HE W, HOLM G, MELLSTEDT H. & OSTERBORG A. 1997. Idiotype-specific T lymphocytes in monoclonal gammopathies: evidence for the presence of CD4+ and CD8+ subsets. Br J Haematol, 96, 338–45. [DOI] [PubMed] [Google Scholar]
- ZAROUR HM 2016. Reversing T-cell Dysfunction and Exhaustion in Cancer. Clin Cancer Res, 22, 1856–64. [DOI] [PMC free article] [PubMed] [Google Scholar]
- ZHANG M, DI MARTINO JS, BOWMAN RL, CAMPBELL NR, BAKSH SC, SIMON-VERMOT T, KIM IS, HALDEMAN P, MONDAL C, YONG-GONZALES V, ABU-AKEEL M, MERGHOUB T, JONES DR, ZHU XG, ARORA A, ARIYAN CE, BIRSOY K, WOLCHOK JD, PANAGEAS KS, HOLLMANN T, BRAVO-CORDERO JJ & WHITE RM 2018. Adipocyte-Derived Lipids Mediate Melanoma Progression via FATP Proteins. Cancer Discov, 8, 1006–1025. [DOI] [PMC free article] [PubMed] [Google Scholar]
- ZYSSET D, WEBER B, RIHS S, BRASSEIT J, FREIGANG S, RIETHER C, BANZ Y, CERWENKA A, SIMILLION C, MARQUES-VIDAL P, OCHSENBEIN AF, SAURER L. & MUELLER C. 2016. TREM-1 links dyslipidemia to inflammation and lipid deposition in atherosclerosis. Nat Commun, 7, 13151. [DOI] [PMC free article] [PubMed] [Google Scholar]
Associated Data
This section collects any data citations, data availability statements, or supplementary materials included in this article.
Supplementary Materials
Table S1. Names and changes of gene sets or genes used for bioinformatic analysis. Related to Figure 3.
Data Availability Statement
All data and code to understand and assess the conclusion of this research are available in the main text, supplementary materials, or GEO Database (accession number GSE151160).