

Abstract
Terminating a voluntary muscle contraction is an important aspect of motor control and yet its neurophysiology is unclear. The objective of this study was to determine the role of short interval intracortical inhibition (SICI) by comparing SICI during relaxation from an isometric power grip with SICI during sustained contraction at the similar muscle activity level. Right-handed young adults relaxed from a sustained power grip following an auditory cue. The relaxation period was determined as the time for the flexor digitorum superficialis (FDS) muscle to reach its pre-contraction baseline level. SICI during relaxation was obtained at different times into the relaxation period (70%, 80%, 90% into the relaxation, as well as 25%, 50%, and 75% into the relaxation). In addition, SICI during sustained contraction was assessed while subjects maintained a power grip at the matching background FDS EMG levels (obtained during relaxation). The main finding was that the mean SICI was 37% greater during relaxation than during sustained contraction at the matching muscle activity level (p<0.05), indicating increased activation of intracortical inhibitory circuits for muscle relaxation. SICI gradually increased until 70% of the relaxation period (p<0.05). MEP decreased with progression of relaxation as well (p<0.05), reflecting gradual decreases in corticomotor excitability. This work supports the hypothesis that relaxation from a voluntary muscle contraction involves inhibitory activity in the primary motor cortex.
Keywords: SICI, inhibition, relaxation, electromyography, muscle contraction termination
1. Introduction
Termination of muscle contraction is an important aspect of motor control. Precise temporal modulation of muscle activity and associated limb force is necessary for many daily activities such as object manipulation (Kutz et al. 2007; Moerchen et al. 2007) and reaching (Kimura and Gomi 2009). Delays in initiation or termination of muscle activity can lead to inefficient grip force scaling during grip-and-lift tasks (Nowak et al. 2003; Nowak et al. 2007) and poor timing and coordination of movement (Nowak et al. 2007). Indeed, delays in initiation or termination of muscle activity often characterize motor deficit in Parkinson’s disease (Grasso et al. 1996), dystonia (Yazawa et al. 1999; Buccolieri et al. 2004b), and stroke (Seo et al. 2009; Kamper et al. 2003).
The active role of the brain in muscle relaxation has been demonstrated in previous studies (Rothwell et al. 1998; Terada et al. 1995; Toma et al. 1999; Dimitrov 1985). Imaging studies have shown that voluntary muscle relaxation is preceded and accompanied by activation of primary and supplementary motor areas (Terada et al. 1995; Toma et al. 1999; Pope et al. 2007). However, how these brain activities lead to the cessation of spinal motoneuron activity and mediate muscle relaxation remains unclear. One mechanism is the activation of intracortical inhibitory circuits. Specifically, muscle relaxation may be mediated by increased intracortical inhibition (Buccolieri et al. 2004a), leading to withdrawal of corticospinal input (Kamper et al. 2003; Rothwell et al. 1998) . Alternatively, muscle relaxation may be mediated by corticospinal activation of spinal inhibitory interneurons (Schieppati and Crenna 1985, 1984; Schieppati et al. 1986; Begum et al. 2005).
Two previous studies examining the role of short interval intracortical inhibition (SICI) in muscle relaxation have reported conflicting results (Begum et al. 2005; Buccolieri et al. 2004a). Both studies found changes in SICI approximately 20 to 70 ms prior to the termination of first dorsal interosseous (FDI) muscle activity. However, Buccolieri et al (2004a) found that SICI increased prior to FDI relaxation, whereas Begum et al (2005) found that SICI decreased prior to relaxation.
Such disparity in the findings could be due to different experimental settings such as the level of muscle activity just prior to stimulation, use of unilateral vs. bilateral contraction/relaxation and different transcranial magnetic stimulation (TMS) intensities. For instance, SICI decreases with increasing level of muscle activity (Ortu et al. 2008). Thus, changes in SICI observed before, during, and after muscle relaxation in Buccolieri et al (2004a) may have been due to changes in the level of muscle activity, and may not represent modulation of SICI specific to a person’s intention to relax. In Begum et al (2005), the level of muscle activity during relaxation just prior to stimulation or during baseline SICI measurement is unknown and thus incomparable. As for unilateral vs. bilateral relaxation, simultaneous contralateral muscle activity has been shown to be associated with increased interhemispheric inhibition (IHI) and thus suppressed SICI for the ipsilateral hand muscle (Yedimenko and Perez 2010). Thus, the increase in SICI observed during bilateral relaxation (Buccolieri et al. 2004a) could have been due to the release of IHI and subsequent disinhibition of SICI, rather than the modulation of SICI within a hemisphere.
In addition, different stimulation intensities were used to evoke SICI in the two studies. Begum et al (2005) used 90% and 110%-120% of the active motor threshold (AMT) as the conditioning and test stimulus intensities respectively (conditioning stimulus intensity = 35% ± 5% of the maximum stimulator output (MSO), test stimulus intensity = 46% ± 6% MSO). Facilitation can occur when both conditioning and test stimulus intensities are close to AMT (Di Lazzaro et al. 1999). Thus, it is possible that the results by Begum et al (2004a) may have been contaminated by cortical facilitation and therefore lacked inhibition during relaxation. On the other hand, Buccolieri et al (2004a) used conditioning stimulus intensities of 80% and 100% of AMT, while the test stimulus intensity was large enough to produce approximately 1 mV of peak-to-peak motor evoked potential (MEP) amplitude (conditioning stimulus intensity = 35% ± 5% MSO and test stimulus intensity = 59% ± 16% MSO). This large test stimulus intensity is consistent with other previous studies eliciting SICI (Peurala et al. 2008; Kujirai et al. 1993; Ortu et al. 2008).
Towards this end, we further investigated the comparative modulation of SICI during unilateral relaxation with that during sustained contraction at similar levels of muscle activity using appropriate stimulus intensities. The objective of this study was to determine the role of short interval intracortical inhibition by comparing SICI for the flexor digitorum superficialis (FDS) muscle (i) during voluntary relaxation from a unilateral isometric power grip and (ii) at comparable FDS activity levels during a sustained unilateral voluntary isometric power grip. Power grip was used for its functional prevalence and for the potential to extend the developed protocol to patient populations who may not have the abilities to perform precision pinch grip. The FDS muscle was examined because of its major role in power grip and functional activities (Kaufmann et al. 2007; Long et al. 1970). We hypothesized that SICI is greater during muscle relaxation than during sustained contraction. In addition to SICI, corticomotor excitability (MEP amplitudes) was compared during the relaxation period and during sustained contraction. In the initial investigation, no change in SICI was observed with progression of relaxation from 70% to 90% of the relaxation period (Study 1). To demonstrate dynamic changes of SICI with relaxation, an additional study was conducted to describe SICI changes over a wider range of the relaxation period (during maximum power grip, 25%, 50% and 75% into muscle relaxation, and during rest; Study 2).
2. Methods
2.1. Subjects
Eleven right-handed subjects (24 ± 5 years old, 3 females and 8 males) participated in Study 1. Twelve right-handed healthy young adults (23 ± 4 years old, 3 females and 9 males) participated in Study 2. Participants did not have a known history of neurological and musculoskeletal disorders participated in. All the subjects signed a written informed consent form approved by the University of Wisconsin-Milwaukee Institutional Review Board.
2.2. Study 1
SICI at 70%, 80%, and 90% into the relaxation from a voluntary power grip was quantified and compared to the SICI during a sustained power grip. The dominant (right) FDS muscle and the left motor cortex were tested for all subjects. First, to decide the time to elicit SICI, each subject’s muscle relaxation period was determined. Second, SICI during relaxation from a maximal voluntary isometric power grip was determined in Experiment 1. SICI during a sustained voluntary isometric power grip at a comparable muscle activity level was determined in Experiment 2 (to control for background muscle activity that affects SICI).
2.2.1. Determination of the muscle relaxation period
Subjects were seated on a height-adjustable chair in front of a table with a cylindrical handle and a computer screen on top (Fig. 1). The chair height and handle location were adjusted so that at rest, subjects had their fingers comfortably around the handle in a grasping posture, with the right shoulder flexed at approximately 20°, the elbow flexed at approximately 100°, the forearm resting on the table in the midprone position, and the wrist in neutral posture. The left hand and forearm were also resting on the table. Electromyography (EMG) for the FDS muscle was recorded using adhesive Ag-AgC1 bipolar surface electrodes (Bortec Biomedical Ltd., Calgary, Alberta, Canada) placed on the skin overlying the FDS muscle according to the literature (Basmajian 1989).
Fig. 1.
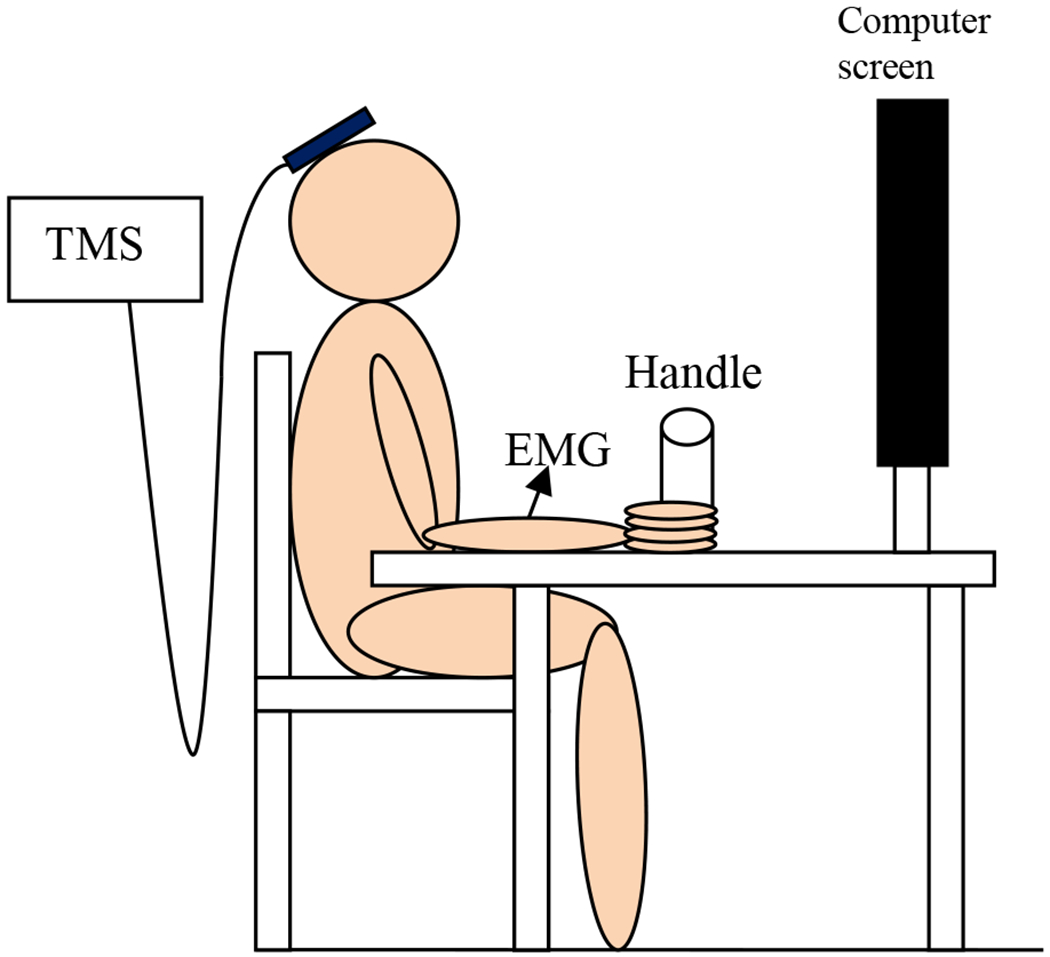
Experimental set up for both Studies 1 and 2
In the posture described above, subjects were instructed to relax, and then grip the handle as hard as they could upon hearing a computer-generated sound, maintain the grip for the duration of the sound, and relax as quickly as possible upon termination of the sound. Subjects were instructed to stay relaxed for the next 4 s (Fig. 2). The sound lasted for 4 s. The subjects were instructed not to contract muscles in other limbs. The subjects were also instructed not to open their fingers during grip relaxation. The EMG was recorded at 2 kHz throughout the grip-and-relax trial, using NI BNC 2021 (National Instruments Corp., Austin, Texas, USA).
Fig. 2.
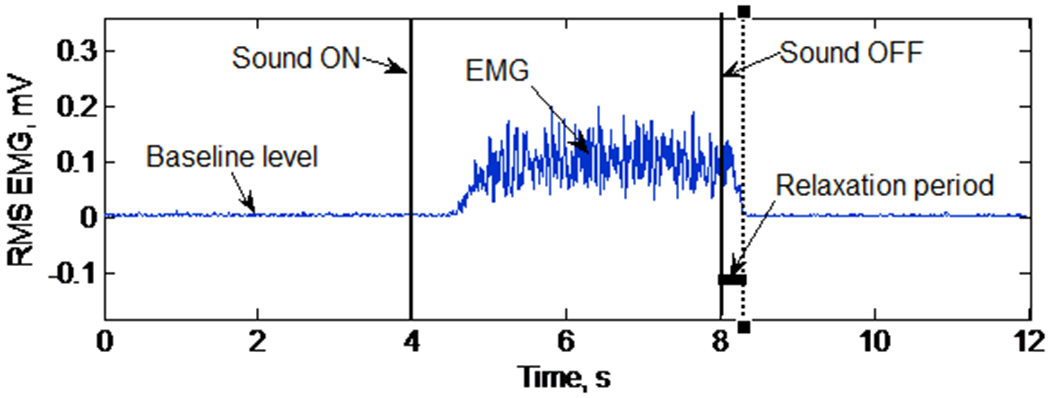
RMS EMG during a single grip-and-relax trial for determination of the muscle relaxation period
The muscle relaxation period was determined as the time interval between when the sound ended and when the FDS muscle activity decreased to its precontraction baseline level (Fig. 2). Specifically, the root mean square (RMS) values of EMG data with a 20-ms moving window were obtained using a custom-made LabVIEW program (National Instruments Corp., Austin, Texas, USA). The baseline EMG level was determined as the mean of RMS EMG data for a 3 s period immediately before the sound. The FDS muscle activity was determined to have decreased to the baseline level when the FDS RMS EMG was less than the mean + 3 standard deviations (SD) of the baseline EMG level for at least 50 ms after the sound ended (Seo et al. 2009).
Subjects had several practices until they became familiarized with the grip-and-relax trial. After practice, subjects performed 5 grip-and-relax trials. The mean relaxation period of these 5 trials determined the subject’s muscle relaxation period. The mean (± SD) muscle relaxation period across all subjects of Study 1 was 339 (± 21) ms.
2.2.2. Experiment 1: SICI during relaxation
SICI during the relaxation phase of the grip-and-relax trials was determined using TMS (The Magstim Company Ltd, Wales, UK) in Experiment 1. A70 mm figure of eight coil was placed over the ‘hotspot’ of the contralateral cortex representing the right FDS muscle (approximately 6 cm anterolateral to vertex of the skull) (Fig. 1). The handle of the coil was postero-lateral at an approximately 45° angle to the midsagittal plane. The coil was held in position by an adjustable stand and the subjects rested their head on a chin rest (not shown in Fig. 1) to ensure that they were relaxed and the coil position was not disturbed during the experiment. Coil position was checked regularly throughout the data collection session.
The paired pulse technique was used to determine SICI (Kujirai et al. 1993). The test stimulus intensity was set at the % MSO that evoked peak-to-peak nonconditioned MEP amplitude of 1 mV in the resting FDS muscle. Mean test stimulus intensity (± standard error, SE) across all subjects in Study 1 was 176% (± 13%) of AMT. To evoke a conditioned MEP, the suprathreshold test stimulus was preceded by a subthreshold conditioning stimulus with a 2 ms interstimulus interval (ISI). The subthreshold conditioning stimulus intensity was set at 90% of the AMT. These conditioning and test stimulus intensities with the ISI of 2 ms were chosen to minimize contamination of SICI by intracortical facilitatory pathways (Peurala et al. 2008). SICI was determined using Equation 1, as used by Coxon et al (2006).
| Equation 1 |
The AMT was determined as the %MSO that evoked a peak-to-peak MEP amplitude of 100 μV, at least 5 times in response to 10 stimuli while the person was maintaining the RMS EMG at 10% of the maximum voluntary contraction (MVC), according to Rossini et al (1994). The muscle activation level at 10% MVC was successfully achieved by providing subjects with visual feedback on the computer screen and verbal feedback by examiners. The screen showed real-time RMS EMG along with a target line. Subjects were instructed to match their real-time EMG to the target during determination of the AMT.
SICI was determined at 70%, 80% and 90% into each subject’s muscle relaxation period (after the sound ended) during the grip-and-relax trials (Fig. 3 a, b). SICI was evoked at these times because changes in SICI were expected at approximately 80% into the muscle relaxation period according to previous studies (Begum et al. 2005; Buccolieri et al. 2004a). Ten conditioned and ten nonconditioned MEPs were evoked at these three stimulation times in a random order. Mean values of ten conditioned and ten nonconditioned MEPs were used to compute SICI (Equation 1).
Fig. 3.
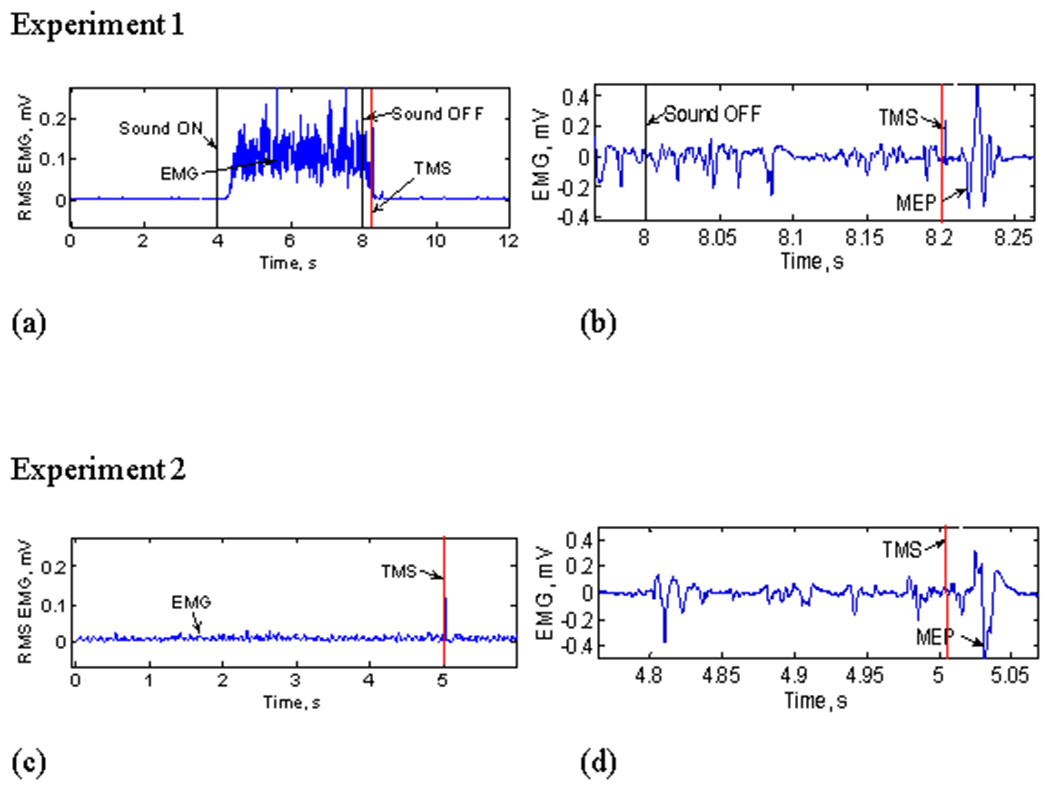
(a) RMS EMG for the entire grip-and-relax trial in Experiment 1 (for both Studies 1 and 2). Stimulation was delivered during relaxation after grip. (b) Raw EMG during relaxation, showing MEP (note different time scales; for both Studies 1 and 2). (c) RMS EMG showing a sustained contraction trial in Experiment 2 (for both Studies 1 and 2). (d) Raw EMG showing the stimulation timing and MEP at the comparable background FDS RMS EMG during Experiment 2 (for both Studies 1 and 2).
2.2.3. Experiment 2: SICI during sustained contraction
SICI during sustained contraction at comparable muscle activity levels was determined. Specifically, the three background background EMG levels at 70%, 80%, and 90% into the muscle relaxation period in Experiment 1 were targeted. The background EMG level was determined as the mean RMS EMG for a 20 ms period immediately before the stimulus. Subjects were instructed to maintain the target EMG level using visual feedback on the computer screen and verbal feedback by the examiners. Stimulation was delivered while subjects were holding the target EMG level (Fig. 3 c, d). At each of the three background EMG levels, nonconditioned and conditioned MEPs were evoked 10 times to determine SICI (Equation 1).
Trials were discarded if they did not have background EMG levels within the mean ± SD of the Experiment 1 background EMG levels. This was to ensure that muscle activity levels were similar during relaxation (Experiment 1) and sustained contraction (Experiment 2) to permit comparisons of SICI. The same motor units are expected to be active for both Experiments 1 and 2, as motor units follow an orderly recruitment and de-recruitment (i.e., the motor units recruited at low forces are de-recruited at the similar low forces, and motor units recruited at high forces are de-recruited at high forces (De Luca et al. 1982).
2.2.4. Statistical Analysis
Repeated measure ANOVA was performed for the main and interaction effects of two within-subject variables (contraction condition and stimulation time) on the response variable of SICI. The contraction condition factor had two levels (relaxation vs. sustained contraction). The stimulation time had three levels (70%, 80% and 90% of the relaxation period). The significance level was set at 0.05. For the secondary objective, another repeated measure ANOVA was performed to examine the main and interaction effects of contraction condition, stimulation time and the type of stimulus (single vs. paired) on the peak-to-peak MEP amplitudes. Lastly, to check if background EMGs were similar between the contraction conditions, another repeated measures ANOVA was performed to determine the main and interaction effects of contraction condition and stimulation time on background FDS EMG values (%MVC). When ANOVA revealed significant effects, post hoc Tukey’s tests were performed to identify pairwise differences.
2.3. Study 2
To observe dynamic changes of SICI with relaxation, the same study was repeated with SICI measurements at 25%, 50% and 75% into muscle relaxation (Experiment 1) and during sustained contraction at the matching muscle activities (Experiment 2). Changes of SICI for the FDS muscle relaxation from power grip may have occurred earlier than 70% into the muscle relaxation period in Study 1. In addition to SICI measurements during relaxation and sustained contraction, SICI during maximum power grip and at rest were recorded to obtain a complete picture of the SICI changes with relaxation. Mean (± SD) relaxation time across all subjects of Study 2 was 520 (± 54) ms. Mean test stimulus intensity (± SE) across all subjects for Study 2 was 192% (± 6%) AMT. In addition to the FDS EMG, the antagonist EMG from the extensor digitorum communis (EDC) muscle was recorded to examine if SICI was influenced by the EDC activity. All statistical analyses in Study 1 were performed for Study 2. In addition, paired t-tests were used to compare SICI during maximum grip with SICI at 25% into the relaxation period, and SICI at rest with SICI at 75% into the relaxation period. Furthermore, repeated measure ANOVA was performed for the main and interaction effects of the stimulation time and contraction condition on the background EDC EMG level to examine how the EDC EMG level changed during relaxation.
3. Results
3.1. Study 1
SICI assessed in FDS was 41% greater across the three relaxation time periods (mean ± SE, = 34.3% ± 2.8%) than when sustaining an active contraction at comparable muscle activity levels (24.3% ± 2.9%) (Fig. 4a, Table 1A). Repeated measure ANOVA showed a significant main effect for contraction condition (relaxation vs. sustained contraction) on SICI (p = 0.003, F(1, 50) = 9.67, , effect size, = 0.16). The main effect of stimulation time (p = 0.988, F (2, 50) = 0.01) and the interaction between stimulation time and contraction condition (p = 0.969, F (2, 50) = 0.03) were not found to significantly affect SICI.
Fig. 4.
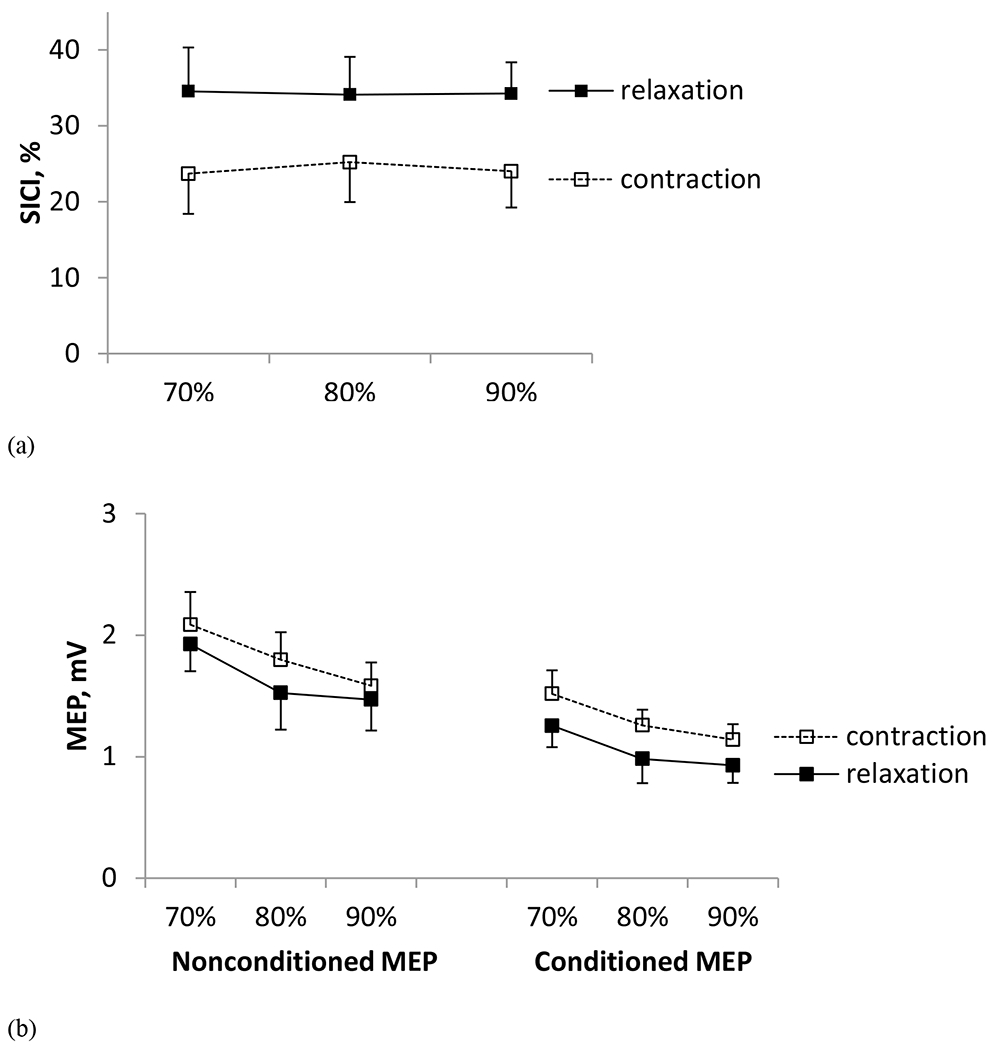
(a) Mean ± SE SICI obtained during 70%, 80% and 90% into the relaxation period during the grip-and-relax trials (Experiment 1) and sustained contraction trials at the matching background EMG levels (Experiment 2) in Study 1. SICI was 41% greater during relaxation than sustained contraction (p < 0.05). (b) Mean ± SE nonconditioned and conditioned MEPs obtained during 70%, 80% and 90% into the muscle relaxation period (Experiment 1) and during sustained contraction at the matching background EMG levels (Experiment 2) in Study 1.
Table 1.
Mean (SE) and [95% confidence interval] for nonconditioned and conditioned MEPs, SICI, and background FDS EMG levels in Study 1 (A) and Study 2 (B). The mean SICI was calculated from individual subjects’ SICI values, not the mean MEP amplitudes shown in the table.
| (a) Study 1 | ||||||
|---|---|---|---|---|---|---|
| Voluntary relaxation | Sustained contraction | |||||
| 70% | 80% | 90% | 70% | 80% | 90% | |
| Nonconditioned MEP (mV) | 1.9 (0.2) [1.4, 2.4] |
1.5 (0.3) [0.9, 2.2] |
1.5 (0.3) [0.9, 2.0] |
2.1 (0.3) [1.5, 2.7] |
1.8 (0.2) [1.3, 2.3] |
1.6 (0.2) [1.2, 2.0] |
| Conditioned MEP (mV) | 1.3 (0.2) [0.9, 1.6] |
1.0 (0.2) [0.5, 1.4] |
0.9 (0.1) [0.6, 1.2] |
1.5 (0.2) [1.1, 1.9] |
1.3 (0.1) [1.0, 1.5] |
1.1 (0.1) [0.9, 1.4] |
| SICI (%) | 34.5 (5.8) [21.6, 47.3] |
34.1 (5.0) [23.0. 45.2] |
34.3 (4.1) [25.1, 43.3] |
23.7 (5.3) [11.9, 35.5] |
25.2 (5.2) [13.6, 36.8] |
24.0 (4.8) [12.4, 34.7] |
| Background FDS EMG (% MVC) | 24.4 (3.1) [14.7, 34.2] |
13.4 (1.5) [8.7, 18.1] |
8.1 (1.0) [4.9, 11.3] |
24.3 (2.4) [16.6, 32.1] |
16.8 (1.2) [12.9, 20.7] |
13.1 (1.0) [10.0, 16.1] |
| (b) Study 2 | ||||||||
|---|---|---|---|---|---|---|---|---|
| Maximum power grip | Voluntary relaxation | Sustained contraction | Rest | |||||
| 25% | 50% | 75% | 25% | 50% | 75% | |||
| Nonconditioned MEP (mV) | 3.6 (0.5) [2.5, 4.8] |
3.2 (0.4) [2.3, 4.2] |
2.7 (0.4) [1.8, 3.7] |
1.9 (0.3) [1.2, 2.7] |
3.6 (0.6) [2.2, 5.0] |
2.7 (0.6) [1.4, 4.1] |
1.7 (0.2) [1.2, 2.3] |
1.0 (0.2) [0.6, 1.4] |
| Conditioned MEP (mV) | 3.3 (0.5) [2.3, 4.5] |
2.3 (0.4) [1.3, 3.2] |
1.7 (0.3) [1.0, 2.3] |
0.7 (0.2) [0.4, 1.1.] |
3.1 (0.6) [1.7, 4.5] |
1.9 (0.5) [0.7, 3.1] |
0.8 (0.2) [0.4, 1.3] |
0.3 (0.1) [0.2, 0.4] |
| SICI (%) | 7.9 (3.5) [0.3, 15.6] |
29.9 (7.1) [14.4, 45.5] |
40.6 (6.3) [26.8, 54.4] |
57.3 (6.9) [42.0, 72.6] |
16.1 (5.8) [3.3, 29.0] |
31.7 (7.8) [14.5, 48.8] |
49.1 (8.6) [30.2, 68.8] |
56.3 (7.9) [39.0, 73.6] |
| Background FDS EMG (% MVC) | 104.2 (6.0) [93.3, 118.9] |
68.7 (9.2) [48.5, 88.9] |
37.7 (8.8) [18.5, 56.9] |
13.2 (5.8) [0.5, 25.9] |
66.9 (9.0) [47.1, 86.7] |
36.6 (8.5) [17.9, 55.3] |
12.8 (5.2) [1.2, 24.5] |
3.8 (0.6) [2.5, 5.0] |
Mean peak-to-peak amplitudes of nonconditioned and conditioned MEP decreased with progression of muscle relaxation in Experiment 1 (Table 1A, Fig. 4b). They also decreased with decreasing muscle activity in Experiment 2 (Table 1A, Fig. 4b). Mean nonconditioned MEP (1.7 ± 1.9 mV) was 32% greater than mean conditioned MEP (1.2 ± 1.3 mV). Repeated measure ANOVA showed significant main effects of stimulation time (p < 0.001, F (2, 110) = 8.68, = 0.14), stimulus type (single vs. paired; p < 0.001, F (1, 110) = 42.64, = 0.28), and contraction condition (p = 0.012, F (1, 110) = 6.58, = 0.06) on peak-to-peak MEP amplitude. The second-and third-order interactions between contraction condition, stimulus type, and stimulation time were not found to be significant (p > 0.686). Post hoc Tukey test revealed that the peak-to-peak MEP amplitude was greater at 70% into relaxation than 80% (p = 0.011) and 90% into the relaxation (p = 0.001). The MEP size did not differ between 80% and 90% into the relaxation (p = 0.535).
Background FDS EMG amplitudes were similar between the two contraction conditions (Table 1A). The main effect of contraction condition (p = 0.078, F (1, 50) = 3.24) and the interaction between contraction condition and stimulation time were not significant (p = 0.386, F (2, 50) = 0.97). Background FDS EMG amplitudes varied with stimulation time (p < 0.001, F (2, 50) = 27.67, = 0.53).
3.2. Study 2
SICI assessed in the FDS muscle was 32% greater during muscle relaxation (42.6% ± 4.2% when pooled for the three times) than during sustained contraction at the matching background muscle activity (32.3% ± 4.8%) (Table 1b, Figure 5a), consistent with Study 1. Different from Study 1, SICI increased with the progression of relaxation. Repeated measure ANOVA showed significant main effects of contraction condition (p = 0.009, F (1, 55) = 7.31, = 0.64) and stimulation time (p < 0.001, F (2, 55) = 20.90, = 0.43) on SICI. The interaction between stimulation time and contraction condition was not significant (p = 0.809, F (2, 55) = 0.21). Post-hoc Tukey tests revealed that SICI significantly increased over the relaxation period (25% vs. 50% vs. 75%), indicating dynamic changes of SICI during relaxation (p < 0.05). The paired t-tests showed that SICI increased significantly from maximum power grip to 25% into the relaxation period (p = 0.027, t (11) =−2.55). The SICI value at 75% into relaxation was comparable to that at rest (p = 0.861, t (11) =−0.18; Figure 5a).
Fig. 5.
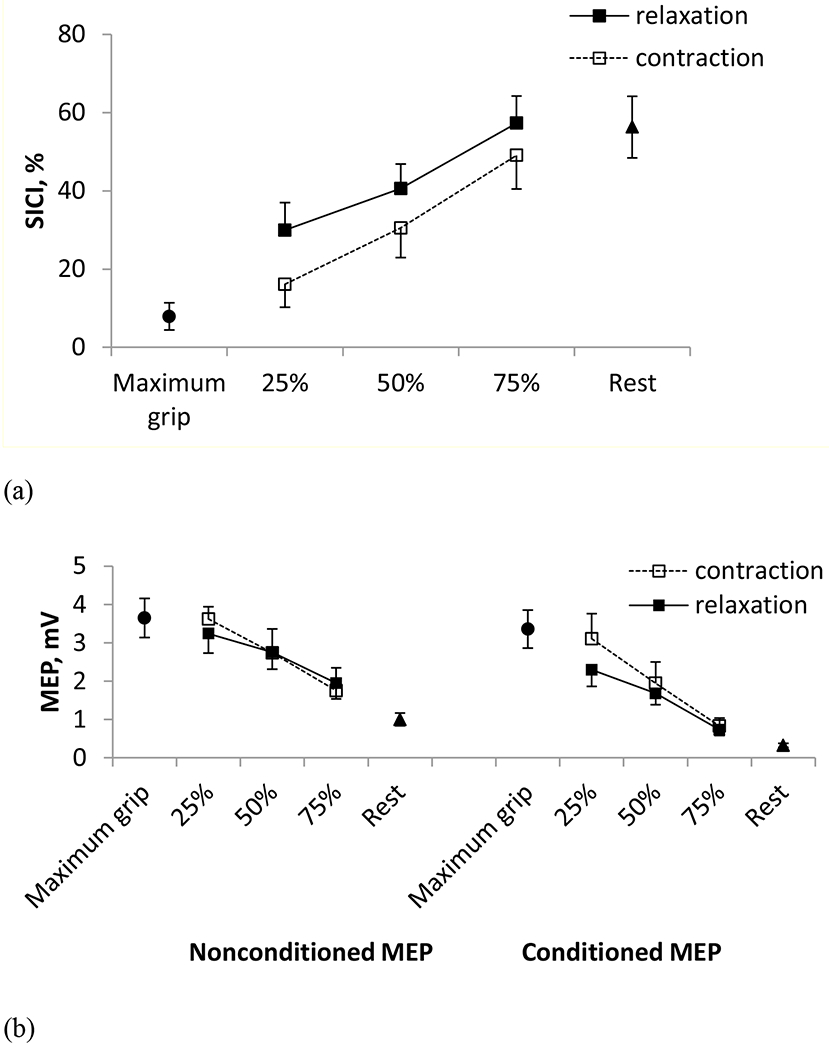
(a) Mean ± SE SICI obtained during maximal power grip, at 25%, 50% and 75% into the relaxation period during the grip-and-relax trials (Experiment 1) as well as at sustained contractions at the matching background EMG levels (Experiment 2), and at rest in Study 2. SICI was 32% greater for relaxation than sustained contraction (p < 0.05). (b) Mean ± SE nonconditioned and conditioned MEPs obtained during maximal power grip, during 25%, 50% and 75% into the muscle relaxation period (Experiment 1), during sustained contraction at the matching background EMG levels (Experiment 2), and at rest in Study 2.
Consistent with Study 1, mean peak-to-peak amplitudes of nonconditioned and conditioned MEP decreased with progression of muscle relaxation in Experiment 1 and with decreasing FDS activity in Experiment 2 (Table 1b, Fig. 5b). Mean nonconditioned MEP (2.7 ± 0.4 mV) was 34 % greater than mean conditioned MEP (1.8 ± 0.3 mV). Repeated measure ANOVA showed significant main effects of stimulation time (p < 0.001, F (2, 123) = 35.04, = 0.36) and stimulus type (single vs. paired; p < 0.001, F (1, 123) = 28.70, = 0.19) on peak-to-peak MEP amplitude. The peak-to-peak MEP amplitude did not vary with contraction condition and the second-and third-order interactions (p > 0.205).
Consistent with Study 1, the background FDS EMG amplitudes were similar between the two contraction conditions in Study 2 (Table 1b). The main effect of contraction condition (p = 0.921, F (1, 55) = 0.01) and the interaction between contraction condition and stimulation time were not significant (p = 0.996, F (2, 55) = 0.00). Background FDS EMG amplitudes decreased as the relaxation progressed and as the target level of the sustained contraction decreased (p < 0.001, F (2, 55) = 8.12, = 0.56).
Examination of the antagonist muscle activity showed that both FDS and EDC muscles were active during maximum power grip, and their EMG level decreased in the same manner (Fig. 6) as the grip relaxation progressed (in Experiment 1) and as the target FDS EMG level decreased (in Experiment 2). This reduction of EDC EMG with progression of the relaxation indicates that subjects followed the instruction and did not extend their fingers to terminate the grip. Background EDC EMG decreased gradually with stimulation time (p < 0.001, F (2, 54) = 30.65). Background EDC EMG levels were similar between Experiments 1 and 2 (p = 0.071, F (1, 54) = 3.39).
Fig. 6.
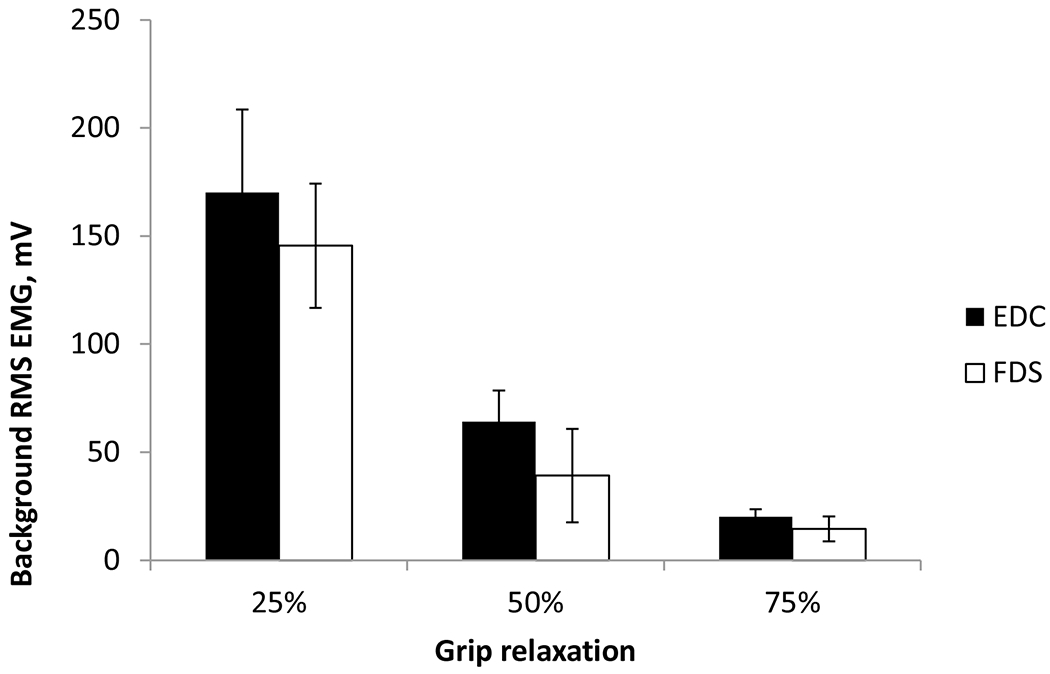
Mean ± SE background FDS and EDC RMS EMG at 25%, 50%, and 75% into the relaxation period. The error bar denotes a standard deviation
4. Discussion
4.1. Modulation of SICI according to the contraction condition
The objective of this study was to determine the role of short interval intracortical inhibition by comparing SICI for the FDS muscle during a voluntary relaxation from a unilateral isometric power grip to the SICI during sustained isometric power grip at comparable levels of FDS activation. Comparable levels of activation were achieved using visual feedback in the present study. The main finding of the present study was that SICI was, on average, 37% greater during voluntary relaxation from a power grip than sustained power grip at comparable muscle activity levels in healthy adults (from both Studies 1 and 2; Fig. 4a). This result suggests that activation of intracortical inhibitory circuits may assist with muscle relaxation.
Our results are in agreement with Buccolieri et al (2004a), despite the methodological differences (unilateral vs. bilateral relaxation, relaxation from a 100% vs. 20% MVC, power grip vs. index finger abduction). Although power grip may involve direct corticospinal pathways to a lesser degree than fine motor control, increase in SICI was observed with relaxation from power grip in the present study. It may be because motor cortical excitability changes for power grip and fine motor control similarly but with different magnitudes (Flament et al. 1993). Our finding is in line with previous brain imaging studies that demonstrated increased activation of the M1 and supplementary motor areas during voluntary muscle relaxation (Terada et al. 1995; Toma et al. 1999; Rothwell et al. 1998; Pope et al. 2007). Elevation of SICI during relaxation may be able to cease the ongoing muscle contraction through either reduced corticospinal facilitatory output or by activating spinal inhibitory neurons via a network of interneurons. Either way, reduced excitability of spinal motoneurons during voluntary muscle relaxation has been evidenced in previous studies (Schieppati and Crenna 1985, 1984).
The greater inhibition during muscle relaxation observed in the present study and Buccolieri et al (2004a) is not in agreement with the other previous study (Begum et al. 2005), possibly due to the different stimulation parameters. Begum et al (2005) found reduced SICI during muscle relaxation. Both conditioning and test stimulus intensities close to AMT could result in contamination of SICI by intracortical facilitation (Di Lazzaro et al. 1999). In contrast to Begum et al (2005), the present study and Buccolieri et al (2004a) used a large test stimulus intensity to minimize contamination of SICI by intracortical facilitatory circuits (Kujirai et al. 1993; Ortu et al. 2008; Buccolieri et al. 2004a; Coxon et al. 2006). The test stimulation intensities used in the present study are also in agreement with the acceptable range (110-150% RMT) to evoke SICI (Garry and Thomson 2009). Based on the relationship between AMT and RMT (AMT = 0.82 RMT) (Ngomo et al. 2012), the test stimulation intensity used in our study (176% ± 13% AMT for Study 1 and 192% ± 6% AMT for Study 2) may be interpreted as 150% RMT. Therefore, the stimulation parameters used in the present study appear to be acceptable for the current investigation of SICI according to the available evidence.
A remote possibility exists that the visual cue provided to subjects to relax muscle in (Begum 2005) may have triggered a different brain mechanism compared to auditory cues provided in the present study and Buccolieri et al (2004a). However, literature demonstrating different effects of sound and visual stimuli on M1 excitability is unavailable. Although cortical excitability can be suppressed by unexpected loud, startling auditory stimulation (greater than 80 dB) (Furubayashi et al. 2000), the sound used in the present study was not startling (approximately at 60 dB) and was expected as the subjects knew in advance that the initiation and cessation would be cued by the sound. Therefore, it is unlikely that the greater SICI during relaxation than during sustained contraction was caused by the sound used in the present study.
Lastly, the increased SICI for relaxation reported in the present study may not have been caused by the antagonist (EDC) muscle activity. The EDC muscle was active during maximum grip, as co-contraction is typically observed in power grip (Schieppati et al. 1996; Flament et al. 1993). The EDC EMG decreased during grip relaxation in the same manner with the FDS EMG (Fig. 6). Since antagonist muscle activity increases SICI (Christova et al. 2003), reduced EDC EMG with relaxation would have resulted in reduction of SICI with relaxation, if changes in SICI observed in our study were due to the EDC activity. Instead, SICI increased with the progression of relaxation in Study 2, supporting that the increase in SICI for grip relaxation is due to increased excitability of intracortical inhibitory circuits, not due to the antagonist activity.
4.2. Changes in SICI with progression of relaxation
SICI was the lowest during the maximum power grip, increased gradually from 25% to 75% into relaxation, and was the highest at rest in Study 2, Experiment 1 (Table 1b, Fig. 5a). When examined only during the 70% to 90% of the relaxation period, such changes in SICI were not apparent in Study 1 (Table 1a, Fig. 4a), suggesting that the reduction of SICI occurs as early as 25% of the relaxation period and plateaus at or before 70% of the relaxation period.
Both the conditioned and nonconditioned MEPs decreased with the progression of relaxation from 25% to 90% of the relaxation period (in both Studies 1 and 2), indicating that the associated changes in the corticomotor excitability continue to occur even after SICI has reached a plateau. This order of increase in SICI followed by decrease in MEP is supported by the previous study (Buccolieri et al. 2004a).
SICI increased as the target contraction level decreased in Study 2, Experiment 2. This was expected because increased muscle activity leads to decreased SICI (Ortu et al. 2008). Such a pattern of increase in SICI with decreased target contraction level was not seen in Study 1. It is possible that the three muscle activity levels used in Study 1 were not very different from each other in magnitude (RMS EMG of 24%, 17% and 13% MVC for the three target background FDS EMG) to result in statistically significant changes in SICI.
5. Conclusion
The present study demonstrated that cortical inhibitory pathways show greater activation during voluntary relaxation than during sustained contraction at the comparable FDS muscle activity levels in healthy individuals. The results suggest that SICI is a general phenomenon that helps initiate and maintain progressive relaxation following withdrawal of descending corticospinal drive. This finding suggests that inhibitory intracortical pathways play an important role in mediating muscle relaxation. The functional implication of this finding is that disturbances of the cortical inhibitory pathways may lead to difficulties in terminating the voluntary muscle relaxation or “letting go” such as after stroke (Seo et al. 2009; Chae et al. 2002).
References:
- Basmajian JV (1989) Biofeedback: Principles and Practice for Clinicians. 3rd edn. Williams & Wilkins, Baltimore [Google Scholar]
- Begum T, Mima T, Oga T, Hara H, Satow T, Ikeda A, Nagamine T, Fukuyama H, Shibasaki H (2005) Cortical mechanisms of unilateral voluntary motor inhibition in humans. Neurosci Res 53 (4):428–435. 10.1016/j.neures.2005.09.002 [doi] [DOI] [PubMed] [Google Scholar]
- Buccolieri A, Abbruzzese G, Rothwell JC (2004a) Relaxation from a voluntary contraction is preceded by increased excitability of motor cortical inhibitory circuits. J Physiol 558 (Pt 2):685–695. 10.1113/jphysiol.2004.064774 [doi] jphysiol.2004.064774 [pii] [DOI] [PMC free article] [PubMed] [Google Scholar]
- Buccolieri A, Avanzino L, Marinelli L, Trompetto C, Marchese R, Abbruzzese G (2004b) Muscle relaxation is impaired in dystonia: a reaction time study. Mov Disord 19 (6):681–687. 10.1002/mds.10711 [doi] [DOI] [PubMed] [Google Scholar]
- Chae J, Yang G, Park BK, Labatia I (2002) Delay in initiation and termination of muscle contraction, motor impairment, and physical disability in upper limb hemiparesis. Muscle Nerve 25 (4):568–575. 10.1002/mus.10061 [pii] [DOI] [PubMed] [Google Scholar]
- Christova M, Pondev N, Christova L, Wolf W, Kossev A (2003) Dependence of intracortical inhibition and facilitation on the level of CO-activity of antagonist muscles. Comptes Rendus de l’Academie Bulgare des Sciences 56 (9):77 [Google Scholar]
- Coxon JP, Stinear CM, Byblow WD (2006) Intracortical inhibition during volitional inhibition of prepared action. J Neurophysiol 95 (6):3371–3383. 10.1152/jn.01334.2005 [doi] [DOI] [PubMed] [Google Scholar]
- De Luca CJ, LeFever RS, McCue MP, Xenakis AP (1982) Behaviour of human motor units in different muscles during linearly varying contractions. J Physiol 329:113–128 [DOI] [PMC free article] [PubMed] [Google Scholar]
- Di Lazzaro V, Rothwell JC, Oliviero A, Profice P, Insola A, Mazzone P, Tonali P (1999) Intracortical origin of the short latency facilitation produced by pairs of threshold magnetic stimuli applied to human motor cortex. Exp Brain Res 129 (4):494–499 [DOI] [PubMed] [Google Scholar]
- Dimitrov B (1985) Brain potentials related to the beginning and to the termination of voluntary flexion and extension in man. International Journal of Psychophysiology 3 (1):13–22 [DOI] [PubMed] [Google Scholar]
- Flament D, Goldsmith P, Buckley CJ, Lemon RN (1993) Task dependence of responses in first dorsal interosseous muscle to magnetic brain stimulation in man. J Physiol 464:361–378 [DOI] [PMC free article] [PubMed] [Google Scholar]
- Furubayashi T, Ugawa Y, Terao Y, Hanajima R, Sakai K, Machii K, Mochizuki H, Shiio Y, Uesugi H, Enomoto H, Kanazawa I (2000) The human hand motor area is transiently suppressed by an unexpected auditory stimulus. Clin Neurophysiol 111 (1):178–183. doi:S1388-2457(99)00200-X [pii] [DOI] [PubMed] [Google Scholar]
- Garry MI, Thomson RH (2009) The effect of test TMS intensity on short-interval intracortical inhibition in different excitability states. Exp Brain Res 193 (2):267–274. 10.1007/s00221-008-1620-5 [doi] [DOI] [PubMed] [Google Scholar]
- Grasso M, Mazzini L, Schieppati M (1996) Muscle relaxation in Parkinson’s disease: a reaction time study. Mov Disord 11 (4):411–420. 10.1002/mds.870110410 [doi] [DOI] [PubMed] [Google Scholar]
- Kamper DG, Harvey RL, Suresh S, Rymer WZ (2003) Relative contributions of neural mechanisms versus muscle mechanics in promoting finger extension deficits following stroke. Muscle Nerve 28 (3):309–318. 10.1002/mus.10443 [doi] [DOI] [PubMed] [Google Scholar]
- Kaufmann RA, Kozin SH, Mirarchi A, Holland B, Porter S (2007) Biomechanical analysis of flexor digitorum profundus and superficialis in grip-strength generation. Am J Orthop (Belle Mead NJ) 36 (9):E128–132 [PubMed] [Google Scholar]
- Kimura T, Gomi H (2009) Temporal development of anticipatory reflex modulation to dynamical interactions during arm movement. J Neurophysiol 102 (4):2220–2231. 10.1152/jn.90907.2008 [doi] [DOI] [PubMed] [Google Scholar]
- Kujirai T, Caramia MD, Rothwell JC, Day BL, Thompson PD, Ferbert A, Wroe S, Asselman P, Marsden CD (1993) Corticocortical inhibition in human motor cortex. J Physiol 471:501–519 [DOI] [PMC free article] [PubMed] [Google Scholar]
- Kutz DF, Wölfel A, Timmann D, Kolb FP (2007) Detection of changes in grip forces on a sliding object. Journal of Neuroscience Methods 166 (2):250–258 [DOI] [PubMed] [Google Scholar]
- Long C 2nd, Conrad PW, Hall EA, Furler SL (1970) Intrinsic-extrinsic muscle control of the hand in power grip and precision handling. An electromyographic study. J Bone Joint Surg Am 52 (5):853–867 [PubMed] [Google Scholar]
- Moerchen VA, Lazarus JC, Gruben KG (2007) Task-dependent organization of pinch grip forces. Exp Brain Res 180 (2):367–376. 10.1007/s00221-007-0864-9 [doi] [DOI] [PubMed] [Google Scholar]
- Ngomo S, Leonard G, Moffet H, Mercier C (2012) Comparison of transcranial magnetic stimulation measures obtained at rest and under active conditions and their reliability. J Neurosci Methods 205 (1):65–71. 10.1016/j.jneumeth.2011.12.012 [doi] [DOI] [PubMed] [Google Scholar]
- Nowak DA, Grefkes C, Dafotakis M, Kust J, Karbe H, Fink GR (2007) Dexterity is impaired at both hands following unilateral subcortical middle cerebral artery stroke. Eur J Neurosci 25 (10):3173–3184. 10.1111/j.1460-9568.2007.05551.x [doi] [DOI] [PubMed] [Google Scholar]
- Nowak DA, Hermsdorfer J, Topka H (2003) Deficits of predictive grip force control during object manipulation in acute stroke. J Neurol 250 (7):850–860. 10.1007/s00415-003-1095-z [doi] [DOI] [PubMed] [Google Scholar]
- Ortu E, Deriu F, Suppa A, Tolu E, Rothwell JC (2008) Effects of volitional contraction on intracortical inhibition and facilitation in the human motor cortex. J Physiol 586 (Pt 21):5147–5159. 10.1113/jphysiol.2008.158956 [doi] [DOI] [PMC free article] [PubMed] [Google Scholar]
- Peurala SH, Muller-Dahlhaus JF, Arai N, Ziemann U (2008) Interference of short-interval intracortical inhibition (SICI) and short-interval intracortical facilitation (SICF). Clin Neurophysiol 119 (10):2291–2297. 10.1016/j.clinph.2008.05.031 [doi] [DOI] [PubMed] [Google Scholar]
- Pope PA, Holton A, Hassan S, Kourtis D, Praamstra P (2007) Cortical control of muscle relaxation: a lateralized readiness potential (LRP) investigation. Clin Neurophysiol 118 (5):1044–1052. 10.1016/j.clinph.2007.02.002 [doi] [DOI] [PubMed] [Google Scholar]
- Rossini PM, Barker AT, Berardelli A, Caramia MD, Caruso G, Cracco RQ, Dimitrijevic MR, Hallett M, Katayama Y, Lucking CH, et al. (1994) Non-invasive electrical and magnetic stimulation of the brain, spinal cord and roots: basic principles and procedures for routine clinical application. Report of an IFCN committee. Electroencephalogr Clin Neurophysiol 91 (2):79–92 [DOI] [PubMed] [Google Scholar]
- Rothwell JC, Higuchi K, Obeso JA (1998) The offset cortical potential: an electrical correlate of movement inhibition in man. Mov Disord 13 (2):330–335. 10.1002/mds.870130221 [doi] [DOI] [PubMed] [Google Scholar]
- Schieppati M, Crenna P (1984) From activity to rest: gating of excitatory autogenetic afferences from the relaxing muscle in man. Exp Brain Res 56 (3):448–457 [DOI] [PubMed] [Google Scholar]
- Schieppati M, Crenna P (1985) Excitability of reciprocal and recurrent inhibitory pathways after voluntary muscle relaxation in man. Exp Brain Res 59 (2):249–256 [DOI] [PubMed] [Google Scholar]
- Schieppati M, Nardone A, Musazzi M (1986) Modulation of the Hoffmann reflex by rapid muscle contraction or release. Hum Neurobiol 5 (1):59–66 [PubMed] [Google Scholar]
- Schieppati M, Trompetto C, Abbruzzese G (1996) Selective facilitation of responses to cortical stimulation of proximal and distal arm muscles by precision tasks in man. Journal of Physiology 491 (2):11. [DOI] [PMC free article] [PubMed] [Google Scholar]
- Seo NJ, Rymer WZ, Kamper DG (2009) Delays in grip initiation and termination in persons with stroke: effects of arm support and active muscle stretch exercise. J Neurophysiol 101 (6):3108–3115. 10.1152/jn.91108.2008 [doi] [DOI] [PubMed] [Google Scholar]
- Terada K, Ikeda A, Nagamine T, Shibasaki H (1995) Movement-related cortical potentials associated with voluntary muscle relaxation. Electroencephalogr Clin Neurophysiol 95 (5):335–345. doi:001346949500098J [pii] [DOI] [PubMed] [Google Scholar]
- Toma K, Honda M, Hanakawa T, Okada T, Fukuyama H, Ikeda A, Nishizawa S, Konishi J, Shibasaki H (1999) Activities of the primary and supplementary motor areas increase in preparation and execution of voluntary muscle relaxation: an event-related fMRI study. J Neurosci 19 (9):3527–3534 [DOI] [PMC free article] [PubMed] [Google Scholar]
- Yazawa S, Ikeda A, Kaji R, Terada K, Nagamine T, Toma K, Kubori T, Kimura J, Shibasaki H (1999) Abnormal cortical processing of voluntary muscle relaxation in patients with focal hand dystonia studied by movement-related potentials. Brain 122 (Pt 7):1357–1366 [DOI] [PubMed] [Google Scholar]
- Yedimenko JA, Perez MA (2010) The effect of bilateral isometric forces in different directions on motor cortical function in humans. J Neurophysiol 104 (6):2922–2931. 10.1152/jn.00020.2010 [doi] [DOI] [PMC free article] [PubMed] [Google Scholar]