Abstract
Coronavirus infectious disease 2019 (COVID-19), a viral infection caused by a novel coronavirus (nCoV), continues to emerge as a serious threat to public health. This pandemic caused by SARS-CoV-2 (severe acute respiratory syndrome–coronavirus-2) has infected globally with 1,550,000 plus deaths to date, representing a high risk to public health. No effective drug or vaccine is available to curb down this deadly virus. The expedition for searching for a potential drug or vaccine against COVID-19 is of massive potential and favour to the community. This study is focused on finding an effective natural compound that can be processed further into a potential inhibitor to check the activity of SARS-CoV-2 with minimal side effects targeting NSP15 protein, which belongs to the EndoU enzyme family. The natural screening suggested two efficient compounds (PubChem ID: 95372568 and 1776037) with dihydroxyphenyl region of the compound, found to be important in the interaction with the viral protein showing promising activity which may act as a potent lead inhibitory molecule against the virus. In combination with virtual screening, modelling, drug likeliness, molecular docking, and 500 ns cumulative molecular dynamics simulations (100 ns for each complex) along with the decomposition analysis to calculate and confirm the stability and fold, we propose 95372568 and 1776037 as novel compounds of natural origin capable of getting developed into potent lead molecules against SARS-CoV-2 target protein NSP15.
Supplementary Information
The online version contains supplementary material available at 10.1007/s00894-021-04750-z.
Keywords: COVID-19, SARS-CoV-2, NSP15, Virtual screening, Molecular dynamics simulation, Pandemic
Introduction
Coronavirus disease 19 (COVID-19), a viral disease caused by the novel coronavirus (nCoV), continues to emerge as a serious threat to public health. The first case of COVID-19 was reported in late December 2019 [1–4]. Considering the spreading ability and the virus’s potency to cause serious health issues, the World Health Organization (WHO) declared COVID-19 as a pandemic in early March 2020. Initially, the virus was termed as 2019-nCoV. However, due to its similarity established with the coronavirus that caused the severe acute respiratory syndrome outbreak (SARS-CoV), the International Committee on Taxonomy of Viruses (ICTV) termed it as SARS-CoV-2 virus [5]. In general, the coronavirus is a single-stranded, spherical-shaped virus with RNA as its genetic material and crown-shaped glycol-proteins attached to its surface [6]. In the same line, the SARS-COV-2 belongs to the category of beta CoVs is a spherical-shaped virus with a diameter of approximately 60–140 nm [5].
The SARS-COV-2 consists of ~ 3000 base pairs that encode essential structural proteins, namely nucleocapsid (N) protein, spike (S) protein, envelope (E) protein, and membrane (M) protein. Nucleocapsid protein is attached to a single positive-strand RNA whose role is imperative in hijacking the human cells to convert them into viral factories. Thus, averting N protein binding to the viral RNA serves as a potential target for developing drugs to prevent viral replication. The membrane (M) protein is present in the viral surface, and it is believed to be the central organization of the coronavirus assembly [7]. The spike (S) protein, which is assimilated to the viral surface, mediates the attachment and the virus’s fusion to the host cell surface receptors, thereby facilitating the viral entry into the host cell. This attachment makes the spike proteins a crucial target for drug development, depicted in Fig. 1 [8].
Fig. 1.
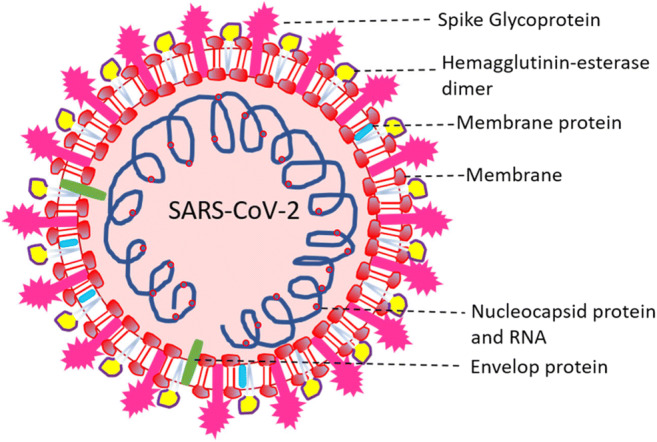
Structural representation of SARS coronavirus 2 [7]
Apart from the genes that encode structural proteins, the viral genome holds a large replicase gene encoded for the non-structural proteins (NSPs). The ribosomal frameshift caused by the replicase genes rep1a and rep1b encodes the two polyproteins pp1a and pp1b. These polyproteins are processed by 3C-like protease (3CLpro), papain-like protease (PLP), and post-cleavage producing sixteen different viral NSPs. These NSPs play a crucial role in complex enzymatic activities such as viral replication and sub-genomic RNA processing. Nevertheless, the role of some enzymes remains elusive [9].
NSP15 protein
One such inexplicable enzyme corresponding to NSP15 is the nidoviral RNA uridylate-specific endoribonuclease (NendoU), holding a C-terminal catalytic domain of the EndoU enzyme family. Studies have claimed that NSP15 plays a vital role in viral replication. However, it was found that the viruses could replicate even in the absence of NSP15 [10–12]. Also, NSP15 is responsible for protein interference with the innate immune system [11]. Further researchers proposed that NSP15 might degrade viral RNA to hide it from the host immune system. However, there is no substantial evidence to support the suggestions. Nevertheless, the role of NSP15 in coronavirus biology is found to be imperative [13].
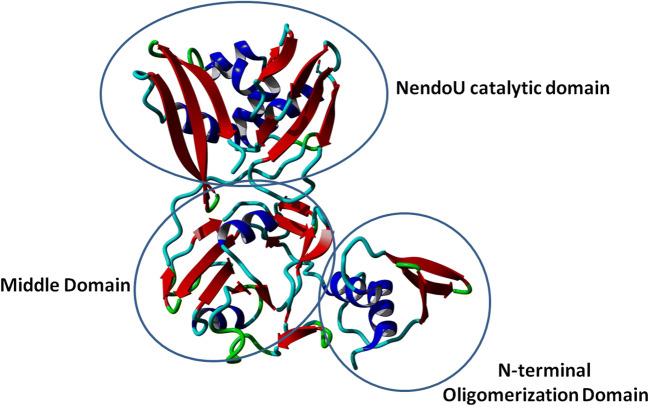
Recently, researchers have solved the crystal structure of NSP15 endoribonuclease NendoU from SARS-CoV-2. It was obtained in two different forms: the apo form and the citrate bond form (NSP15/cit). The one in the apo forms was obtained at 2.20 Å resolution, and the one with the citrate bound was obtained at 1.90 Å. Both the apo and the citrate bound structures differ slightly in the N-terminal and the C-terminal regions (RMSD 0.44 Å). The monomeric unit of NSP15 (~ 345 residues) has three distinct domains: the N-terminal domain, the middle domain, and the C-terminal catalytic domain. Sequence comparison of NSP15 corresponding to SARS-CoV-2 with severe acute respiratory syndrome coronavirus (SARS-CoV) and Middle East respiratory syndrome (MERS-CoV) revealed SARS-CoV as its closest homologue (identity 143; similarity 14%). Similarly, structural comparison of NSP15 (chain A) corresponding to SARS-CoV-2 with SARS-CoV and MERS provided similar results (SARS-CoV-2 vs. SARS-CoV - RMSD 0.52 Å; SARS-CoV-2 vs. MERS - RMSD 1.16 Å) (Fig. 2).
Fig. 2.
Crystal structure of NSP15 monomer protein (PDB-ID: 6VWW) [14]
N-terminal domain
The N-terminal domain consists of alpha-helices (α1 and α2) that wrap the antiparallel beta-sheets (β1, β2, β3).
Middle domain
The middle domain contains 10 beta-strands with three beta hairpins (β5-β6, β7-β8, β12-β13), four beta-sheets (β4, β9, β10, β11, β14, β115), and three helices of which one is a 310-helix (α3, η4, α5).
C-terminal catalytic domain
The C-terminal domain is made of two antiparallel beta-sheets (β16-β17-β18, β19-β20-β21) and five alpha-helices (α6–α10). The shallow groove between the two antiparallel beta-sheets hosts the catalytic site containing six key residues, namely His235, His250, Lys290, Thr341, Tyr343, and Ser294. The two histidine residues come from the helix, and the others come from the beta-strands. His235 acts as a general acid, whereas His250 acts as a general base. Lys290 combined with these residues forms the catalytic triad. In the citrate-bound NSP15, the citrate is said to stabilize the active site by establishing interactions with His235, His250, Lys290, and Thr341. The crystal structure of NSP15 corresponding to SARS-Cov-2 is obtained as a dimer. However, SARS-CoV structural studies suggest that NSP15 forms hexamers made of dimers where the hexamer is likely to represent the active form of the enzyme [14].
Inhibitors for EndoU
The NendoU catalytic domain present in the C-terminal region belongs to the EndoU family. The EndoU family of enzymes is present in almost all animal kingdom of life. It is said to play a crucial role in the biological process associated with RNA processing [14]. Chandra and colleagues performed computational and experimental studies using some known FDA-approved drugs into consideration. The authors reported five compounds, namely dihydroergotamine, glisoxepide, idarubicin, ergotamine, and tasosartan which are the possible inhibitors of NSP15. Citrate was used as the control in their study [13].
Inhibitors targeting the endoribonuclease NSP15 of COVID-19 strategy
The objective of this approach is to design compounds based on the existing broad spectrum of anti-virals. This approach has the advantage of having compounds with established pharmaceutical properties that have a history of use in people and so can be readily used [15].
Material and methods
Protein structure and ligand retrieval and processing
The crystal structure of SARS-CoV-2 non-structural protein-15 (NSP15) protein (PDB-ID: 6VWW) was retrieved from RCSB-Protein Data Bank [16, 17]. 6VWW is shown in Fig. 2 and has been resolved using X-ray crystallography at a resolution of 2.20 Å [18]. Library of natural products (approx. 20,000 compounds) was obtained from the ZINC database [19]. An approximate selection of 11,000 compounds out of this library was chosen for target-specific virtual screening based on Lipinski’s rule of 5. Relevant 3D conformers of these compounds were downloaded from the PubChem database [20–22] in SDF file format. The crystal structure of the protein of interest was imported into the YASARA minimization web server [23–27] for energy minimization using steepest descent method. The energy minimization experiment got completed after 501 steps. And the recorded final energy is − 2311.2 kcal/mol.
Target-specific virtual screening
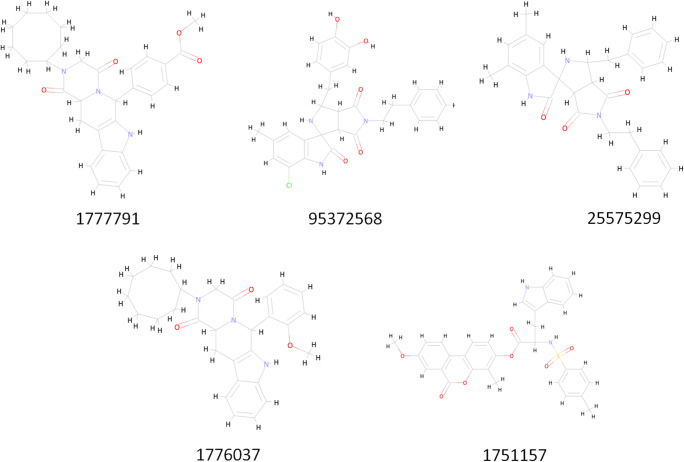
Structure-based virtual screening is performed in drug discovery and development to explore the ligand library, searching for the best lead molecules against the particular target structure [28]. The natural compound library (approx. 11,000 compounds) was obtained from the ZINC database [29] for the best optimal hit against these mentioned targets. PyRx [30] from MGLTools (https://ccsb.scripps.edu/mgltools/) is used for the virtual screening using default settings (grid box size set to be 384, while grid centre was set to 90 on all the three axes to accommodate the whole protein, grid spacing was 0.375 Å, while running AutoDock Vina as docking algorithm, with 100 docking runs), and five best hits have been obtained. The number of evaluations using Genetic Algorithm was set to 25000000. The respective PUBCHEM identification numbers for these compounds further taken for molecular dynamics simulations for 100 ns simulation run are 1777791, 95372568, 25575299, 1776037, and 1751157.
Toxicity prediction
We also performed toxicity prediction of the selected five compounds to check and verify the least toxic drugs for human use. The analyses were performed using AdmetSAR2 [31, 32], a virtual lab for the prediction of toxicities of small molecules. The drugs were uploaded to the server, which yielded results showing the toxicity prediction.
Molecular dynamics simulations
System setup
The protein-ligand complexes for NSP15 with the bound compounds were prepared for molecular dynamics simulations. A total of 500 ns accumulative simulations were performed with the CHARMM36 force field [33]. Solvated systems using TCL scripts in VMD [34] were prepared, and MD simulations using NAMD [35, 36] were performed. The system consisted of the protein complex, TIP3P water, counter ions Na+/Cl−, and 150 mM NaCl.
Simulation setup
The set system was then subjected to energy minimization, which lasted for around 3200 steps following 1000 ps equilibration. The MD production run was setup for 100 ns each, totally to accumulative 500 ns MD production procedure. NPT ensemble was used (1 bar) with a time step of 2 femtoseconds. The temperature has been set up at 300 K with a low damping coefficient, while pressure was controlled using the Nose-Hoover Langevin piston. Electrostatics was calculated using the particle mesh Ewald (PME) method. A total cutoff at 12 Å was given for short-range and van der Walls electrostatics. All simulations were replicated twice with initialized random seed to get average scorings.
Data analyses
Data analysis for the produced trajectories was performed using TCL scripts previously implemented in VMD [34], and data were plotted using GnuPlot (http://gnuplot.info). We have also calculated RMSF α alignments for carbons for all residues and structural changes by RMSD throughout the simulation run. Calculations between the hydrogen donor and acceptor were set with a cutoff at 2.2–2.5 Å for strong h-bonds, 2.5–3.2 Å for moderate strength h-bonds, and 3.2–4.0 Å for weak h-bonds, referring to the “heavy-atom distance” which covers a very broad range that includes the backbone and side chain. Other analyses such as radius of gyration (ROG), solvent accessible surface area (SASA), secondary structure content (DSSP), and H-bond formations upon ligand binding were calculated using TCL bash scripts. RMSD, RMSF, total energy, SASA, radius of gyration, and h-bonds were plotted using Prism.
Analysis of binding free energy (MMPBSA) from MD simulations
MMPBSA.py module was used to calculate the free energy and interaction energy of the ligand. The mathematical formula used to calculate the energies was as follows:
The solvation energy for all the states was calculated using Generalized Born (GB) and Poisson Boltzmann (OB) [37, 38]. This analysis revealed the electrostatic contribution of the solvation state. The final data was plotted using Prism 8. The detailed view of protein-ligand binding in all the NSP15:compound complexes was obtained using the MMGBSA energy decomposition analysis. The decomposition analysis was performed to address the contributions of the binding free energy of each residue, which can provide information regarding the influence of energy on binding affinity. The energy decomposition procedure consists of several steps: first minimizing the receptor, followed by minimization of the ligand, and finally minimization of the receptor-ligand complex.
The equation for the total binding free energy calculation used was as follows:
MMGBSA binding free energy calculations were performed on all complexes, and in order to achieve comprehensive understanding for the nature of binding, interaction terms such as Coulombic + GB solvation + pi–pi packing + H-bond + VDW+ lipophilic + self-contact) were grouped into three distinct categories:
Eelectrostatics, where Eelectrostatics = (Hbond + Ecoulomb + EGB_solvation).
EvdW, where EvdW = (EvdW + Epi-p + Eself-contact)
Elipophilic.
The conformational entropy of the solute is not included in MMGBSA analysis. Hence, binding energies by the MMGBSA method can sometimes overestimate the binding affinity. However, MMGBSA energies can be used to estimate relative energy for binding, helping us distinctively rank the compounds [37, 39]. The MMGBSA method has been used for benchmarking studies extensively, which concluded MMGBSA to be a robust method in ranking compounds [40–44].
Results and discussion
Protein selection and preparation
The protein used for this study is an experimentally solved structure of NSP15 protein (PDB-ID: 6VWW) of SARS-CoV-2, which was obtained from PDB [16] energetically minimized with YASARA minimization sever [27]. This prepared protein is used for virtual screening of desired compounds.
Virtual screening and ligand selection
Natural compounds were acquired using the ZINC natural library with approx. 11,000 functional compounds (selected on the basis of Lipinski’s rule of 5). These small molecules were docked to the protein macromolecule through global docking to shortlist the best lead candidates. This virtual screening gave optimum hits for these five compounds having PubChem Ids as 1777791, 95372568, 25575299, 1776037, and 1751157 (Fig. 3).
Fig. 3.
Five best compounds selected after virtual screening
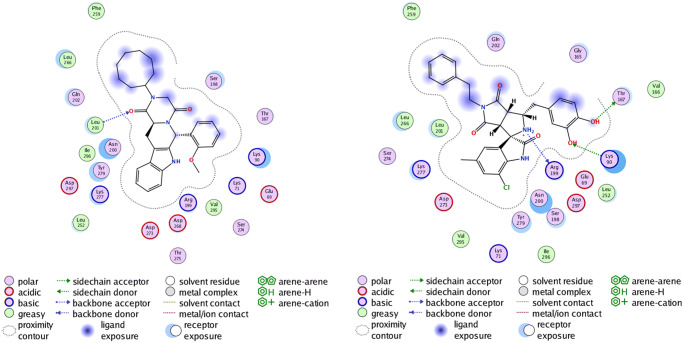
The final list of ligands tested thoroughly and obtained as best hits after docking with the mentioned PubChem ID, 2D structures, and other relevant properties is given in Supplementary Table 1. Information about the binding affinity and interacting partners (interacting residues of the protein) is provided in Supplementary Table 2. It is evident that compound 1777791 shows the best binding affinity of − 11.880 kcal/mol followed by 95372568 (− 11.2790 kcal/mol) with the protein structure, but compound 1776037 has been chosen over 1777791 because of better energy profiles in MMPBSA calculations (shown in the “Binding free energy (MMPBSA) and per-residue energy decomposition (MMGBSA) analysis from MD simulations” section). Figure 4 (left panel) shows the interacting residues along with the legends for 1776037, and Fig. 4 (right panel) shows interactions with compound 95372568. All interacting residues are also given in Supplementary Table 2. The interaction profile for the rest of the three compounds is provided in Supplementary Figs. 1–3 and Supplementary Table 2.
Fig. 4.
NSP15-1776037 (left) and NSP15-95372568 (right) complex showing polar and non-polar interactions. The small molecule is shown in the stick model
In the case of 1776037, 1 H-bond, 4 acidic, and 3 basic interactions are obtained (in total 21 interactions) in comparison with 95372568 where 3 H-bond, 3 acidic, and 4 basic interactions are found (in total again 21 interactions). Although the difference between the two ligands’ binding energy is just ~ 0.6 kcal/mol, the increase in number of H-bond interactions in the case of 95372568 makes it a better choice to be a lead molecule. To validate our hypothesis, we performed various studies including MD simulations. The docking conformations of protein-ligand complexes are reasonably accurate as this docking procedure is validated by a control. The PDB structure 6WXC (crystal structure of NSP15 endoribonuclease from SARS-CoV-2 in the complex with potential repurposing drug tipiracil) has been redocked (results not shown) and found to bind at the same site, thus validating the protocol [14].
Toxicity prediction and ligand characteristics
The ligands were then subjected to drug likeliness and toxicity prediction, and the analyses were performed using AdmetSAR2 [31, 32], a virtual lab for the prediction of toxicities of small molecules. This study indicated how likely and effective a drug could be with the least side effects and also informs us with a prediction score. The analysis revealed that compounds 1776037 and 95372568 were the best possible molecules amongst the shortlisted compounds. The molecular weight and other parameters for the compounds were also found to be fitting well with the Lipinski rule of 5 for drug likeliness. The drug likeliness parameters with toxicity prediction are displayed in Table 1. The numbers in parentheses denote the probability of the respective trait of toxicity; e.g. hepatotoxic (0.7750) means the probability of the molecule to be hepatotoxic is 77%.
Table 1.
Acute oral toxicity: category III includes compounds with LD50 values greater than 500 mg/kg but less than 5000 mg/kg. Category IV consisted of compounds with LD50 values greater than 5000 mg/kg based on the criterion of US EPA. The value within the brackets donates the probability [31, 32]
| CID | AMES toxicity | Carcinogens | Acute oral toxicity | Hepatotoxicity |
|---|---|---|---|---|
| 1777791 | Non AMES toxic (0.8616) | Non-carcinogens (0.9685) | Category III (0.5622) | Hepatotoxic (0.7750) |
| 95372568 | Non AMES toxic (0.7118) | Non-carcinogens (0.7997) | Category III (0.6816) | Hepatotoxic (0.6000) |
| 25575299 | Non AMES toxic (0.7279) | Non-carcinogens (0.8523) | Category III (0.6869) | Hepatotoxic (0.7250) |
| 1776037 | Non AMES toxic (0.7688) | Non-carcinogens (0.9473) | Category III (0.6311) | Hepatotoxic (0.7000) |
| 1751157 | Non AMES toxic (0.6296) | Non-carcinogens (0.7639) | Category III (0.5839) | Hepatotoxic (0.9500) |
Molecular dynamics simulations
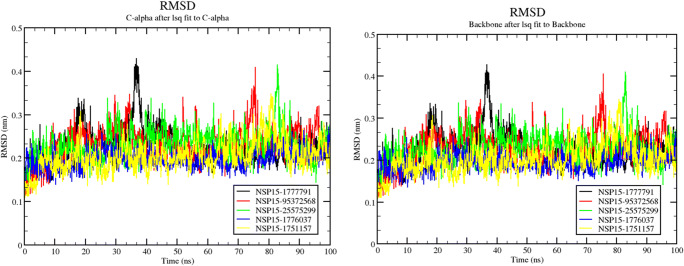
To confirm the stability of the complex structures in combination with the drug candidates, we performed an accumulative 500 ns (100 ns each for all 5 complexes) molecular dynamics simulation on all five complexes. This production run posted 1 ns equilibration using NAMD. Total potential energy (Supplementary Fig. 4, left) shows that all the simulation runs are quite fantastically equilibrated. The potential energy was analysed during the 100 ns molecular dynamics simulations for all 5 complexes. The potential energy plot shows that all the molecular systems stabilized and remained stable throughout 100 ns of molecular dynamics simulations. Free energy of solvation (Supplementary Fig. 4, right) also ranged between − 16.8 and − 9.6 kcal/mol for all five protein-ligand complexes. We found that the RMSD fluctuations between structures are not too high, explaining why the structures with the complexed ligand are relatively stable. Overall trajectory analyses for all the compounds are more or less equilibrated with an average change of approx. 2.5 Å in the RMSD except for a sudden spike to approximately 4 Å between the trajectories (Fig. 5). The most deviated was observed (4 Å) as average RMSD change for around steps 35 to 40 ns for 1777791 (shown in black) (Fig. 5). After that point in time, the trajectory is relatively stable and equilibrated. 1777791 also offered the best docking score, and this deviation might be the result of the change in conformation as the ligand molecule binds with the protein. The trajectory of compound 1776037 (shown in blue) showed the best equilibrated profile throughout the simulation (Fig. 5).
Fig. 5.
RMSD profile for all 5 protein-ligand complexes for alpha carbon (left panel) and backbone (right panel)
Similarly, the RMSF plot for the trajectories shows approximately the same per-residue fluctuation in the case of 1777791, 25575299, and also for 1776037 (Fig. 6). The rest of the compounds showed slight fluctuations in the whole run. 1777791, as expected from the RMSD plot, showed most local residue-based fluctuation near residue numbers 30 to 40, 155 to 165, and 300. The same kind of profile is also observed in other compounds. These residue clusters could be the functional site of the ligand binding phenomenon.
Fig. 6.
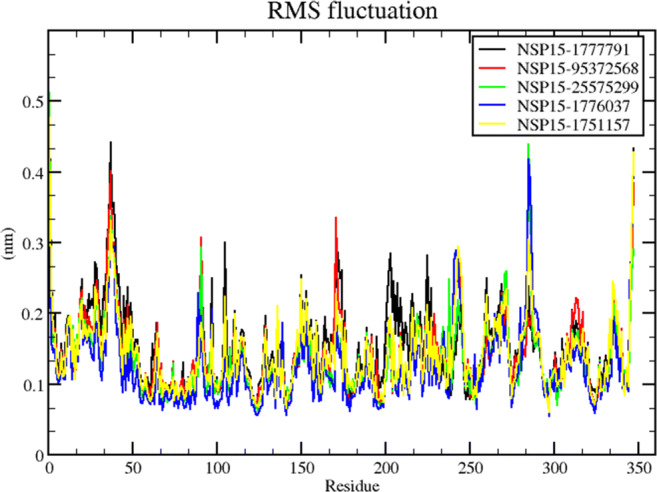
RMSF plot for the 5 trajectories shows approximately the same per-residue fluctuation in the case of 1777791, 25575299 and also for 1776037 bound NSP15 complexes
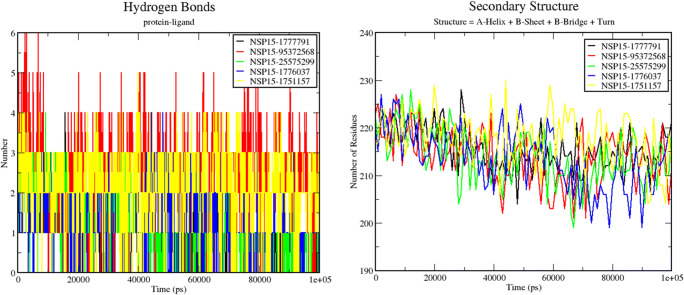
Figure 7 (left) demonstrates the hydrogen bonding pattern observed during 100 ns simulation runs in all five protein-ligand complexes. The highest number of H-bonds was observed in the case of NSP15-95372568 complex, and the least number of H-bonds was observed in the case of NSP15-25575299 and NSP15-1776037 complexes. Figure 7 (right) shows the change in the secondary structure content of all the 5 protein-ligand complexes during the 100 ns simulation run. The least secondary structure change has been observed in the NSP15-1777791 complex. The rest 4 complexes along with 1776037 show more or less the same pattern of the secondary structure change which can be thought out to be their efficient involvement in ligand binding. These results suggest that 1776037 can also be a potential binding partner for the NSP15 protein along with 95372568, which will inhibit its bio-functional activity without showing any side effect.
Fig. 7.
H-bonding pattern (left panel) and secondary structure change (right panel) during the 100 ns simulation run
Apart from RMSD, RMSF, and the number of hydrogen bonds formed between protein and ligand, radius of gyration, SASA, and MMPBSA graphs were also calculated. Solvent accessible surface area (SASA) for all the proteins was also calculated to check the effect of ligand binding on the residue profiling of the surface of the protein. Supplementary Fig. 5 (left) shows the SASA plot for all five complexes as obtained using gmx sas command in Gromacs [45, 46] for 100 ns simulation run. More or less, the profiles are the same, leaving some exceptions in the case of 1776037 near 90 ns time frame. This suggests no significant change in the protein structure on binding with different ligands except 1776037. Supplementary Fig. 5 (right) depicts the radius of gyration plots for all the five complexes over 100 ns of simulation time. As we can observe that Rg for NSP15-1777791 complex increased around 40 ns, this may facilitate the change in conformation of a ligand inside the binding pocket at that time. It also points out that protein is exceptionally receptive and making conformational space for better ligand fitting. On the other hand, NSP15-1776037 complex shows least Rg value of approx. 2.35 Å, making it structurally stable for ligand binding. The rest of the complexes show a slight decrease in Rg, suggesting that the ligand binding helps stabilize the protein’s stabilized compactness. The radius of gyration (Rg) indicates the degree of compactness and is defined as the mass weighted root mean square distance of a collection of atoms from their common centre of mass. It is an important parameter which provides us an insight of the overall dimensions of the protein [47–49]. Changes studied through the use of the radius of gyration are, for instance, association and dissociation effects, conformational changes by denaturation, binding of coenzymes, and temperature effects (O. Kratky, P. Laggner, in Encyclopaedia of Physical Science and Technology (Third Edition), 2003).
Binding free energy (MMPBSA) and per-residue energy decomposition (MMGBSA) analysis from MD simulations
Individual energy components like Vander Walls forces, Coulomb, and H-bond are calculated using MMPBSA/MMGBSA tool in Gromacs (Supplementary Fig. 6). Also, Table 2 representing these values is included in the text for better understanding. The complex of NSP15 and 95372568 shows the highest Gibbs free energy (− 48.532 kcal/mol). It suggests that compound 95372568 attains the best lead molecule position after simulation and shows good interaction with the NSP15 protein exhibiting as the potential drug candidate for SARS-COV-2 NSP15 protein. However, the whole study indicated that we could have 95372568 and 1776037 as lead candidates for new drug development to curb down the COVID-19 pandemic. New strategies need to be incorporated to fight newly evolved pathogens.
Table 2.
MMPBSA profiling values of all five complexes. All energy components like Vander Walls forces, Coulomb, and H-bond are calculated and presented in this table
| Contribution (kcal/mol) | 25575299 | 1751157 | 1776037 | 1777791 | 95372568 |
|---|---|---|---|---|---|
| ∆Gbind | − 22.2 | − 32.8 | − 40.2 | − 32.5 | − 48.5 |
| ∆Gcoulomb | − 29.5 | − 36.7 | − 44.8 | − 34.5 | − 56.8 |
| ∆Gcovalent | 0.7 | 0.8 | 3.7 | 1.0 | 6.5 |
| ∆GH-bond | − 1.5 | − 2.4 | − 4.7 | − 0.7 | − 7.5 |
| ∆Glipo | − 20.9 | − 24.4 | − 30.9 | − 25.9 | − 33.9 |
| ∆Gpacking | − 1.0 | − 2.5 | − 4.7 | − 1.1 | − 5.6 |
| ∆GGB | 44.3 | 42.4 | 55.8 | 44.0 | 58.1 |
| ∆GvdW | − 20.9 | − 24.4 | − 33.5 | − 31.4 | − 37.5 |
The energy decomposition analysis was performed at per-residue level using MMGBSA methods (see “Material and methods”). We identified several residues on the active binding site to be involved in the interaction. The cutoff value for the important residues taking part in the interaction was set to − 0.5 kcal/mol. The per-residue values correlated with the MMPBSA analysis and showed both the compounds with highest hits as 95372568 with ∆G of − 48.3 kcal/mol and 1776037 with ∆G of − 39.9 kcal/mol, corroborating all the previous analysis (Table 3).
Table 3.
MMGBSA per-residue decomposition analysis for five complexes
| Contribution (kcal/mol) per-residue | 25575299 | 1751157 | 1776037 | 1777791 | 95372568 |
|---|---|---|---|---|---|
| Lys 71 | − 1.2 | − 1.5 | − 2.1 | − 1.4 | − 3.4 |
| Lys 90 | − 1.6 | − 1.7 | − 1.9 | − 1.6 | − 2.1 |
| Val 166 | − 2.2 | − 2.6 | − 2.4 | − 2.2 | − 2.8 |
| Thr 167 | − 1.8 | − 1.9 | − 2.2 | − 1.7 | − 2.6 |
| Ser 198 | − 1.6 | − 2.7 | − 2.6 | − 2.3 | − 3.1 |
| Arg 199 | − 1.1 | − 1.9 | − 1.8 | − 2 | − 2.4 |
| Asn 200 | − 0.5 | − 0.8 | − 1.3 | − 1.1 | − 1.5 |
| Leu 201 | − 0.7 | − 2.3 | − 2.3 | − 1.9 | − 2.4 |
| Gln 202 | − 0.9 | − 0.6 | − 1.9 | − 1.2 | − 1.8 |
| Leu 252 | − 1.8 | − 0.8 | − 1.8 | − 0.8 | − 2.2 |
| Phe 259 | − 0.7 | − 1.4 | − 2 | − 1.2 | − 2.3 |
| Leu 266 | − 0.6 | − 2.8 | − 3.1 | − 2.3 | − 2.9 |
| Ser 274 | − 0.5 | − 1.8 | − 1.9 | − 2.1 | − 3.1 |
| Thr 275 | − 0.7 | − 0.5 | − 1.5 | − 0.9 | − 1.9 |
| Lys 277 | − 0.9 | − 2.7 | − 3.1 | − 2.9 | − 2.8 |
| Tyr 279 | − 1.1 | − 0.8 | − 1.9 | − 1.5 | − 2.3 |
| Val 295 | − 0.6 | − 2.5 | − 3.1 | − 2.2 | − 3.4 |
| Ile 296 | − 0.5 | − 1.8 | − 1.9 | − 1.6 | − 2.4 |
| Asp 297 | − 0.8 | − 0.9 | − 1.1 | − 1.1 | − 2.9 |
| Cumulative ∆Gper-residue | − 19.8 | − 32 | − 39.9 | − 32 | − 48.3 |
Conclusions
Initial molecular dynamics, primary screening, molecular docking, and post-complex molecular dynamics simulations for 100 ns each in this research suggested that the interactions between the NSP15 protein and the found lead molecules 95372568 and 1776037 are significant. We also performed decomposition analysis, as shown in Table 3. The interactions are strongly on the active site of the protein. This was also shown in the 100 ns simulation run to capture the functional conformation of the complex. The most crucial residues we see from all the ligand interaction diagrams are ARG199, ASN200, TYR279, and ASP297 of the NSP15 protein, which lie on the surface, very important in terms of interaction with ligands utilizing polar and non-polar binding. This interaction of ligand to protein will be an essential factor in abolishing the disease’s further spread by leaving the virus non-functional. Compounds 95372568 and 1776037 have shown promising binding and stability results by molecular dynamics, indicating their usefulness in developing these lead molecules in potent inhibitors of this essential target protein of SARS-COV-2. There may also be a possibility to use both the candidate molecules (95372568 and 1776037) to target NSP15 protein for more profound results. Additional experimental in vitro studies are suggested to be performed with the use of these ligands for further analysis and corroboration.
Supplementary information
(DOCX 1132 kb)
Author contribution
MA initiated and designed the project, OM implemented the experiments, and MA and OM wrote the manuscript.
Data availability
Supplementary files are attached to the manuscript.
Code availability
N/A.
Declarations
Ethics approval
N/A
Consent to participate
Yes.
Consent for publication
Yes.
Conflict of interest
The authors declare no competing interests.
Footnotes
Publisher’s note
Springer Nature remains neutral with regard to jurisdictional claims in published maps and institutional affiliations.
References
- 1.Spiteri G, Fielding J, Diercke M et al (2020) First cases of coronavirus disease 2019 (COVID-19) in the WHO European region, 24 January to 21 February 2020. Euro Surveill. 10.2807/1560-7917.ES.2020.25.9.2000178 [DOI] [PMC free article] [PubMed]
- 2.Holshue ML, DeBolt C, Lindquist S, et al. First case of 2019 novel coronavirus in the United States. N Engl J Med. 2020;382:929–936. doi: 10.1056/NEJMoa2001191. [DOI] [PMC free article] [PubMed] [Google Scholar]
- 3.Ciotti M, Angeletti S, Minieri M, et al. COVID-19 outbreak: an overview. Chemotherapy. 2019;64:215–223. doi: 10.1159/000507423. [DOI] [PMC free article] [PubMed] [Google Scholar]
- 4.Harapan H, Itoh N, Yufika A, et al. Coronavirus disease 2019 (COVID-19): a literature review. J Infect Public Health. 2020;13:667–673. doi: 10.1016/j.jiph.2020.03.019. [DOI] [PMC free article] [PubMed] [Google Scholar]
- 5.Cascella M, Rajnik M, Cuomo A et al (2020) Features, evaluation, and treatment of coronavirus. StatPearls [PubMed]
- 6.Carlos WG, Dela Cruz CS, Cao B, et al. Novel Wuhan (2019-nCoV) coronavirus. Am J Respir Crit Care Med. 2020;201:P7–P8. doi: 10.1164/rccm.2014P7. [DOI] [PubMed] [Google Scholar]
- 7.Boopathi S, Poma AB, Kolandaivel P (2020) Novel 2019 coronavirus structure, mechanism of action, antiviral drug promises and rule out against its treatment. J Biomol Struct Dyn 1–10. 10.1080/07391102.2020.1758788 [DOI] [PMC free article] [PubMed]
- 8.Kirchdoerfer RN, Cottrell CA, Wang N, et al. Pre-fusion structure of a human coronavirus spike protein. Nature. 2016;531:118–121. doi: 10.1038/nature17200. [DOI] [PMC free article] [PubMed] [Google Scholar]
- 9.Báez-Santos YM, St John SE, Mesecar AD. The SARS-coronavirus papain-like protease: structure, function and inhibition by designed antiviral compounds. Antivir Res. 2015;115:21–38. doi: 10.1016/j.antiviral.2014.12.015. [DOI] [PMC free article] [PubMed] [Google Scholar]
- 10.Sawicki SG, Sawicki DL, Siddell SG. A contemporary view of coronavirus transcription. J Virol. 2007;81:20–29. doi: 10.1128/JVI.01358-06. [DOI] [PMC free article] [PubMed] [Google Scholar]
- 11.Deng X, Hackbart M, Mettelman RC, et al. Coronavirus nonstructural protein 15 mediates evasion of dsRNA sensors and limits apoptosis in macrophages. Proc Natl Acad Sci U S A. 2017;114:E4251–E4260. doi: 10.1073/pnas.1618310114. [DOI] [PMC free article] [PubMed] [Google Scholar]
- 12.Subissi L, Imbert I, Ferron F, et al. SARS-CoV ORF1b-encoded nonstructural proteins 12-16: replicative enzymes as antiviral targets. Antivir Res. 2014;101:122–130. doi: 10.1016/j.antiviral.2013.11.006. [DOI] [PMC free article] [PubMed] [Google Scholar]
- 13.Chandra A, Gurjar V, Qamar I, Singh N (2020) Identification of potential inhibitors of SARS-COV-2 endoribonuclease (EndoU) from FDA approved drugs: a drug repurposing approach to find therapeutics for COVID-19. J Biomol Struct Dyn 1–11. 10.1080/07391102.2020.1775127 [DOI] [PMC free article] [PubMed]
- 14.Kim Y, Jedrzejczak R, Maltseva NI, et al. Crystal structure of Nsp15 endoribonuclease NendoU from SARS-CoV-2. Protein Sci. 2020;29:1596–1605. doi: 10.1002/pro.3873. [DOI] [PMC free article] [PubMed] [Google Scholar]
- 15.Krishnan DA, Sangeetha G, Vajravijayan S, et al. Structure-based drug designing towards the identification of potential anti-viral for COVID-19 by targeting endoribonuclease NSP15. Inform Med Unlocked. 2020;20:100392. doi: 10.1016/j.imu.2020.100392. [DOI] [PMC free article] [PubMed] [Google Scholar]
- 16.Berman HM, Battistuz T, Bhat TN, et al. The protein data bank. Acta Crystallogr D Biol Crystallogr. 2002;58:899–907. doi: 10.1107/s0907444902003451. [DOI] [PubMed] [Google Scholar]
- 17.Berman HM, Westbrook J, Feng Z, et al. The protein data bank. Nucleic Acids Res. 2000;28:235–242. doi: 10.1093/nar/28.1.235. [DOI] [PMC free article] [PubMed] [Google Scholar]
- 18.Gao Y, Yan L, Huang Y, et al. Structure of the RNA-dependent RNA polymerase from COVID-19 virus. Science (80-) 2020;368:779–782. doi: 10.1126/science.abb7498. [DOI] [PMC free article] [PubMed] [Google Scholar]
- 19.Irwin JJ, Shoichet BK. ZINC--a free database of commercially available compounds for virtual screening. J Chem Inf Model. 2005;45:177–182. doi: 10.1021/ci049714+. [DOI] [PMC free article] [PubMed] [Google Scholar]
- 20.Kim S, Thiessen PA, Bolton EE, et al. PubChem substance and compound databases. Nucleic Acids Res. 2016;44:D1202–D1213. doi: 10.1093/nar/gkv951. [DOI] [PMC free article] [PubMed] [Google Scholar]
- 21.Al-Lahham SH, Peppelenbosch MP, Roelofsen H, et al. Biological effects of propionic acid in humans; metabolism, potential applications and underlying mechanisms. Biochim Biophys Acta. 2010;1801:1175–1183. doi: 10.1016/j.bbalip.2010.07.007. [DOI] [PubMed] [Google Scholar]
- 22.Azevedo-Silva J, Queirós O, Baltazar F, et al. The anticancer agent 3-bromopyruvate: a simple but powerful molecule taken from the lab to the bedside. J Bioenerg Biomembr. 2016;48:349–362. doi: 10.1007/s10863-016-9670-z. [DOI] [PubMed] [Google Scholar]
- 23.Krieger E, Vriend G. YASARA view - molecular graphics for all devices - from smartphones to workstations. Bioinformatics. 2014;30:2981–2982. doi: 10.1093/bioinformatics/btu426. [DOI] [PMC free article] [PubMed] [Google Scholar]
- 24.Krieger E, Koraimann G, Vriend G. Increasing the precision of comparative models with YASARA NOVA--a self-parameterizing force field. Proteins. 2002;47:393–402. doi: 10.1002/prot.10104. [DOI] [PubMed] [Google Scholar]
- 25.Krieger E, Vriend G. New ways to boost molecular dynamics simulations. J Comput Chem. 2015;36:996–1007. doi: 10.1002/jcc.23899. [DOI] [PMC free article] [PubMed] [Google Scholar]
- 26.Krieger E, Dunbrack RL, Hooft RWW, Krieger B. Assignment of protonation states in proteins and ligands: combining pKa prediction with hydrogen bonding network optimization. Methods Mol Biol. 2012;819:405–421. doi: 10.1007/978-1-61779-465-0_25. [DOI] [PubMed] [Google Scholar]
- 27.Krieger E, Joo K, Lee J, et al. Improving physical realism, stereochemistry, and side-chain accuracy in homology modeling: four approaches that performed well in CASP8. Proteins. 2009;77(Suppl 9):114–122. doi: 10.1002/prot.22570. [DOI] [PMC free article] [PubMed] [Google Scholar]
- 28.Shukla R, Singh TR. Virtual screening, pharmacokinetics, molecular dynamics and binding free energy analysis for small natural molecules against cyclin-dependent kinase 5 for Alzheimer’s disease. J Biomol Struct Dyn. 2020;38:248–262. doi: 10.1080/07391102.2019.1571947. [DOI] [PubMed] [Google Scholar]
- 29.Sterling T, Irwin JJ. ZINC 15--ligand discovery for everyone. J Chem Inf Model. 2015;55:2324–2337. doi: 10.1021/acs.jcim.5b00559. [DOI] [PMC free article] [PubMed] [Google Scholar]
- 30.Dallakyan S, Olson AJ. Small-molecule library screening by docking with PyRx. Methods Mol Biol. 2015;1263:243–250. doi: 10.1007/978-1-4939-2269-7_19. [DOI] [PubMed] [Google Scholar]
- 31.Cheng F, Li W, Zhou Y, et al. admetSAR: a comprehensive source and free tool for assessment of chemical ADMET properties. J Chem Inf Model. 2012;52:3099–3105. doi: 10.1021/ci300367a. [DOI] [PubMed] [Google Scholar]
- 32.Yang H, Lou C, Sun L, et al. admetSAR 2.0: web-service for prediction and optimization of chemical ADMET properties. Bioinformatics. 2019;35:1067–1069. doi: 10.1093/bioinformatics/bty707. [DOI] [PubMed] [Google Scholar]
- 33.Huang J, MacKerell AD. CHARMM36 all-atom additive protein force field: validation based on comparison to NMR data. J Comput Chem. 2013;34:2135–2145. doi: 10.1002/jcc.23354. [DOI] [PMC free article] [PubMed] [Google Scholar]
- 34.Humphrey W, Dalke A, Schulten K. VMD: visual molecular dynamics. J Mol Graph. 1996;14(33–8):27. doi: 10.1016/0263-7855(96)00018-5. [DOI] [PubMed] [Google Scholar]
- 35.Phillips JC, Braun R, Wang W, et al. Scalable molecular dynamics with NAMD. J Comput Chem. 2005;26:1781–1802. doi: 10.1002/jcc.20289. [DOI] [PMC free article] [PubMed] [Google Scholar]
- 36.Acun B, Hardy DJ, Kale LV, et al. Scalable molecular dynamics with NAMD on the summit system. IBM J Res Dev. 2018;62:1–9. doi: 10.1147/jrd.2018.2888986. [DOI] [PMC free article] [PubMed] [Google Scholar]
- 37.Carrascal N, Green DF. Energetic decomposition with the generalized-born and Poisson-Boltzmann solvent models: lessons from association of G-protein components. J Phys Chem B. 2010;114:5096–5116. doi: 10.1021/jp910540z. [DOI] [PubMed] [Google Scholar]
- 38.Lee MC, Yang R, Duan Y. Comparison between Generalized-Born and Poisson-Boltzmann methods in physics-based scoring functions for protein structure prediction. J Mol Model. 2005;12:101–110. doi: 10.1007/s00894-005-0013-y. [DOI] [PubMed] [Google Scholar]
- 39.Kongsted J, Söderhjelm P, Ryde U. How accurate are continuum solvation models for drug-like molecules? J Comput Aided Mol Des. 2009;23:395–409. doi: 10.1007/s10822-009-9271-6. [DOI] [PubMed] [Google Scholar]
- 40.Kollman PA, Massova I, Reyes C, et al. Calculating structures and free energies of complex molecules: combining molecular mechanics and continuum models. Acc Chem Res. 2000;33:889–897. doi: 10.1021/ar000033j. [DOI] [PubMed] [Google Scholar]
- 41.Hou T, Wang J, Li Y, Wang W. Assessing the performance of the molecular mechanics/Poisson Boltzmann surface area and molecular mechanics/Generalized Born surface area methods. II. The accuracy of ranking poses generated from docking. J Comput Chem. 2011;32:866–877. doi: 10.1002/jcc.21666. [DOI] [PMC free article] [PubMed] [Google Scholar]
- 42.Hou T, Wang J, Li Y, Wang W. Assessing the performance of the MM/PBSA and MM/GBSA methods. 1. The accuracy of binding free energy calculations based on molecular dynamics simulations. J Chem Inf Model. 2011;51:69–82. doi: 10.1021/ci100275a. [DOI] [PMC free article] [PubMed] [Google Scholar]
- 43.Xu L, Sun H, Li Y, et al. Assessing the performance of MM/PBSA and MM/GBSA methods. 3. The impact of force fields and ligand charge models. J Phys Chem B. 2013;117:8408–8421. doi: 10.1021/jp404160y. [DOI] [PubMed] [Google Scholar]
- 44.Sun H, Li Y, Shen M, et al. Assessing the performance of MM/PBSA and MM/GBSA methods. 5. Improved docking performance using high solute dielectric constant MM/GBSA and MM/PBSA rescoring. Phys Chem Chem Phys. 2014;16:22035–22045. doi: 10.1039/c4cp03179b. [DOI] [PubMed] [Google Scholar]
- 45.Berendsen HJC, van der Spoel D, van Drunen R. GROMACS: a message-passing parallel molecular dynamics implementation. Comput Phys Commun. 1995;91:43–56. doi: 10.1016/0010-4655(95)00042-E. [DOI] [Google Scholar]
- 46.Van Der Spoel D, Lindahl E, Hess B, et al. GROMACS: fast, flexible, and free. J Comput Chem. 2005;26:1701–1718. doi: 10.1002/jcc.20291. [DOI] [PubMed] [Google Scholar]
- 47.Baig MH, Sudhakar DR, Kalaiarasan P, et al. Insight into the effect of inhibitor resistant S130G mutant on physico-chemical properties of SHV type beta-lactamase: a molecular dynamics study. PLoS One. 2014;9:e112456. doi: 10.1371/journal.pone.0112456. [DOI] [PMC free article] [PubMed] [Google Scholar]
- 48.Bawn M, Magliozzo RS (2018) Molecular dynamics investigation of the role of residues D137 and S315 to INH binding in katg. BioRxiv. 10.1101/245407
- 49.Lobanov MY, Bogatyreva NS, Galzitskaya OV. Radius of gyration as an indicator of protein structure compactness. Mol Biol (NY) 2008;42:623–628. doi: 10.1134/S0026893308040195. [DOI] [PubMed] [Google Scholar]
Associated Data
This section collects any data citations, data availability statements, or supplementary materials included in this article.
Supplementary Materials
(DOCX 1132 kb)
Data Availability Statement
Supplementary files are attached to the manuscript.
N/A.


