

Summary
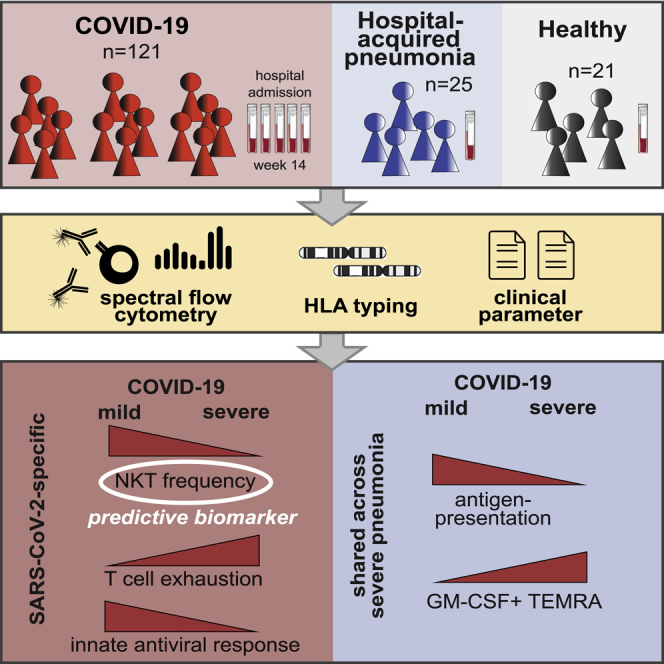
Immune profiling of COVID-19 patients has identified numerous alterations in both innate and adaptive immunity. However, whether those changes are specific to SARS-CoV-2 or driven by a general inflammatory response shared across severely ill pneumonia patients remains unknown. Here, we compared the immune profile of severe COVID-19 with non-SARS-CoV-2 pneumonia ICU patients using longitudinal, high-dimensional single-cell spectral cytometry and algorithm-guided analysis. COVID-19 and non-SARS-CoV-2 pneumonia both showed increased emergency myelopoiesis and displayed features of adaptive immune paralysis. However, pathological immune signatures suggestive of T cell exhaustion were exclusive to COVID-19. The integration of single-cell profiling with a predicted binding capacity of SARS-CoV-2 peptides to the patients’ HLA profile further linked the COVID-19 immunopathology to impaired virus recognition. Toward clinical translation, circulating NKT cell frequency was identified as a predictive biomarker for patient outcome. Our comparative immune map serves to delineate treatment strategies to interfere with the immunopathologic cascade exclusive to severe COVID-19.
Keywords: COVID-19, SARS-CoV-2, high-dimensional single cell analysis, immune profiling, immunophenotyping, spectral flow cytometry, biomarker, GM-CSF, HLA typing, peptide binding strength
Graphical abstract
Highlights
-
•
GM-CSF+ T cells are a hallmark of severe respiratory syndrome independent of pathogen
-
•
T cell exhaustion and impaired early antiviral response are unique in severe COVID-19
-
•
Circulating NKT cell frequencies serve as a predictive biomarker for severe COVID-19
-
•
HLA profile links COVID-19 immunopathology to impaired virus recognition
The pathogen-specific immune alterations in severe COVID-19 remain unknown. Using longitudinal, high-dimensional, single-cell spectral cytometry and algorithm-guided comparison of COVID-19 versus non-SARS-CoV-2-pneumonia patient samples, Kreutmair et al. identify T and NK cell immune signatures specific to SARS-CoV-2. They furthermore reveal NKT cell frequency as a predictive biomarker for COVID-19 outcome prediction and link impaired virus recognition to HLA genetics.
Introduction
The coronavirus disease 2019 (COVID-19) pandemic has affected more than 150 million people worldwide and resulted in more than 3 million deaths as of April 2021 (World Health Organization, 2020a). The causative agent is severe acute respiratory syndrome (RS) coronavirus 2 (SARS-CoV-2) (Lu et al., 2020). The majority of people infected with SARS-CoV-2 are either asymptomatic or develop mild and self-limiting symptoms of fever, cough, and shortness of breath. However, approximately 8% of COVID-19 patients go on to experience the severe complications of pneumonia, respiratory failure, and acute respiratory distress syndrome (ARDS), frequently requiring admission to the intensive care unit (ICU) and mechanical ventilation (Iype and Gulati, 2020; O’Driscoll et al., 2021). Despite some clinical similarities to other severe respiratory infections causing multi-organ failure, COVID-19 presents unique clinical challenges that we do not yet know how to overcome: at present, the in-ICU mortality rate remains at approximately 50% (Armstrong et al., 2020). Thus there is an urgent need to understand how mild and severe SARS-CoV-2 infection differ from each other and how they are distinct from other causes of severe RS.
Although the factors underpinning severe COVID-19 are not yet completely understood, evidence suggests that extreme respiratory distress in these patients is mediated primarily by immunopathology (Hadjadj et al., 2020; Merad and Martin, 2020). Multiple studies have shown differences in the proportions of immune cell populations in the peripheral blood of COVID-19 patients compared with healthy individuals, in particular a marked lymphopenia that is accompanied by changes to the lymphocyte activation and exhaustion phenotypes, some of which are partly associated with severity of the disease (Cao, 2020; Mathew et al., 2020; Su et al., 2020; Zheng et al., 2020). Alongside these cellular characteristics, a cytokine storm, defined by a massive increase in circulating levels of inflammatory cytokines including IL-6, GM-CSF, and TNF, drives disease progression and the development of lung immunopathology (Bastard et al., 2020; Bonaventura et al., 2020; Hadjadj et al., 2020; Lucas et al., 2020; Poland et al., 2020; Del Valle et al., 2020; Zhang et al., 2020b). However, because of the lack of large, well-controlled studies on the immune responses of hospitalized patients with non-COVID-19 critical pneumonias, the extent to which these immune changes are COVID-19 specific or common to other life-threatening pathogen-induced pneumonias remains unclear. Identifying those immune phenotypes and processes underlying severe COVID-19 would represent an important step forward in the rational development of new and more effective ways of treating this uniquely challenging disease.
Here, we compared immune profiles in longitudinally collected blood samples from mild and severe COVID-19 patients, alongside a cohort of critically ill patients suffering from pneumonia triggered by non-SARS-CoV-2 pathogens and healthy controls (HCs). This enabled us to identify immune signatures specific to SARS-CoV-2 and those shared with other pathogen-associated severe RSs. Whereas emergency myelopoiesis and adaptive immune paralysis are common features of RSs, signs of T cell exhaustion and reduced cytotoxicity were exclusive to COVID-19. Last, the identification of circulating NKT frequencies as a predictive biomarker for patient outcome could immediately serve for early patient stratification and decision making.
Results
Study participants, sampling protocols, and experimental approach
We recruited three cohorts of participants: 57 COVID-19 patients (150 samples) from three independent centers across Germany (Tuebingen) and France (Toulouse and Nantes). COVID-19 patients were categorized into six severity grades on the basis of the World Health Organization’s (WHO) ordinal scale (World Health Organization, 2020b), which subdivides mild (severity grades 1–3, COVID-19m) and severe (severity grades 4–6, COVID-19s) disease. The second cohort included 25 patients admitted to the ICU with non-SARS-CoV-2 pneumonia (hospital-acquired pneumonia [HAP]), and the third cohort consisted of 21 HCs (Figure 1A). For the HAP cohort, all episodes of pneumonia were classified as severe and required invasive mechanical ventilation. Comprehensive demographic data were collected and are provided in Figure S1A and Tables S1A and S1B.
Figure 1.

Immunomonitoring reveals differing immune landscapes in COVID-19m, COVID-19s, and HAP patients
(A) Schematic of experimental approach.
(B) UMAP with FlowSOM overlay showing total CD45pos cells of combined samples. One thousand cells were subsetted from every sample from each cohort.
(C) PCA of the total immune compartment on the basis of marker expression in the surface panel.
(D) Comparison of immune features derived from each leukocyte subpopulation between experimental groups. A dot plot displaying the ES calculated in HAP versus COVID-19s (x axis; threshold 0.4) compared with the ES calculated in COVID-19m versus COVID-19s (y axis; threshold 0.3). Each dot represents one immunological feature; colors represent the leukocyte compartment they refer to.
(E) Proportion of each immune compartment (normalized to input) in the identified sets of immune features highlighted in (D).
See also Figure S1.
COVID-19 patients gave blood samples between days 0 and 96 after their hospital admission (Table S1C; except one patient assigned to severity grade 1), while HAP patients gave a single blood sample at 1–4 days post-diagnosis of pneumonia, and HCs also donated once. In the case of COVID-19 patients, the time from infection to hospital admission is on average 6.4 days (Lauer et al., 2020; Li et al., 2020). In total, we collected 196 blood samples across all cohorts. Blood samples were processed for full blood counts and standard biochemistry at the clinical centers, with peripheral blood mononuclear cells (PBMCs) isolated and cryopreserved for later analysis (Figures 1A and S1A).
The samples were subjected to high-parametric single-cell spectral flow cytometry (Figures 1A and S1A; Table S1A). We used three overlapping antibody panels targeting a range of cell surface molecules, including the SARS-CoV-2 receptor angiotensin-converting enzyme 2 (ACE2) (Table S2A), and cytokines (after short-term stimulation; Tables S2B and S2C). This immune profiling approach enabled us to assess (1) the overall lymphocyte and myeloid composition of PBMCs, (2) the relative abundance of T cell subsets and their effector or memory status, (3) levels of B cell differentiation, (4) levels of natural killer (NK) cell differentiation, (5) the relative abundance of monocyte and dendritic cell (DC) subsets, (6) signs of lymphocyte activation and exhaustion, (7) cytokine production by lymphocytes, and (8) cytokine production by myeloid cells. All samples were quality screened (for details, see STAR Methods), leading to the inclusion of 167 PBMC samples across all cohorts. We used computational data integration based on 50 markers from spectral flow cytometry together with 25 clinical measures (e.g., age, sex, body mass index [BMI]) and human leukocyte antigen (HLA) typing to ultimately define the severe COVID-19-specific immune landscape (Table S1A).
Immunomonitoring reveals differing immune landscapes in COVID-19m, COVID-19s, and HAP patients
To generate an overview of the circulating immune compartment in COVID-19m and COVID-19s patients, we analyzed spectral flow cytometry data using FlowSOM-based clustering (Van Gassen et al., 2015) combined with uniform manifold approximation and projection (UMAP) dimensionality reduction (McInnes, et al., 2018) (Figures 1B, S1B, and S1C). Comparison of PBMCs from HCs and COVID-19 patients revealed numerous frequency alterations of canonical immune subsets among CD45+ cells, except CD4+ lymphocytes, NK cells, and monocytes, which were comparable across all time points (TPs) (Figure S1D). Compared with COVID-19m, severe disease was characterized by significantly lower frequencies of CD8+ T cells coupled with higher frequencies of B cells (Figure S1D).
We next combined all cytometry parameters of the surface panel (Table S2A) to deeply phenotype T cell, B cell, NK cell, DC, and monocyte subsets from each cohort, assessing their differentiation and activation state as well as their exhaustion profile. Following data integration and HAP inclusion, a principal-component analysis (PCA) of the resulting immune landscapes showed a clear segregation of cells from HCs compared with both COVID-19 and HAP groups, while COVID-19s patients shared signatures both with COVID-19m and HAP patients (Figures 1C and S1E). Stratification of the COVID-19 cohort data by sex or age did not reveal marked differences in immune phenotypes (Figures S1F and S1G).
To uncover the immunological dysregulation of COVID-19s that is distinct from the inflammatory, infectious immune signatures of HAP, we further enriched our dataset with an overall lymphoid and myeloid cytokine profile of the different subpopulations (Tables S2B and S2C). We introduced the statistical measure of the effect size (ES) to combine both significance and fold change in a single statistical value, as proposed in previous clinical trials (McGough and Faraone, 2009; Sullivan and Feinn, 2012). We computed the ES of the Mann-Whitney U test between the analyzed groups (Figure 1D). Applying the interpretation of ES by Cohen (0.1–0.3, small effect; >0.3 intermediate and large effects) (Cohen, 1977), we set the threshold for the comparison of mild versus severe COVID to 0.3. Because of the large number of features reaching the threshold of 0.3 in the comparison of COVID-19s versus HAP, we applied a more stringent cut-off of 0.4 in order to exclusively filter COVID-19s-specific features. This revealed that mild and severe COVID-19 exhibit distinct immune signatures (represented by an ES > 0.3 and seen in the upper part of the dot plot in Figure 1D), but in addition, COVID-19s and HAP could be distinguished by a set of immune features (displayed in the upper right square in Figure 1D; threshold ES > 0.4 versus HAP). Immune alterations in severe RSs (COVID-19s and HAP) occurred within the T cell, NK cell, monocyte, and DC compartments (Figure 1E).
Taken together, COVID-19s presents immune features that are both shared and distinct from other pneumonia and affect all immune compartments except for B cells.
Shared T cell features between severe pathogen-induced RSs highlight the emergence of hyperinflammatory and exhausted subsets in COVID-19s
Following selection of the common immunological trajectories shared across severe RS patients (COVID-19s and HAP) (Figure 1D, upper left square), we further extracted their dynamic manifestation in the COVID-19 cohort by correlation to disease severity and analysis over time. The identified patterns revealed predominantly the T cell compartment (Figures 2A, 2B, S2A, and S2B; Table S3). The reduction in CD4− CD8− (TCRγδ-enriched) T cell frequency appeared to be progressive, reaching its lowest during the second week of hospitalization (TP 3, days 6–9) (Figure 2C). Moreover, we observed significantly higher expression levels of PD-1 in COVID-19s patients during the first 5 days of hospital admission, predominantly affecting the CD4+ T cell compartment, pointing to a potential functional deficit in T helper (Th) cell immune responses (Figure 2D). Although in samples from COVID-19m patients, PD-1 expression normalized at TP 5 (weeks 4–14), it remained elevated in memory CD4+ T cell subsets in COVID-19s (Figure S2C). In contrast to PD-1, the detected upregulation of the inhibitory receptor CTLA-4 on PMA and ionomycin-restimulated CD4+ effector memory (EM) cells occurred only at later stages of disease (TPs 3 and 4, days 6–15) (Figures 2E and S2D). These findings point to a shared altered innate immune response and signs of hyperinflammation and exhaustion within the T cell compartment across all patients with severe RSs.
Figure 2.

Shared T cell features between severe pathogen-induced RSs highlight the emergence of hyperinflammatory and exhausted subsets in COVID-19s
(A) Comparison of immune features derived from each leukocyte subpopulation between experimental groups. A dot plot displaying the ES calculated in HAP versus COVID-19s (x axis; threshold 0.4) compared with the ES calculated in COVID-19m versus COVID-19s (y axis; threshold 0.3). Each dot represents one immunological feature. The red box highlights immune features, which are associated with severe RS (COVID-19s and HAP), with a focus on changes within the T cell fraction.
(B) UMAP with FlowSOM overlay of total T cells of combined samples. One thousand cells were subsetted from every sample from each cohort. T cell subsets with transparent names do not contain immune features highlighted in (A).
(C) Median frequencies and 25th and 75th percentiles of FlowSOM-generated CD4− CD8− (TCRγδ-enriched) immune cell cluster.
(D) Median expression and 25th and 75th percentiles of PD-1 in FlowSOM-generated immune cell clusters shown in (B).
(E) Median expression of CTLA-4 within CD4+ EM T cell subset of HCs shown in gray, of HAP in blue, and of mild and severe COVID-19 patients across TPs 1–5 shown in red.
(F) Schematic overview of cytokine polarization profile comparing COVID-19s and COVID-19m. UMAP with FlowSOM overlay shows cytokine-producing T cell subpopulations (features reaching ES > 0.3). One thousand T cells were subsetted from every sample from each cohort.
(G) Median frequency and 25th and 75th percentiles of IFN-γ-positive cells in FlowSOM-generated immune cell clusters shown in F.
(H) Median frequency and 25th and 75th percentiles of IL-2-positive cells in FlowSOM-generated immune cell cluster shown in (F).
(I) Correlation between frequency of GM-CSF expressing CD4+ (left panel) and CD8+ (right panel) TEMRA cells and the severity grade of COVID-19 patients in combined TPs 1 and 2.
(J) Heatmap depicting the Z score of each T cell related immune feature (highlighted in A) compared with HCs for every TP. Both negative and positive changes are visualized by intensity of red color scale. MFI, mean fluorescence intensity.
∗p < 0.05, ∗∗p < 0.01, ∗∗∗p < 0.001, and ∗∗∗∗p < 0.0001, Mann-Whitney test, Benjamini-Hochberg (BH) correction. See also Figure S2.
In order to interrogate the cytokine polarization, the cells were briefly stimulated in vitro prior to spectral flow acquisition. The resulting cytokine profile of stimulated lymphoid subpopulations from COVID-19 patients showed significantly higher amounts of IL-21, as well as a shift toward a cytotoxic phenotype indicated by high levels of granzyme B and perforin in the T and NK cell compartments, relative to HCs (Figures S2E and S2F; data not shown). CD107a on T and NK cells was similar in COVID-19s, COVID-19m, and HCs (data not shown), suggesting not only equal cytotoxicity but also degranulation capacity across COVID-19 disease severity. The same applies for TNF, IL-4, IL-6, and IL-17A, which failed to reach the cut-off ES of 0.3 when comparing mild and severe COVID-19 (Figures 2F and S2G–S2J). However, we found increased production of interferon-γ (IFN-γ), IL-2, and GM-CSF in COVID-19s. Specifically, higher frequencies of IFN-γ-expressing CD8+ EM, TEMRA (CCR7− CD45RA+), and TCRγδ T cells (Figure 2G) and IL-2-expressing TCRγδ T cells were a common feature of severe RSs shared by COVID-19 and HAP (Figure 2H). Elevated frequencies of GM-CSF-producing CD4+ and CD8+ TEMRA cells positively correlated with COVID-19 severity in the acute phase of disease (TPs 1 and 2) (Figures 2I, S2K, and S2L). Single-cell RNA sequencing (scRNA-seq) analysis of blood cells from COVID-19 patients, in absence of ex vivo stimulation, revealed strong expression of CSF2 (encoding for GM-CSF), particularly in CD4+ T cells (Figure S2M). Detailed differentially expressed gene (DEG) analysis of CSF2 high- versus low-expressing CD4+ T cells indicated these cells as a hyperinflammatory subset, strongly expressing TNF, IL21, TNFRSF4, GNLY, CD40LG, CCL20, and ICAM1 and demonstrating low ANXA1 mRNA levels, among others (Figure S2N).
Overall, these data demonstrate a T cell compartment marked by both hyperinflammatory and exhaustive features shared by patients with severe COVID-19 and non-SARS-CoV-2-induced RSs (HAP). Over time, this phenotype persists, particularly in disease courses of COVID-19s (Figure 2J).
Phenotypic alterations in innate immune signatures are shared in severe COVID-19 and HAP
We further characterized the identified DC and NK cell features shared by COVID-19s and HAP (Figure 3A; Table S3). To reveal the dynamic changes over time, we displayed the COVID-19 cohorts together with HCs as baseline and HAP patients as comparison. Lower expression of HLA-DR in CD56low CD16− NK cells suggest a diminished cytotoxic response in COVID-19s (Figures 3B–3D and S3A) (Erokhina et al., 2021). Similarly, COVID-19s displayed reduced frequency of plasmacytoid DCs (pDCs) (Figures 3E–3G and S3B). Although the pDC frequency was also different from HAP, the cut-offs of ES were not reached. Upregulation of the Fas receptor CD95 was detected in all DC subsets, particularly on pDCs, at early TPs 1 and 2 (Figures S3C and S3D). This might play a role in the loss of those cells through Fas-mediated apoptosis.
Figure 3.

Phenotypic alterations in innate immune signatures are shared in severe COVID-19 and HAP
(A) Comparison of immune features derived from each leukocyte subpopulation between experimental groups. A dot plot displaying the ES calculated in HAP versus COVID-19s (x axis; threshold 0.4) compared with the ES calculated in COVID-19m versus COVID-19s (y axis; threshold 0.3). Each dot represents one immunological feature. The red box highlights immune features, which are associated with severe RS, with a focus on changes within the monocyte, DC, and NK cell fraction.
(B) UMAP with FlowSOM overlay of total NK cells of combined samples. One thousand cells were subsetted from every sample from each cohort. NK cell subsets with transparent names do not contain immune features highlighted in (A).
(C) Median expression of various markers in FlowSOM-derived clusters shown in (B).
(D) Median expression and 25th and 75th percentiles of HLA-DR in FlowSOM-generated CD56low CD16− NK cell cluster shown in (B), combined for TP 1 and 2 (left panel) or displayed for every individual TP (right panel).
(E) UMAP with FlowSOM overlay of total monocytes and DCs of combined samples. One thousand cells were subsetted from every sample from each cohort. Monocyte and DC subsets with transparent names do not contain immune features highlighted in (A).
(F) Median expression of various markers in FlowSOM-derived clusters shown in (E).
(G) Median frequencies and 25th and 75th percentiles of FlowSOM-generated pDC immune cell cluster.
(H) Correlation between median expression of CCR2 in cDC2s following TLR7 and TLR8 stimulation against the severity grade of COVID-19 patients. All TPs have been pooled in the left panel and individual TPs depicted in the right panel.
(I) Heatmap depicting the Z score of each monocyte and DC related immune feature (highlighted in A) compared with HCs for every TP. Both negative and positive changes are visualized by intensity of red color scale. MFI, mean fluorescence intensity.
∗p < 0.05, ∗∗p < 0.01, ∗∗∗p < 0.001, and ∗∗∗∗p < 0.0001, Mann-Whitney test, BH correction. See also Figure S3.
To mimic SARS-CoV-2 infection in vitro, the PBMC samples were stimulated for 8 h with the TLR7 and TLR8 agonist R848. In response, intermediate and non-classical monocytes as well as conventional DC2s (cDC2s) upregulated expression of the chemokine receptor CCR2 (Figures S3E and S3F), but only the cDC2-related feature reached the cut-off for being COVID-19s specific (ES > 0.3 versus COVID-19m) and positively correlated with the severity grade of SARS-CoV-2-mediated disease (Figure 3H). As CCR2 expression on DCs is a hallmark of inflammation and required for their migration to the inflamed lung (Kvedaraite et al., 2020; Nakano et al., 2017), this could explain the invasion of DCs into the lungs of patients hospitalized with severe COVID-19. The NK- and DC-specific dysregulation described here was already apparent during the early phase of the disease, and the vast majority of these changes persisted until TP 5 in COVID-19s patients yet resolved in patients with COVID-19m (Figure 3I). In line with reduced pDC frequencies, IFN-α levels in the serum of COVID-19s patients showed a robust trend toward reduction compared with COVID-19m (Figure S3G).
To summarize, patients with severe RSs show signs of diminished cytotoxicity combined with increased cell migration within the NK cell and DC compartment independent of the underlying pathogen.
Impaired antigen presentation distinguishes the immune response to SARS-CoV-2 compared with other respiratory pathogens
After defining several common immunological features characterizing the immune landscape of COVID-19s in common with HAP, we next extracted the features specific to SARS-CoV-2 infection. We selected all immune traits characterizing COVID-19s (cut-off ES versus COVID-19m > 0.3), and to further condense the signature uniquely existing in COVID-19s and being different from HAP, we set a strict cut-off ES of 0.4 versus HAP (Figure 4A; Table S3). Building on the above-described common myeloid features, there were also phenotypic changes within this compartment that were specific to COVID-19s. Specifically, there was significantly lower expression of HLA-DR as well as the co-stimulatory ligand CD86 across antigen-presenting cell (APC) subsets, which persisted throughout the duration of our study and were not shared to this extent by patients with mild COVID-19 disease (Figures 4B, 4C, S4A, and S4B). The protein expression of both HLA-DR and CD86 negatively correlated with the severity of COVID-19, with highest significance of this relationship within monocytes (Figures 4D, 4E, S4C, and S4D). Although the apparent paralysis in the APC compartment fulfilled the criteria for COVID-19s specificity (Figure 4F), this was driven largely by more pronounced APC dysfunction in HAP compared with HCs (Figures 4G and 4H). Taken together, the emerging overall picture is of a myeloid compartment characterized by impaired APC function, most likely due to emergency myelopoiesis, in COVID-19s. However, the data suggest that this is a feature shared across all patients with severe RSs and not specific to the immune response against SARS-CoV-2.
Figure 4.

Impaired antigen presentation distinguishes the immune response to SARS-CoV-2 versus other respiratory pathogens
(A) Comparison of immune features derived from each leukocyte subpopulation between experimental groups. A dot plot displaying the ES calculated in HAP versus COVID-19s (x axis; threshold 0.4) compared with the ES calculated in COVID-19m versus COVID-19s (y axis; threshold 0.3). Each dot represents one immunological feature. The red box highlights immune features, which are different in COVID-19s and HAP, with a focus on changes within the monocyte and DC fraction.
(B and C) Median expression of HLA-DR (B) or CD86 (C) within classical monocytes of HCs shown in gray, HAP patients in blue, and COVID-19m and COVID-19s patients across TPs 1–5 shown in red.
(D and E) Correlation between median expression of HLA-DR (D) or CD86 (E) in monocytes or DCs (TPs 1 and 2 pooled) against the severity grade of COVID-19 patients.
(F) Heatmap depicting the Z score of each monocyte and DC related immune feature (highlighted in A) compared with HCs for every TP. Both negative and positive changes are visualized by intensity of red color scale.
(G and H) Median expression and the 25th and 75th percentiles of HLA-DR (G) or CD86 (H) in FlowSOM-generated monocyte and DC immune cell clusters.
∗p < 0.05, ∗∗p < 0.01, ∗∗∗p < 0.001, and ∗∗∗∗p < 0.0001, Mann-Whitney test, BH correction. See also Figure S4.
Distinct signatures of COVID-19s are exclusive to the lymphocyte compartment
Although most of the alterations in the monocyte and DC compartment were convergent in the two severe RSs, we identified COVID-19s-specific T and NK cell signatures (Figure 5A; Table S3; ES for COVID-19s versus COVID-19m > 0.3 and versus HAP > 0.4). A focused analysis of all T cell subsets (Figure S5A) revealed a dramatic loss of NKT cells in COVID-19s as one of those signatures (Figure 5B). This NKT cell reduction was already apparent within the first week after COVID-19-related hospital admission (TPs 1 and 2). As shown in the receiver operating characteristic (ROC) curve in Table S4, a cut-off for NKT frequency among T cells of 2.3% can distinguish severe COVID-19 patients from mild disease with sensitivity of 100% at days 0–2 after hospital admission. This finding defines NKT frequency as a powerful predictive biomarker for COVID-19s evolution and furthermore suggests a role of these cells in the first phase of disease.
Figure 5.

Distinct signatures of COVID-19s are exclusive to the lymphocyte compartment
(A) Comparison of immune features derived from each leukocyte subpopulation between experimental groups. A dot plot displaying the ES calculated in HAP versus COVID-19s (x axis; threshold 0.4) compared with the ES calculated in COVID-19m versus COVID-19s (y axis; threshold 0.3). Each dot represents one immunological feature. The red box highlights immune features, which are different in COVID-19s and HAP, with a focus on changes within the T and NK cell fraction.
(B) Median frequencies and 25th and 75th percentiles of FlowSOM-generated NKT immune cell cluster.
(C) Correlation between median expression of PD-1 in CD4+ EM cells (TPs 1 and 2 pooled) against the severity grade of COVID-19 patients.
(D) Correlation between median expression of CD38 in CD4− CD8− (TCRγδ-enriched) and CD4+ EM T cells (TPs 1 and 2 pooled) against the severity grade of COVID-19 patients.
(E) Median expression and 25th and 75th percentiles of CD161 in FlowSOM-generated CD4− CD8− (TCRγδ-enriched) immune cell cluster.
(F) Correlation between median expression of CD95 in CD56high NK cells (TPs 1 and 2 pooled) against the severity grade of COVID-19 patients.
(G) Schematic overview of cytokine polarization profile comparing COVID-19s and COVID-19m. UMAP with FlowSOM overlay shows cytokine-producing T cells (features reaching an ES > 0.3 versus COVID-19m and > 0.4 versus HAP). One thousand T cells were subsetted from every sample from each cohort.
(H) Median frequency and 25th and 75th percentiles of IFN-γ-positive cells in FlowSOM-generated immune cell clusters shown in (G).
(I) Heatmap depicting the Z score of each T and NK cell related immune feature (highlighted in A) compared with HCs for every TP. Both negative and positive changes are visualized by intensity of red color scale. MFI, mean fluorescence intensity.
(J) Median frequencies or expression of indicated populations and markers. Box plots show the 25th and 75th percentiles.
∗p < 0.05, ∗∗p < 0.01, ∗∗∗p < 0.001, and ∗∗∗∗p < 0.0001, Mann-Whitney test, BH correction. See also Figure S5.
In addition to the above-described upregulation of PD-1 predominantly in CD4+ T cells, higher expression of PD-1 by CD4+ EM cells turned out to be a feature unique to COVID-19s (ES versus HAP > 0.4), which positively correlated with severity grade (Figures 5C and S5B). Chronically stimulated T cells overexpress inhibitory receptors, including PD-1, and display poor effector capacity (Ahmadzadeh et al., 2009; Crawford et al., 2014; Huang et al., 2019a; Pauken and Wherry, 2015; Wu et al., 2014). By comparing PDCD1 high- and low-expressing CD4+ T cells using a scRNA-seq dataset (Zhao et al., 2021), we found PDCD1-high CD4+ T cells to express genes associated with exhaustion (HAVCR2, LAG3, CTLA4, TIGIT, and BATF) as well as reduced amounts of TCF7, TNF, IL2RA, TNFRSF4, FAS, and MIKI67, associated with T cell activation (Figure S5C). This dataset supports the notion that the T cell compartment in COVID-19 patients is impaired or exhausted.
The protein expression of CD38, another activation marker, across several T cell subsets positively correlated with COVID-19 severity, with the highest significance (p < 0.0001, R2 = 0.24) in CD4− CD8− (TCRγδ-enriched) T cells (Figures 5D and S5D). Furthermore, we observed a loss of the regulatory protein CD161 in CD4− CD8− (TCRγδ-enriched) T cells in COVID-19s (Figures 5E and S5E). This phenomenon is especially intriguing, as CD4− CD8− (TCRγδ-enriched) T cells share the transcriptional signatures of CD161-expressing mucosa-associated invariant T (MAIT) cells, a CD8+ T cell subset resembling innate-like sensors and mediators of antiviral responses (Fergusson et al., 2014, 2016).
Although failing to reach the stringent cut-off for being a unique COVID-19s-specific feature (ES versus HAP > 0.4), CD161 was also expressed at a significantly lower level on immature and CD56low CD16+ NK cells in the early phase of severe SARS-CoV-2 related illness compared with mild disease (Figure S5F). Here, the kinetics of CD161 expression was low at the beginning of disease with a delayed hyperreactivity in COVID-19s (Figure S5F). Further dissecting the NK cell compartment, CD95 expression in the CD56high NK subset positively correlated with severity of COVID-19 and represents a unique characteristic specific to SARS-CoV-2 infection (Figures 5F and S5G). As in the DC compartment described before, the significant and specific reduction of this NK subset supports Fas-mediated, activation-induced apoptosis as the mechanism underlying the shift from effector to immature NK cells (Figure S5H).
Regarding the cytokine polarization profile, reduced production of IFN-γ in CD4+ central memory (CM) T cells was found to be COVID-19s specific and reflects the loss of CD4+ CXCR3+ CCR6+ (Th1 Th17-enriched) T cells (Figures 5G and 5H). All features falling in the COVID-19s-specific category and diverging from HAP recovered only partly, both in mild and severe SARS-CoV-2-infected patients, pointing to a persisting dysfunctional T and NK cell compartment (Figure 5I).
The recorded myeloid features in COVID-19s were even more pronounced in the HAP patients (Figures 4G and 4H). In contrast, several identified COVID-19s-specific T and NK cell features were clearly different from what has been observed in HC and HAP (Figures 5B, 5E, 5H, and 5J). Taken together, whereas changes in the myeloid compartment are shared across severe RS patients, our differential display approach extracted signatures of T cell exhaustion and altered early antiviral innate lymphoid response specific to the immune response to SARS-CoV-2.
HLA profile links COVID-19 immunopathology to impaired virus recognition
After defining the pathological immune landscape specific for SARS-CoV-2 and distinct from other pathogen-induced pneumonias, we next explored the degree of correlation existing across these and other COVID-19s-associated immune features in order to depict the overall immune network underlying COVID-19s. We therefore selected all signatures associated with COVID-19s (ES versus COVID-19m > 0.3) from TPs 1 and 2 and, for each feature, computed Pearson’s r correlation values visualized in a heatmap plot for each COVID-19s and HAP (Figure 6A). Given the power of this multi-dimensional, global analysis tool, it was possible to identify correlation patterns within the immune network of the two investigated conditions, namely, COVID-19s and HAP. Focusing on the interactive network underlying early and severe SARS-CoV-2-mediated disease, we discovered distinctive associations between different branches of adaptive and innate immunity, translating into correlation clusters between myeloid and T cells (#1), myeloid and NK cells (#2), and T and NK cells (#3) (Figure 6A). These associations were weak in HAP, further supporting our claim of a SARS-CoV-2-specific immune landscape that characterizes severe disease courses.
Figure 6.

HLA profile links COVID-19 immunopathology to impaired virus recognition
(A) Correlogram of all immune features (TPs 1 and 2) with ES COVID-19s versus COVID-19m > 0.3, shown for COVID-19s and HAP. Red arrows highlight immune features unique in COVID-19s (ES versus HAP > 0.4). Black boxes 1–3 highlight highly correlating immune clusters.
(B) Correlogram of immune features from TP 1 only with ES COVID-19s versus COVID-19m > 0.3 with HLA score 50. HLA score 50 represents the number of predicted tightly binding SARS-CoV-2 peptides of both HLA alleles of a patient. Red arrows highlight SARS-CoV-2-specific immune features (ES COVID-19s versus HAP > 0.4).
(C) Correlogram of immune features from TP 1 only with ES COVID-19s versus COVID-19m > 0.3 with routinely assessed clinical parameters. Red arrows highlight highly correlating parameters.
(D) Correlation between LDH and granulocyte counts (TP 1 only) against the severity grade of COVID-19 patients.
See also Figure S6.
Because of earlier evidence of SARS-CoV-2 peptide binding to HLA molecules differs across genotypes (Nguyen et al., 2020), we introduced next-generation sequencing (NGS)-based HLA class I typing of 48 patients of our COVID-19 cohort. We calculated the predicted number of tightly binding (<50 nm) SARS-CoV-2-derived peptides per HLA class I gene (on the basis of every single underlying allele genotype) for each of our typed individuals (Figures S6A and S6B; Table S5). This predicted binding capacity for HLA-A, HLA-B, and HLA-C was further called HLA score 50. Next, we integrated this dataset with our single-cell immune profiling analysis and correlated this HLA-A, HLA-B, and HLA-C score 50 to all our extracted severe COVID-19-associated immune features (Figure 6B). This multi-omics approach allowed us to show that the majority of the severe COVID-19-associated immune features of the innate immune system (e.g., NKT frequency, HLA-DR in monocytes and DCs) were correlated with SARS-CoV-2 binding strength (Figure 6B), meaning that efficient HLA binding capacity to SARS-CoV-2 peptides may mitigate the alterations of the innate immune system detected in COVID-19s. Also, the COVID-19s-associated GM-CSF production in CD8+ CM T cells positively correlated with high HLA scores. To conclude, the data suggest that weak HLA binding to SARS-CoV-2 peptides may at least in part drive the immunopathology in COVID-19.
To translate the complex immune signatures into clinical use, we correlated the COVID-19s-defining immune signatures with routine clinical parameters. In order to identify stratifying biomarkers in the very early phase of disease, we included features significantly associated with COVID-19s at TP 1 only. As every COVID-19 patient was graded according to the maximum severity of disease during the longitudinal follow-up of the study and this grading was allocated to every sample of the same patient, the included features of TP 1 fulfil the criteria to be predictive. Several blood values and BMI (indicated by an arrow) were highly correlated with our COVID-19s-defining immune signatures, thereby translating these immunological findings into clinical routine parameters (Figure 6C). To further validate these promising candidates for outcome prediction, we linearly correlated them with COVID-19 severity grade (Figures 6D and S6C). Although the number of provided values was limited, and several associations turned out to be significant but with low R2 value, lactate dehydrogenase (LDH) and granulocyte counts showed a strong correlation with worsening of COVID-19, thus presenting easily applicable biomarkers (Figures 6D and S6D).
In conclusion, we provide a translational path forward based on our differential immune map specific for severe SARS-CoV-2 infection combined with predicted HLA class I binding capacity to SARS-CoV-2 peptides, which can be used to guide therapeutic approaches aimed at interrupting the immunopathologic cascade of severe COVID-19.
ACE2 expression in a CD4+ T cell subset increases after ex vivo stimulation
SARS-CoV-2 uses ACE2 as its receptor for cellular entry (Prompetchara et al., 2020; Zhou et al., 2020). To determine potential entry sites within T cells, we measured ACE2 expression across our immune map. We did not identify ACE2 expression in steady-state healthy T cell subpopulations, whereas samples from severe RSs showed marginal expression, especially in the CD4+ CXCR3+ CCR6+ (Th1 Th17-enriched) subset (Figures 7A–7C, S7A, and S7B) which was significantly reduced in COVID-19s (Figure 7D). When we profiled the stimulated PBMCs mimicking the COVID-19 inflammatory environment, we discovered a CD4+ T cell subpopulation, of which approximately 75%–80% expressed ACE2 (Figures 7E and 7F). This population emerged from samples of both healthy and COVID-19 patients and expressed CD25, PD-1 and CTLA-4 (Figures 7G, 7H, and S7C). Further analysis of this subset demonstrated no relevant overlap with a specific cytokine polarization profile or FOXP3 expression (Figures S7D and S7E). The presence of ACE2 expression on an activated CD4+ T cell subset may provide a mechanism for virus entry and contribution to the immunopathological network of COVID-19.
Figure 7.

ACE2 expression in a CD4+ T cell subset increases after ex vivo stimulation
(A) Comparison of immune features derived from each leukocyte subpopulation between experimental groups. A dot plot displaying the ES calculated in HAP versus COVID-19s (x axis) compared with the ES calculated in COVID-19m versus COVID-19s (y axis). Each dot represents one immunological feature. The red box highlights the immune feature focused in this figure.
(B) Median expression of indicated markers in FlowSOM-derived clusters of unstimulated samples.
(C) Median frequency and 25th and 75th percentiles of ACE2-positive cells in a subset of unstimulated CXCR3+ CCR6+ (Th1 Th17-enriched) CD4+ T cells. All TPs have been pooled.
(D) Median frequency and 25th and 75th percentiles of CXCR3+ CCR6+ (Th1 Th17-enriched) CD4+ T cells at each TP.
(E) Representative plot showing ACE2 and isotype staining within the T cell compartment of PMA and ionomycin-restimulated (5 h) COVID-19 samples.
(F) Median frequency and 25th and 75th percentiles of ACE2-positive cells in FlowSOM-generated immune cell clusters after PMA and ionomycin restimulation (5 h). All TPs have been pooled.
(G) Median expression of various markers in FlowSOM-derived clusters of PMA and ionomycin-restimulated (5 h) samples.
(H) Median expression and 25th and 75th percentiles of PD-1 (left panel) and CTLA-4 (right panel) in FlowSOM-generated immune cell clusters after PMA and ionomycin restimulation (5 h). All TPs have been pooled.
∗p < 0.05, ∗∗p < 0.01, ∗∗∗p < 0.001, and ∗∗∗∗p < 0.0001, Mann-Whitney test, BH correction. See also Figure S7.
Discussion
The comparison of two cohorts of severe infectious RSs (COVID-19s and HAP) driven by different pathogens allowed us to uncover unique immune signatures in SARS-CoV-2-mediated disease. Recent data describe the immunopathogenesis of HAP as critical illness-related immuno-suppression (Roquilly et al., 2019) characterized mainly by alterations in the IL-12-IFN-γ axis (Roquilly et al., 2017). Conversely, the COVID-19 immune response includes traits also occurring in other severe RSs triggered by other pathogens, such as influenza (Lee et al., 2020; Tian et al., 2020). However, mainly because of the small cohort sizes and lack of a comparable control group of patients with non-SARS-CoV-2-driven severe RS, the COVID-19-specific immune signature remains elusive. Within our dataset, a global PCA of all immunophenotypes enabled a clear separation among COVID-19s, COVID-19m, HAP, and HCs. However, there was a partial overlap between COVID-19s and HAP, revealing some core immune features associated with severe RSs independent from the disease etiology.
Although previous studies described impairment in the monocyte and DC compartment to be decisive for a severe COVID-19 course (Arunachalam et al., 2020; Kuri-Cervantes et al., 2020; Merad and Martin, 2020; Silvin et al., 2020), features we confirmed here, those were found to not be exclusive to SARS-CoV-2 immunopathology. We confirmed loss of HLA-DR and CD86 expression in APCs, a finding associated with emergency myelopoiesis, where newly emerging myeloid cells show reduced APC capacity (Schulte-Schrepping et al., 2020). Recent data show the secretion of CCL2 by airway macrophages and a concomitant upregulation of the CCL2 receptor CCR2 in peripheral blood monocytes of SARS-CoV-2-infected patients; thus, extensive accumulation of monocytes and macrophages within alveolar spaces in COVID-19 lung autopsies suggests recruitment from circulation (Szabo et al., 2020). Our data support this, but in addition, we observed that cDC2s also upregulated CCR2 expression with an even greater ES than monocytes. There is evidence for CCR2 being required for DC migration to the inflamed lung, respectively, although this is not the case in the steady-state condition (Nakano et al., 2015, 2017). Thus, the declining number of cDC2s in the systemic circulation of COVID-19 patients may be a reflection of cDC2 extravasation into the affected lungs.
Alongside signatures shared in severe RSs, we also extracted those specific to and unique in COVID-19s. These SARS-CoV-2-induced adaptations were restricted to the T and NK cell compartment. Several studies described upregulation of PD-1 and CD38 alongside other activation and exhaustion markers, suggesting a hyperactivated and exhausted T cell compartment (De Biasi et al., 2020; Chen and Wherry, 2020). However, again, it was unclear as to whether this emerging pattern in lymphocytes is the result of severe RSs in general or is specific to the immunopathology induced by SARS-CoV-2. We here describe an overall picture of T cell exhaustion and altered early antiviral innate lymphoid response unique to COVID-19s.
SARS-CoV-2 entry into the host cells is initiated by binding of the virus to the cell surface transmembrane receptor ACE2, which is predominantly expressed in epithelial cells of the lung, intestine, and endothelial cells (Varga et al., 2020). Our analysis revealed the ability of highly activated CD4+ T cells to express ACE2. Others also detected ACE2-positive lymphocytes in lungs of COVID-19 patients (Ackermann et al., 2020; Feng et al., 2020). Moreover, CD4+ Th cell infection by SARS-CoV-2 occurs in an ACE2-dependent manner (Pierce et al., 2020; Pontelli et al., 2020). Compared with SARS-CoV, SARS-CoV-2 has a 10- to 20-fold higher affinity for host membrane ACE2 (Wrapp et al., 2020). Thus, even low ACE2 expression may be sufficient for viral entry. A direct infection of responding lymphocytes, leading to cell death and impaired SARS-CoV-2 clearance, goes in line with higher peripheral blood viral load positively correlating with COVID-19 severity (Han et al., 2020). In conclusion, the ability for SARS-CoV-2 to directly infect T cells provides yet another potential mechanism to describe the immunopathology of COVID-19.
The cytokine storm in COVID-19 is pronounced as one of the driving immunopathological features in SARS-CoV-2-mediated disease worsening (Merad and Martin, 2020; Moore and June, 2020; Del Valle et al., 2020). Our single-cell profiling of 11 cytokines did not result in higher frequencies of IL-6 and TNF (Del Valle et al., 2020), for which high plasma levels were described in COVID-19 patients, indicating that neutrophils, monocytes, and endothelial cells at the site of infection likely account for the dysregulated cytokine production. Nevertheless, we identified the cellular sources for GM-CSF as predominantly the CD4+ and CD8+ TEMRA subset, a feature of severe COVID-19 shared with HAP, and documented correlation of the expression with COVID-19 severity. Our data complement two recent reports, which show that in particular, lung-invading T cells express GM-CSF (by using scRNA-seq) (Zhao et al., 2021) and that GM-CSF serum levels are elevated in COVID-19 patients (Thwaites et al., 2021). Supportive, elevated circulating GM-CSF+ CD4+ T cell levels are predictive of poor outcomes in sepsis patients (Huang et al., 2019b). Collectively, this suggests that GM-CSF is an early driver of the underlying immunopathological cascade in COVID-19s, thereby being a promising therapeutic target (NRI, GEM TRIAL, ClinicalTrials.gov identifiers NCT04400929 and NCT04411680; Bonaventura et al., 2020; Bosteels et al., 2020; Lang et al., 2020; De Luca et al., 2020).
Using NGS-based HLA typing and further integration of this dataset into our single-cell immune profiling analysis, this multi-omics approach provides deep insights into COVID-19 immunopathology and a potential genetic influence: while COVID-19s-associated innate immune alterations were less pronounced in patients with predicted high HLA class I binding capacity to SARS-CoV-2 peptides, GM-CSF production in CD8+ CM T cells, a feature associated with severe COVID-19 disease, was increased. The occurrence of both mild and severe COVID-19-associated immune features in patients with strong SARS-CoV-2 recognition (high HLA score 50) could further explain the inconsistent reports that attempt to link HLA class I binding capacity to SARS-CoV-2 peptides to COVID-19 severity (Ellinghaus et al., 2020; Iturrieta-Zuazo et al., 2020). By combining single-cell immune mapping with HLA genetics, we uncovered a link between HLA profile and impaired virus recognition in COVID-19.
Because of emerging follow-up studies, an increased number of COVID-19 patients are described as experiencing prolonged symptomatology. This phenomenon, referred to as “long COVID,” affects about 10% of patients. An attributed reason for long-lasting complaints is persistent tissue damage in severe cases. Nevertheless, patients following mild SARS-CoV-2 infections also suffer from prolonged symptoms (Iadecola et al., 2020; Mahase, 2020). We identified several immune features, predominantly of the T and NK compartment, which did not rebound at the end of our study, several weeks after infection. Thus, prolonged immune dysregulation, long after primary pathogen encounter, could play a role in “long COVID.”
An additional aspect of our study was to identify predictive biomarkers of severe COVID-19 patient outcomes. An earlier study identified the frequency of circulating MAIT cells to have predictive value (Flament et al., 2021). Here we identified a dramatic, early loss of NKT cells in the circulating immune compartment of COVID-19s. Although others confirmed this observation (Zhang et al., 2020a; Zingaropoli et al., 2021), here we found this phenomenon indeed to not be shared across severe RS patients but to be specific to the SARS-CoV-2 immune response. NKT cells are important for the production of an early wave of IL-4 promoting germinal center (GC) formation during viral infection. Delay in GC formation in COVID-19 patients may be a direct consequence of NKT cell migration to the airways (Dempsey, 2018; Fontana and Pepper, 2018; Jouan et al., 2020; Kaneko et al., 2020). Translation of this finding into clinical routine diagnostics can easily be implemented using CD3 and CD56 to calculate NKT cell frequencies upon hospital admission. Across our three independent COVID-19 cohorts, a cut-off set to 2.3% for NKT cell frequencies (among T cells) would have identified all patients who later developed severe disease. Early identification of patients at risk could help tailor their treatment and improve the outcome.
Limitations of the study
Although we initially anticipated center-specific batch effects in our multi-center study, this was not the case. However, our HAP cohort consists of patients with severe pneumonia driven by multiple pathogens, both bacterial and viral. The comparison of COVID-19 patients with a pure viral pneumonia cohort could help further specify the unique immune signatures of SARS-CoV-2 and distinctive to other viruses. Using PBMCs as source of analyzed immune cells allows easy implementation of our findings (such as NKT frequency as a predictive biomarker) to the clinics. Even though the simple measurement of circulating NKT cell frequencies would have predicted all of our COVID-19 patients who developed severe disease, larger follow-up studies are needed to solidify this measurement as a predictive biomarker for COVID-19 patient outcomes.
STAR★Methods
Key resources table
| REAGENT or RESOURCE | SOURCE | IDENTIFIER |
|---|---|---|
| Antibodies | ||
| anti-human ACE2 (Biotin) (AC18F) | Adipogen Life sciences | Cat# AG-20A-0032B-C050; RRID: N/A |
| anti-human CCR2 (K036C2), BV605 | BioLegend | Cat# 357213; RRID:AB_2562702 |
| anti-human CCR6 (G034E3), BV711 | BioLegend | Cat# 353435; RRID:AB_2629607 |
| anti-human CCR7 (CD197) (G043H7), BV785 | BioLegend | Cat# 353229; RRID:AB_2561371 |
| anti-human CD11c (B-ly6), BUV661 | BD | Cat# 612968; RRID:AB_2870241 |
| anti-human CD123 (IL-3R) (6H6), APC/Fire 750 | BioLegend | Cat# 306041; RRID:AB_2750163 |
| anti-human CD123 (IL-3R) (6H6), BV711 | BioLegend | Cat# 306029; RRID:AB_2566353 |
| anti-human CD14 (M5E2), BUV737 | BD | Cat# 612763; RRID:AB_2870094 |
| anti-human CD14 (TüK4), Qdot800 | Thermo | Cat# Q10064; RRID:AB_2556449 |
| anti-human CD141 (1A4), BB700 | BD | Cat# 742245; RRID:AB_2740668 |
| anti-human CD152 (CTLA-4) (BNI3), BB790-P | BD | customized |
| anti-human CD16 (3G8), BUV496 | BD | Cat# 612944; RRID:AB_2870224 |
| anti-human CD161 (HP-3G10), eFluor 450 | Thermo | Cat# 48-1619-41; RRID:AB_10854575 |
| anti-human CD19 (HIB19), APC-Cy7 | BioLegend | Cat# 302218; RRID:AB_314248 |
| anti-human CD19 (SJ25C1), PE-Cy5.5 | Thermo | Cat# 35-0198-42; RRID: AB_11218903 |
| anti-human CD194 (CCR4) (1G1), BUV615 | BD | Cat# 613000; RRID:AB_2870269 |
| anti-human CD1c (F10/21A3), BB660-P2 | BD | customized |
| anti-human CD25 (IL-2Ra) (M-A251), PE-Cy7 | BioLegend | Cat# 356107; RRID:AB_2561974 |
| anti-human CD27 (M-T271), BUV563 | BD | Cat# 741366; RRID:AB_2870866 |
| anti-human CD279 (PD-1) (EH12.2H7), BV421 | BioLegend | Cat# 329919; RRID:AB_10900818 |
| anti-human CD279 (PD-1) (EH12.2H7), BV605 | BioLegend | Cat# 329924; RRID:AB_2563212 |
| anti-human CD28 (CD28.2), BV605 | BioLegend | Cat# 302967; RRID:AB_2800754 |
| anti-human CD3 (HIT3a), APC-Cy7 | BioLegend | Cat# 300318; RRID:AB_314054 |
| anti-human CD3 (Oct.03), BV510 | BioLegend | Cat# 317332; RRID:AB_2561943 |
| anti-human CD3 (UCHT1), BUV805 | BD | Cat# 565515; RRID:AB_2739277 |
| anti-human CD33 (WM53), BUV395 | BD | Cat# 740293; RRID:AB_2740032 |
| anti-human CD38 (HIT2), APC-Cy5.5 | Thermo | Cat# MHCD3819; RRID:AB_1472718 |
| anti-human CD4 (SK3), Spark Blue 550 | BioLegend | Cat# 344656; RRID:AB_2819979 |
| anti-human CD45 (2D1), PerCP | BioLegend | Cat# 368506; RRID:AB_2566358 |
| anti-human CD45 (HI-30), BUV805 | BD | Cat# 564915; RRID:AB_2744401 |
| anti-human CD45RA (HI100), BUV395 | BD | Cat# 740298; RRID:AB_2740037 |
| anti-human CD56 (HCD56), APC-Cy7 | BioLegend | Cat# 318332; RRID:AB_10896424 |
| anti-human CD56 (NCAM16.2), BUV737 | BD | Cat# 612766; RRID:AB_2813880 |
| anti-human CD57 (HNK-1), FITC | BioLegend | Cat# 359603; RRID:AB_2562386 |
| anti-human CD8 (3B5), Ax Fluor 700 | Thermo | Cat# MHCD0829; RRID:AB_10372957 |
| anti-human CD86 (2331 (FUN-1)), BUV805 | BD | Cat# 742032; RRID:AB_2871328 |
| anti-human CD95 (FasR) (DX2), PE/Cy5 | Thermo | Cat# 15-0959-42; RRID:AB_11042290 |
| anti-human CXCR3 (G025H7), BV650 | BioLegend | Cat# 353729; RRID:AB_2562628 |
| anti-human CXCR5 (CD185) (RF8B2), BV750 | BD | Cat# 747111; RRID:AB_2871862 |
| anti-human GM-CSF (BVD2-21C11), PE | BD | Cat# 554507; RRID:AB_395440 |
| anti-human Granzyme B (GB11), FITC | BioLegend | Cat# 515403; RRID:AB_2114575 |
| anti-human HLA-DR (L243), BV570 | BioLegend | Cat# 307637; RRID:AB_10895753 |
| anti-human IFN-γ (B27),V450 | BD | Cat# 560371; RRID:AB_1645594 |
| anti-human IgD (IA6-2), BV480 | BD | Cat# 566138; RRID:AB_2739536 |
| anti-human IgG (polyclonal), Ax Fluor 647 | Jackson immuno research | Cat# 109-606-098; RRID:AB_2337899 |
| anti-human IgM (MHM-88), PE/Dazzle594 | BioLegend | Cat# 314529; RRID:AB_2566482 |
| anti-human IL-17A (BL168), APC-Cy7 | BioLegend | Cat# 512320; RRID:AB_10613103 |
| anti-human IL-1β (H1b-98), Pacific Blue | BioLegend | Cat# 511710; RRID:AB_2124350 |
| anti-human IL-2 (MQ1-17H12), BV711 | BioLegend | Cat# 500345; RRID:AB_2616638 |
| anti-human IL-21 (3A3-N2.1), Ax Fluor 647 | BD | Cat# 562043; RRID:AB_10896655 |
| anti-human IL-4 (8D4-8), APC | BioLegend | Cat# 500714; RRID:AB_1877159 |
| anti-human IL-6 (MQ2-13A5), PE/Dazzle594 | BioLegend | Cat# 501122; RRID:AB_2810622 |
| anti-human IL-8 (E8N1), PE-Cy7 | BioLegend | Cat# 511415; RRID:AB_2565290 |
| anti-human TCRγδ (IMMU510), Pe-Cy5 | Beckman Coulter | Cat# IM2662U; RRID: N/A |
| anti-human TNF (MAb11), BV750 | BD | Cat# 566359; RRID:AB_2739709 |
| Streptavidin, BB630-P2 | BD | customized |
| Biological samples | ||
| COVID-19 PBMC samples | University Hospital Tuebingen, Germany | N/A |
| COVID-19 PBMC samples | Toulouse University Hospital, France | N/A |
| COVID-19 PBMC samples | Nantes University Hospital, France | N/A |
| HAP PBMC samples | Nantes University Hospital, France | N/A |
| Healthy PBMC samples | Nantes University Hospital, France | N/A |
| Chemicals, peptides, and recombinant proteins | ||
| RPMI 1640 | Seraglob | Cat# M3413; RRID: N/A |
| Phosphate-buffered saline | Homemade | N/A |
| R848 | Invivogen | Cat# tlrl-r848; RRID: N/A |
| Human TruStain FcX | BioLegend | Cat# 422302; RRID:AB_2818986 |
| Formaldehyde 4.0% | PanReac | Cat# 252931.1211; RRID: N/A |
| Benzonase nuclease | Sigma-Aldrich | Cat# E1014-25KU; RRID: N/A |
| Fetal bovine serum | GIBCO | Cat# A3160802; RRID: N/A |
| Penicillin Streptomycin | GIBCO | Cat# 15140-148; RRID: N/A |
| GlutaMAX | GIBCO | Cat# 35050-038; RRID: N/A |
| Phorbol 12-myristate 13-acetate | Sigma-Aldrich | Cat# P1585-1MG; RRID: N/A |
| Ionomycin | Sigma-Aldrich | Cat# I0634-1MG; RRID: N/A |
| 1x Brefeldin A | BD | Cat# 555029; RRID:AB_2869014 |
| 1x Monensin | BD | Cat# 554724; RRID:AB_2869012 |
| Live/Dead Fixable Blue | Thermo Scientific | Cat# L23105; RRID: N/A |
| DNA easy blood and tissue kit | Quiagen | Cat# 69504; RRID: N/A |
| Deposited data | ||
| spectral flow cytometry data | this study | https://doi.org/10.17632/ffkvft27ds.2 |
| supplemental spreadsheets | this study | https://doi.org/10.17632/ffkvft27ds.2 |
| scRNA-seq data | (Zhao et al., 2021) | https://www.ncbi.nlm.nih.gov/geo/query/acc.cgi?acc=GSE167118 |
| Software and algorithms | ||
| Affinity designer | Affinity | https://affinity.serif.com/de/designer/ |
| corrplot | https://github.com/taiyun/corrplot | |
| dplyr | https://cran.r-project.org/web/packages/dplyr/index.html | |
| FlowJo V10.6.2. | Tree Star | https://www.flowjo.com/ |
| FlowSOM | (Van Gassen et al., 2015) | https://github.com/SofieVG/FlowSOM |
| flowStats | https://www.bioconductor.org/packages/release/bioc/html/flowStats.html | |
| ggplot2 | https://cran.r-project.org/web/packages/ggplot2/index.html | |
| Harmony | (Korsunsky et al., 2019) | https://github.com/immunogenomics/harmony |
| Hmisc | https://cran.r-project.org/web/packages/Hmisc/index.html | |
| pheatmap | https://cran.r-project.org/web/packages/pheatmap/index.html | |
| R studio | (RStudio, 2015) | https://www.rstudio.com/ |
| R version 3.6.1 | (R Core Team, 2013) | https://www.r-project.org/ |
| Seurat (v3.1.4) | (Stuart et al., 2019) | https://satijalab.org/seurat/ |
| SingleR | (Aran et al., 2019) | https://github.com/dviraran/SingleR |
| Stats | https://CRAN.R-project.org/package=STAT | |
| UMAP | (McInnes et al., 2018) | https://github.com/lmcinnes/umap |
| Other | ||
| Automated cell counter | Bio-Rad | N/A |
| Cryo thaw devices | Medax | N/A |
| Cytek Aurora | Cytek Biosciences | N/A |
| Illumina MiniSeq | Illumina | N/A |
| LABScan 3D instrument | Luminex | N/A |
Resource availability
Lead contact
Further information and requests for resources should be directed to and will be fulfilled by the Lead Contact, Burkhard Becher (becher@immunology.uzh.ch).
Materials availability
This study did not generate new unique reagents.
Data and code availability
Spectral flow cytometry data generated during this study have been deposited to Mendeley Data: https://doi.org/10.17632/ffkvft27ds.2.
Experimental model and subject details
COVID-19 patient samples
Clinical routine data and blood samples for peripheral blood mononuclear cell (PBMC) isolation and cryopreservation were collected at the University Hospital Tuebingen (Germany), the Toulouse University Hospital (France, in the frame of the COVID-BioToul biobank, ClinicalTrials.gov Identifier: NCT04385108) and the Nantes University Hospital (France) (Table S1A). All donors had given written informed consent and the study was approved by the regional ethical review board of Tuebingen (COVID-19), Toulouse (COVID-19) and Nantes (COVID-19, HAP, Healthy) respectively. COVID-19 diagnosis was established by a positive PCR test. PBMC samples were collected longitudinally at the indicated time points post-admission to the hospital (Table S1C). COVID-19 patients were graded according to the maximum severity of disease during the study based on the WHO ordinal scale (World Health Organization, 2020b). The WHO grade 1 and 2 were combined to grade 1 in our scale, the WHO grade 7 and 8 were combined to grade 6 in our categorization. The appropriate severity grade was then allocated to all samples of the same patient. Mean age of COVID-19 patients was 62.2 years, the percentage of females was 40.4.
Human subjects with HAP and healthy samples
Bioresources: IBIS-sepsis (severe septic patients) and IBIS (brain-injured patients), Nantes, France. Patients were enrolled from January 2016 to May 2019 in two French Surgical Intensive Care Units of one University Hospital (Nantes, France) and samples collected in accordance to the guideline of standardization (CoBRA) (Bravo et al., 2015). Patients with immunosuppression were not enrolled to the study. The criteria to diagnose hospital-acquired pneumonia were (1) radiological signs combined with (2) body temperature > 38,3 °C without any other cause or leukocytes < 4000/mm3 or > 12000/mm3 and (3) at least two of the following symptoms: purulent sputum, cough or dyspnea, declining oxygenation or increased oxygen-requirement or need for respiratory assistance (Leone et al., 2018). Hospital-acquired pneumonia were microbiologically confirmed with quantitative culture (for patients with antibiotics < 48h) (thresholds of 104 colony-forming units (CFU) per mL for a bronchoalveolar lavage). PCR for Herpes Simplex Virus and Cytomegalovirus were performed in tracheal aspirates at day 1, day 7 and day 15 after ICU admission. The collection of human samples has been declared to the French Ministry of Health (DC-2011-1399), and it has been approved by an institutional review board. Written informed consent from a next-of-kin was required for enrolment. Retrospective consent was obtained from patients, when possible. All patients were clinically followed up for 28 days. Control samples were collected from healthy blood donors, recruited at the Blood Transfusion Center (Etablissement Français du Sang, Nantes, France). Mean age of HAP patients was 43.8 years, the percentage of females was 8.7. Mean age of healthy controls was 52.0 years, the percentage of both females was 44.4.
Method details
Ex vivo reactivation of PBMCs
PBMCs collected in clinics were kept in cell culture medium (RPMI-1640, 10% fetal bovine serum (FBS; GIBCO), and 1 × l-glutamine (GIBCO) and 1 × penicillin streptomycin (GIBCO)) supplemented with 5U ml−1 benzonase (Sigma–Aldrich) and frozen in liquid nitrogen until experimental analysis. Then, for spectral flow analysis, cells were thawed using Cryo thaw devices (Medax). Briefly, cells were resuspended in cell culture medium supplemented with 2U ml−1 benzonase by centrifugation (300 r.c.f.; 7 min; 24°C). Cell count was calculated using an automated cell counter (Bio-Rad). Due to the resulting cell count, cells were used for all panels or surface panel only. Subsequent procedure including short-term reactivation of cryopreserved PBMCs and cytometry analysis were performed as described previously (Galli et al., 2019; Hartmann et al., 2016). Briefly, 2 million (mio) cells were directly stained for cytometry analysis (surface panel), while 1 mio cells were restimulated with 50 ng ml−1 phorbol 12-myristate 13-acetate (Sigma–Aldrich) and 500 ng ml−1 ionomycin (Sigma–Aldrich) in the presence of 1 × Brefeldin A and 1x Monensin (both BD Biosciences) for 5 h at 37°C or in case of R848 stimulation, 2.5 mio cells using 2μg ml−1 R848 (Invivogen) in the presence of 1 × Brefeldin A and 1x Monensin (both BD Biosciences) for 8 h at 37°C.
Surface labeling for spectral flow cytometry
For spectral cytometry, samples were washed in PBS and then resuspended in 100μl of Live Dead Fixable Blue mixture (Thermo Scientific, 1:500) followed by a washing step. To avoid nonspecific binding, the samples were resuspended in 30 μl of True Stain FcX (BioLegend) and incubated for 10 min at 4°C. Anti-human flow cytometric antibodies were purchased pre-conjugated (Tables S2A–S2C). 70 μL of the first surface-antibody mixture was added and cells were incubated for 15 min at 37°C (Table S2A). After another washing step, the second surface-antibody staining step (100 μl) was performed for 15 min at 4°C (Table S2A). Then, fixation was performed using 150 μl of 2% PFA for 15 min at 4°C.
Intracellular cytokine labeling for spectral flow cytometry
For intracellular spectral cytometry, after surface-antibody labeling, cells were fixed and permeabilized using Cytofix Cytoperm reagent (BD Biosciences) for 30 min at 4°C. Intracellular labeling was then performed in 100 μl of 1x permeabilization buffer (Thermo Scientific) for 11 h (Lymphoid cytokine panel, Table S2B) or 10 h (Myeloid cytokine panel, Table S2C) at 4°C.
HLA typing
For DNA extraction the DNA easy blood and tissue kit from Quiagen was used. HLA typing was performed using next generation sequencing (NGS) with the NGSgo-AmpX v2 HLA kits (GenDx, Utrecht, Netherlands), and sequenced on an Illumina MiniSeq (Illumina, San Diego, CA). Sequence data were analyzed with NGSengine (GenDx, Utrecht, Netherlands). For samples with low DNA amount, HLA typing was also performed using sequence specific oligomers (SSO) with the LABType kits (One Lambda, Canoga Park, CA). The bead-based analysis was run on a LABScan 3D instrument (Luminex, Austin, TX) and analyzed using the Fusion Software (One Lambda, Canoga Park, CA). All assays were performed according to the manufacturer’s recommendations.
Quantification and statistical analysis
Acquisition and preprocessing of spectral flow cytometry data
Spectral cytometry samples were acquired on a Cytek Aurora (Cytek Biosciences). Quality control of the Cytek Aurora was performed daily as instructed by the manufacturer. For downstream analysis, dead cells and doublets were excluded using FlowJo (TreeStar). Samples with viability lower than 10% and fewer than 500 live, CD45 positive cells were excluded. Cytometry data were transformed with an inverse hyperbolic sine (arcsinh) function using the R environment (range 30 - 18000). To balance the influence of markers with different dynamic ranges, we performed background subtraction and channel-based percentile normalization using the 99.9th percentile of each marker across the whole dataset (Bendall et al., 2011). Individual cytokine positivity thresholds were determined based on the 99th percentile of the residual staining in an unstimulated or isotype-stained control sample.
Algorithm-based high-dimensional analysis of spectral flow cytometry data
Pre-processed data were downsampled to a maximum of 150’000 cells per donor for the analysis of the main populations, all cells were used for analysis of the specific immune compartments. The high dimensional analysis was carried out using the R environment, based loosely on the workflow described previously (Mair et al., 2016). Two-dimensional UMAP (Uniform Manifold Approximation and Projection) projections were calculated using the umap package (McInnes, et al., 2018). All FlowSOM-based clustering was performed on the whole dataset to enable identification of small populations, and the results were overlaid on the dimensionality reduction maps (Van Gassen et al., 2015). Principal component analysis was carried out in the stats package using the median activation marker expression of all detected leukocyte subsets. The circles represent the core areas added by the default confidence interval of 68%, which facilitates the separation based on the PC1/2 explanatory rate of the overall difference in measured immune features. For the correlogram, Pearson’s r correlation coefficients were computed using the Hmisc package and the resulting correlation matrix was visualized using the corrplot package. All other plots were drawn using ggplot2. For longitudinal visualization, smoothed conditional mean of the feature from the combined COVID-19 cohort was added in light gray.
Calculation of HLA score 50
Based on the study data of Nguyen et al. (Nguyen et al., 2020), the predicted HLA class I binding capacity to SARS-CoV-2-derived peptides per patient was calculated by counting the number of all SARS-CoV-2-derived peptides which were predicted to be bound by each specific HLA allele. The score 50 includes all SARS-CoV-2 peptides which were predicted for tight binding (< 50nm) to the indicated HLA class I allele. The final HLA score 50 per patient represents the total number of tight binding SARS-CoV-2 peptides of both alleles of the patient for HLA-A, HLA-B or HLA-C.
Single-cell RNA-seq analysis
For single-cell RNA-seq analysis we used a publicly available dataset of sorted CD45+ blood cells of COVID-19 patients (https://www.ncbi.nlm.nih.gov/geo/query/acc.cgi?acc=GSE167118), of which 5′-RNA single cell transcriptome (10x genomics) was performed. For preprocessing, the feature-barcode matrices for all the sample were further processed by the R package Seurat (v3.1.4). As a quality-control (QC) step, we first filtered out the cells in which less than 200 genes were detected in the blood samples. To remove potential doublets, we excluded cells with total number of detected genes more than 5000. Low-quality cells with more than 5% mitochondrial genes of all detected genes were removed. The LogNormalize method in Seurat was used to normalize the scRNA-seq and batch effect correction was performed using Harmony. The R package SingleR, an automatic annotation method for single-cell RNA sequencing (Aran et al., 2019) were then used to determine the cell types. The differential expression between selected groups were calculated by the FindAllMarkers function (min.pct = 0.25, logfc.threshold = 0.25, Wilcoxon rank sum tests).
Statistical analysis
Frequencies of immune populations, cytokines, median expression values and absolute counts were compared with the non-parametric Mann–Whitney–Wilcoxon test and Benjamini-Hochberg correction for multiple testing, using the R package rstatix. For correlation measurements, we used a linear regression model by applicating the lm() and summary() functions. P values of less than 0.05 were considered significant and are indicated by an asterisk (∗) or the numerical value on the respective graphs.
Acknowledgments
We thank the patients and blood donors who contributed to this study and the hospitals at Nantes, Toulouse, and Tübingen for sample and data collection. Regarding specifically the COVID-BioToul biobank (ClinicalTrials.gov identifier NCT04385108), we thank the CRB TBR, the Clinical Research Center 1436, and the delegation for clinical research and innovation of Toulouse University Hospital for their highly valuable implication. We thank the biological resource center for biobanking (CHU Nantes, Nantes Université, Centre de Ressources Biologiques [BB-0033-00040], Nantes, France). This work was supported by the Swiss National Science Foundation (733 310030_170320, 310030_188450, and CRSII5_183478 to B.B.; 31CA30_195883 to S. Kreutmair, M.C., M.B., and B.B.), The LOOP Zurich, the Vontobel Foundation (to B.B.), the European Union’s Horizon 2020 research and innovation program under grant 847782 (to B.B. and A.R.) and the European Research Council (ERC; 882424) to B.B., Agence National de la Recherche (ANR) and Region Pays de la Loire – Flash COVID-19:COVARDS project (to A.R.) and the French Ministry of Health with the participation of Groupement Interrégional de Recherche Clinique et d’Innovation Sud-Ouest Outre-Mer (PHRCI 2020 IMMUNOMARK-COV) (to R.L. and G.M.-B.). S. Kreutmair is a recipient of a postdoctoral fellowship from Deutsche Forschungsgemeinschaft (DFG). N.G.N. is a recipient of a University Research Priority Program (URPP) postdoctoral fellowship. F.I. received a PhD fellowship from Studienstiftung des Deutschen Volkes. We thank Dr. Lucy Robinson from Insight Editing London for critical review and editing of the manuscript.
Author contributions
Conceptualization, B.B., S. Kreutmair, S.U., N.G.N., C.A., D.D.F., and A.R.; Methodology, S. Kreutmair, S.U., N.G.N., and F.I.; Formal Analysis, S. Kreutmair, S.U., N.G.N., F.I., M.K., and S.B.; Investigation, S. Kreutmair, S.U., N.G.N., F.I., C.A., and D.D.F.; Resources, B.B., A.R., M.B., G.M.-B., R.L., and M.C.; Sample and Patient Data Collection and Processing, S. Kreutmair, B.G., I.A., S.A.-H., J.N., M.B., G.M.-B., M.L., N.P.J., M.K., N.P.M., S.G., P.R., and H.A.H.; Data Curation, S. Kreutmair, S.U., N.G.N., F.I., C.A., D.D.F., and E.F.; Writing – Original Draft, S. Kreutmair, S. Krishnarajah, and B.B.; Writing – Review & Editing, S. Kreutmair, S.U., N.G.N., F.I., C.A., D.D.F., S. Krishnarajah, M.K., E.F., S.B., B.G., M.L., N.P.J., N.P.M., S.G., P.R., H.A.H., I.A., S.A.-H., J.N., M.C., R.L., G.M.-B., M.B., A.R., and B.B.; Visualization, S. Kreutmair, N.G.N., F.I., and M.K.; Funding Acquisition and Supervision, M.C., R.L., G.M.-B., M.B., A.R., and B.B.
Declaration of interests
The authors declare no competing interests.
Published: May 9, 2021
Footnotes
Supplemental information can be found online at https://doi.org/10.1016/j.immuni.2021.05.002.
Supplemental information
References
- Ackermann M., Verleden S.E., Kuehnel M., Haverich A., Welte T., Laenger F., Vanstapel A., Werlein C., Stark H., Tzankov A. Pulmonary vascular endothelialitis, thrombosis, and angiogenesis in COVID-19. N. Engl. J. Med. 2020;383:120–128. doi: 10.1056/NEJMoa2015432. [DOI] [PMC free article] [PubMed] [Google Scholar]
- Ahmadzadeh M., Johnson L.A., Heemskerk B., Wunderlich J.R., Dudley M.E., White D.E., Rosenberg S.A. Tumor antigen-specific CD8 T cells infiltrating the tumor express high levels of PD-1 and are functionally impaired. Blood. 2009;114:1537–1544. doi: 10.1182/blood-2008-12-195792. [DOI] [PMC free article] [PubMed] [Google Scholar]
- Aran D., Looney A.P., Liu L., Wu E., Fong V., Hsu A., Chak S., Naikawadi R.P., Wolters P.J., Abate A.R. Reference-based analysis of lung single-cell sequencing reveals a transitional profibrotic macrophage. Nat. Immunol. 2019;20:163–172. doi: 10.1038/s41590-018-0276-y. [DOI] [PMC free article] [PubMed] [Google Scholar]
- Armstrong R.A., Kane A.D., Cook T.M. Outcomes from intensive care in patients with COVID-19: a systematic review and meta-analysis of observational studies. Anaesthesia. 2020;75:1340–1349. doi: 10.1111/anae.15201. [DOI] [PubMed] [Google Scholar]
- Arunachalam P.S., Wimmers F., Mok C.K.P., Perera R.A.P.M., Scott M., Hagan T., Sigal N., Feng Y., Bristow L., Tak-Yin Tsang O. Systems biological assessment of immunity to mild versus severe COVID-19 infection in humans. Science. 2020;369:1210–1220. doi: 10.1126/science.abc6261. [DOI] [PMC free article] [PubMed] [Google Scholar]
- Bastard P., Rosen L.B., Zhang Q., Michailidis E., Hoffmann H.-H., Zhang Y., Dorgham K., Philippot Q., Rosain J., Béziat V. Autoantibodies against type I IFNs in patients with life-threatening COVID-19. Science. 2020;370:eabd4585. doi: 10.1126/science.abd4585. [DOI] [PMC free article] [PubMed] [Google Scholar]
- Bendall S.C., Simonds E.F., Qiu P., el Amir A.D., Krutzik P.O., Finck R., Bruggner R.V., Melamed R., Trejo A., Ornatsky O.I. Single-cell mass cytometry of differential immune and drug responses across a human hematopoietic continuum. Science. 2011;332:687–696. doi: 10.1126/science.1198704. [DOI] [PMC free article] [PubMed] [Google Scholar]
- Bonaventura A., Vecchié A., Wang T.S., Lee E., Cremer P.C., Carey B., Rajendram P., Hudock K.M., Korbee L., Van Tassell B.W. Targeting GM-CSF in COVID-19 pneumonia: rationale and strategies. Front. Immunol. 2020;11:1625. doi: 10.3389/fimmu.2020.01625. [DOI] [PMC free article] [PubMed] [Google Scholar]
- Bosteels C., Maes B., Van Damme K., De Leeuw E., Declercq J., Delporte A., Demeyere B., Vermeersch S., Vuylsteke M., Willaert J. Sargramostim to treat patients with acute hypoxic respiratory failure due to COVID-19 (SARPAC): a structured summary of a study protocol for a randomised controlled trial. Trials. 2020;21:491. doi: 10.1186/s13063-020-04451-7. [DOI] [PMC free article] [PubMed] [Google Scholar]
- Bravo E., Calzolari A., De Castro P., Mabile L., Napolitani F., Rossi A.M., Cambon-Thomsen A. Developing a guideline to standardize the citation of bioresources in journal articles (CoBRA) BMC Med. 2015;13:33. doi: 10.1186/s12916-015-0266-y. [DOI] [PMC free article] [PubMed] [Google Scholar]
- Cao X. COVID-19: immunopathology and its implications for therapy. Nat. Rev. Immunol. 2020;20:269–270. doi: 10.1038/s41577-020-0308-3. [DOI] [PMC free article] [PubMed] [Google Scholar]
- Chen Z., Wherry E.J. T cell responses in patients with COVID-19. Nat. Rev. Immunol. 2020;20:529–536. doi: 10.1038/s41577-020-0402-6. [DOI] [PMC free article] [PubMed] [Google Scholar]
- Cohen J. Preface to the original edition. In: Cohen S., editor. Statistical Power Analysis for the Behavioral Sciences. Academic Press; 1977. pp. xiii–xv. [Google Scholar]
- Crawford A., Angelosanto J.M., Kao C., Doering T.A., Odorizzi P.M., Barnett B.E., Wherry E.J. Molecular and transcriptional basis of CD4+ T cell dysfunction during chronic infection. Immunity. 2014;40:289–302. doi: 10.1016/j.immuni.2014.01.005. [DOI] [PMC free article] [PubMed] [Google Scholar]
- De Biasi S., Meschiari M., Gibellini L., Bellinazzi C., Borella R., Fidanza L., Gozzi L., Iannone A., Lo Tartaro D., Mattioli M. Marked T cell activation, senescence, exhaustion and skewing towards TH17 in patients with COVID-19 pneumonia. Nat. Commun. 2020;11:3434. doi: 10.1038/s41467-020-17292-4. [DOI] [PMC free article] [PubMed] [Google Scholar]
- De Luca G., Cavalli G., Campochiaro C., Della-Torre E., Angelillo P., Tomelleri A., Boffini N., Tentori S., Mette F., Farina N. GM-CSF blockade with mavrilimumab in severe COVID-19 pneumonia and systemic hyperinflammation: a single-centre, prospective cohort study. Lancet Rheumatol. 2020;2:e465–e473. doi: 10.1016/S2665-9913(20)30170-3. [DOI] [PMC free article] [PubMed] [Google Scholar]
- Del Valle D.M., Kim-Schulze S., Huang H.-H., Beckmann N.D., Nirenberg S., Wang B., Lavin Y., Swartz T.H., Madduri D., Stock A. An inflammatory cytokine signature predicts COVID-19 severity and survival. Nat. Med. 2020;26:1636–1643. doi: 10.1038/s41591-020-1051-9. [DOI] [PMC free article] [PubMed] [Google Scholar]
- Dempsey L.A. NKT cells aid antiviral responses. Nat. Immunol. 2018;19:99. doi: 10.1038/s41590-017-0039-1. [DOI] [PubMed] [Google Scholar]
- Ellinghaus D., Degenhardt F., Bujanda L., Buti M., Albillos A., Invernizzi P., Fernández J., Prati D., Baselli G., Asselta R., Severe COVID-19 GWAS Group Genomewide association study of severe COVID-19 with respiratory failure. N. Engl. J. Med. 2020;383:1522–1534. doi: 10.1056/NEJMoa2020283. [DOI] [PMC free article] [PubMed] [Google Scholar]
- Erokhina S.A., Streltsova M.A., Kanevskiy L.M., Grechikhina M.V., Sapozhnikov A.M., Kovalenko E.I. HLA-DR-expressing NK cells: effective killers suspected for antigen presentation. J. Leukoc. Biol. 2021;109:327–337. doi: 10.1002/JLB.3RU0420-668RR. [DOI] [PubMed] [Google Scholar]
- Feng Z., Diao B., Wang R., Wang G., Wang C., Tan Y., Liu L., Wang C., Liu Y., Liu Y. The novel severe acute respiratory syndrome coronavirus 2 (SARS-CoV-2) directly decimates human spleens and lymph nodes. medRxiv. 2020 doi: 10.1101/2020.03.27.20045427. [DOI] [Google Scholar]
- Fergusson J.R., Smith K.E., Fleming V.M., Rajoriya N., Newell E.W., Simmons R., Marchi E., Björkander S., Kang Y.-H., Swadling L. CD161 defines a transcriptional and functional phenotype across distinct human T cell lineages. Cell Rep. 2014;9:1075–1088. doi: 10.1016/j.celrep.2014.09.045. [DOI] [PMC free article] [PubMed] [Google Scholar]
- Fergusson J.R., Hühn M.H., Swadling L., Walker L.J., Kurioka A., Llibre A., Bertoletti A., Holländer G., Newell E.W., Davis M.M. CD161(int)CD8+ T cells: a novel population of highly functional, memory CD8+ T cells enriched within the gut. Mucosal Immunol. 2016;9:401–413. doi: 10.1038/mi.2015.69. [DOI] [PMC free article] [PubMed] [Google Scholar]
- Flament H., Rouland M., Beaudoin L., Toubal A., Bertrand L., Lebourgeois S., Rousseau C., Soulard P., Gouda Z., Cagninacci L. Outcome of SARS-CoV-2 infection is linked to MAIT cell activation and cytotoxicity. Nat. Immunol. 2021;22:322–335. doi: 10.1038/s41590-021-00870-z. [DOI] [PubMed] [Google Scholar]
- Fontana M.F., Pepper M. NKTeeing up B cell responses to viral infection. Immunity. 2018;48:198–200. doi: 10.1016/j.immuni.2018.02.008. [DOI] [PMC free article] [PubMed] [Google Scholar]
- Galli E., Friebel E., Ingelfinger F., Unger S., Núñez N.G., Becher B. The end of omics? High dimensional single cell analysis in precision medicine. Eur. J. Immunol. 2019;49:212–220. doi: 10.1002/eji.201847758. [DOI] [PubMed] [Google Scholar]
- Hadjadj J., Yatim N., Barnabei L., Corneau A., Boussier J., Pere H., Charbit B., Bondet V., Chenevier-Gobeaux C., Breillat P. Impaired type I interferon activity and exacerbated inflammatory responses in severe COVID-19 patients. MedRxiv. 2020 doi: 10.1101/2020.04.19.20068015. [DOI] [PMC free article] [PubMed] [Google Scholar]
- Han M., Xu M., Zhang Y., Liu Z., Li S., He T., Li J., Gao Y., Liu W., Li T. Assessing SARS-CoV-2 RNA levels and lymphocyte/T cell counts in COVID-19 patients revealed initial immune status as a major determinant of disease severity. Med. Microbiol. Immunol. (Berl.) 2020;209:657–668. doi: 10.1007/s00430-020-00693-z. [DOI] [PMC free article] [PubMed] [Google Scholar]
- Hartmann F.J., Bernard-Valnet R., Quériault C., Mrdjen D., Weber L.M., Galli E., Krieg C., Robinson M.D., Nguyen X.H., Dauvilliers Y. High-dimensional single-cell analysis reveals the immune signature of narcolepsy. J. Exp. Med. 2016;213:2621–2633. doi: 10.1084/jem.20160897. [DOI] [PMC free article] [PubMed] [Google Scholar]
- Huang A.C., Orlowski R.J., Xu X., Mick R., George S.M., Yan P.K., Manne S., Kraya A.A., Wubbenhorst B., Dorfman L. A single dose of neoadjuvant PD-1 blockade predicts clinical outcomes in resectable melanoma. Nat. Med. 2019;25:454–461. doi: 10.1038/s41591-019-0357-y. [DOI] [PMC free article] [PubMed] [Google Scholar]
- Huang H., Wang S., Jiang T., Fan R., Zhang Z., Mu J., Li K., Wang Y., Jin L., Lin F. High levels of circulating GM-CSF+CD4+ T cells are predictive of poor outcomes in sepsis patients: a prospective cohort study. Cell. Mol. Immunol. 2019;16:602–610. doi: 10.1038/s41423-018-0164-2. [DOI] [PMC free article] [PubMed] [Google Scholar]
- Iadecola C., Anrather J., Kamel H. Effects of COVID-19 on the nervous system. Cell. 2020;183:16–27.e1. doi: 10.1016/j.cell.2020.08.028. [DOI] [PMC free article] [PubMed] [Google Scholar]
- Iturrieta-Zuazo I., Rita C.G., García-Soidán A., de Malet Pintos-Fonseca A., Alonso-Alarcón N., Pariente-Rodríguez R., Tejeda-Velarde A., Serrano-Villar S., Castañer-Alabau J.L., Nieto-Gañán I. Possible role of HLA class-I genotype in SARS-CoV-2 infection and progression: a pilot study in a cohort of COVID-19 Spanish patients. Clin. Immunol. 2020;219:108572. doi: 10.1016/j.clim.2020.108572. [DOI] [PMC free article] [PubMed] [Google Scholar]
- Iype E., Gulati S. Understanding the asymmetric spread and case fatality rate (CFR) for COVID-19 among countries. MedRxiv. 2020 doi: 10.1101/2020.04.21.20073791. [DOI] [Google Scholar]
- Jouan Y., Guillon A., Gonzalez L., Perez Y., Boisseau C., Ehrmann S., Ferreira M., Daix T., Jeannet R., François B. Phenotypical and functional alteration of unconventional T cells in severe COVID-19 patients. J. Exp. Med. 2020;217:e20200872. doi: 10.1084/jem.20200872. [DOI] [PMC free article] [PubMed] [Google Scholar]
- Kaneko N., Kuo H.-H., Boucau J., Farmer J.R., Allard-Chamard H., Mahajan V.S., Piechocka-Trocha A., Lefteri K., Osborn M., Bals J., Massachusetts Consortium on Pathogen Readiness Specimen Working Group Loss of Bcl-6-expressing T follicular helper cells and germinal centers in COVID-19. Cell. 2020;183:143–157.e13. doi: 10.1016/j.cell.2020.08.025. [DOI] [PMC free article] [PubMed] [Google Scholar]
- Korsunsky I., Millard N., Fan J., Slowikowski K., Zhang F., Wei K., Baglaenko Y., Brenner M., Loh P.-R., Raychaudhuri S. Fast, sensitive and accurate integration of single-cell data with Harmony. Nat. Methods. 2019;16:1289–1296. doi: 10.1038/s41592-019-0619-0. [DOI] [PMC free article] [PubMed] [Google Scholar]
- Kuri-Cervantes L., Pampena M.B., Meng W., Rosenfeld A.M., Ittner C.A.G., Weisman A.R., Agyekum R., Mathew D., Baxter A.E., Vella L. 2020. Immunologic perturbations in severe COVID-19/SARS-CoV-2 infection. BioRxiv Prepr. Serv. Biol. [Google Scholar]
- Kvedaraite E., Hertwig L., Sinha I., Ponzetta A., Hed Myrberg I., Lourda M., Dzidic M., Akber M., Klingstrom J., Folkesson E. Perturbations in the mononuclear phagocyte landscape associated with COVID-19 disease severity. MedRxiv. 2020 doi: 10.1101/2020.08.25.20181404. [DOI] [PMC free article] [PubMed] [Google Scholar]
- Lang F.M., Lee K.M.-C., Teijaro J.R., Becher B., Hamilton J.A. GM-CSF-based treatments in COVID-19: reconciling opposing therapeutic approaches. Nat. Rev. Immunol. 2020;20:507–514. doi: 10.1038/s41577-020-0357-7. [DOI] [PMC free article] [PubMed] [Google Scholar]
- Lauer S.A., Grantz K.H., Bi Q., Jones F.K., Zheng Q., Meredith H.R., Azman A.S., Reich N.G., Lessler J. The incubation period of coronavirus disease 2019 (COVID-19) from publicly reported confirmed cases: estimation and application. Ann. Intern. Med. 2020;172:577–582. doi: 10.7326/M20-0504. [DOI] [PMC free article] [PubMed] [Google Scholar]
- Lee J.S., Park S., Jeong H.W., Ahn J.Y., Choi S.J., Lee H., Choi B., Nam S.K., Sa M., Kwon J.-S. Immunophenotyping of COVID-19 and influenza highlights the role of type I interferons in development of severe COVID-19. Sci. Immunol. 2020;5:eabd1554. doi: 10.1126/sciimmunol.abd1554. [DOI] [PMC free article] [PubMed] [Google Scholar]
- Leone M., Bouadma L., Bouhemad B., Brissaud O., Dauger S., Gibot S., Hraiech S., Jung B., Kipnis E., Launey Y. Hospital-acquired pneumonia in ICU. Anaesth. Crit. Care Pain Med. 2018;37:83–98. doi: 10.1016/j.accpm.2017.11.006. [DOI] [PubMed] [Google Scholar]
- Li Q., Guan X., Wu P., Wang X., Zhou L., Tong Y., Ren R., Leung K.S.M., Lau E.H.Y., Wong J.Y. Early transmission dynamics in Wuhan, China, of novel coronavirus-infected pneumonia. N. Engl. J. Med. 2020;382:1199–1207. doi: 10.1056/NEJMoa2001316. [DOI] [PMC free article] [PubMed] [Google Scholar]
- Lu R., Zhao X., Li J., Niu P., Yang B., Wu H., Wang W., Song H., Huang B., Zhu N. Genomic characterisation and epidemiology of 2019 novel coronavirus: implications for virus origins and receptor binding. Lancet. 2020;395:565–574. doi: 10.1016/S0140-6736(20)30251-8. [DOI] [PMC free article] [PubMed] [Google Scholar]
- Lucas C., Wong P., Klein J., Castro T.B.R., Silva J., Sundaram M., Ellingson M.K., Mao T., Oh J.E., Israelow B., Yale IMPACT Team Longitudinal analyses reveal immunological misfiring in severe COVID-19. Nature. 2020;584:463–469. doi: 10.1038/s41586-020-2588-y. [DOI] [PMC free article] [PubMed] [Google Scholar]
- Mahase E. Long COVID could be four different syndromes, review suggests. BMJ. 2020;371:m3981. doi: 10.1136/bmj.m3981. [DOI] [PubMed] [Google Scholar]
- Mair F., Hartmann F.J., Mrdjen D., Tosevski V., Krieg C., Becher B. The end of gating? An introduction to automated analysis of high dimensional cytometry data. Eur. J. Immunol. 2016;46:34–43. doi: 10.1002/eji.201545774. [DOI] [PubMed] [Google Scholar]
- Mathew D., Giles J.R., Baxter A.E., Oldridge D.A., Greenplate A.R., Wu J.E., Alanio C., Kuri-Cervantes L., Pampena M.B., D’Andrea K. Deep immune profiling of COVID-19 patients reveals distinct immunotypes with therapeutic implications. Science. 2020;369:eabc8511. doi: 10.1126/science.abc8511. [DOI] [PMC free article] [PubMed] [Google Scholar]
- McGough J.J., Faraone S.V. Estimating the size of treatment effects: moving beyond p values. Psychiatry (Edgmont) 2009;6:21–29. [PMC free article] [PubMed] [Google Scholar]
- McInnes L., Healy J., Saul N., Großberger L. UMAP: uniform manifold approximation and projection. J. Open Source Softw. 2018;3:861. [Google Scholar]
- Merad M., Martin J.C. Pathological inflammation in patients with COVID-19: a key role for monocytes and macrophages. Nat. Rev. Immunol. 2020;20:355–362. doi: 10.1038/s41577-020-0331-4. [DOI] [PMC free article] [PubMed] [Google Scholar]
- Moore J.B., June C.H. Cytokine release syndrome in severe COVID-19. Science. 2020;368:473–474. doi: 10.1126/science.abb8925. [DOI] [PubMed] [Google Scholar]
- Nakano H., Moran T., Nakano K., Whitehead G., Thomas S., Cook D. CCR2 promotes accumulation of conventional dendritic cells in the lung during inflammation (CAM4P.149) J. Immunol. 2015;194 185.7. [Google Scholar]
- Nakano H., Lyons-Cohen M.R., Whitehead G.S., Nakano K., Cook D.N. Distinct functions of CXCR4, CCR2, and CX3CR1 direct dendritic cell precursors from the bone marrow to the lung. J. Leukoc. Biol. 2017;101:1143–1153. doi: 10.1189/jlb.1A0616-285R. [DOI] [PMC free article] [PubMed] [Google Scholar]
- Nguyen A., David J.K., Maden S.K., Wood M.A., Weeder B.R., Nellore A., Thompson R.F. Human leukocyte antigen susceptibility map for severe acute respiratory syndrome coronavirus 2. J. Virol. 2020;94 doi: 10.1128/JVI.00510-20. e00510-20. [DOI] [PMC free article] [PubMed] [Google Scholar]
- O’Driscoll M., Dos Santos G.R., Wang L., Cummings D.A.T., Azman A.S., Paireau J., Fontanet A., Cauchemez S., Salje H. Age-specific mortality and immunity patterns of SARS-CoV-2. Nature. 2021;590:140–145. doi: 10.1038/s41586-020-2918-0. [DOI] [PubMed] [Google Scholar]
- Pauken K.E., Wherry E.J. Overcoming T cell exhaustion in infection and cancer. Trends Immunol. 2015;36:265–276. doi: 10.1016/j.it.2015.02.008. [DOI] [PMC free article] [PubMed] [Google Scholar]
- Pierce C.A., Preston-Hurlburt P., Dai Y., Aschner C.B., Cheshenko N., Galen B., Garforth S.J., Herrera N.G., Jangra R.K., Morano N.C. Immune responses to SARS-CoV-2 infection in hospitalized pediatric and adult patients. Sci. Transl. Med. 2020;12:eabd5487. doi: 10.1126/scitranslmed.abd5487. [DOI] [PMC free article] [PubMed] [Google Scholar]
- Poland G.A., Ovsyannikova I.G., Kennedy R.B. SARS-CoV-2 immunity: review and applications to phase 3 vaccine candidates. Lancet. 2020;396:1595–1606. doi: 10.1016/S0140-6736(20)32137-1. [DOI] [PMC free article] [PubMed] [Google Scholar]
- Pontelli M.C., Castro I.A., Martins R.B., Veras F.P., La Serra L., Nascimento D.C., Cardoso R.S., Rosales R., Lima T.M., Souza J.P. Infection of human lymphomononuclear cells by SARS-CoV-2. BioRxiv. 2020 2020.07.28.225912. [Google Scholar]
- Prompetchara E., Ketloy C., Palaga T. Immune responses in COVID-19 and potential vaccines: lessons learned from SARS and MERS epidemic. Asian Pac. J. Allergy Immunol. 2020;38:1–9. doi: 10.12932/AP-200220-0772. [DOI] [PubMed] [Google Scholar]
- R Core Team . R Core Team; Vienna, Austria: 2013. R: A Language and Environment for Statistical Computing. [Google Scholar]
- Roquilly A., McWilliam H.E.G., Jacqueline C., Tian Z., Cinotti R., Rimbert M., Wakim L., Caminschi I., Lahoud M.H., Belz G.T. Local modulation of antigen-presenting cell development after resolution of pneumonia induces long-term susceptibility to secondary infections. Immunity. 2017;47:135–147.e5. doi: 10.1016/j.immuni.2017.06.021. [DOI] [PubMed] [Google Scholar]
- Roquilly A., Torres A., Villadangos J.A., Netea M.G., Dickson R., Becher B., Asehnoune K. Pathophysiological role of respiratory dysbiosis in hospital-acquired pneumonia. Lancet Respir. Med. 2019;7:710–720. doi: 10.1016/S2213-2600(19)30140-7. [DOI] [PubMed] [Google Scholar]
- RStudio . RStudio; Boston: 2015. RStudio: Integrated Development for R. [Google Scholar]
- Schulte-Schrepping J., Reusch N., Paclik D., Baßler K., Schlickeiser S., Zhang B., Krämer B., Krammer T., Brumhard S., Bonaguro L., Deutsche COVID-19 OMICS Initiative (DeCOI) Severe COVID-19 is marked by a dysregulated myeloid cell compartment. Cell. 2020;182:1419–1440.e23. doi: 10.1016/j.cell.2020.08.001. [DOI] [PMC free article] [PubMed] [Google Scholar]
- Silvin A., Chapuis N., Dunsmore G., Goubet A.-G., Dubuisson A., Derosa L., Almire C., Hénon C., Kosmider O., Droin N. Elevated calprotectin and abnormal myeloid cell subsets discriminate severe from mild COVID-19. Cell. 2020;182:1401–1418.e18. doi: 10.1016/j.cell.2020.08.002. [DOI] [PMC free article] [PubMed] [Google Scholar]
- Stuart T., Butler A., Hoffman P., Hafemeister C., Papalexi E., Mauck W.M., 3rd, Hao Y., Stoeckius M., Smibert P., Satija R. Comprehensive integration of single-cell data. Cell. 2019;177:1888–1902.e21. doi: 10.1016/j.cell.2019.05.031. [DOI] [PMC free article] [PubMed] [Google Scholar]
- Su Y., Chen D., Yuan D., Lausted C., Choi J., Dai C.L., Voillet V., Duvvuri V.R., Scherler K., Troisch P. Multi-omics resolves a sharp disease-state shift between mild and moderate COVID-19. Cell. 2020;183:1479–1495.e20. doi: 10.1016/j.cell.2020.10.037. [DOI] [PMC free article] [PubMed] [Google Scholar]
- Sullivan G.M., Feinn R. Using effect size—or why the p value is not enough. J. Grad. Med. Educ. 2012;4:279–282. doi: 10.4300/JGME-D-12-00156.1. [DOI] [PMC free article] [PubMed] [Google Scholar]
- Szabo P.A., Dogra P., Gray J.I., Wells S.B., Connors T.J., Weisberg S.P., Krupska I., Matsumoto R., Poon M.M.L., Idzikowski E. 2020. Analysis of respiratory and systemic immune responses in COVID-19 reveals mechanisms of disease pathogenesis. MedRxiv Prepr. Serv. Heal. Sci. [Google Scholar]
- Thwaites R.S., Sanchez Sevilla Uruchurtu A., Siggins M.K., Liew F., Russell C.D., Moore S.C., Fairfield C., Carter E., Abrams S., Short C.-E., ISARIC4C investigators Inflammatory profiles across the spectrum of disease reveal a distinct role for GM-CSF in severe COVID-19. Sci. Immunol. 2021;6:eabg9873. doi: 10.1126/sciimmunol.abg9873. [DOI] [PMC free article] [PubMed] [Google Scholar]
- Tian W., Zhang N., Jin R., Feng Y., Wang S., Gao S., Gao R., Wu G., Tian D., Tan W. Immune suppression in the early stage of COVID-19 disease. Nat. Commun. 2020;11:5859. doi: 10.1038/s41467-020-19706-9. [DOI] [PMC free article] [PubMed] [Google Scholar]
- Van Gassen S., Callebaut B., Van Helden M.J., Lambrecht B.N., Demeester P., Dhaene T., Saeys Y. FlowSOM: using self-organizing maps for visualization and interpretation of cytometry data. Cytometry A. 2015;87:636–645. doi: 10.1002/cyto.a.22625. [DOI] [PubMed] [Google Scholar]
- Varga Z., Flammer A.J., Steiger P., Haberecker M., Andermatt R., Zinkernagel A.S., Mehra M.R., Schuepbach R.A., Ruschitzka F., Moch H. Endothelial cell infection and endotheliitis in COVID-19. Lancet. 2020;395:1417–1418. doi: 10.1016/S0140-6736(20)30937-5. [DOI] [PMC free article] [PubMed] [Google Scholar]
- World Health Organization . 2020. Weekly epidemiological update on COVID-19.https://www.who.int/publications/m [Google Scholar]
- World Health Organization . 2020. WHO R&D blueprint: novel coronavirus: COVID-19 therapeutic trial synopsis.https://cdn.who.int/media/docs/default-source/blue-print/covid-19-therapeutic-trial-synopsis.pdf?sfvrsn=44b83344_1&download=true [Google Scholar]
- Wrapp D., Wang N., Corbett K.S., Goldsmith J.A., Hsieh C.-L., Abiona O., Graham B.S., McLellan J.S. Cryo-EM structure of the 2019-nCoV spike in the prefusion conformation. Science. 2020;367:1260–1263. doi: 10.1126/science.abb2507. [DOI] [PMC free article] [PubMed] [Google Scholar]
- Wu X., Zhang H., Xing Q., Cui J., Li J., Li Y., Tan Y., Wang S. PD-1(+) CD8(+) T cells are exhausted in tumours and functional in draining lymph nodes of colorectal cancer patients. Br. J. Cancer. 2014;111:1391–1399. doi: 10.1038/bjc.2014.416. [DOI] [PMC free article] [PubMed] [Google Scholar]
- Zhang J.-Y., Wang X.-M., Xing X., Xu Z., Zhang C., Song J.-W., Fan X., Xia P., Fu J.-L., Wang S.-Y. Single-cell landscape of immunological responses in patients with COVID-19. Nat. Immunol. 2020;21:1107–1118. doi: 10.1038/s41590-020-0762-x. [DOI] [PubMed] [Google Scholar]
- Zhang Q., Bastard P., Liu Z., Le Pen J., Moncada-Velez M., Chen J., Ogishi M., Sabli I.K.D., Hodeib S., Korol C. Inborn errors of type I IFN immunity in patients with life-threatening COVID-19. Science. 2020;370:eabd4570. doi: 10.1126/science.abd4570. [DOI] [PMC free article] [PubMed] [Google Scholar]
- Zhao Y., Kilian C., Turner J.-E., Bosurgi L., Roedl K., Bartsch P., Gnirck A.-C., Cortesi F., Schultheiß C., Hellmig M. Clonal expansion and activation of tissue-resident memory-like Th17 cells expressing GM-CSF in the lungs of severe COVID-19 patients. Sci. Immunol. 2021;6:eabf6692. doi: 10.1126/sciimmunol.abf6692. [DOI] [PMC free article] [PubMed] [Google Scholar]
- Zheng M., Gao Y., Wang G., Song G., Liu S., Sun D., Xu Y., Tian Z. Functional exhaustion of antiviral lymphocytes in COVID-19 patients. Cell. Mol. Immunol. 2020;17:533–535. doi: 10.1038/s41423-020-0402-2. [DOI] [PMC free article] [PubMed] [Google Scholar]
- Zhou P., Yang X.L., Wang X.G., Hu B., Zhang L., Zhang W., Si H.R., Zhu Y., Li B., Huang C.L. A pneumonia outbreak associated with a new coronavirus of probable bat origin. Nature. 2020;579:270–273. doi: 10.1038/s41586-020-2012-7. [DOI] [PMC free article] [PubMed] [Google Scholar]
- Zingaropoli M.A., Perri V., Pasculli P., Cogliati Dezza F., Nijhawan P., Savelloni G., La Torre G., D’Agostino C., Mengoni F., Lichtner M. Major reduction of NKT cells in patients with severe COVID-19 pneumonia. Clin. Immunol. 2021;222:108630. doi: 10.1016/j.clim.2020.108630. [DOI] [PMC free article] [PubMed] [Google Scholar]
Associated Data
This section collects any data citations, data availability statements, or supplementary materials included in this article.
Supplementary Materials
Data Availability Statement
Spectral flow cytometry data generated during this study have been deposited to Mendeley Data: https://doi.org/10.17632/ffkvft27ds.2.