Abstract
Background
Pulmonary artery hypertension (PAH) is an incurable disease with a high mortality rate. Current medications ameliorate symptoms but cannot target adverse vascular remodeling. New therapeutic strategies for PAH need to be established.
Methods
Using the weighted gene coexpression network analysis (WGCNA) algorithm, we constructed a coexpression network of dataset GSE117261 from the Gene Expression Omnibus (GEO) database. Key modules were identified by the relationship between module eigengenes and clinical traits. Hub genes were screened out based on gene significance (GS), module membership (MM), and mean pulmonary artery pressure (mPAP). External validations were conducted in GSE48149 and GSE113439. Functional enrichment and immune cell infiltration were analyzed using Metascape and CIBERSORTx.
Results
The WGCNA analysis revealed 13 coexpression modules. The pink module had the highest correlation with PAH in terms of module eigengene (r=0.79; P=2e−18) and module significance (MS =0.43). Functional enrichment indicated genes in the pink module contributed to the immune system process and extracellular matrix (ECM). In the pink module, ECM2 (GS =0.65, MM =0.86, ρ=0.407, P=0.0019) and GLT8D2 (GS =0.63, MM =0.85, ρ=0.443, P=0.006) were identified as hub genes. For immune cells infiltration in PAH lung tissue, hub genes were positively correlated with M2 macrophages and resting mast cells, and were negatively correlated with monocytes, neutrophils, and CD4-naïve T cells.
Conclusions
Our research identified 2 hub genes ECM2 and GLT8D2 related to PAH. The functions of these hub genes were involved in the immune process and ECM, indicating that they might serve as candidate therapeutic targets for PAH.
Keywords: Pulmonary artery hypertension (PAH), weighted gene coexpression network analysis (WGCNA), hub gene, ECM2, GLT8D2
Introduction
Pulmonary artery hypertension (PAH) is a rare disease with an estimated prevalence of 15–50 cases per million individuals (1). Its hemodynamics is defined as the coexistence of mean pulmonary arterial pressure (mPAP) >20 mmHg, pulmonary capillary wedge pressure ≤15 mmHg, and pulmonary vascular resistance ≥3 Wood units (2). Despite the existence of many PAH subtypes, they share features like mPAP elevation, pulmonary vascular resistance, and right heart failure (3).
PAH is characterized by the loss and obstructive remodeling of the pulmonary vascular bed, which leads to an increase in mPAP and right heart failure (3,4). Pulmonary vascular remodeling includes the accumulation of different vascular cells in the pulmonary arterial wall and the perivascular infiltration of inflammatory cells, accompanied by changes in molecular genetics and signaling pathways (3,5,6). Vasodilators, including prostaglandins, phosphodiesterase-5 inhibitors, endothelin receptor antagonists, and soluble guanylate cyclase stimulators, can ameliorate the symptoms of PAH, improve functional capacity and hemodynamics, and reduce hospital admissions. However, among Chinese patients with idiopathic pulmonary artery hypertension (IPAH), the 1- and 3-year survival rates are 92.1% and 75.1%, respectively (7). These medications do not specifically target pulmonary vascular remodeling and inflammation, and PAH remains an incurable cardiopulmonary disorder (4,8). Therefore, new therapeutic targets should be developed.
The rapid development of high-throughput gene expression profiling technology provides powerful tools for identifying disease-related genes, characterizing disease subtypes, and discovering gene signatures for predicting disease prognosis and treatment. It has been successfully applied in some fields, such as breast cancer (9,10). Similarly, the high-throughput strategies also have been applied in the field of PAH (11,12). However, the selection gene features based on differential expression between 2 groups neglects the potential relationships between each gene. They are usually not functionally related and cannot reveal the fundamental biological mechanisms and processes (13,14). Networks based on coexpression data could be used to identify interconnected genes associated with phenotypic traits. By introducing the soft threshold and topological overlap measure (TOM), weighted gene coexpression network analysis (WGCNA) is powerful in discovering highly correlated genes, detecting functional modules related to clinical traits, and identifying diagnostic and therapeutic biomarkers (13-15). Using lung samples of human PAH, this study executed the WGCNA algorithm to construct a weighted gene coexpression network. Our findings may provide more insights into the currently incurable PAH.
We present the following article in accordance with the MDAR checklist (available at http://dx.doi.org/10.21037/jtd-20-3069).
Methods
Data pre-processing
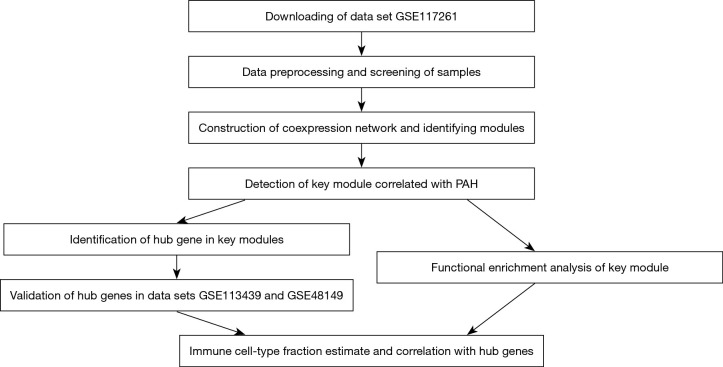
The workflow of this study was shown in Figure 1. Datasets in this study were obtained from National Center for Biotechnology Information (NCBI) Gene Expression Omnibus (GEO) (https://www.ncbi.nlm.nih.gov/geo/). The study was conducted in accordance with the Declaration of Helsinki (as revised in 2013).
Figure 1.
A workflow to summarize the analysis procedure of this study. PAH, pulmonary artery hypertension.
The dataset GSE117261 was selected to carry out the WGCNA algorithm. The gene expression matrix of GSE117261 included messenger RNA (mRNA) expression profiles of lung tissues from 58 PAH patients and 25 failed lung donors (11). Sample GSM3290076 was excluded due to a lack of biological replicates. The raw data were normalized by robust multiarray average (RMA) algorithm, and the batch effect was removed. Similarly, GSE113419, comprising 15 PAH samples and 11 normal samples, and GSE48149, comprising 53 lung samples, were also obtained and normalized (16,17). Microarray probes were mapped to gene symbols using “hugene10sttranscriptcluster.db” package or the annotation of GPL16221 based on their platform, respectively. For genes with multiple probes, only the highest value was selected. Probes not matched were excluded. As for GSE48149, probes were filtered out if the detection p value was lower than 0.05.
Construction of weighted gene coexpression network and module detection
The coefficient of variation of each gene in expression matrix GSE117261 was calculated, and the top 60% of genes were selected for further analysis. The R package “WGCNA” (https://cran.r-project.org/web/packages/WGCNA/index.html) was used to construct a weighted coexpression network. Briefly, the coexpression similarity was first defined as a matrix of the absolute value of each gene’s correlation coefficient. Then, through a thresholding procedure, the coexpression similarity transformed into the weighted network adjacency by raising the coexpression similarity to a power to meet the scale-free network. The soft-thresholding power β was calculated by the function “pickSoftThreshold”. Transforming adjacency into the TOM was executed to measure the network interconnectedness. Branches of the hierarchical clustering dendrogram based on the TOM dissimilarity corresponded to modules. The gene network was constructed by a one-step method using the function “blockwiseModules”.
Identification of clinically significant modules
Module eigengene (ME), the first principal component of the expression matrix in a given module, was calculated to summarize the gene expression profile. Correlation coefficients between ME and clinical traits were calculated to assess the relationship between modules and clinical traits and identify the key modules. Gene significance (GS) was defined as the value of the correlation coefficient between the gene expression profile and sample clinical trait. Module significance (MS) was defined as the average of the absolute GS value for all genes in a given module. The MS was used to verify the key module.
Identification and validation of hub genes
The hub gene is defined as the gene with high connectivity in a module and is considered to have significant functions in relevant clinical traits. Module membership (MM) is measured by correlating the gene expression profile with the ME of a given module to represent intramodular connectivity. Genes with high MM and GS in modules related to clinical traits are natural candidates for further validation. In this study, the threshold of MM and GS was set as 0.8 and 0.2, respectively. Then, Spearman correlation analyses were performed to evaluate the relationships between the gene expression profile and the extent of mPAP to determine hub gene. The reliability of hub genes was further verified in datasets GSE113439 and GSE48149. The expression status of the hub genes in key modules between the PAH and control group was assessed.
Functional enrichment analysis and immune cell-type fractions estimate
To investigate the biological function of the PAH‐related module, functional enrichment was realized through Metascape (http://metascape.org). Metascape is a web-based portal that provides a comprehensive gene list annotation based on 40 independent databases for studying functional enrichment (18). To explore the immune infiltrations of PAH lung tissues, the expression matrix of GSE117261 was imported into CIBERSORTx (19). The fraction of immune cells could be estimated by CIBERSORTx via deconvolving bulk gene expression data using signature genes of different immune cells.
Statistical analysis
All statistical tests were performed using the R software (version 3.6.1; https://www.R-project.org/), and graphs in this study were generated using “ggplot2”, “pheatmap”, and “WGCNA” R packages. Kruskal-Wallis H test and Wilcoxon signed-rank test were used to compare the mean value between groups. Spearman correlation analysis was used to investigate the relationship between hub gene expression and immune cell infarction or mPAP. False discovery rate (FDR) was used for multiple testing correction. A P value <0.05 was considered as statistically significant.
Results
Construction of a weighted coexpression network
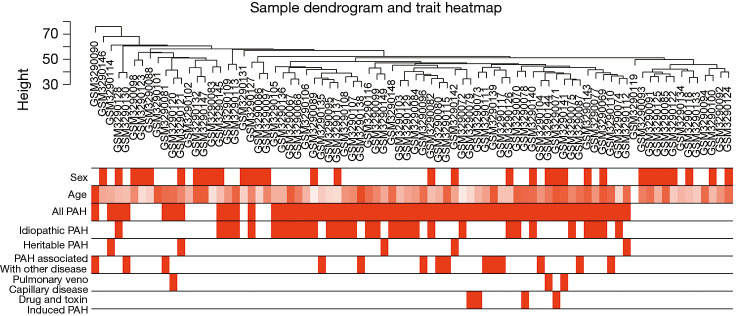
In GSE117261, a total of 7,534 genes were selected for analysis based on the rank of the coefficient of variation. No obvious outlier was found in hierarchical clustering analysis based on average distance (Figure 2). The bar plot described age, sex, PAH status, and PAH subgroups. Specifically, PAH samples were grouped into IPAH (n=31), heritable PAH (n=5), drug- and toxin-induced PAH (n=4), PAH associated with other disease [congenital heart disease (n=8), connective tissue disease (n=6)] and pulmonary veno-capillary disease (n=3).
Figure 2.
Clustering dendrogram of 82 samples to detect outliers. Color intensity is proportional to sample age, gender, PAH and its subgroup. PAH, pulmonary artery hypertension.
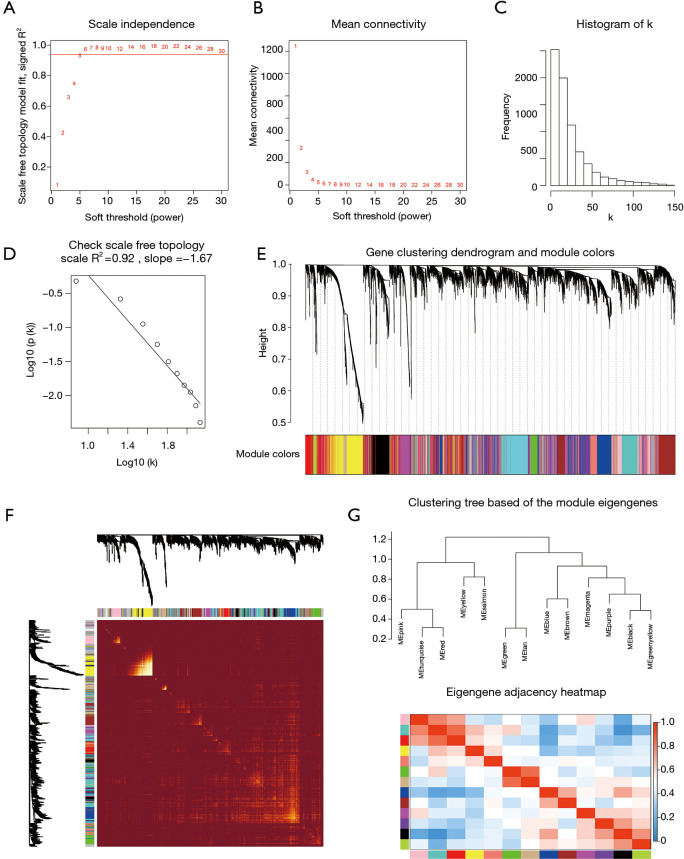
The power value β=5 was considered to be the soft thresholding (Figure 3A,B). The approximate straight-line relationship (R2 =0.92) demonstrated a scale-free topology (Figure 3C,D). A total of 13 modules were identified in gene coexpression networks. Among them, the maximum and the minimum modules comprised 953 genes (turquoise) and 80 genes (salmon), respectively. The grey module contained 1,008 genes not belonging to any other module and was omitted for further study. The gene hierarchical clustering dendrogram together with assigned module colors is shown in Figure 3E. The topological overlap matrix was visualized by a heatmap supplemented by hierarchical clustering dendrograms and modules (Figure 3F). Dendrogram clusters and heatmaps of ME from each module were plotted to reflect the similarity of each module (Figure 3G).
Figure 3.
Determination of soft-thresholding power and construction of co-expression modules. (A) Analysis of the scale‐free fit index for various soft‐thresholding powers (β). (B) Analysis of the mean connectivity for various soft‐thresholding powers. (C) Histogram of connectivity distribution when β =5. (D) Checking the scale‐free topology when β =5. The approximate straight-line relationship (high R2 value) shows approximate scale-free topology. (E) Gene clustering dendrogram was obtained by the hierarchical clustering of TOM-based dissimilarity. The color row below the dendrogram indicates module colors. (F) Heatmap plot of the topological overlap matrix among 1000 randomly selected genes. Rows and columns correspond to single genes. Light colors represent higher topological overlap and progressively darker colors represent lower topological overlap. (G) Hierarchical clustering dendrogram and heat map of module eigengenes. Colors represent the intensity of adjacency. TOM, topological overlap measure.
Detection of modules correlated with clinical traits
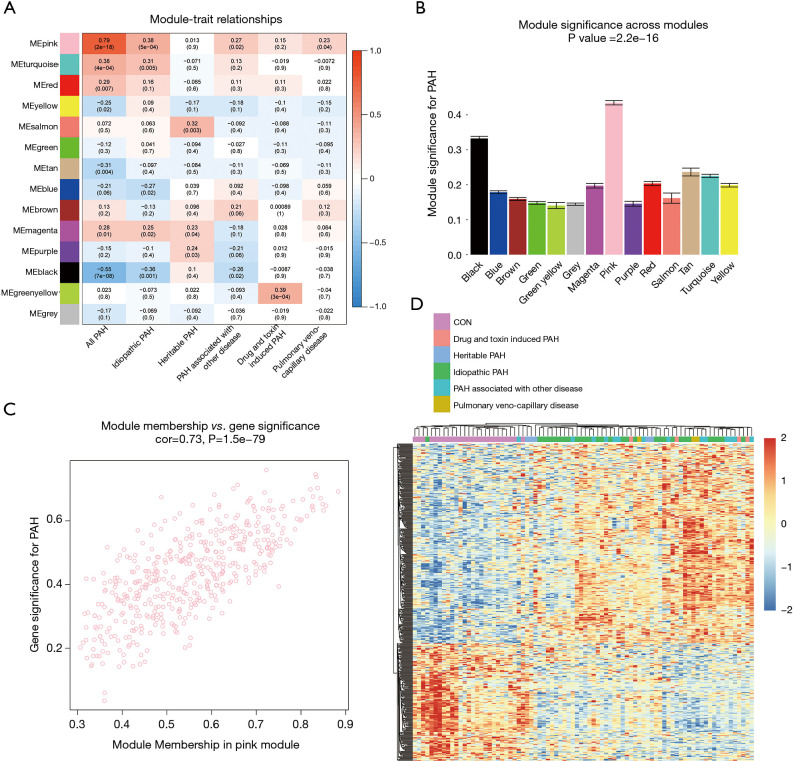
The correlation coefficient between ME and the clinical trait is displayed in Figure 4A. In terms of ME, the pink module, which contained 471 genes, had the strongest correlation with PAH (r=0.79; P=2e−18). The pink module also exhibited the highest MS value (MS =0.43) for PAH compared to other modules represented in Figure 4B. These results indicated that the pink module was related to PAH. Hence, the pink module was selected for further analysis. In the pink module, there was a positive relationship between GS and MM (r=0.73, P=1.5e−79) (Figure 4C). Genes in the pink module were plotted, and samples were mainly divided into 2 clusters, which roughly agreed with the distribution of the PAH group and the control group (Figure 4D).
Figure 4.
Modules related to clinical trait and functional enrichment. (A) Heatmap of the correlation between module eigengenes and clinical traits. Each cell contains the corresponding correlation coefficient and P value. (B) Bar plot of module significance for PAH. Error bars represent the standard error of GS in each module. (C) Scatterplot of GS for PAH vs. MM in the pink module. (D) Heatmap showed 471 genes in the pink module. Annotation bar represents the subgroups of PAH. PAH, pulmonary artery hypertension.
Identification and validation of hub genes in pink module
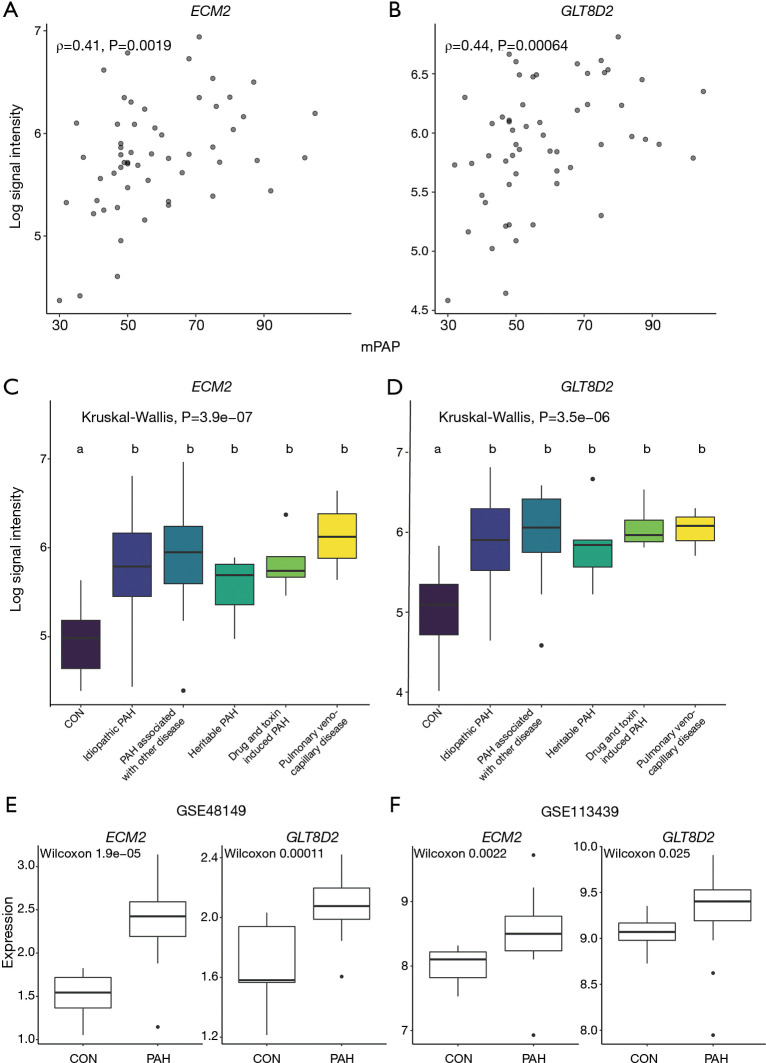
As mentioned above, hub genes are defined as genes with high connectivity within a module and are considered to have essential functions in relevant clinical traits. To reveal hub genes in this study, genes with high GS and MM values were selected first. Then, we assessed the relationship between the value of gene expression and mPAP. The criteria of MM ≥0.8 and GS ≥0.2 revealed 13 candidate genes in the pink module, and their relationship between mPAP was calculated by Spearman correlation (Table 1). Although the P value of correlation between mPAP and the expression value of the FGR (ρ=−0.323, P=0.0152), PYGL (ρ=−0.324, P=0.015), and TALDO1 (ρ=−0.298, P=0.0255) genes were less than 0.05. After multiple testing correction, only the expression values of the ECM2 (ρ=0.407, P=0.0019) and GLT8D2 (ρ=0.443, P=0.0006) gene were significantly related to mPAP (adjusted P<0.05). Thus, ECM2 and GLT8D2 were considered as hub genes.
Table 1. Candidate hub gene in the pink module.
| Gene | GS | MM | Spearman correlation coefficient | P.val | P.adj |
|---|---|---|---|---|---|
| GLT8D2 | 0.632671 | 0.850674 | 0.443 | 0.0006 | 0.01 |
| ECM2 | 0.64762 | 0.855973 | 0.407 | 0.0019 | 0.015 |
| FGR | −0.6473 | −0.82583 | −0.323 | 0.0152 | 0.061 |
| PYGL | −0.65238 | −0.84857 | −0.324 | 0.015 | 0.061 |
| TALDO1 | −0.70311 | −0.83711 | −0.298 | 0.0255 | 0.082 |
| ANTXR1 | 0.667129 | 0.804286 | 0.212 | 0.1169 | 0.312 |
| CSF3R | −0.74587 | −0.83269 | −0.192 | 0.1558 | 0.356 |
| PDE7B | 0.698733 | 0.821378 | 0.18 | 0.1849 | 0.361 |
| S100A9 | −0.69232 | −0.8832 | −0.173 | 0.2029 | 0.361 |
| RNASE2 | −0.73807 | −0.83456 | −0.158 | 0.2437 | 0.39 |
| AQP9 | −0.60439 | −0.80104 | −0.149 | 0.2738 | 0.398 |
| S100A8 | −0.61492 | −0.81337 | −0.135 | 0.3227 | 0.43 |
| MGAM | −0.67065 | −0.84404 | −0.088 | 0.5178 | 0.637 |
| NLRP12 | −0.64292 | −0.82498 | −0.05 | 0.716 | 0.818 |
| GLT1D1 | −0.67621 | −0.82705 | −0.006 | 0.9653 | 0.987 |
| RIPOR2 | −0.63329 | −0.82724 | 0.002 | 0.987 | 0.987 |
Genes in pink module with MM >0.8, GS >0.2. Spearman correlation calculated the correlation coefficient between gene expression and mPAP. FDR was used for multiple testing correction. MM, module membership; GS, gene significance; mPAP, mean pulmonary artery pressure; FDR, false discovery rate.
The scatter plot of hub genes vs. mPAP is shown in Figure 5A,B, which visualizes the relationship between gene expression value and mPAP. The expression levels of hub genes in different PAH subgroups were evaluated (Figure 5C,D). No difference was observed between PAH subgroups. Meanwhile, as the black module was related to PAH (r=−0.55, P=7e−8) with the second-lowest P value, genes in the black module with MM ≥0.8 and GS ≥0.2 were selected for an analysis of their relationship with mPAP (Table S1). The results showed that, although the P values of the correlation between mPAP and the ARRB2, CD68, CTSB, FCER1G, and LAIR1 gene were less than 0.05, there was no significant difference after multiple testing correction (adjusted P>0.05).
Figure 5.
Identification and validation of hub genes. Scatter plot to visualize the relationship between hub genes ECM2 (A), GLT8D2 (B) and the value of mPAP. Expression levels of hub genes ECM2 (C), GLT8D2 (D) between different PAH subtypes. Kruskal-Wallis H test was used to evaluate the statistical difference. The different letter marks significant difference. Validation of hub genes through independent datasets GSE48149 (E) and GSE113439 (F). Wilcoxon signed-rank test was used to evaluate the statistical significance of differences. mPAP, mean pulmonary artery pressure; PAH, pulmonary artery hypertension.
In order to further verify the above hub genes, their expression levels in the PAH group and normal group in datasets GSE113439 and GSE48149 were investigated. Both ECM2 and GLT8D2 had significantly different expression levels between the PAH group and normal group (Figure 5E,F).
Functional enrichment analysis and immune cell fraction estimation
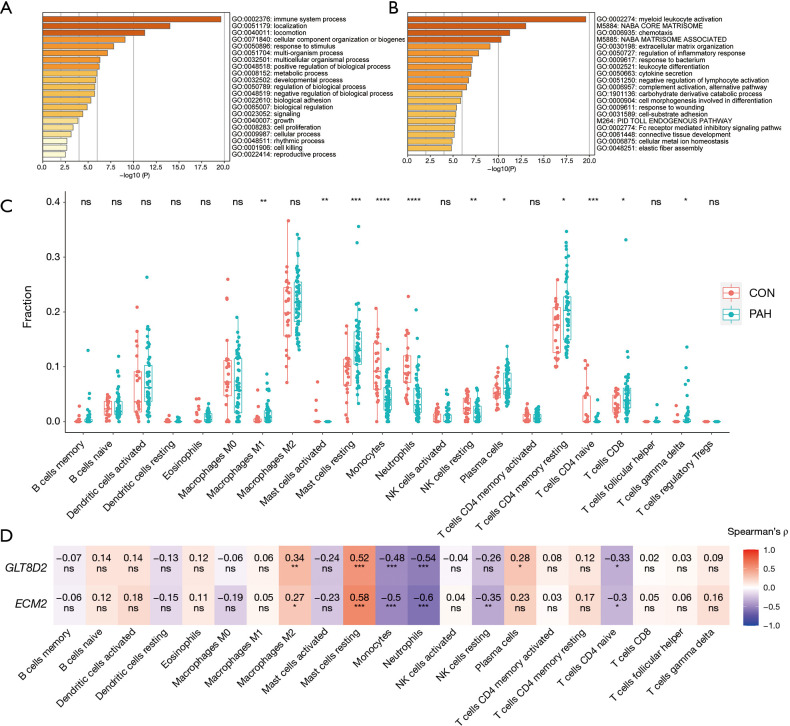
To explore the function of the genes in the pink module, Gene Ontology (GO) processes, Kyoto Encyclopedia of Genes and Genomes (KEGG) pathways, Reactome gene sets, canonical pathways, and Comprehensive Resource of Mammalian protein complexes (CORUM) complexes enrichment analyses were performed by the gene-list analysis web portal Metascape. Functional enrichment analysis revealed that genes in the pink module were mainly distributed in immune system processes (GO: 0002376) and localization (GO: 0051179) in level 2 of the GO biological process, primarily enriched in the processes of myeloid leukocyte activation (GO: 0002274), Naba core matrisome (M5884), chemotaxis (GO: 0006935), Naba matrisome associated (M5885), and extracellular matrix (ECM) organization (GO: 0050727) (Figure 6A,B).
Figure 6.
Functional Enrichment analysis and Immune Cell Fraction Estimation. (A,B) Functional enrichment analysis of genes in the pink module realized by Metascape. (C) Boxplot for comparison of the 22 immune cell infraction difference between PAH and control samples in GSE117261. (D) Heatmap to represent the relationship between hub genes and immune cell infraction calculated by spearman’s correlation. *, P<0.05; **, P<0.01; ***, P<0.001; ****, P<0.0001. PAH, pulmonary artery hypertension.
As functional enrichment analysis showed that the pink module genes were mainly distributed in the immune system, we further estimated the infiltration of 22 immune cells in the PAH lung tissue through the CIBERSORTx algorithm (Figure 6C). We found that the infiltration of M1 macrophages, resting mast cells, plasma cells, resting CD4 memory T cells, CD8 T cells, and γδ T cells in PAH lung tissues was higher than that of the control group. In contrast, the infiltration of activated mast cells, monocytes, neutrophils, resting natural killer (NK) cells, and CD4-naïve T cells were downregulated in PAH lung tissues.
Finally, Spearman correlation analysis was used to calculate the correlation coefficient between the infiltration of different immune cells and hub genes. The results revealed that alternatively activated macrophages (M2) and resting mast cells positively correlated with the hub genes, while monocytes, neutrophils, and CD4-naïve T cells negatively correlated with the hub genes. Furthermore, resting NK cells negatively correlated with ECM2, while plasma cells were positively related to GLT8D2 (Figure 6D).
Discussion
PAH is a severe cardiopulmonary disorder characterized by elevated pulmonary artery pressure and pulmonary vascular resistance, which ultimately results in progressive right heart failure and death (3). Current vasodilator therapies ameliorate symptoms but do not decrease mortality. Therefore, exploring molecular mechanisms of PAH could help overcome such difficulties (4). In this study, the data set GSE117261 containing 58 PAH and 25 normal lung tissues was obtained from the GEO, and WGCNA was applied to the data. A total of 7534 genes were selected for the weighted coexpression network. Among 13 coexpression modules, the pink module was highly correlated with PAH in terms of ME and MS. Functional enrichment revealed that genes in the pink module mainly distributed in the immune system process and localization. After examining GS and MM, along with the correlation between expression value and mPAP, we discovered 2 hub genes, ECM2 and GLT8D2, which were also validated in the GSE48149 and GSE113439 data sets. These findings may help locate novel therapeutic targets of the temporarily incurable PAH.
Hub candidate ECM protein 2 (ECM2) is a member of the secreted protein acidic and rich in cysteine (SPARC) family protein, encoded by the ECM2 gene located in chromosome 5 (20). Proteins in this family are secreted in extracellular space, regulate the assembly and deposition of the ECM, counter adhesion, influence the activity of extracellular proteases, and modulate growth factor/cytokine signaling pathways (21). Previous studies have shown that ECM2 is widely expressed in various tissues, such as brain, heart, adrenal gland, epididymis, muscle, and lung, and extensively participates in their biological processes (22). First detected in early embryonic development, ECM2 has displayed the ability to promote differentiation of skeletal muscle-derived satellite cells and enhance the proliferation of mature B cells (20,23,24). The expression status of ECM2 has been altered in many diseases, such as human non-small cell lung carcinoma and gastrointestinal tract cancers, while the role of ECM2 in PAH is still underexploited (25,26). In this study, expression of ECM2 was elevated in PAH and positively correlated with mPAP (ρ=0.407, P=0.0019), and was considered a hub gene in the pink module (GS =0.65, MM =0.86). The functions of ECM2 is related to muscle differentiation and immune cell proliferation, which are also involved in the pathogenesis of PAH. Thus, we hypothesized that ECM2 contributes to PAH development and could serve as a novel therapeutic target.
Another hub candidate, glycosyltransferase 8 domain-containing protein 2 (GLT8D2), a member of the glycosyltransferase 8 family, is a 349 amino acid single-pass type II membrane protein encoded by the GLT8D2 gene, which is located on human chromosome 12q23.3. The first 6 amino acid residues of GLT8D2 extend to the cytoplasm, and residues 7–24 are within the transmembrane domain while residues 25–349 are located in cytoplasm (27,28). Glycosyltransferases play pivotal roles in many fundamental biological processes. They transfer sugars to various important biomolecules, such as glycans, lipids, peptides, and small molecules, while mediating glycosylation, the most complex and ubiquitous posttranslational modification process found on a variety of secretory and membrane-bound proteins (29). Therefore, changes in the expression or activity of glycosyltransferases could extensively affect cell-cell interactions, protein interactions, downstream signal transduction, and further modulate biological processes, including inflammatory responses, viral immune escape, cancer cell metastasis, and apoptosis (30-32). Furthermore, by influencing the interactions between endothelial cells and leukocytes, the glycosylation of adhesion molecules modulates leukocyte trafficking and recruitment and might contribute to inflammatory vascular disease (33,34). Previous studies have shown that GLT8D2 is a glycosyltransferase of apoB100, can regulate the expression level of apoB100, and can positively regulate the accumulation of lipid droplet and triglyceride content in the hepatoma cell line, suggesting that GLT8D2 might participate in the pathogenesis of non-alcoholic fatty liver disease (27,28). As for IPAH, previous studies have shown that N-acetylglucosamine (O-GlcNAc) transferase (OGT) can regulate vascular endothelial growth factor (VEGF) expression and vascularization, which is the hallmark of PAH, implying that glycosylation has a pivotal role in PAH (35). In our study, expression of GLT8D2 was upregulated in PAH, positively related to mPAP (ρ=0.443, P=0.0006), and was considered a hub gene in the pink module (GS =0.63, MM =0.85). Although the role of GLT8D2 in PAH has never been investigated, through WGCNA analysis, this study may help reveal the hidden role of GLT8D2 in the pathogenesis of PAH.
Taken together, the molecular functions of hub genes ECM2 and GLT8D2 are involved in the immune system and ECM, which is consistent with the function of the pink module and the pathogenesis of PAH. Inflammation and immune disorders are common in all forms of PAH (3). It is now widely believed that inflammation contributes to disease susceptibility and the progression of vascular remodeling in PAH (36,37). Previous studies have shown that in PAH lungs, the main leukocyte (CD45 cell) change is a decrease in the number of myeloid cells, accompanied by an increase in the number of lymphoid cells, including CD4, CD8, and γδ T cell subsets (38). In addition, the numbers of macrophages, mast cells, and dendritic cells has also been shown to increase in PAH lungs, while the phenotype of NK cells was found to be impaired in PAH (39,40). These findings are similar to the results we obtained from CIBERSORTx. Remodeling of ECM is the hallmark of PAH and occurs before increase in the intimal and medial thickness and pulmonary artery pressure. Emerging evidence suggests that ECM remodeling is the crucial event that increases the stiffness of the proximal and distal pulmonary arteries, triggering the proliferation of smooth muscle cells and endothelial cells (41). In addition to flow and shear stress, inflammation has also been shown to cause ECM remodeling (42). As these biological processes were also enriched in the pink module, our results confirmed the relationship between the immune system and the ECM during PAH pathogenesis. Considering the high connectivity of the hub genes in the module, we speculate that hub genes ECM2 and GLT8D2 may affect PAH through the immune system and ECM remodeling.
Through the construction of weighted coexpression networks and the measuring of correlation patterns among each gene, WGCNA is being increasingly used to explore the functionality of genes at a systemic level (43). In the field of PAH, the WGCNA algorithm has been used to explore the hub genes in systemic sclerosis associated with PAH or IPAH based on samples of peripheral blood mononuclear cells (PBMCs) (44-46). A PBMC is any blood cell with a round nucleus, such as a lymphocyte, monocyte, or macrophage, that produces a selective response of the immune system and PBMCs are the principal cells in immunity (47). Although the previous study yielded some promising biomarkers, we are still skeptical about whether changes in PBMCs at the transcriptomic level can genuinely signal the development of PAH in the lungs. Moreover, some studies have already examined the data sets in this study; however, compared to their conclusion based on differential expression analysis, WGCNA focuses on the interaction between genes in the systemic level and minimizes the loss of information by using soft thresholding (11-13).
Overall, this study used a bioinformatic approach at the systemic level to identify hub genes that are potentially involved in the pathogenesis of PAH. The hub genes were also validated in other independent data sets. However, this study still has some limitations. Although hub genes were generated from different datasets, further verification in a larger PAH patient cohort is still warranted. Besides, current evidence can only demonstrate the relationship between hub genes and PAH. More in vivo and in vitro studies are needed to clarify the exact form of such relationship. Still, considering hub genes functions and the pivotal role of ECM and inflammation in the pathogenesis of PAH, we believe that ECM2 and GLT8D2 could serve as a promising therapeutic target for PAH.
Conclusions
This study was the first to perform WGCNA analysis in PAH lung tissue and found that ECM2 and GLT8D2 may help advance treatment strategies and provide a new perspective for understanding the pathogenesis of PAH.
Supplementary
The article’s supplementary files as
Acknowledgments
The authors would like to thank the GEO database for providing open access.
Funding: This work was supported by National Natural Science Funds of China (No. 81770366).
Ethical Statement: The authors are accountable for all aspects of the work in ensuring that questions related to the accuracy or integrity of any part of the work are appropriately investigated and resolved. The study was conducted in accordance with the Declaration of Helsinki (as revised in 2013).
Footnotes
Reporting Checklist: The authors have completed the MDAR checklist. Available at http://dx.doi.org/10.21037/jtd-20-3069
Conflicts of Interest: All authors have completed the ICMJE uniform disclosure form (available at http://dx.doi.org/10.21037/jtd-20-3069). The authors have no conflicts of interest to declare.
References
- 1.Lau EMT, Giannoulatou E, Celermajer DS, et al. Epidemiology and treatment of pulmonary arterial hypertension. Nat Rev Cardiol 2017;14:603-14. 10.1038/nrcardio.2017.84 [DOI] [PubMed] [Google Scholar]
- 2.Simonneau G, Montani D, Celermajer DS, et al. Haemodynamic definitions and updated clinical classification of pulmonary hypertension. Eur Respir J 2019;53:1801913. 10.1183/13993003.01913-2018 [DOI] [PMC free article] [PubMed] [Google Scholar]
- 3.Humbert M, Guignabert C, Bonnet S, et al. Pathology and pathobiology of pulmonary hypertension: state of the art and research perspectives. Eur Respir J 2019;53:1801887. 10.1183/13993003.01887-2018 [DOI] [PMC free article] [PubMed] [Google Scholar]
- 4.Thenappan T, Ormiston ML, Ryan JJ, et al. Pulmonary arterial hypertension: pathogenesis and clinical management. BMJ 2018;360:j5492. 10.1136/bmj.j5492 [DOI] [PMC free article] [PubMed] [Google Scholar]
- 5.Southgate L, Machado RD, Graf S, et al. Molecular genetic framework underlying pulmonary arterial hypertension. Nat Rev Cardiol 2020;17:85-95. 10.1038/s41569-019-0242-x [DOI] [PubMed] [Google Scholar]
- 6.Mutgan AC, Jandl K, Kwapiszewska G. Endothelial Basement Membrane Components and Their Products, Matrikines: Active Drivers of Pulmonary Hypertension? Cells 2020;9:2029. 10.3390/cells9092029 [DOI] [PMC free article] [PubMed] [Google Scholar]
- 7.Zhang R, Dai LZ, Xie WP, et al. Survival of Chinese patients with pulmonary arterial hypertension in the modern treatment era. Chest 2011;140:301-9. 10.1378/chest.10-2327 [DOI] [PubMed] [Google Scholar]
- 8.Benza RL, Miller DP, Barst RJ, et al. An evaluation of long-term survival from time of diagnosis in pulmonary arterial hypertension from the REVEAL Registry. Chest 2012;142:448-56. 10.1378/chest.11-1460 [DOI] [PubMed] [Google Scholar]
- 9.van 't Veer LJ, Dai H, van de Vijver MJ, et al. Gene expression profiling predicts clinical outcome of breast cancer. Nature 2002;415:530-6. 10.1038/415530a [DOI] [PubMed] [Google Scholar]
- 10.Buyse M, Loi S, van't Veer L, et al. Validation and clinical utility of a 70-gene prognostic signature for women with node-negative breast cancer. J Natl Cancer Inst 2006;98:1183-92. 10.1093/jnci/djj329 [DOI] [PubMed] [Google Scholar]
- 11.Stearman RS, Bui QM, Speyer G, et al. Systems Analysis of the Human Pulmonary Arterial Hypertension Lung Transcriptome. Am J Respir Cell Mol Biol 2019;60:637-49. 10.1165/rcmb.2018-0368OC [DOI] [PMC free article] [PubMed] [Google Scholar]
- 12.Luo J, Li H, Liu Z, et al. Integrative analyses of gene expression profile reveal potential crucial roles of mitotic cell cycle and microtubule cytoskeleton in pulmonary artery hypertension. BMC Med Genomics 2020;13:86. 10.1186/s12920-020-00740-x [DOI] [PMC free article] [PubMed] [Google Scholar]
- 13.Zhang B, Horvath S. A general framework for weighted gene co-expression network analysis. Stat Appl Genet Mol Biol 2005;4:Article17. [DOI] [PubMed]
- 14.Yip AM, Horvath S. Gene network interconnectedness and the generalized topological overlap measure. BMC Bioinformatics 2007;8:22. 10.1186/1471-2105-8-22 [DOI] [PMC free article] [PubMed] [Google Scholar]
- 15.Langfelder P, Horvath S. WGCNA: an R package for weighted correlation network analysis. BMC Bioinformatics 2008;9:559. 10.1186/1471-2105-9-559 [DOI] [PMC free article] [PubMed] [Google Scholar]
- 16.Mura M, Cecchini MJ, Joseph M, et al. Osteopontin lung gene expression is a marker of disease severity in pulmonary arterial hypertension. Respirology 2019;24:1104-10. 10.1111/resp.13557 [DOI] [PubMed] [Google Scholar]
- 17.Hsu E, Shi H, Jordan RM, Lyons-Weiler J, et al. Lung tissues in patients with systemic sclerosis have gene expression patterns unique to pulmonary fibrosis and pulmonary hypertension. Arthritis Rheum 2011;63:783-94. 10.1002/art.30159 [DOI] [PMC free article] [PubMed] [Google Scholar]
- 18.Zhou Y, Zhou B, Pache L, et al. Metascape provides a biologist-oriented resource for the analysis of systems-level datasets. Nat Commun 2019;10:1523. 10.1038/s41467-019-09234-6 [DOI] [PMC free article] [PubMed] [Google Scholar]
- 19.Newman AM, Steen CB, Liu CL, et al. Determining cell type abundance and expression from bulk tissues with digital cytometry. Nat Biotechnol 2019;37:773-82. 10.1038/s41587-019-0114-2 [DOI] [PMC free article] [PubMed] [Google Scholar]
- 20.Oritani K, Kanakura Y, Aoyama K, et al. Matrix glycoprotein SC1/ECM2 augments B lymphopoiesis. Blood 1997;90:3404-13. 10.1182/blood.V90.9.3404 [DOI] [PubMed] [Google Scholar]
- 21.Bradshaw AD. Diverse biological functions of the SPARC family of proteins. Int J Biochem Cell Biol 2012;44:480-8. 10.1016/j.biocel.2011.12.021 [DOI] [PMC free article] [PubMed] [Google Scholar]
- 22.Soderling JA, Reed MJ, Corsa A, et al. Cloning and expression of murine SC1, a gene product homologous to SPARC. J Histochem Cytochem 1997;45:823-35. 10.1177/002215549704500607 [DOI] [PubMed] [Google Scholar]
- 23.Ringuette M, Rogers I, Varmuza S, et al. Expression of SC1 is associated with the migration of myotomes along the dermomyotome during somitogenesis in early mouse embryos. Dev Genes Evol 1998;208:403-6. 10.1007/s004270050196 [DOI] [PubMed] [Google Scholar]
- 24.Liu C, Tong H, Li S, et al. Effect of ECM2 expression on bovine skeletal muscle-derived satellite cell differentiation. Cell Biol Int 2018;42:525-32. 10.1002/cbin.10927 [DOI] [PubMed] [Google Scholar]
- 25.Isler SG, Schenk S, Bendik I, et al. Genomic organization and chromosomal mapping of SPARC-like 1, a gene down regulated in cancers. Int J Oncol 2001;18:521-6. 10.3892/ijo.18.3.521 [DOI] [PubMed] [Google Scholar]
- 26.Li P, Qian J, Yu G, et al. Down-regulated SPARCL1 is associated with clinical significance in human gastric cancer. J Surg Oncol 2012;105:31-7. 10.1002/jso.22025 [DOI] [PubMed] [Google Scholar]
- 27.Wei HS, Wei HL, Zhao F, et al. Glycosyltransferase GLT8D2 positively regulates ApoB100 protein expression in hepatocytes. Int J Mol Sci 2013;14:21435-46. 10.3390/ijms141121435 [DOI] [PMC free article] [PubMed] [Google Scholar]
- 28.Zhan Y, Zhao F, Xie P, et al. Mechanism of the effect of glycosyltransferase GLT8D2 on fatty liver. Lipids Health Dis 2015;14:43. 10.1186/s12944-015-0040-3 [DOI] [PMC free article] [PubMed] [Google Scholar]
- 29.Chang A, Singh S, Phillips GN, Jr, et al. Glycosyltransferase structural biology and its role in the design of catalysts for glycosylation. Curr Opin Biotechnol 2011;22:800-8. 10.1016/j.copbio.2011.04.013 [DOI] [PMC free article] [PubMed] [Google Scholar]
- 30.Gupta R, Leon F, Rauth S, et al. A Systematic Review on the Implications of O-linked Glycan Branching and Truncating Enzymes on Cancer Progression and Metastasis. Cells 2020;9:446. 10.3390/cells9020446 [DOI] [PMC free article] [PubMed] [Google Scholar]
- 31.Corfield A. Eukaryotic protein glycosylation: a primer for histochemists and cell biologists. Histochem Cell Biol 2017;147:119-47. 10.1007/s00418-016-1526-4 [DOI] [PMC free article] [PubMed] [Google Scholar]
- 32.Reily C, Stewart TJ, Renfrow MB, et al. Glycosylation in health and disease. Nat Rev Nephrol 2019;15:346-66. 10.1038/s41581-019-0129-4 [DOI] [PMC free article] [PubMed] [Google Scholar]
- 33.Chacko BK, Scott DW, Chandler RT, et al. Endothelial surface N-glycans mediate monocyte adhesion and are targets for anti-inflammatory effects of peroxisome proliferator-activated receptor gamma ligands. J Biol Chem 2011;286:38738-47. 10.1074/jbc.M111.247981 [DOI] [PMC free article] [PubMed] [Google Scholar]
- 34.Scott DW, Vallejo MO, Patel RP. Heterogenic endothelial responses to inflammation: role for differential N-glycosylation and vascular bed of origin. J Am Heart Assoc 2013;2:e000263. 10.1161/JAHA.113.000263 [DOI] [PMC free article] [PubMed] [Google Scholar]
- 35.Barnes JW, Tian L, Krick S, et al. O-GlcNAc Transferase Regulates Angiogenesis in Idiopathic Pulmonary Arterial Hypertension. Int J Mol Sci 2019;20:6299. 10.3390/ijms20246299 [DOI] [PMC free article] [PubMed] [Google Scholar]
- 36.Huertas A, Perros F, Tu L, et al. Immune dysregulation and endothelial dysfunction in pulmonary arterial hypertension: a complex interplay. Circulation 2014;129:1332-40. 10.1161/CIRCULATIONAHA.113.004555 [DOI] [PubMed] [Google Scholar]
- 37.Huertas A, Tu L, Humbert M, et al. Chronic inflammation within the vascular wall in pulmonary arterial hypertension: more than a spectator. Cardiovasc Res 2020;116:885-93. 10.1093/cvr/cvz308 [DOI] [PubMed] [Google Scholar]
- 38.Marsh LM, Jandl K, Grünig G, et al. The inflammatory cell landscape in the lungs of patients with idiopathic pulmonary arterial hypertension. Eur Respir J 2018;51:1701214. 10.1183/13993003.01214-2017 [DOI] [PMC free article] [PubMed] [Google Scholar]
- 39.Ormiston ML, Chang C, Long LL, et al. Impaired natural killer cell phenotype and function in idiopathic and heritable pulmonary arterial hypertension. Circulation 2012;126:1099-109. 10.1161/CIRCULATIONAHA.112.110619 [DOI] [PubMed] [Google Scholar]
- 40.Savai R, Pullamsetti SS, Kolbe J, et al. Immune and inflammatory cell involvement in the pathology of idiopathic pulmonary arterial hypertension. Am J Respir Crit Care Med 2012;186:897-908. 10.1164/rccm.201202-0335OC [DOI] [PubMed] [Google Scholar]
- 41.Thenappan T, Chan SY, Weir EK. Role of extracellular matrix in the pathogenesis of pulmonary arterial hypertension. Am J Physiol Heart Circ Physiol 2018;315:H1322-31. 10.1152/ajpheart.00136.2018 [DOI] [PMC free article] [PubMed] [Google Scholar]
- 42.Jain S, Khera R, Corrales-Medina VF, et al. "Inflammation and arterial stiffness in humans". Atherosclerosis 2014;237:381-90. 10.1016/j.atherosclerosis.2014.09.011 [DOI] [PubMed] [Google Scholar]
- 43.Mantini G, Vallés AM, Le Large TYS, et al. Co-expression analysis of pancreatic cancer proteome reveals biology and prognostic biomarkers. Cell Oncol (Dordr) 2020;43:1147-59. 10.1007/s13402-020-00548-y [DOI] [PMC free article] [PubMed] [Google Scholar]
- 44.Tang Y, Zha L, Zeng X, et al. Identification of Biomarkers Related to Systemic Sclerosis With or Without Pulmonary Hypertension Using Co-expression Analysis. J Comput Biol 2020;27:1519-31. 10.1089/cmb.2019.0492 [DOI] [PubMed] [Google Scholar]
- 45.Zheng JN, Li Y, Yan YM, et al. Identification and Validation of Key Genes Associated With Systemic Sclerosis-Related Pulmonary Hypertension. Front Genet 2020;11:816. 10.3389/fgene.2020.00816 [DOI] [PMC free article] [PubMed] [Google Scholar]
- 46.Wang T, Zheng X, Li R, et al. Integrated bioinformatic analysis reveals YWHAB as a novel diagnostic biomarker for idiopathic pulmonary arterial hypertension. J Cell Physiol 2019;234:6449-62. 10.1002/jcp.27381 [DOI] [PubMed] [Google Scholar]
- 47.Pourahmad J, Salimi A. Isolated Human Peripheral Blood Mononuclear Cell (PBMC), a Cost Effective Tool for Predicting Immunosuppressive Effects of Drugs and Xenobiotics. Iran J Pharm Res 2015;14:979. [PMC free article] [PubMed] [Google Scholar]
Associated Data
This section collects any data citations, data availability statements, or supplementary materials included in this article.
Supplementary Materials
The article’s supplementary files as


