

Abstract
In daily practice, different types of biomolecules are usually extracted for large-scale “omics” analysis with tailored protocols. However, when sample material is limited, an all-in-one strategy is preferable. Although lysis of cells and tissues with urea is widely used for phosphoproteomic applications, DNA, RNA, and proteins can be simultaneously extracted from small samples using acid guanidinium thiocyanate–phenol–chloroform (AGPC). Use of AGPC for mass spectrometry–based phosphoproteomics was reported but has not yet been thoroughly evaluated against a classical phosphoproteomic protocol. Here we compared urea- with AGPC-based protein extraction, profiling phosphorylations in the DNA damage response pathway after ionizing irradiation of U2OS cells as proof of principle. On average we identified circa 9000 phosphosites per sample with both extraction methods. Moreover, we observed high similarity of phosphosite characteristics (e.g., 94% shared class 1 identifications) and deduced kinase activities (e.g., ATM, ATR, CHEK1/2, PRKDC). We furthermore extended our comparison to murine and human tissue samples yielding similar and highly correlated results for both extraction protocols. AGPC-based sample extraction can thus replace common cell lysates for phosphoproteomic workflows and may thus be an attractive way to obtain input material for multiple omics workflows, yielding several data types from a single sample.
Abbreviations: AGPC, acid guanidinium thiocyanate–phenol–chloroform; HCC, hepatocellular carcinoma; INKA, integrative inferred kinase activity; IR, irradiated; MBR, match between runs; NT, untreated; PS, phosphosite(s); PTM-SEA, posttranslational modification signature enrichment analysis; pTyr, phosphotyrosine; RNAB, RNA-Bee; U2OS, U2 osteosarcoma
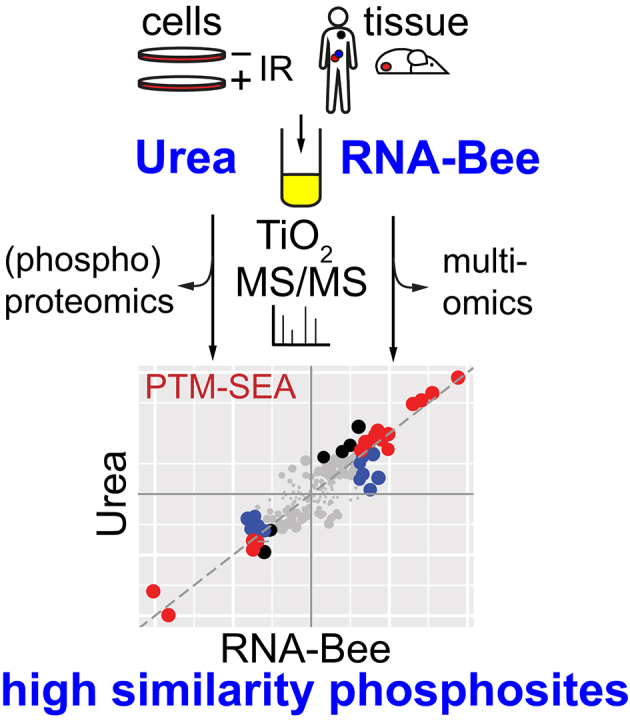
Graphical Abstract
Highlights
-
•
Comparison of phosphosite data from AGPC with commonly used urea lysis protocol.
-
•
AGPC yields high-quality phosphosite data from cells and (tumor) tissue samples.
-
•
AGPC permits combined genomic, transcriptomic, and proteomic analysis of same sample.
-
•
AGPC permits multiomics analysis of small samples such as clinical tumor specimens.
In Brief
We performed phosphoproteomics after acid guanidinium thiocyanate–phenol–chloroform (AGPC) isolation for cells and tissue and compared it with a classical urea lysis protocol. For both, we show high similarity of data in steady state and after DNA damage induction through irradiation of U2OS cells. Since AGPC extraction can also yield DNA and RNA for molecular characterization, our results could be of potential use in situations when sample material is limited such as in clinical biopsy workflows.
Mass spectrometry (MS)-based phosphoproteomics is a powerful tool to study cell signaling in a global fashion and with high resolution, either at steady state or following perturbation or development of disease (1). Moreover, the study of phosphorylation sites allows the identification of upstream effectors, i.e., kinases, and thus predictions on their activity (2, 3).
A commonly used and accepted method to isolate proteins from biospecimens for phosphoproteomic profiling is the application of chaotropic agents such as urea (4, 5, 6, 7). In daily practice, other biomolecules such as nucleic acids are usually extracted using distinct protocols. However, in situations where available sample material is limited it is desirable to extract as much of the various types of biomolecules as possible using one protocol. This can be achieved through acid guanidinium thiocyanate-phenol–chloroform (AGPC) extraction using commercially available reagents like TRIzol, TriFast, TRI Reagent, or RNA-Bee (RNAB) (8, 9, 10). It has been shown that proteins isolated in such a way are compatible with quantitative mass spectrometry for protein expression profiling (11, 12, 13, 14). Although AGPC-based protein extraction has been used for the analysis of the phosphoproteome (15, 16, 17), a direct comparison of this isolation method with the widely used urea approach for the study of cell signaling using phosphoproteomics is currently lacking.
In this work, we compared the phosphoproteome of protein extracts obtained with a urea protocol or an AGPC reagent (RNA-Bee). In a functional context, we also compared coverage of the well-studied phosphorylation response after DNA damage (18), performing differential analysis of phosphorylation site data from untreated versus irradiated U2 osteosarcoma (U2OS) cells. We furthermore extended our comparison to murine and human tissue samples. Using high-resolution tandem mass spectrometry and recent bioinformatic tools such as inferred kinase activity (INKA) analysis and phosphosite (PS) signature enrichment analysis (PTM-SEA) (3, 19), we show that phosphorylation data for both extraction methods are highly similar.
Experimental procedures
U2OS Cell Culture, Murine and Human Tissue Samples, Irradiation, and Protein Isolation
U2OS cells (KCLB Cat# 30096, RRID:CVCL_0042) were cultured in 15-cm dishes in Dulbecco's modified Eagle's medium supplemented with GlutaMAX (Gibco). The medium was supplemented with 10% fetal bovine serum (Serana) and 50 units/ml penicillin-streptomycin (Gibco), and cells were grown at 37 °C under common laboratory oxygen conditions (humidified atmospheric air with CO2 added to 5%) to 80% to 90% confluency before treatment.
Murine liver was collected from a healthy 17-week-old FVB/n mouse. The tissue collection was approved by the Animal Ethics Committee of the Netherlands Cancer Institute and performed in accordance with institutional, national, and European guidelines for animal care and use.
In accordance with the Declaration of Helsinki, human residual tumor and normal tissue resection specimens (liver, hepatocellular carcinoma [HCC], melanoma) were obtained from the department of pathology at the Amsterdam UMC. Since residual tissue was used for the purpose of scientific research and collected within the context of routine clinical practice procedures, the Dutch Medical Research Involving Human Subjects Act does not apply. Patients treated at Amsterdam UMC have the possibility to opt out for the use of their data and tissue for research purposes.
Ionizing irradiation of U2OS cells was performed using a Gammacell 40 Extractor low-dose rate research irradiator (Best Theratronics Ltd) set to a dose of 10 Gy, and cells were allowed to recover for 1 h before harvesting.
For phosphoprotein extraction with RNAB, six cell culture dishes (three untreated, three irradiated) were washed with PBS, lysed with 2 ml RNAB (Tel-Test), frozen on dry ice, and stored at −80 °C until further use. Subsequently, a 1-ml aliquot was thawed at room temperature and 150 μl chloroform was added; the tube was shaken vigorously by hand and incubated for 5 min at room temperature. Afterward, the sample was centrifuged (12,000g, 15 min, 4 °C). After removal of the aqueous phase containing RNA and addition of 300 μl 100% ethanol, the sample was incubated for 3 min at room temperature and centrifuged (2000g, 5 min, 4 °C) to pellet the DNA. The resulting supernatant was precipitated with 3 ml ice-cold acetone, incubated for 5 min at room temperature, and centrifuged (2800g, 5 min, 4 °C) to collect precipitated proteins. The protein pellet was washed twice with 500 μl 95% ethanol and subsequently dissolved in 800 μl urea lysis buffer (9 M urea, 20 mM Hepes pH 8.0, 1 mM sodium orthovanadate, 2.5 mM sodium pyrophosphate, 1 mM beta-glycerophosphate) by pipetting. Afterward, samples were intensely vortexed at room temperature using an Eppendorf thermomixer for about 1 to 2 h. Finally, samples were sonicated three cycles (20 s on, 20 s off at maximum amplitude) using a Branson high-intensity Cup Horn sonicator and cleared by centrifugation (16,000g, 10 min, room temperature).
For phosphoprotein extraction with the urea protocol, another six cell culture dishes (three untreated, three irradiated) were washed with PBS and lysed using 2 ml urea lysis buffer followed by three cycles of sonication (20 s on, 20 s off at maximum amplitude). Samples were then cleared by centrifugation (16,000g, 10 min, room temperature). Protein concentration was determined with a Pierce BCA Protein Assay Kit (Thermo Scientific), and all samples were stored at −80 °C until further use.
Phosphoprotein from tissue material was extracted as described for the U2OS cells. Frozen tissue was serially sectioned with alternating 20- to 50-μm slices for urea and RNAB protocols described above, and >20 sections were collected in three to four different 2-ml tubes each. For extraction, 1 ml RNAB and 2 ml urea lysis buffer were added.
Protein Digestion and Phosphopeptide Enrichment
Experimental steps were performed as described (3, 20). Briefly, an equivalent of 500 μg total protein was used and diluted with urea lysis buffer to a final concentration of 1 μg/μl in a 500-μl total volume. Dithiothreitol was added to a final concentration of 4 mM, and samples were incubated for 30 min at 55 °C in a water bath. After cooling down to room temperature, iodoacetamide was added to a final concentration of 10 mM and samples were incubated for 15 min in the dark. The samples were then diluted to 2 M urea final concentration via the addition of 20 mM Hepes pH 8.0 and digested overnight with 5 μg/ml sequence-modified trypsin (Promega) at room temperature.
The digests were then acidified with trifluoroacetic acid (TFA) to a final concentration of 0.1% and desalted using Oasis HLB columns (10 mg capacity, Waters). Columns were activated with acetonitrile (ACN) and equilibrated in 0.1% TFA. Bound peptides were washed twice with 0.1% TFA and eluted in 0.1% TFA, 80% ACN solution.
Phosphopeptide enrichment of desalted peptides was performed hereafter as described (20) using TiO2 beads. For this, desalted peptides were diluted 1:1 with lactic acid solution (0.3 g/ml lactic acid, 0.07% TFA, 53% ACN). For phosphopeptide capture, 2.5 mg of TiO2 beads (GL sciences, 10 μm) were packed in Stage-tips fitted with a 16G-needle punch of C8 material (3M Empore) at the narrow end. Tips containing the TiO2 bed were first washed with 200 μl of 0.1% TFA/80% ACN and equilibrated with 200 μl of 300 mM lactic acid solution. Desalted peptide loading of tips was performed in five cycles using 200 μl portions of the peptide mixture in each cycle. The TiO2 bed with bound phosphopeptides was washed first with 200 μl lactic acid solution and second with 200 μl 0.1% TFA/80% ACN. All steps were performed via centrifugation at 1500g for 4 min. Afterward, phosphopeptides were eluted in two steps with 50 μl 0.5% piperidine (Thermo Fisher Scientific) and 50 μl 5% piperidine and subsequently quenched in 100 μl 20% H3PO4. This was followed by desalting of phosphopeptides using 200-μl Stage tips fitted with a 16G-needle punch of SDB-XC material (3M Empore) at the narrow end, which was washed with 20 μl 0.1% TFA/80% ACN and equilibrated with 20 μl 0.1% TFA. Phosphopeptides were loaded and centrifuged for 3 min at 1000g. SDB-XC beds were then washed with 20 μl of 0.1% TFA, and desalted phosphopeptides were eluted with 20 μl of 0.1% TFA/80% ACN. Phosphopeptides were finally dried in a vacuum centrifuge and dissolved in 20 μl 0.5% TFA/4% ACN prior to LC-MS/MS.
LC-MS/MS
Peptides were separated using an Ultimate 3000 nanoLC-MS/MS system (Thermo Fisher Scientific) equipped with a 50 cm × 75 μm ID Acclaim Pepmap (C18, 1.9 μm) column. After injection, peptides were trapped at 3 μl/min on a 10 mm × 75 μm ID Acclaim Pepmap trap at 2% buffer B (buffer A, 0.1% formic acid [Fisher Scientific]; buffer B, 80% ACN, 0.1% formic acid) and separated at 300 nl/min in a 10% to 40% buffer B gradient in 90 min (125 min inject-to-inject) at 35 °C. Eluting peptides were ionized at a potential of +2 kVa into a Q Exactive HF mass spectrometer (Thermo Fisher Scientific). Intact masses were measured from m/z 350 to 1400 at resolution 120.000 (at m/z 200) in the Orbitrap using an AGC target value of 3E6 charges and a maxIT of 100 ms. The top 15 for peptide signals (charge states 2+ and higher) were submitted to MS/MS in the HCD (higher-energy collision) cell (1.4 amu isolation width, 26% normalized collision energy). MS/MS spectra were acquired at resolution 15,000 (at m/z 200) in the Orbitrap using an AGC target value of 1E6 charges, a maxIT of 64 ms, and an underfill ratio of 0.1%, resulting in an intensity threshold for MS/MS of 1.3E5. Dynamic exclusion was applied with a repeat count of one and an exclusion time of 30 s.
Peptide Identification
MS/MS spectra were searched against the Swissprot Homo sapiens reference proteome (U2OS cells: downloaded February 2019, canonical and isoforms, 42,417 entries; human tissue: downloaded April 2020, canonical and isoforms, 42,347 entries) or the Mus musculus reference proteome (downloaded February 2018, canonical and isoforms, 25,131 entries) using MaxQuant software (U2OS cells: version 1.6.4.0; murine and human tissue: version 1.6.10.43) (21, 22). Enzyme specificity was set to trypsin and up to two missed cleavages were allowed. Cysteine carboxamidomethylation (Cys, +57.021464 Da) was treated as fixed modification and serine, threonine, and tyrosine phosphorylation (+79.966330 Da); methionine oxidation (Met, +15.994915 Da); and N-terminal acetylation (N-terminal, +42.010565 Da) as variable modifications. Peptide precursor and fragment ions were searched with a maximum mass deviation of 4.5 and 20 ppm, respectively. Peptide, protein, and site identifications were filtered at a false discovery rate of 1% using the decoy database strategy. The minimal peptide length was seven amino acids, the minimum Andromeda score for modified peptides was 40, and the corresponding minimum delta score was 6 (default MaxQuant settings). Peptide identifications were propagated across samples with the match between runs (MBR) option enabled for all samples (MBR-on) or disabled between urea and RNAB extracted samples (MBR-off). For this, urea and RNA-Bee extracted samples were searched per extraction group in MaxQuant and data combined during downstream analysis. Note that for samples of the same extraction group, the MBR option was enabled. Setting of the MBR option is indicated in each figure legend.
Label-Free Phosphopeptide Quantification and Data Analysis
Phosphopeptides were quantified by their extracted ion intensities (“Intensity” in MaxQuant). For PS, MaxQuant output data (Phospho (STY)Sites.txt) were loaded into R (version 3.6.3) (23) and further processed using a custom script. In brief, decoy database hits, contaminants, and all-zero intensity rows were excluded. Numbers of PS and missing values were determined by sample-wise summation of data in intensity columns per PS entry in the resulting table. For each site, this involves three separate intensity columns, __1/__2/__3, harboring data derived from phosphorylated peptides with 1, 2, or ≥3 phosphorylation sites, respectively, which are distinguished as they yield different signal magnitudes. The data matrix was then transformed from a wide format with separate __1, __2, and __3 columns to a long format with separate rows for PS quantifications derived from phosphopeptides with 1 (__1), 2 (__2), or ≥3 (__3) phosphorylation sites. Data were log2 transformed and normalized on the median intensity of all identified PS. Only PS with a localization probability 0.75 (class 1) were used for further analysis.
Correlation analysis was based on Pearson correlation of class 1 PS and plotted using the ComplexHeatmap R package (24). For dimension reduction analysis, the uniform manifold approximation and projection (UMAP) algorithm (25, 26) was used as implemented in the umap R package. Calculations were based on class 1 PS intensities, and missing values were replaced with zeros.
Gene ontology analysis was performed using the ClueGO plug-in version 2.5.4 (27) for Cytoscape software (28) with default settings. GO-term fusion was allowed, and only significant terms after p-value correction with Bonferroni step down (<0.05) were considered.
INKA analysis was performed as described (3), using the online version accessible at https://inkascore.org. For U2OS cell data, downloaded INKA scores were filtered for full data presence for replicates in one of the treatment groups (either untreated or irradiated). The limma (29) R package was used to perform differential expression analysis for INKA score and PS intensity data.
Furthermore, PS intensity data were filtered for the presence of at least two of three data points for the samples in at least one of the treatment groups. In case of data presence in one group and absence in the other (PS on/off behavior), only observations without missing values in the “PS on” group were allowed. Solely in these cases missing values were imputed in the “PS off” group with a zero to derive a p-value. Fold changes were determined using the mean of each treatment group and the antilog value was calculated (2(mean of log2 values group 2 - mean of log2 values group 1)).
To rank PS for posttranslational modification signature enrichment analysis (PTM-SEA), the negative log10 p-values derived from limma were multiplied with the sign of the fold change. In case of duplicated PS amino acid windows, the most significant (lowest p-value) entry was used. PTM-SEA was performed using the GenePattern platform (30), and output was further processed in R.
Standard deviation to estimate resemblance of PS from each extraction method was calculated per treatment group from urea- and RNAB-derived PS intensities together and missing values were imputed with zero.
Experimental Design and Statistical Rationale
Single-shot phosphoproteomic profiling was performed for 12 U2OS cell samples (15-cm cell-culture dishes), eight replicate samples from a single normal murine liver, and nine human tissue samples (three replicates each for a single normal liver, HCC, and melanoma specimen). For each variation (“urea,” extraction with urea lysis buffer; “RNAB,” extraction with RNA-Bee; “IR,” irradiation; “NT,” no treatment) three to four replicate samples were used. The selection of a single cell line and single tissue specimen as proof of principle minimizes inter–cell line and interindividual variation and thus allows a more unbiased focus on the phosphorylation sites in each condition. Phosphoproteomic workflow reproducibility was assessed previously (20) and thus motivated our choice of at least three replicates per condition as a sample number that can be easily handled at a given time without compromising the quality of processing. To avoid batch effects, measurement of samples and conditions was alternated (e.g., three cycles with one sample each of the urea-NT, urea-IR, RNAB-NT, and RNAB-IR groups or alternating urea- and RNAB-isolated samples). For the analysis of differential PS, limma was selected as it was designed for handling of differential expression studies and smaller sample sizes (29). Statistical aspects of INKA scoring and PTM-SEA were described in the original publications (3, 19).
Results
Phosphoproteomic Data of U2OS Cells Extracted With Urea or RNA-Bee are Highly Similar
To compare the two extraction protocols, U2OS cells were either not treated or irradiated with 10 Gy followed by 1 h recovery before protein isolation with either RNAB or urea (three replicates for each treatment-isolation combination, Fig. 1 A and Experimental Procedures). For both isolation methods, our standard TiO2 phosphoproteomic workflow (20) was applied (Experimental Procedures). In total, 13,519 PS were identified with an average of 9034 PS per sample. No obvious differences in missing value numbers were found between samples extracted with urea and RNAB (Supplemental Fig. S1, A and B and Supplemental Table S1, B and C). Identified PS highly overlapped for both extraction methods, with 94.2% shared identifications for high-confidence class 1 PS (Fig. 1B and Supplemental Fig. S2B). Class 1 PS proportions were found to be equal for the two different extraction methods (Fig. 1B). Nonshared class 1 PS showed lower localization probability than shared class 1 PS (Supplemental Fig. S2, A and B). Furthermore, when gene names of nonshared class 1 PS were used for gene ontology analysis, no significant terms were found for extraction with RNAB, and only few terms with low gene coverage were observed for urea extraction (Supplemental Fig. S2C). Correlation analysis of normalized data (Fig. 1C) was able to distinguish both extraction techniques but overall showed very high similarity with a minimum correlation coefficient of 0.91 (Fig. 1C). When the UMAP dimension reduction algorithm (25, 26) was used on these PS data, the major separation occurred between nontreated and irradiated samples, not between isolation methods (Supplemental Fig. S2D). In summary, phosphoproteomic analyses based on AGPC-extracted protein samples fully recapitulate results obtained with protein extracts prepared via classical urea buffer lysis.
Fig. 1.

Phosphoproteomic data comparison of untreated and irradiated U2OS cells extracted with urea lysis buffer or RNAB shows very high similarity.A, schematic overview of the experimental setup. Three replicate 15-cm dishes with U2OS cells were irradiated with 10 Gy followed by incubation for 1 h (IR) or left untreated (NT) and subsequently harvested with urea lysis buffer (urea) or RNA-Bee (RNAB). RNA and DNA was removed for RNAB lysed cells and proteins were precipitated with acetone and dissolved in urea lysis buffer. Lysates were sonicated and phosphopeptides enriched using TiO2 before measurement on a QE HF mass spectrometer. Data analysis was performed using MaxQuant and R software. B, the upper bar plot shows the proportion of confidently localized (class 1) phosphosites (PS) for urea- and RNAB-isolated samples. The lower Venn diagram shows large overlap of detected class 1 PS between urea- and RNAB-isolated samples. Sequence windows of identified PS were used for the overlap. C, heatmap showing the correlation and strong resemblance between urea- and RNAB-isolated samples. Note the lowest correlation of 0.91. Pearson correlation coefficient (corr.coeff.) is based on normalized intensity data and class 1 phosphosites. D, correlation of postirradiation kinase activity for urea or RNAB lysis. Single-sample inferred kinase activity (INKA) analysis was performed to detect activated kinases. Scatter plot showing INKA score fold changes (FC) of untreated (NT) versus irradiated (IR) cells for urea- or RNAB-isolated specimens. Only significantly differential kinases are depicted. Limma-derived p-values are color coded. The INKA score magnitude is indicated via circle size and shows the median of the replicate-averaged INKA scores for urea- or RNAB-isolated cases for each kinase. The related individual plots are shown in Supplemental Fig. S2, E and F. E, phosphosite specific signature analysis (PTM-SEA) using phosphoproteomic data of cells lysed with urea or RNAB yields highly correlated results. As a ranking metric, −log10(p-value) multiplied by the sign of the fold change was used. Scatter plot showing normalized enrichment scores (NES) of phosphosite signatures derived from untreated (NT) versus irradiated (IR) cells after urea or RNAB isolation. Signature significance is color coded. Magnitude of p-values is indicated via circle size. p-Values were only averaged for signatures that were either both significant or both nonsignificant with both extraction methods. Related plots showing all significant signatures separately are shown in Supplemental Fig. S2, G and H. F, Venn diagram showing overlap of PS found for PTM-SEA signature KINASE-PSP_ATM shown in E for urea- and RNAB-lysed cells. Overlap is based on sequence windows. Note that owing to data presence filtering before statistical evaluation not all PS overlap here. Some of these nonshared PS were detected in a fraction of the samples; compare with H, I. Several PS are only present after irradiation (off/on behavior); in view of the sample number, only cases with complete data presence for either irradiation or control were considered; compare with H, I. Numeric tags x_1 and x_2 indicate if PS x was derived from a singly or doubly phosphorylated peptide, respectively. G, using PS overlapping with PTM-SEA signature set KINASE-PSP_ATM shown in E, the standard deviation of intensities was calculated across all samples (irrespective of isolation method) for each PS member of the signature after irradiation (IR) or no treatment (NT). The resulting frequency distribution is plotted. H, Cleveland dot plot showing the fold changes (FC) found for PS overlapping with the KINASE-PSP_ATM signature derived from PTM-SEA shown in E. Limma-derived significance of NT versus IR comparison is color coded. Off/on (black/white regulation) behavior of PS after irradiation is indicated. Isolation method is depicted with different shapes. Several PS are only present after irradiation, most probably owing to sample number, and only cases with complete data presence for either irradiation or control were considered; compare with I. Numeric tags x_1, x_2, and x_3 indicate if PS x was derived from a singly or multiply phosphorylated peptide; equivalent PS derived from these peptides are labelled with ∗. I, heatmap visualizing enriched PS for PTM-SEA KINASE-PSP_ATM signature shown in E. The measured log2 intensity is color coded for each PS. Black color indicates no detection. For A–I MaxQuant MBR was enabled for all samples.
U2OS cells display a known phosphorylation response after irradiation-induced DNA damage, and DNA damage signaling is initiated via phosphatidylinositol 3-kinase related kinases such as ATM, ATR, and DNAPK/PRKDC (31). To investigate possible differences in the extent to which this response is captured with phosphoproteomic analyses of urea versus RNAB protein extracts, kinase activities were deduced for each sample using our INKA analysis pipeline (3). The resulting INKA scores were tested for significant differences when comparing untreated (NT) with irradiated (IR) samples. This analysis returned ATM, CHEK1/2, and DNAPK/PRKDC as top hits in each case (Supplemental Fig. S2, E and F and Supplemental Table S1E), which was expected for cells 1 h after irradiation (31, 32, 33). Moreover, the fold changes of these kinases showed a strong correlation between both extraction methods and were associated with similar INKA scores (Fig. 1D).
We next used PTM-SEA (19), a PS-specific signature analysis tool, to identify irradiation-induced changes in signaling pathways and kinase activity in untreated versus irradiated cells after urea or RNAB extraction. In analogy to INKA analysis, signatures for the ATM and CHEK1/2 kinases were found to be enriched after irradiation irrespective of the employed extraction method (Supplemental Fig. S2, G and H and Supplemental Table S1, F–G). Moreover, ionizing radiation-, UV-, and ATR-specific signatures were enriched after irradiation, whereas cell cycle–associated CDK1/2 and nocodazole signatures were negatively enriched. Normalized enrichment scores of significant signatures for both extraction methods showed high correlation (Fig. 1E).
Since these signatures are grouping terms, and a single PS could differ depending on the applied extraction method, we further checked PS overlapping with candidate signatures of the DNA damage response as defined by the PTMsigDB repository that is used in PTM-SEA in more detail (Fig. 1, F–I and Supplemental Fig. S3). For PS of the KINASE-PSP_ATM signature, we found a strong correlation when matching enriched PS sequence windows for both extraction methods (Fig. 1F). For each condition (NT or IR), the standard deviation jointly calculated for PS intensities of urea- and RNAB-extracted samples showed a peak close to zero (Fig. 1G). In addition, the fold changes of these PS in IR versus NT samples were in high agreement for both extraction methods (Fig. 1H), which was also found for PS intensities (Fig. 1I). Similar observations were made for ATR, AURKB, and CDK1 signatures (KINASE-PSP_ATR, KINASE-PSP_AurB/AURKB, and KINASE-PSP_CDK1, respectively; Supplemental Fig. S3, A–L).
Although the phosphorylation response to DNA damage is mainly mediated via serine/threonine protein kinases (33) and the overall ratio of phosphotyrosine (pTyr) sites compared with serine and threonine phosphorylation sites is low (1:1800 and 1:200, respectively (34)), we also addressed possible differences in pTyr sites after extraction with urea or RNAB (Supplemental Fig. S4). We observed a small number of pTyr sites and identified on average 76 pTyr sites (0.84% of total PS) per sample (Supplemental Table S1, B and C). No clear difference was observed when class 1 pTyr site intensities (Supplemental Fig. S4, A and B) or standard deviations of urea versus RNAB PS were compared for each treatment (Supplemental Fig. S4C).
For the above analysis, we enabled the MBR option in the MaxQuant software, which transfers MS1 identification features between samples based on accurate mass and retention time values (22, 35). Since this potentially can result in a higher overlap between urea- and RNAB-extracted samples, we repeated all our analyses for U2OS cells without allowing the transfer of identifications between the two extraction groups in MaxQuant and thus processed both groups separately (MBR-off) while allowing feature transfer in samples isolated by the same protocol (Supplemental Figs. S5–S9). As expected, this resulted in a drop in the percentage of overlapping class 1 PS (Supplemental Fig. S5, B and F), reduced sample correlation (Supplemental Fig. S5C), and separation of the samples by extraction group when we applied the UMAP algorithm (Supplemental Fig. S7D). However, the biological response of the cells to irradiation as based on INKA analysis (Supplemental Fig. S7, E and F and S5D) and PTM-SEA (Supplemental Fig. S7, G and H and S5E) was not affected by separate processing of the extraction groups. We also repeated the more detailed analysis of PTM-SEA signatures again and found them to be mostly unchanged with the MBR-off setting (Supplemental Fig. S5, G–I and S8, B–L). Class 1 pTyr sites identified with MBR-off were comparable with those identified with MBR-on. Although several pTyr sites were identified in only one isolation group, no clear preference for the extraction method was found (Supplemental Fig. S9). Also, for the urea extracted samples, the MBR-off setting resulted in a drop in correlation coefficient with an order of magnitude similar to the comparison of MBR-off urea and RNAB samples (Supplemental Fig. S5C and S10A). A similar drop in correlation with MBR-off compared with MBR-on was observed for the RNAB-extracted samples (Supplemental Fig. S5C and S10B). This indicates that the MBR option has a stronger effect on sample similarity and correlation than the difference between urea and RNAB isolation.
Phosphoproteomic Data of Murine and Human Tissue Material Extracted With Urea or RNAB are Highly Correlated
As further proof of principle, we extended our comparison of the two extraction protocols to murine and human tissue material (Fig. 2). We first isolated protein with either RNAB or urea from normal mouse liver tissue (four replicates each) in analogy to the U2OS cells above and applied our above-mentioned TiO2 phosphoproteomic workflow. In total, 9040 PS were identified with an average of 6556 PS per sample (Supplemental Fig. S11 and Supplemental Table S1I). All murine liver samples showed comparable numbers of missing values, except for one urea-extracted sample, which yielded markedly fewer PS identifications than all other samples (Supplemental Fig. S11A). For this liver replicate, sample cleanup after trypsin digestion was compromised owing to a faulty desalting column. As observed for U2OS cells, identified PS highly overlapped for both extraction methods, with 94.3% shared identifications for high-confidence class 1 PS (Fig. 2A and Supplemental Fig. S12). Also, the class 1 PS proportions were found to be equal for the two different extraction methods (Fig. 2A). Nonshared class 1 PS showed lower localization probability than shared class 1 PS (Supplemental Fig. S12, A and B). Furthermore, when gene names of nonshared class 1 PS were used for gene ontology analysis, no significant terms were found for extraction with RNAB or urea (Supplemental Fig. S12C). Correlation analysis of normalized data (Fig. 2B) was not fully able to distinguish both extraction techniques and overall showed very high similarity with a minimum correlation coefficient of ∼0.93 (Fig. 2B). Calculation of standard deviations over all murine liver class 1 PS irrespective of isolation method revealed a peak around zero (Fig. 2C), indicating very high similarity of these PS. No clear difference was observed when class 1 murine liver pTyr sites (average 51 per sample) were examined (Supplemental Fig. S13, Supplemental Table S1J).
Fig. 2.

Phosphoproteomic data comparison of mouse and human tissue material extracted with urea lysis buffer or RNA-Bee shows high correlation.A, murine liver tissue: The upper bar plot shows the proportion of confidently localized (class 1) phosphosites (PS) for urea- and RNAB-isolated samples. The lower Venn diagram shows a large overlap of detected class 1 PS between urea- and RNAB-isolated samples. Sequence windows of identified PS were used for the overlap. B, murine liver tissue: Heatmap showing the correlation and strong resemblance between urea- and RNAB-isolated samples. Pearson correlation coefficient (corr.coeff) is based on normalized intensity data and class 1 phosphosites. C, murine liver tissue: Standard deviation of class 1 phosphosites was calculated across all samples irrespective of isolation method. The resulting frequency distribution is plotted. D, human tissue: Same as in A for normal liver (left), HCC (middle), and melanoma (right). E, human tissue: Same as in B for normal liver (left), HCC (middle), and melanoma (right). F, human tissue: Single-sample inferred kinase activity (INKA) analysis was performed to detect activated kinases. Scatter plot showing similarity of INKA scores for urea- and RNAB-isolated specimens. INKA scores were averaged from three replicates, and top ten ranking kinase activities based on the urea-extracted group are indicated. Standard deviation (SD) of INKA scores was calculated across all samples irrespective of the isolation method and is color coded. The correlation factor is indicated at the bottom right of each panel. Normal liver (left), HCC (middle), and melanoma (right). G, human tissue: Same as in C for normal liver (left), HCC (middle), and melanoma (right). For A–G MaxQuant MBR was enabled for all samples.
We next employed normal human tissue material to compare urea and RNAB isolation methods for use in phosphoproteomics. We used urea or RNAB to isolate protein from human normal liver, HCC, and melanoma (three replicates for each tissue and isolation method) and again enriched for phosphopeptides with our TiO2 procedure. Since these samples were different in tissue origin and collection procedure, we analyzed them separately and compared urea- and RNAB-derived data per tissue type (Fig. 2, D–G, Supplemental Figs. S14–S18). Depending on tissue origin, we identified different numbers of PS, ranging from 8764 PS for normal liver (average of 6320 PS per sample) to 8571 PS for HCC (average of 6154 PS per sample) and 4530 PS for melanoma (average of 3075 per sample). No obvious differences in numbers of missing values were found between samples extracted with urea versus RNAB (Supplemental Fig. S14 and Supplemental Table S1, M, R, and W). As above, the identified PS strongly overlapped for both extraction methods, with roughly 90% shared identifications for high-confidence class 1 PS. We noticed about 5% less overlap than observed for U2OS cells or murine liver samples (Fig. 2D and Supplemental Fig. S15). As for U2OS cells and murine liver, class 1 PS proportions were found to be equal for the two different extraction methods (Fig. 2D) and nonshared class 1 PS showed lower localization probability than shared class 1 PS (Supplemental Fig. S15). When gene names of nonshared class 1 PS were compared in gene ontology analysis, only few significant terms were found, depending on tissue origin (Supplemental Fig. S15, C, F, and I). These terms were unrelated to each other. Correlation analysis of normalized data distinguished both extraction techniques for each tissue origin but overall showed very high similarity with lowest correlation coefficients of 0.87 to 0.91 (Fig. 2E). We next deduced kinase activities for the human tissue samples via INKA analysis. When INKA scores for urea- or RNAB-extracted specimens were plotted against each other, we observed very high correlation for each tissue type with an overall lowest correlation coefficient of 0.95 for the HCC samples (Fig. 2F). We also examined the standard deviation over all class 1 PS per human tissue (irrespective of isolation method). As observed for the murine liver samples, our calculations resulted in a peak around zero again for each tissue (Fig. 2G). Analysis of class 1 pTyr sites for liver, HCC, and melanoma samples revealed results very similar to the U2OS cells and murine liver samples, showing no clear difference for urea or RNAB extraction (Supplemental Figs. S16–S18). Sample average class 1 numbers for pTyr sites were 96 for human liver, 51 for HCC and 13 for melanoma samples (Supplemental Table S1, N, S, and X.
Finally, we repeated the analysis of murine and human tissue without transfer of identification features between the urea- and RNAB-extracted samples (MBR-off, Supplemental Figs. S19–S28). As observed for U2OS cells, overlap of class 1 PS dropped for both murine (Supplemental Fig. S19A, to 78.5%) and human (Supplemental Fig. S19D, to ∼70%) tissue samples. Sample correlation (Supplemental Fig. S19, B and E) was again reduced to a similar extent as observed with the U2OS cells (Supplemental Fig. S5C). In contrast, deduced kinase activities (Supplemental Fig. S19F) and standard deviations of class 1 PS (Supplemental Fig. S19, C and G) were largely unaffected when MBR was switched off between urea- and RNAB-isolated samples. Class 1 MBR-off pTyr sites were comparable with the MBR-on setting, although several pTyr sites were identified in only one isolation group. In this regard, no clear preference for the extraction method was found (Supplemental Fig. S22, (26, 27, 28)). When we compared urea MBR-on and MBR-off as well as RNAB MBR-on and MBR-off samples tissue-wise with each other (Supplemental Figs. S23 and S29 compared with Supplemental Fig. S19, B and E), we observed again that the MBR option has a stronger effect on PS similarity than the extraction protocol.
Taken together, phosphoproteomic analyses based on AGPC-extracted protein samples from cell lines, murine tissue, and human (tumor) tissue fully recapitulate results obtained with protein extracts prepared via urea buffer lysis.
Discussion
Using omics technologies, it is now possible to comprehensively quantify and characterize nearly all biological molecules that are present in a specimen. However, this requires dedicated workflows for different types of biological molecules. With small samples, it becomes a problem to subdivide them into aliquots that harbor sufficient input material for the different workflows, e.g., transcriptomics and proteomics. In these cases, it becomes inevitable to extract different types of biological molecules from the same sample. One such strategy is to use the organic phase of AGPC extracts, which are normally discarded after retrieving the RNA-containing water phase, in order to retrieve the protein complement of specimens. Although it has been shown that this approach is feasible for both proteomics (11, 12, 13, 14) and phosphoproteomics workflows (15, 16, 17), a direct and thorough comparison of its performance relative to a dedicated (“common”) extraction procedure has not been reported for phosphoproteomics. Here, we show that protein extraction from organic AGPC (RNAB) fractions can substitute for cell lysis with urea buffer in a phosphoproteomic workflow, equally well capturing central phosphoprotein players and functional biology in cell lines as well as in murine and human tissue.
For our first comparison, we used the well-studied response of cells to DNA damage (31, 32, 36, 37) as a trigger of phosphorylation changes. Results obtained with the two different extraction procedures were highly similar, with over 94% of all class 1 PS being shared.
To infer kinase activity following a DNA-damaging stimulus, we applied our recently developed single-sample INKA algorithm (3). The deduced kinases we identified to be active 1 h after irradiation, such as ATM, ATR, CHEK1/2, and DNAPK/PRKDC, are well-described key kinases of DNA damage signaling and involved in the recruitment of additional downstream DNA repair factors (38, 39). We confirmed our findings with the INKA algorithm using PTM-SEA (19), which uses signature terms that are assembled from databases (19) such as PhosphositePlus (40). Urea- and RNAB-derived data both reproduced results from a previous study on the systems response of U2OS cells to DNA damage at the level of the phosphoproteome, showing increased phosphorylations attributed to ATM, ATR, DNAPK/PRKDC, and CHEK1/2 upon irradiation (31).
One effect of ATM, ATR, and CHEK1/2 kinase activity is the inhibition of CDKs to prevent further progression through the cell cycle after DNA damage (41). For both urea- and RNAB-derived PS data PTM-SEA identified CDK1/2 signatures as negatively enriched after irradiation. This corresponds well with two previous phosphoproteomic studies, where targets of CDK2 showed reduced phosphorylations in G361 human melanoma cells after treatment with the radiomimetic neocarzinostatin (37), or where CDK2 sequence motifs were found to be dephosphorylated after irradiation of B-lymphocyte cells (36).
PTM-SEA provides a powerful enrichment analysis approach and largely depends on current phosphorylation signature annotations for kinases, perturbations, and pathways available from databases that are not complete. For more than 95% of all reported human PS kinases or biological functions are unknown (1).
Like PTM-SEA, INKA analysis also captured a decrease in CDK1/2 scores that was similar for both urea- and RNAB-derived data (Supplemental Table S1E), but INKA scores were not significantly differential. On the other hand, INKA analysis indicated reduced PBK activity after irradiation for both urea and RNAB data, which was not detected with PTM-SEA. PBK/TOPK (PDZ-binding kinase/T-LAK cell-originated protein kinase) is involved in control of the cell cycle and mitotic progression (42). In fibrosarcoma cells it was shown that, upon doxorubicin-induced DNA damage and PBK overexpression, cells bypassed the G2/M DNA damage checkpoint and entered into the next mitosis (43), which might explain the need of cells to regulate PBK activity during situations of DNA damage.
Taken together, our comparison of untreated and irradiated U2OS cells reproduces previous findings on kinase activity changes upon induction of DNA damage and identified kinase activity changes are largely overlapping for both extraction methods.
For our comparison of organic AGPC (RNAB) and urea buffer lysis for use in phosphoproteomics, we also used more complex murine and human tissue material. Our results clearly recapitulate the findings observed with U2OS cells and support the very high similarity in data derived from both extraction protocols.
The MaxQuant MBR algorithm is aimed at higher reproducibility of peptides and thus protein quantification. It increases the number of peptides that can be used for quantification by allowing the transfer of MS1 identification features between samples based on accurate mass and retention time values (22, 35, 44). Enabling MBR algorithm might thus result in higher similarity of urea and RNAB extraction–derived data. Indeed, without MBR we observed a decrease in class 1 PS overlap and correlation between samples of the two different isolation protocols to a comparable extent for cells and tissues but numbers were still sufficiently high. Moreover, the biological response of the cells to irradiation and kinase activities deduced from tissue data were not affected by modulation of the MBR option, which argues against any potential bias induced by MBR. Furthermore, we observed a similar degree of reduction in correlation when we compared MBR-on with MBR-off for samples processed with the same protocol. It was recently shown that false transfers via MBR are high in number but well controlled by processing the data with the downstream MaxQuant LFQ algorithm for protein level quantification (45). However, the contribution of the MBR algorithm on false transfers at phosphopeptide or PS level is less clear and we are planning additional experiments to further examine this.
In conclusion, we show high similarity of PS identified after urea or AGPC extraction and extend previous findings using antibodies (46). AGPC-based extraction of proteins is thus very compatible with subsequent phosphoproteome profiling studies and likely the preferred method for simultaneous isolation of multiple biomolecules such as DNA, RNA, and protein/phosphoprotein when sample material is limited. AGPC-based extraction could potentially be applied in microscaling clinical biopsy workflows and in efforts on personalized multiomic data analysis in diseases such as cancer. In this regard, recent work demonstrated the utility of a microscaled proteogenomic workflow to isolate protein, phosphoprotein, DNA, and RNA from human breast cancer core needle biopsies (7). Here, samples were serially sectioned and alternating sections collected to isolate protein and nucleic acids separately. The results of our study indicate that AGPC might enable simultaneous extraction of protein and nucleic acids from core needle biopsies. The utility of AGPC-based protein extracts for the analysis of other posttranslational modifications will need to be addressed in future studies.
Data availability
The mass spectrometry proteomics data and MaxQuant software-generated text files have been deposited to the ProteomeXchange Consortium via the PRIDE (47) partner repository with the dataset identifier PXD023665.
Supplemental data
This article contains supplemental data.
Conflict of interest
The authors declare no competing interests.
Acknowledgments
We thank Dr Richard R. de Goeij-de Haas for preparation of TiO2 Stage-tips and Dr Jaco C. Knol for critical reading of the manuscript and suggestions on the text. We want to thank the department of pathology at Amsterdam UMC, Henk Dekker and Mariette Labots for help with the human tissue samples. We further thank all members of the OncoProteomics and Jonkers laboratories for discussions and support during the project.
Funding and additional information
This work was supported by a fellowship from the German Research Foundation (DFG) to F. R. and by grants from the Netherlands Organisation for Scientific Research (NWO-Middelgroot project 91116017 to C. R. J.), the Dutch Cancer Society (KWF project VU2013-6423), the European Union's Horizon 2020 research and innovation program under the Marie Skłodowska-Curie grant (agreement 722729), and the Oncode Institute, which is partly financed by KWF.
Author contributions
F. R. and C. R. J. conceived the study. M. P. D. performed cell culture experiments, F. R. processed the samples, and S. R. P. performed the MS analysis and MQ searches. F. R. analyzed the data and wrote the paper together with J. J. and C. R. J. All authors contributed to finalizing the manuscript and approved the final version.
Contributor Information
Jos Jonkers, Email: j.jonkers@nki.nl.
Connie R. Jimenez, Email: c.jimenez@amsterdamumc.nl.
Supplemental data
References
- 1.Needham E.J., Parker B.L., Burykin T., James D.E., Humphrey S.J. Illuminating the dark phosphoproteome. Sci. Signal. 2019;12 doi: 10.1126/scisignal.aau8645. [DOI] [PubMed] [Google Scholar]
- 2.Wirbel J., Cutillas P., Saez-Rodriguez J. Phosphoproteomics-based profiling of kinase activities in cancer cells. Methods Mol. Biol. 2018;1711:103–132. doi: 10.1007/978-1-4939-7493-1_6. [DOI] [PMC free article] [PubMed] [Google Scholar]
- 3.Beekhof R., van Alphen C., Henneman A.A., Knol J.C., Pham T.V., Rolfs F., Labots M., Henneberry E., Le Large T.Y., de Haas R.R., Piersma S.R., Vurchio V., Bertotti A., Trusolino L., Verheul H.M. INKA, an integrative data analysis pipeline for phosphoproteomic inference of active kinases. Mol. Syst. Biol. 2019;15 doi: 10.15252/msb.20188250. [DOI] [PMC free article] [PubMed] [Google Scholar]
- 4.Olsen J.V., Blagoev B., Gnad F., Macek B., Kumar C., Mortensen P., Mann M. Global, in vivo, and site-specific phosphorylation dynamics in signaling networks. Cell. 2006;127:635–648. doi: 10.1016/j.cell.2006.09.026. [DOI] [PubMed] [Google Scholar]
- 5.Beltran L., Cutillas P.R. Advances in phosphopeptide enrichment techniques for phosphoproteomics. Amino Acids. 2012;43:1009–1024. doi: 10.1007/s00726-012-1288-9. [DOI] [PubMed] [Google Scholar]
- 6.Mertins P., Tang L.C., Krug K., Clark D.J., Gritsenko M.A., Chen L., Clauser K.R., Clauss T.R., Shah P., Gillette M.A., Petyuk V.A., Thomas S.N., Mani D.R., Mundt F., Moore R.J. Reproducible workflow for multiplexed deep-scale proteome and phosphoproteome analysis of tumor tissues by liquid chromatography-mass spectrometry. Nat. Protoc. 2018;13:1632–1661. doi: 10.1038/s41596-018-0006-9. [DOI] [PMC free article] [PubMed] [Google Scholar]
- 7.Satpathy S., Jaehnig E.J., Krug K., Kim B.-J., Saltzman A.B., Chan D.W., Holloway K.R., Anurag M., Huang C., Singh P., Gao A., Namai N., Dou Y., Wen B., Vasaikar S.V. Microscaled proteogenomic methods for precision oncology. Nat. Comms. 2020;11:532. doi: 10.1038/s41467-020-14381-2. [DOI] [PMC free article] [PubMed] [Google Scholar]
- 8.Chomczynski P. A reagent for the single-step simultaneous isolation of RNA, DNA and proteins from cell and tissue samples. Biotechniques. 1993;15:532–534. 536-537. [PubMed] [Google Scholar]
- 9.Chomczynski P., Sacchi N. The single-step method of RNA isolation by acid guanidinium thiocyanate-phenol-chloroform extraction: Twenty-something years on. Nat. Protoc. 2006;1:581–585. doi: 10.1038/nprot.2006.83. [DOI] [PubMed] [Google Scholar]
- 10.Tan S.C., Yiap B.C. DNA, RNA, and protein extraction: The past and the present. J. Biomed. Biotechnol. 2009;2009 doi: 10.1155/2009/574398. [DOI] [PMC free article] [PubMed] [Google Scholar]
- 11.Braakman R.B.H., Bezstarosti K., Sieuwerts A.M., de Weerd V., van Galen A.M., Stingl C., Luider T.M., Timmermans M.A.M., Smid M., Martens J.W.M., Foekens J.A., Demmers J.A.A., Umar A. Integrative analysis of genomics and proteomics data on clinical breast cancer tissue specimens extracted with acid guanidinium thiocyanate-phenol-chloroform. J. Proteome Res. 2015;14:1627–1636. doi: 10.1021/acs.jproteome.5b00046. [DOI] [PubMed] [Google Scholar]
- 12.Braakman R.B.H., Sieuwerts A.M., Umar A. Shotgun proteomics on tissue specimens extracted with Acid guanidinium-thiocyanate-phenol-chloroform. Methods Mol. Biol. 2015;1293:115–122. doi: 10.1007/978-1-4939-2519-3_6. [DOI] [PubMed] [Google Scholar]
- 13.Pop C., Ameling S., Empen K., Rüdebusch J., Dhople V.M., Felix S.B., Loghin F., Völker U., Hammer E. Proteome analysis of heart biopsies using a TRIzol-based protein extraction. Clin. Chim. Acta. 2015;438:246–247. doi: 10.1016/j.cca.2014.08.033. [DOI] [PubMed] [Google Scholar]
- 14.Mills J., McConnell E., Leitão J.A., Lapierre L.R. Combined nucleotide and protein extractions in Caenorhabditis elegans. J. Vis. Exp. 2019 doi: 10.3791/59178. [DOI] [PubMed] [Google Scholar]
- 15.Yang F., Stenoien D.L., Strittmatter E.F., Wang J., Ding L., Lipton M.S., Monroe M.E., Nicora C.D., Gristenko M.A., Tang K., Fang R., Adkins J.N., Camp D.G., Chen D.J., Smith R.D. Phosphoproteome profiling of human skin fibroblast cells in response to low- and high-dose irradiation. J. Proteome Res. 2006;5:1252–1260. doi: 10.1021/pr060028v. [DOI] [PubMed] [Google Scholar]
- 16.Ham B.M., Yang F., Jayachandran H., Jaitly N., Monroe M.E., Gritsenko M.A., Livesay E.A., Zhao R., Purvine S.O., Orton D., Adkins J.N., Camp D.G., Rossie S., Smith R.D. The influence of sample preparation and replicate analyses on HeLa Cell phosphoproteome coverage. J. Proteome Res. 2008;7:2215–2221. doi: 10.1021/pr700575m. [DOI] [PMC free article] [PubMed] [Google Scholar]
- 17.Luís I.M., Alexandre B.M., Oliveira M.M., Abreu I.A. Selection of an appropriate protein extraction method to study the phosphoproteome of maize photosynthetic tissue. PLoS ONE. 2016;11 doi: 10.1371/journal.pone.0164387. [DOI] [PMC free article] [PubMed] [Google Scholar]
- 18.Stechow, von L., Olsen J.V. Proteomics insights into DNA damage response and translating this knowledge to clinical strategies. Proteomics. 2017;17:1600018. doi: 10.1002/pmic.201600018. [DOI] [PMC free article] [PubMed] [Google Scholar]
- 19.Krug K., Mertins P., Zhang B., Hornbeck P., Raju R., Ahmad R., Szucs M., Mundt F., Forestier D., Jane-Valbuena J., Keshishian H., Gillette M.A., Tamayo P., Mesirov J.P., Jaffe J.D. A curated resource for phosphosite-specific signature analysis. Mol. Cell Proteomics. 2019;18:576–593. doi: 10.1074/mcp.TIR118.000943. [DOI] [PMC free article] [PubMed] [Google Scholar]
- 20.Piersma S.R., Knol J.C., de Reus I., Labots M., Sampadi B.K., Pham T.V., Ishihama Y., Verheul H.M.W., Jimenez C.R. Feasibility of label-free phosphoproteomics and application to base-line signaling of colorectal cancer cell lines. J. Proteomics. 2015;127:247–258. doi: 10.1016/j.jprot.2015.03.019. [DOI] [PubMed] [Google Scholar]
- 21.Cox J., Mann M. MaxQuant enables high peptide identification rates, individualized p.p.b.-range mass accuracies and proteome-wide protein quantification. Nat. Biotechnol. 2008;26:1367–1372. doi: 10.1038/nbt.1511. [DOI] [PubMed] [Google Scholar]
- 22.Tyanova S., Temu T., Cox J. The MaxQuant computational platform for mass spectrometry-based shotgun proteomics. Nat. Protoc. 2016;11:2301–2319. doi: 10.1038/nprot.2016.136. [DOI] [PubMed] [Google Scholar]
- 23.R Core Team . R Foundation for Statistical Computing; Vienna, Austria: 2018. R: A Language and Environment for Statistical Computing. [Google Scholar]
- 24.Gu Z., Eils R., Schlesner M. Complex heatmaps reveal patterns and correlations in multidimensional genomic data. Bioinformatics. 2016;32:2847–2849. doi: 10.1093/bioinformatics/btw313. [DOI] [PubMed] [Google Scholar]
- 25.McInnes L., Healy J., Melville J. UMAP: Uniform manifold approximation and projection for dimension reduction. arXiv. 2018 1802.03426. [Google Scholar]
- 26.Becht E., McInnes L., Healy J., Dutertre C.-A., Kwok I.W.H., Ng L.G., Ginhoux F., Newell E.W. Dimensionality reduction for visualizing single-cell data using UMAP. Nat. Biotechnol. 2018;37:38–44. doi: 10.1038/nbt.4314. [DOI] [PubMed] [Google Scholar]
- 27.Bindea G., Mlecnik B., Hackl H., Charoentong P., Tosolini M., Kirilovsky A., Fridman W.-H., Pagès F., Trajanoski Z., Galon J. ClueGO: A Cytoscape plug-in to decipher functionally grouped gene ontology and pathway annotation networks. Bioinformatics. 2009;25:1091–1093. doi: 10.1093/bioinformatics/btp101. [DOI] [PMC free article] [PubMed] [Google Scholar]
- 28.Shannon P., Markiel A., Ozier O., Baliga N.S., Wang J.T., Ramage D., Amin N., Schwikowski B., Ideker T. Cytoscape: A software environment for integrated models of biomolecular interaction networks. Genome Res. 2003;13:2498–2504. doi: 10.1101/gr.1239303. [DOI] [PMC free article] [PubMed] [Google Scholar]
- 29.Ritchie M.E., Phipson B., Wu D., Hu Y., Law C.W., Shi W., Smyth G.K. Limma powers differential expression analyses for RNA-sequencing and microarray studies. Nucleic Acids Res. 2015;43:e47. doi: 10.1093/nar/gkv007. [DOI] [PMC free article] [PubMed] [Google Scholar]
- 30.Reich M., Liefeld T., Gould J., Lerner J., Tamayo P., Mesirov J.P. GenePattern 2.0. Nat. Genet. 2006;38:500–501. doi: 10.1038/ng0506-500. [DOI] [PubMed] [Google Scholar]
- 31.Beli P., Lukashchuk N., Wagner S.A., Weinert B.T., Olsen J.V., Baskcomb L., Mann M., Jackson S.P., Choudhary C. Proteomic investigations reveal a role for RNA processing factor THRAP3 in the DNA damage response. Mol. Cell. 2012;46:212–225. doi: 10.1016/j.molcel.2012.01.026. [DOI] [PMC free article] [PubMed] [Google Scholar]
- 32.Matsuoka S., Ballif B.A., Smogorzewska A., McDonald E.R., Hurov K.E., Luo J., Bakalarski C.E., Zhao Z., Solimini N., Lerenthal Y., Shiloh Y., Gygi S.P., Elledge S.J. ATM and ATR substrate analysis reveals extensive protein networks responsive to DNA damage. Science. 2007;316:1160–1166. doi: 10.1126/science.1140321. [DOI] [PubMed] [Google Scholar]
- 33.Bensimon A., Aebersold R., Shiloh Y. Beyond ATM: The protein kinase landscape of the DNA damage response. FEBS Lett. 2011;585:1625–1639. doi: 10.1016/j.febslet.2011.05.013. [DOI] [PubMed] [Google Scholar]
- 34.Mann M., Ong S.E., Grønborg M., Steen H., Jensen O.N., Pandey A. Analysis of protein phosphorylation using mass spectrometry: Deciphering the phosphoproteome. Trends Biotechnol. 2002;20:261–268. doi: 10.1016/s0167-7799(02)01944-3. [DOI] [PubMed] [Google Scholar]
- 35.Prianichnikov N., Koch H., Koch S., Lubeck M., Heilig R., Brehmer S., Fischer R., Cox J. MaxQuant software for ion mobility enhanced shotgun proteomics. Mol. Cell Proteomics. 2020;19:1058–1069. doi: 10.1074/mcp.TIR119.001720. [DOI] [PMC free article] [PubMed] [Google Scholar]
- 36.Bennetzen M.V., Larsen D.H., Bunkenborg J., Bartek J., Lukas J., Andersen J.S. Site-specific phosphorylation dynamics of the nuclear proteome during the DNA damage response. Mol. Cell Proteomics. 2010;9:1314–1323. doi: 10.1074/mcp.M900616-MCP200. [DOI] [PMC free article] [PubMed] [Google Scholar]
- 37.Bensimon A., Schmidt A., Ziv Y., Elkon R., Wang S.-Y., Chen D.J., Aebersold R., Shiloh Y. ATM-dependent and -independent dynamics of the nuclear phosphoproteome after DNA damage. Sci. Signal. 2010;3:rs3. doi: 10.1126/scisignal.2001034. [DOI] [PubMed] [Google Scholar]
- 38.Blackford A.N., Jackson S.P. ATM, ATR, and DNA-PK: The trinity at the heart of the DNA damage response. Mol. Cell. 2017;66:801–817. doi: 10.1016/j.molcel.2017.05.015. [DOI] [PubMed] [Google Scholar]
- 39.Lanz M.C., Dibitetto D., Smolka M.B. DNA damage kinase signaling: Checkpoint and repair at 30 years. EMBO J. 2019;38 doi: 10.15252/embj.2019101801. [DOI] [PMC free article] [PubMed] [Google Scholar]
- 40.Hornbeck P.V., Zhang B., Murray B., Kornhauser J.M., Latham V., Skrzypek E. PhosphoSitePlus, 2014: Mutations, PTMs and recalibrations. Nucleic Acids Res. 2015;43:D512–D520. doi: 10.1093/nar/gku1267. [DOI] [PMC free article] [PubMed] [Google Scholar]
- 41.Reinhardt H.C., Yaffe M.B. Kinases that control the cell cycle in response to DNA damage: Chk1, Chk2, and MK2. Curr. Opin. Cell Biol. 2009;21:245–255. doi: 10.1016/j.ceb.2009.01.018. [DOI] [PMC free article] [PubMed] [Google Scholar]
- 42.Herbert K.J., Ashton T.M., Prevo R., Pirovano G., Higgins G.S. T-LAK cell-originated protein kinase (TOPK): An emerging target for cancer-specific therapeutics. Cell Death Dis. 2018;9 doi: 10.1038/s41419-018-1131-7. [DOI] [PMC free article] [PubMed] [Google Scholar]
- 43.Nandi A.K., Ford T., Fleksher D., Neuman B., Rapoport A.P. Attenuation of DNA damage checkpoint by PBK, a novel mitotic kinase, involves protein-protein interaction with tumor suppressor p53. Biochem. Biophys. Res. Commun. 2007;358:181–188. doi: 10.1016/j.bbrc.2007.04.125. [DOI] [PubMed] [Google Scholar]
- 44.Cox J., Hein M.Y., Luber C.A., Paron I., Nagaraj N., Mann M. Accurate proteome-wide label-free quantification by delayed normalization and maximal peptide ratio extraction, termed MaxLFQ. Mol. Cell Proteomics. 2014;13:2513–2526. doi: 10.1074/mcp.M113.031591. [DOI] [PMC free article] [PubMed] [Google Scholar]
- 45.Lim M.Y., Paulo J.A., Gygi S.P. Evaluating false transfer rates from the match-between-runs algorithm with a two-proteome model. J. Proteome Res. 2019;18:4020–4026. doi: 10.1021/acs.jproteome.9b00492. [DOI] [PMC free article] [PubMed] [Google Scholar]
- 46.Hummon A.B., Lim S.R., Difilippantonio M.J., Ried T. Isolation and solubilization of proteins after TRIzol extraction of RNA and DNA from patient material following prolonged storage. Biotechniques. 2007;42:467–470. doi: 10.2144/000112401. 472. [DOI] [PMC free article] [PubMed] [Google Scholar]
- 47.Perez-Riverol Y., Csordas A., Bai J., Bernal-Llinares M., Hewapathirana S., Kundu D.J., Inuganti A., Griss J., Mayer G., Eisenacher M., Pérez E., Uszkoreit J., Pfeuffer J., Sachsenberg T., Yilmaz S. The PRIDE database and related tools and resources in 2019: Improving support for quantification data. Nucleic Acids Res. 2019;47:D442–D450. doi: 10.1093/nar/gky1106. [DOI] [PMC free article] [PubMed] [Google Scholar]
Associated Data
This section collects any data citations, data availability statements, or supplementary materials included in this article.
Supplementary Materials
Data Availability Statement
The mass spectrometry proteomics data and MaxQuant software-generated text files have been deposited to the ProteomeXchange Consortium via the PRIDE (47) partner repository with the dataset identifier PXD023665.