

ABSTRACT
Background
Fructose consumption has been linked to nonalcoholic fatty liver disease (NAFLD) in children. However, the effect of high-fructose corn syrup (HFCS) compared with sucrose in pediatric NAFLD has not been investigated.
Objectives
We tested whether the isocaloric substitution of dietary sucrose by HFCS would increase the severity of NAFLD in juvenile pigs, and whether this effect would be associated with changes in gut histology, SCFA production, and microbial diversity.
Methods
Iberian pigs, 53-d-old and pair-housed in pens balanced for weight and sex, were randomly assigned to receive a mash diet top-dressed with increasing amounts of sucrose (SUC; n = 3 pens; 281.6–486.8 g/kg diet) or HFCS (n = 4; 444.3–724.8 g/kg diet) during 16 wk. Diets exceeded the animal's energy requirements by providing sugars in excess, but met the requirements for all other nutrients. Animals were killed at 165 d of age after blood sampling, and liver, muscle, and gut were collected for histology, metabolome, and microbiome analyses. Data were analyzed by multivariate and univariate statistics.
Results
Compared with SUC, HFCS increased subcutaneous fat, triacylglycerides in plasma, and butyrate in colon (P ≤ 0.05). In addition, HFCS decreased UMP and short-chain acyl carnitines in liver, and urea nitrogen and creatinine in serum (P ≤ 0.05). Microbiome analysis showed a 24.8% average dissimilarity between HFCS and SUC associated with changes in SCFA-producing bacteria. Body weight gain, intramuscular fat, histological and serum markers of liver injury, and circulating hormones, glucose, and proinflammatory cytokines did not differ between diets.
Conclusions
Fructose consumption derived from HFCS promoted butyrate synthesis, triglyceridemia, and subcutaneous lipid deposition in juvenile Iberian pigs, but did not increase serum and histological markers of NAFLD compared with a sucrose-enriched diet. Longer studies could be needed to observe differences in liver injury among sugar types.
Keywords: added sugar, pediatric, dysbiosis, microbiome, metabolomics
Introduction
Pediatric nonalcoholic fatty liver disease (NAFLD) represents a major cause of chronic liver pathology in Western populations, with cases documented in individuals as young as 2 y of age (1), and a prevalence of ≤83% in adolescents with morbid obesity (2). Previous studies have found an increase in hepatic fatty acid synthesis (3, 4), histological severity (5), and increased odds of inflammation (6) to be associated with high-carbohydrate, low-fat diets. Particularly, the effect of dietary fructose in the pathogenesis of NAFLD has become a critical question because of the fructose-induced increase of de novo lipogenesis and insulin resistance (7, 8), which are linked to the liver disease in children (9, 10). Epidemiological studies have shown a parallel increase in fructose consumption and incidence of NAFLD in adolescents (11, 12). Additionally, short-term high fructose intake increased liver fat in healthy adults fed weight-maintaining diets (13) and caused hyperinsulinemia and hypertriglyceridemia in overweight adults (14), whereas dietary fructose restriction decreased liver and visceral fat, and improved insulin sensitivity in children with obesity (15). However, concerns have been raised about the relevance of these studies because fructose is not typically consumed in significant amounts as an isolated or pure substance, but rather as added sugar in the diet in the form of high-fructose corn syrup (HFCS) or sucrose (16). Sucrose is a disaccharide composed of 50% fructose and 50% glucose, whereas HFCS commonly added to beverages contains ∼65% fructose, ∼30% glucose (but in a free monosaccharide form), and ∼5% short-chain glucose oligomers (17, 18). Because of the higher fructose content, it has been speculated that products sweetened with HFCS could provide more fructose into the systemic circulation than those enriched with sucrose, increasing the fructose-induced adverse metabolic effects (19). Furthermore, whereas sucrose must first be hydrolyzed by sucrase-isomaltase in the gut, fructose and glucose are readily available monosaccharides in HFCS, which can increase the rate of fructose absorption (20). In this regard, previous work comparing the bioavailability of isocaloric HFCS- and sucrose-enriched beverages in healthy subjects has shown higher postprandial fructose concentrations in response to HFCS (20). Nonetheless, very few clinical studies in the literature have investigated the effect of HFCS compared with sucrose in NAFLD-related parameters. Bravo et al. (21) did not find any increase in liver fat in healthy adults after 10-wk consumption of a normal diet in which HFCS or sucrose was provided as sweetened beverages at 8%, 18%, or 30% total energy. Similarly, inclusion of sucrose- or HFCS-enriched milk at 10% and 20% daily caloric intake in a 10-wk weight maintenance diet did not promote weight gain or an atherogenic profile in obese subjects (22). Surprisingly, previous studies have only used eucaloric diets, despite the strong association between NAFLD and excessive caloric intake in both child (23) and adult populations (24).
Pigs represent an excellent translational model for liver research due to similarities between pigs and humans with respect to liver size and structure, gastrointestinal physiology, and lipoprotein profiles (25). In particular, the Iberian breed has emerged as a research model of metabolic syndrome and NAFLD because of its elevated voluntary feed intake and great lipogenic potential (26, 27). Similar to the Zucker fatty rat, Iberian pigs have a mutation in the leptin receptor gene, which has been associated with a leptin resistance phenotype characterized by hyperphagia, obesity, and increased leptin concentrations compared with other porcine breeds (28, 29). Therefore, the first goal of this study was to investigate whether replacing dietary sucrose by an isocaloric amount of HFCS under hypercaloric conditions would increase the severity of NAFLD in juvenile Iberian pigs. We have previously shown that feeding a “Western diet” enriched with fructose and saturated fat to juvenile Iberian pigs for 10 wk caused colonic hyperplasia and compositional shifts in intestinal microbial populations, which by promoting trimethylamine synthesis and possibly disrupting gut barrier function, might have caused damage to the liver (27, 30). Therefore, the second objective of this study was to investigate whether HFCS- or sucrose-sweetened diets would cause changes in the gut mucosa and microbial diversity associated with liver injury.
Methods
Experimental design
All experimental procedures were approved by the Institutional Animal Care and Use Committee of California Polytechnic State University (#1611) and conducted in accordance with the NRC Guide for the Care and Use of Laboratory Animals. Iberian pigs (Sus scrofa) from the Swine Unit at California Polytechnic State University were weaned at 53 d of age and 13.5 ± 2.1 kg and moved into 4 × 4-m outdoor pens, with each pen balanced for weight and containing 1 male and 1 female. Pens were randomly assigned to receive 1 of 2 hypercaloric diets for 16 consecutive weeks (Supplemental Table 1): 1) SUC (n = 3 pens): standard mash diet + sucrose, and 2) HFCS (n = 4 pens): standard mash diet + HFCS. To establish a metabolic baseline for all the parameters measured in the study, 6 pigs (BSL; n = 3 pens) matched in sex and age, and housed in the same conditions as HFCS and SUC, were fed a eucaloric mash diet without added sugar.
SUC and HFCS diets were formulated to exceed the energy requirements of Iberian pigs by providing sucrose and HFCS in excess, but to meet the requirements for all other nutrients including protein, fat, vitamins, and minerals. Rations were prepared as follows: pig body weight (BW) was measured every 7 d, and daily mash intake per pig was calculated according to the equation:
 |
(1) |
This equation was formulated using 80% of the NRC recommended intake values for growing animals between 10 and 100 kg BW, to meet the lower protein requirements of Iberian pigs compared with commercial breeds (31, 32). Mash diet for each pen was weighted in individual containers, and then granulated sucrose (dry matter 99.8%, gross energy 3850 kcal/kg) (33) or HFCS (dry matter 77%, gross energy 2810 kcal/kg) (34) were top-dressed in the rations to gradually increase the energy content of the diet (i.e., weeks 1–4, 30% increase; weeks 5–10, 40% increase; weeks 11–14, 50% increase; weeks 15–16, 55% increase). Daily rations were divided into 2 equal meals and fed at 07:00 and 17:00. Rations were completely consumed by all animals throughout the study except on weeks 6 and 7, in which leftovers were observed in the SUC and HFCS groups. If ≥2 pens had leftovers during 2 consecutive feedings, a 10% reduction in feed intake was applied to all pens during a 24-h period to recover the appetite in the animals. The HFCS diet was formulated to provide ∼3% more energy than SUC by increasing the amount of HFCS in the diet, to account for syrup leftovers in feeders. Syrup losses were computed throughout the study and accounted for on each ration. To match the fructose-to-glucose ratio used in soft drinks (17, 18), commercial HFCS 55:45 (55% fructose, 45% glucose) and HFCS 90:10 (90% fructose, 5% glucose, 5% maltose) were mixed in a 3:1 ratio to achieve a final concentration of 64% fructose. Diets were submitted for proximate and free sugar profile analyses to the Agricultural Experimental Station at University of Missouri-Columbia (Supplemental Table 2).
Weaning (i.e., 53 d of age) was considered day 0 of the study. Animals were killed on day 112 after 8 h of fasting using an intramuscular injection of tiletamine and zolazepam (4 mg/kg BW; Zoetis), followed by an intracardiac injection of pentobarbital sodium (0.4 mL/kg BW; Schering-Plough). Blood samples were collected immediately before euthanasia, by intracardiac puncture using a 2-inch 14G needle with the pig in lateral recumbent position. Tissue from the liver, skeletal muscle (longissimus dorsi), distal ileum (DI), and colon, and luminal content from colon, were collected and frozen in liquid nitrogen or fixed for histological analysis. The liver section was the left medial segment, the longissimus dorsi section was at the 10th rib level, the DI section was the distal part of the small intestine immediately proximal to the cecum, and the colon section was the third spiral loop. Liver, heart, and kidneys were completely removed and weighed. Backfat over the loin at 10th rib was measured as a marker of subcutaneous fat deposition. Lean mass composition was calculated using the formula:
 |
(2) |
as previously described (35).
Serum biochemistry, hormones, and cytokines
Blood samples were centrifuged at 1932 × g for 15 min at 4°C, and serum and plasma stored at −80°C. Serum lipid and liver biochemistries were analyzed by the Comparative Pathology Laboratory at University of California, Davis using a Roche Integra 400 Plus (Roche Diagnostics). Insulin, leptin, and glucose were analyzed by the Animal Health Diagnostic Center at Cornell University using a human insulin radioimmunoassay kit (MilliporeSigma), a multispecies leptin RIA kit (MilliporeSigma), and a Cobas c501 (Roche Diagnostics), respectively. Analyses of serum were performed using pig-specific assays described previously for fibroblast growth factor 19 (Raybiotech Inc.) (27) and cytokines (Cytokine Core Laboratory at University of Maryland).
Triacylglyceride content and histological analysis of liver and intestinal tissue
Colorimetric detection of total monoacylglycerides, diacylglycerides, and triacylglycerides (TAGs) in liver and skeletal muscle tissue was performed with a commercially available kit (Sigma Aldrich) following the manufacturer's instructions. Histological analysis of liver, DI, and colon was performed as described in our previous work (27). The liver and gut stains were examined by an experienced pathologist (Comparative Pathology Laboratory, Davis, CA) who was blinded to the treatment groups. Hepatic steatosis, ballooning degeneration, Mallory–Denk bodies, lobular inflammation, fibrosis, and necrosis were semiquantitatively evaluated for each pig. Zonal distribution of each of these variables was also systematically annotated. Inflammation of the DI and colonic mucosa was diagnosed based on increased lymphocytes and plasma cells in lamina propria and submucosa, increased mitotic rate in glandular epithelium, increased mucosal epithelial proliferation, increased mucus production, decreased numbers of goblet cells at base of gland, intraepithelial lymphocytes, and congestion. Length of intestinal villi and crypts was analyzed by 1 experimenter blinded to the treatment, using the protocol described previously (27).
Western blot analysis
Approximately 100 mg liver tissue was homogenized and sonicated in a lysis buffer [50 mM Tris-HCl, 150 mM NaCl, 1% NP-40, and 0.5% of 20% (w/v) sodium dodecyl sulfate (SDS) solution] with a protease inhibitor cocktail (P8340; Sigma-Aldrich). Protein samples were electrophoretically separated on 7–12% SDS polyacrylamide gels (PAGE; CBS Scientific), transferred to polyvinylidene fluoride membranes (Thermo Fisher Scientific), and blocked with 5% BSA. Membranes were incubated overnight with primary antibodies (Cell Signaling Technology), followed by 1-h incubation with secondary antibodies (Cell Signaling Technology). Blots were developed using an enhanced chemiluminescence kit (GE Health Sciences), and analyzed using a ChemiDoc-It Imaging System (Bio-Rad Laboratories). For normalization, immunoblots performed with antiphosphospecific antibodies were exposed to stripping buffer (Pierce Biotechnology) and reprobed with nonphosphospecific antibodies against total protein (Cell Signaling Technology). Primary antibodies used were against protein kinase B (PKB; total and Ser473), 5'-AMP-activated protein kinase α (AMPKα; total and Thr172), and mammalian target of rapamycin (mTOR; total and Ser2448).
Microbiome analysis
To analyze microbiome composition in colon lumen, colon contents were scooped out with a sterile microscope slide into 50-mL sterile tubes (VWR), flash frozen in liquid nitrogen, and stored at −80°C. Samples were submitted to CoreBiome for 16S rRNA gene amplification of the V4 region. Samples were quantified using qPCR primers targeting the V4 region. Libraries were prepared using KAPA HiFi Polymerase, sequenced on an Illumina MiSeq using paired-end 2 × 250 reads, and the MiSeq Reagent Kit v3. DNA sequences were filtered for low quality (Q-score <30) and length (<50 bases), and adapter sequences were trimmed using Cutadapt (https://cutadapt.readthedocs.io/en/stable/). Fastq files were converted into a single fasta of stitched reads using SHI7. Operational taxonomic units (OTUs) were picked using a closed-reference approach at 97% identity against the GreenGenes database using fully gapped alignment with Burst (36). Ties were broken by minimizing the overall number of unique OTUs. For taxonomy assignment, each input sequence was assigned the lowest common ancestor that was consistent across ≥80% of all reference sequences tied for best hit. Samples with <1000 sequences were discarded. Biome tables were also collapsed at the phylum and genus level and used for statistical analyses. The Kyoto Encyclopedia of Genes and Genomes (KEGG) database (37) was used to predict functional categories from the 16S rRNA V4 region using the galaxy server for Phylogenetic Investigation of Communities by Reconstruction of Unobserved States (PICRUSt) (38). Biom table at the OTU level described above was uploaded to the PICRUSt server. Copy numbers were normalized, functional predictions were determined using KEGG orthologs, and functions were then categorized at level 3.
Metabolomic and SCFA analyses
Metabolomic analysis was performed on plasma and liver samples by protein precipitation extraction with ultra-performance LC tandem quadrupole MS, as previously described (27). Analyses were conducted on a Acquity UPLC I-Class system (Waters) coupled with an API 4000 QTrap (Sciex) using multiple reaction monitoring quantified with AB Sciex MultiQuant version 3.0 (Sciex). General metabolites were separated using a 150 × 2.0-mm Luna NH2 column (PhenomenexA) and detected by negative ion–mode electrospray ionization. For the aminomics assay, metabolites were separated using a 150 × 2.1-mm Atlantis HILIC column (Waters) and detected by positive ion–mode electrospray ionization. For the lipidomics assay, metabolites were separated using a 150 × 3.0-mm Prosphere HP C4 column (Grace) and detected by positive ion–mode electrospray ionization. Metabolite intensities were normalized to that of internal standards added during the extraction, with 6 to 8-point calibration curves, and to sample weight to account for small variations in starting tissue. Metabolites were expressed as peak AUCs.
SCFA composition in colon samples was quantified by GC using previously published methods (27). Chromatographic separations and analysis were conducted on an Agilent 7890A Gas Chromatograph (Agilent Technologies) equipped with a FID detector, a 7683B automatic liquid sampler (Agilent Technologies), split/splitless injection port, a ZB-WAX column (Phenomenex), and helium used as the carrier gas. Identification and quantitation of the SCFAs was based on the retention times and integrated peak areas of standard compounds. Metabolites in liver and plasma values are presented as absolute composition, whereas SCFA data in colon digesta are standardized to relative composition (so sample totals are 100%).
Statistical methods
Pen was considered as the experimental unit for all the analyses. Serum parameters, lean mass, organ weight, and loin and liver fat were analyzed by a 1-factor ANOVA using a mixed model in SAS 9.2 (PROC MIXED; SAS Institute Inc.) that included diet as fixed effect, and pen nested in diet as random effect. Cumulative BW gain was analyzed by a 2-factor ANOVA that included diet × day as fixed effect and a repeated measurement statement with day as repeated factor, and pen nested in diet as subject. Normality of the residuals and presence of outliers were assessed with PROC UNIVARIATE (SAS Institute Inc.). Nonnormally distributed parameters were power transformed by a parameter φ whose optimal value was estimated using the maximum likelihood method (39). Data are presented as means ± SD. Differences in hepatic histological features were analyzed by Kruskal–Wallis with Bonferroni multiple comparisons test for nonparametric data (PROC NPAR1WAY and PROC RANK; SAS Institute Inc.). Correlations were determined using the PROC CORR in SAS. Pearson correlation coefficient was considered significant at P ≤ 0.05.
Metabolomics data were analyzed with multivariate statistics as previously described (27, 40). Identification of significant metabolites between diets was performed with %Polynova SAS Macro (40) using a 1-factor ANOVA and a mixed model with the same fixed and random effects described above. Significance level for each metabolite was corrected for the total number of tests using the Benjamini–Hochberg procedure (41). Microbiome α- and β-diversity analyses (Bray–Curtis) were performed using the core_diversity_analyses.py script in the Quantitative Insights Into Microbial Ecology (QIIME1) (42). The script core_diversity_analysis.py runs a suite of scripts in the background, one of them being beta_diversity_through_plots.py script, which in turn runs the beta_diversity.py and principal_coordinates.py scripts. The output generated by the script was then used to construct α-diversity boxplots and principal coordinate analysis (PCoA) plots using the make_2d_plots.py script in QIIME1. Plots were modified in R 3.6.2 (43) using custom scripts. Statistical analyses were performed using the compare_categories.py script with default parameters and permutational ANOVA. Values are shown in the boxplots and β-diversity PCoA plots. To investigate taxa contribution to overall differences between SUC and HFCS pigs, raw counts at the genus level were imported into PRIMER-E software, standardized to relative composition (so sample totals are 100%), square root–transformed, and analyzed with similarity percentage procedure (SIMPER) with a cut-off value of 80% (44). Diet-induced changes in genera selected by SIMPER were further analyzed by 1-factor ANOVA using a mixed model that included diet as fixed effect, and pen nested in diet as random effect. Normality of the residuals and presence of outliers were assessed as described above.
Results
Markers of obesity, insulin resistance, and NAFLD
Age, initial BW, and male/female ratio were not different across pens. Cumulative BW gain did not differ between HFCS and SUC groups (Figure 1A), whereas lean mass composition and subcutaneous fat decreased and increased, respectively, in HFCS compared with SUC (P ≤ 0.05; Figure 1B, C). No differences were observed between HFCS and SUC for loin area and intramuscular fat (Supplemental Figure 1A, B), relative weight of liver, heart, and kidneys (Supplemental Figure 2A, B), or liver fat content (Figure 2A). Likewise, the prevalence and histological grade of liver injury did not change between HFCS- and SUC-fed pigs, with the presence of minimal microvesicular steatosis with periportal or random distribution in 75% of HFCS and 66.6% of SUC livers (Figure 2B, C). Hepatocellular ballooning, Mallory–Denk bodies, fibrosis, inflammation, and necrosis were not observed in any of the animals. Similarly, phosphorylation of PKB, AMPKα, and mTOR in liver did not differ between HFCS- or SUC-fed pigs (Supplemental Figure 3A–C). Compared with SUC, HFCS decreased blood urea nitrogen and creatinine in serum (P ≤ 0.05), whereas markers of liver injury, hormones, glucose, and proinflammatory cytokines did not differ between diets (Table 1).
FIGURE 1.
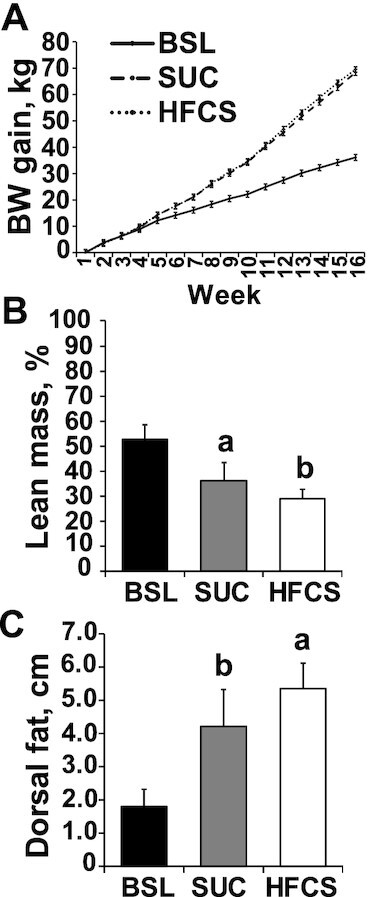
Hypercaloric diet supplemented with a high-fructose corn syrup (HFCS) decreased lean mass composition in juvenile Iberian pigs compared with a sucrose-enriched diet (SUC). (A) Cumulative body weight gain in baseline (BSL, n = 3 pens), SUC (n = 3 pens), and HFCS (n = 4 pens) pigs was measured every 7 d during 16 wk. (B) Lean mass was calculated using the formula 100 × [8.588 + (0.465 × hot carcass weight) − (21.896 × 10th rib fat depth) + (3.005 × 10th rib loin muscle area)]/hot carcass weight. (C) Dorsal fat was measured at the 10th rib in both sides of the pig loins. Values are means ± SDs. Data were analyzed using 1-factor ANOVA. Labeled means without a common letter differ.
FIGURE 2.
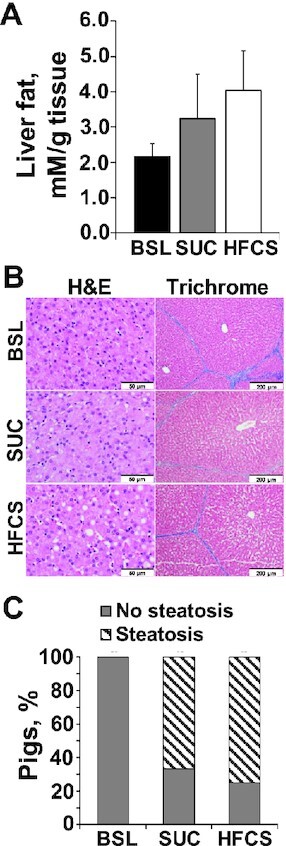
Histological markers of liver injury did not differ between juvenile Iberian pigs fed hypercaloric diets enriched with either sucrose (SUC) or high-fructose corn syrup (HFCS). (A) Colorimetric detection of total glycerides cleaved from monoacylglycerides, diacylglycerides, and triacylglycerides in liver tissue of baseline (BSL; n = 3 pens), SUC (n = 3 pens), and HFCS (n = 4 pens) pigs, expressed as millimolar per gram of tissue. (B) Representative microscopy images of liver tissue stained with hematoxylin-eosin (H&E) and trichrome methods (scale bars: 50 μm in H&E staining and 200 μm in trichrome slides). Steatosis, ballooning degeneration, Mallory–Denk bodies, lobular inflammation, fibrosis, and necrosis were semiquantitatively evaluated for each pig, and a lesion score was calculated. The zonal distribution of each of these variables was also annotated. (C) Percentage of Iberian pigs with histopathological changes in liver tissue consistent with steatosis based on the above described semiquantitative histological evaluation of all the pig livers. Values are means ± SDs. Data were analyzed using 1-factor ANOVA.
TABLE 1.
Liver biochemistry and serum hormones and proinflammatory cytokines in juvenile Iberian pigs fed BSL, SUC, or HFCS diets for 16 wk1
| Item | BSL | SUC | HFCS |
|---|---|---|---|
| n° pigs (pen) | 6 (3) | 6 (3) | 8 (4) |
| Sex (M/F) | 3/3 | 3/3 | 4/4 |
| Serum hormones and glucose | |||
| Insulin, μIU/mL | 5.41 ± 1.85 | 8.90 ± 1.85 | 11.8 ± 1.60 |
| Glucose, mg/dL | 113 ± 10.0 | 99.6 ± 20.7 | 106 ± 11.4 |
| HOMA2 | 1.50 ± 0.32 | 2.23 ± 1.27 | 3.18 ± 1.79 |
| Leptin, ng/mL | 15.1 ± 13.8 | 50.3 ± 13.8 | 56.6 ± 13.2 |
| FGF19, pg/mL | 119 ± 37.4 | 40.1 ± 25.8 | 37.2 ± 17.6 |
| Liver biochemistry | |||
| ALT, U/L | 40.0 ± 8.50 | 32.0 ± 2.91 | 27.9 ± 4.62 |
| AST, U/L | 31.1 ± 8.10 | 32.5 ± 17.8 | 16.3 ± 4.31 |
| ALP, U/L | 139 ± 30.7 | 151 ± 25.0 | 166 ± 13.3 |
| GGT, U/L | 29.9 ± 9.19 | 29.8 ± 7.10 | 25.6 ± 7.86 |
| LDH, U/L | 608 ± 108 | 641 ± 89.0 | 576 ± 50.7 |
| Total bilirubin, mg/dL | 0.02 ± 0.01 | 0.01 ± 0.01 | 0.01 ± 0.01 |
| BUN, mg/dL | 23.5 ± 7.59 | 21.5a ± 3.96 | 17.4b ± 3.07 |
| Albumin, g/dL | 5.05 ± 0.50 | 4.73 ± 0.41 | 4.52 ± 0.40 |
| Total protein, g/dL | 5.99 ± 0.97 | 5.79 ± 0.49 | 5.51 ± 0.57 |
| Creatinine, mg/dL | 0.78 ± 0.04 | 0.68a ± 0.06 | 0.58b ± 0.07 |
| Lipid profile | |||
| HDL, mg/dL | 55.5 ± 25.7 | 53.1 ± 7.68 | 59.3 ± 12.2 |
| LDL, mg/dL | 66.5 ± 14.1 | 57.3 ± 17.0 | 61.4 ± 16.7 |
| NEFAs, mEq/L | 0.07 ± 0.02 | 0.11 ± 0.03 | 0.11 ± 0.02 |
| Cholesterol, mg/dL | 106 ± 18.5 | 108.7 ± 21.2 | 121 ± 20.3 |
| TAGs, mg/dL | 32.1 ± 21.4 | 78.9 ± 74.1 | 93.1 ± 54.4 |
| Proinflammatory cytokines | |||
| TNFα, ng/mL | 1.84 ± 1.14 | 4.91 ± 3.09 | 2.72 ± 1.85 |
| IL1α, ng/mL | 19.8 ± 19.5 | 13.5 ± 7.41 | 14.8 ± 20.0 |
| TGFβ, ng/mL | 7.26 ± 3.38 | 7.21 ± 2.47 | 8.18 ± 3.20 |
Data are means ± SD. P values were calculated by 1-factor ANOVA. Labeled means without a common letter differ (P ≤ 0.05). ALP, alkaline phosphatase; ALT, alanine aminotransferase; AST, aspartate aminotransferase; BSL, baseline diet; BUN, blood urea nitrogen; FGF19, fibroblast growth factor 19; GGT, γ-glutamyl transferase; HFCS, high-fructose corn syrup–enriched diet; LDH, lactate dehydrogenase; NEFA, nonesterified fatty acid; SUC, sucrose-enriched diet; TAG, triacylglyceride; TGFβ, transforming growth factor β.
HOMA: homeostatic model assessment values were calculated according to the formula: [fasting insulin (μU/mL) × fasting glucose (mg/dL)]/405.
Metabolomic analysis
A total of 220 metabolites were detected in liver and plasma (Supplemental File 1). PCoA plots separated HFCS from SUC samples in liver but not in plasma datasets (Figure 3A, B). Using a raw ANOVA P value ≤0.05, we identified 4 and 9 significant metabolites in liver and plasma, respectively (Figure 3C), whereas using a false discovery rate (FDR)-corrected ANOVA P value ≤0.05, only 1 metabolite (sucrose + maltose + lactose) differed between diets. Compared with SUC, HFCS decreased UMP (P ≤ 0.05), pivaloyl carnitine (P ≤ 0.05), 2-methylbutyryl carnitine (P ≤ 0.05), and isovaleryl carnitine (P ≤ 0.05) in liver, and maltose + sucrose + lactose (P ≤ 0.001), phosphatidylethanolamine 32:0 (P ≤ 0.01), and sphingomyelin 15:0 (P ≤ 0.01) in blood. Conversely, blood concentrations of sphingomyelin 22:1 (P ≤ 0.05) and TAGs 46:2, 48:3, 54:1, 54:2, and 58:10 (P ≤ 0.05) increased in HFCS compared with SUC.
FIGURE 3.
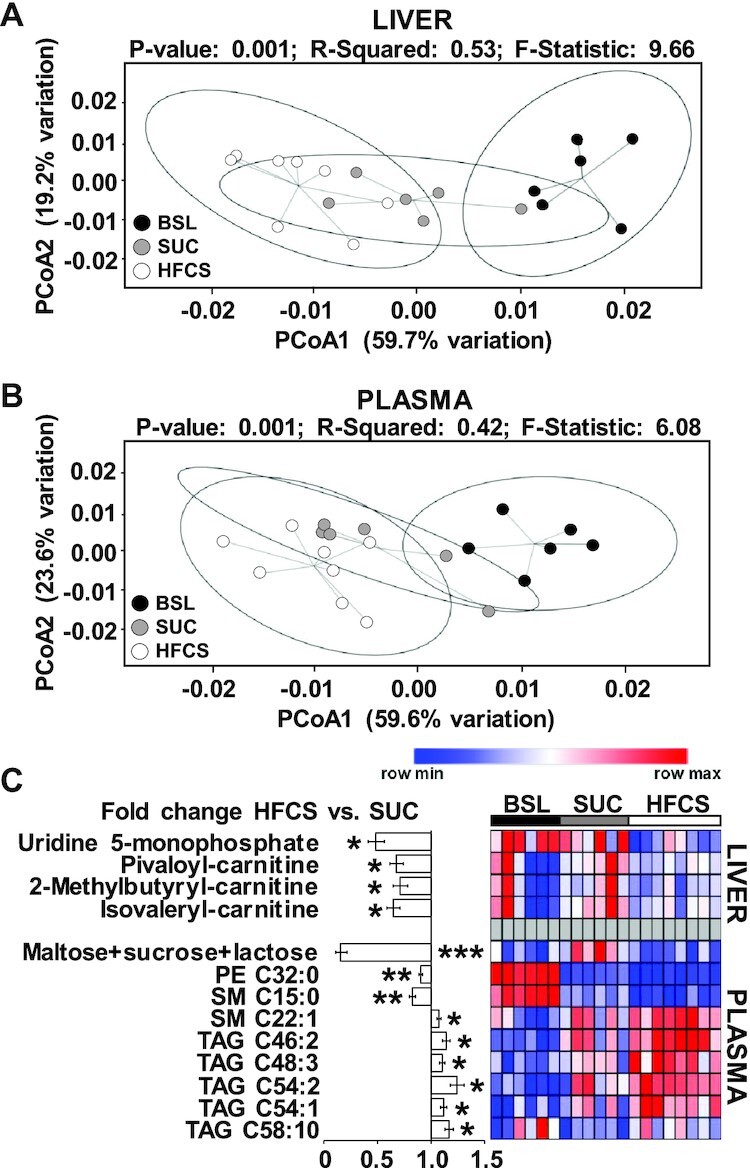
High-fructose corn syrup (HFCS)-enriched diet decreased UMP and short-chain acyl carnitines in liver, and increased triacylglycerides in plasma. Principal coordinate analysis of liver (A) and plasma (B) metabolites in juvenile Iberian pigs fed baseline (BSL; n = 3 pens), sucrose (SUC; n = 3 pens), or HFCS (n = 4 pens) diets to visualize group discrimination in a 2-dimensional scores plot. Each point represents an individual pig and color of point denotes diet. Group differences were assessed by nonparametric permutational ANOVA with diet as fixed effects, and pen nested in diet as random effect, under a reduced model, 9999 permutations, and type III sum of squares. (C) Heatmap of metabolites significantly altered by the diet in liver and blood, with fold change and significance levels by HFCS compared with SUC. Metabolites were measured by ultra-performance LC tandem quadrupole MS. Columns are individual pigs and rows are log2-transformed metabolites. Blue and red colors represent the row minimum and maximum values. Identification of significant metabolites was performed by 1-factor ANOVA and a mixed model that included diet as fixed effect, and pen nested in diet as random effect. Significance level for each metabolite was corrected for the total number of tests using the Benjamini–Hochberg (FDR) procedure. Using a raw ANOVA P value ≤ 0.05, we identified 4 and 9 significant metabolites in liver and plasma, respectively, whereas using an FDR-corrected ANOVA P value ≤ 0.05, only 1 metabolite (sucrose + maltose + lactose) differed between diets. *,**,***Significant fold change for HFCS compared with SUC: *P ≤ 0.05, **P ≤ 0.01, ***P ≤ 0.001. FDR, false discovery rate; PCoA, principal coordinate analysis; PE, phosphatidylethanolamine; SM, sphingomyelin; , TAG, triacylglyceride.
SCFAs, gut histology, and microbiome analyses
Relative abundance of butyric acid in colon digesta increased in HFCS compared with SUC pigs (P ≤ 0.05; Figure 4A). Histological examination of villi length and crypt depth in distal ileum and colon mucosa did not show differences between HFCS and SUC pigs (Figure 4B, C). Moreover, none of the distal ileum and colon stains had histological features of inflammation. Analysis of 16S rRNA in colon content identified a total of 3312 OTUs, which were aggregated into 17 phyla and 115 genera. At phyla level, HFCS and SUC samples were not separated in the PCoA plot nor showed differences in α-diversity indexes (Supplemental Figure 4A, B). At the genus level, BSL separated from HFCS and SUC, but SUC and HFCS samples overlapped in the PCoA plots and had no differences in α-diversity indexes (Figure 5A, B). SIMPER analysis yielded a 24.8% average dissimilarity between HFCS and SUC, with 20 genera contributing to 80% of differences (Figure 5C). Lactobacillus, Prevotella, Streptococcus, [Prevotella], Catenibacterium, and Blautia showed the largest percentage contribution to dissimilarity between HFCS and SUC, whereas Prevotella, CF232, Parabacteroides, and Bifibacterium were the best discriminators, because their ratios of average dissimilarity to its SD were the highest (Figure 5C). Compared with SUC, HFCS increased average percentage relative counts of Catenibacterium (P ≤ 0.01) and decreased Streptococcus (P ≤ 0.05) and Bifidobacterium (P ≤ 0.05) (Supplemental Table 3). Blautia was positively correlated with relative liver weight (P ≤ 0.01) and blood concentrations of TAGs and leptin (P ≤ 0.05), and inversely correlated with lean mass (P ≤ 0.01) (Supplemental Figure 5A). Conversely, Parabacteroides, Treponema, and Streptococcus were negatively correlated with relative liver weight (P ≤ 0.01), TAGs (P ≤ 0.05), and leptin concentrations (P ≤ 0.05), and positively correlated with lean mass (P ≤ 0.05) (Supplemental Figure 5A). None of the genera were significantly correlated with hepatic fat accumulation and fasting insulin concentrations in blood.
FIGURE 4.
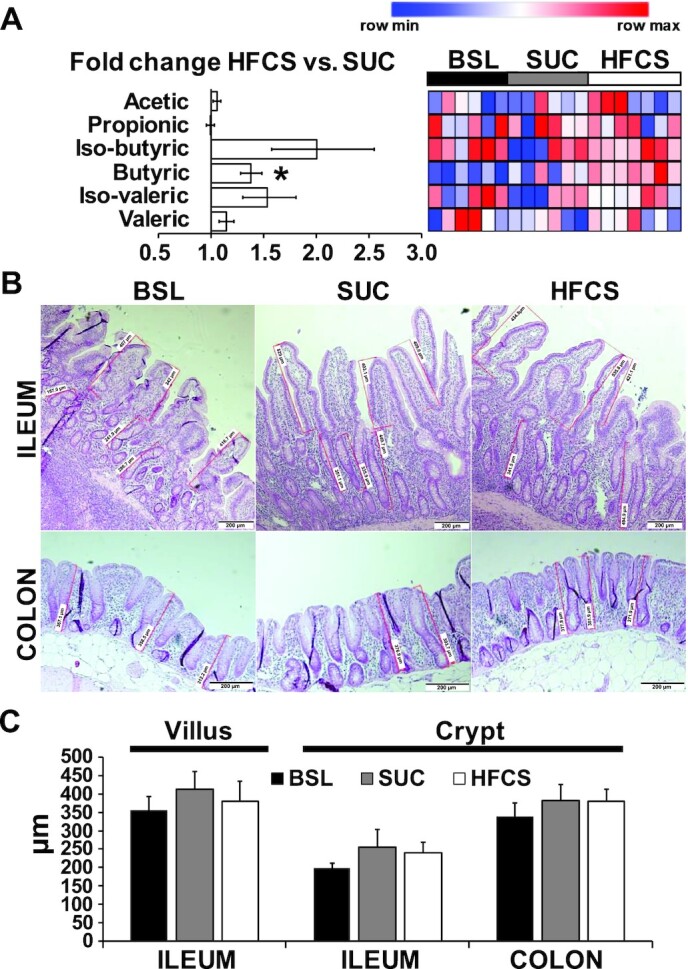
Inclusion of high-fructose corn syrup (HFCS) in a hypercaloric diet increased colonic concentrations of butyric acid in juvenile Iberian pigs compared with a sucrose-enriched diet (SUC). (A) Heatmap of SCFAs in colon digesta of baseline (BSL; n = 3 pens), SUC (n = 3 pens), and HFCS (n = 4 pens) pigs quantified by GC, with fold change and significance levels by HFCS compared with SUC (*P ≤ 0.05). Heatmap columns are individual pigs and rows are log2-transformed metabolites. Blue and red colors represent the row minimum and maximum values. Identification of significant SCFAs was performed by 1-factor ANOVA and a mixed model that included diet as fixed effect, and pen nested in diet as random effect. (B) Representative microscopy images of distal ileum and colon samples from juvenile Iberian pig stained with hematoxylin-eosin (H&E), showing measurements of villi length and crypt depth in the mucosa (scale bars, 200 μm). H&E stains were examined using an optical microscope (Axioscop 40; Zeiss) fitted with a camera (AxioCam MRc; Zeiss) and the images were analyzed using image analysis software (Axiovision SE64 4.7.1; Zeiss). Four fields of view per sample were captured with a final magnification of 40×, and the height and depth of every well-oriented villus and crypt, respectively, were measured in micrometers and used to calculate an average value for each intestinal segment of each pig. A villus was deemed well oriented if it was visible from the apex of the villus to the base, whereas well-oriented crypts were adjacent to villi and visible from the luminal opening to the bottom of the crypt. (C) Quantitative analysis of villus length and crypt depth in distal ileum and colon samples. Data were analyzed using 1-factor ANOVA and presented as means ± SDs.
FIGURE 5.
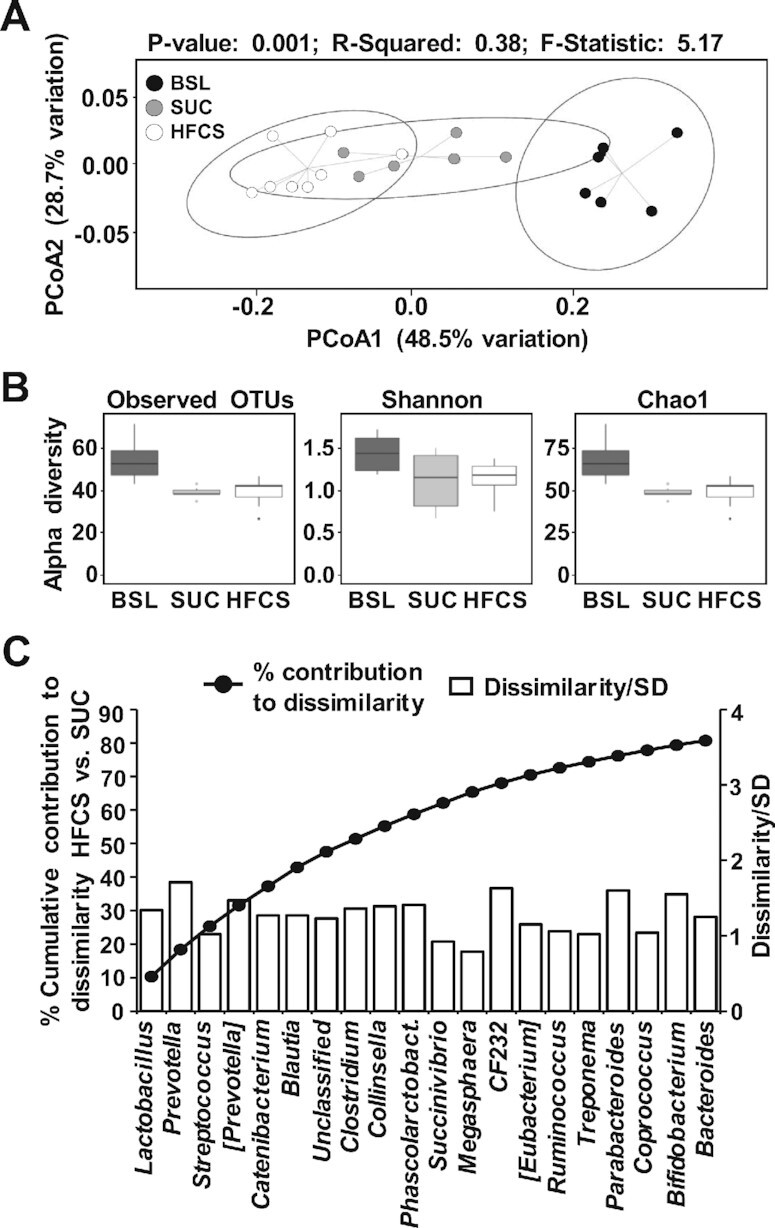
Microbiome dissimilarity between high-fructose corn syrup (HFCS) and sucrose (SUC) colon samples was associated with changes in SCFA-producing bacteria. (A) Principal coordinate analysis of Bray–Curtis dissimilarity matrix on taxa at the genus level obtained by 16S rRNA gene amplification of the V4 region in colon content samples from baseline (BSL; n = 3 pens), SUC (n = 3 pens), and HFCS (n = 4 pens). Each point represents an individual pig and color of point denotes diet. Permutational ANOVA results including P value, R2, and F-statistic were calculated using the compare_categories.py script available in QIIME. (B) Observed OTUs, Shannon and Chao1 indices of α diversity at the genus level were computed using the core_diversity_analyses.py script, with a rarefaction of 98,767 counts/sample. (C) Cumulative percentage contribution of genera to dissimilarity between HFCS and SUC (left y axis), and their corresponding ratio of average dissimilarity to its SD (right y axis) were computed using a similarity percentage analysis with 80% cut-off value. OTU, operational taxonomic unit; PCoA, principal coordinate analysis; Phascolarctobact, Phascolarctobacterium; QIIME, Quantitative Insights Into Microbial Ecology.
Functional profiles of bacteria in colon predicted that bacteria in HFCS-fed pigs might have enhanced “β-alanine metabolism” (P ≤ 0.01), “methane metabolism” (P ≤ 0.05), “cell division” (P ≤ 0.05), “biotin metabolism” (P ≤ 0.05), “lysine biosynthesis” (P ≤ 0.05), “thiamine metabolism” (P ≤ 0.05), and “polyketide sugar unit biosynthesis” (P ≤ 0.05) (Supplemental Figure 5B). Conversely, “ion channels” (P ≤ 0.05), “caprolactam degradation” (P ≤ 0.05), and “cysteine and methionine metabolism” (P ≤ 0.05) were lower in HFCS compared with SUC.
Discussion
Clinical studies have linked excessive fructose consumption to NAFLD in children (12, 15). However, whether the severity of liver injury is affected by the consumption of fructose in the form of sucrose or HFCS in the diet has not been investigated in pediatric populations. By using a pig model of pediatric NAFLD, we demonstrate here that feeding a low-fat hypercaloric diet enriched in sucrose or HFCS for 16 wk to juvenile Iberian pigs caused overt obesity and hyperleptinemia when compared with pigs fed a low-calorie, low-sugar diet, but only minimal steatosis. Furthermore, histological and serum markers of liver injury did not differ between SUC and HFCS groups. Importantly, obesity increases the risk of NAFLD in children (9, 10), and therefore the hepatic steatosis observed in our animals cannot be attributed solely to a diet-induced effect in the liver, but also to the increased BW gain in HFCS- and SUC-fed pigs. Findings in the present study agree with previous reports in adults comparing eucaloric diets enriched either in sucrose or HFCS (21, 22), as well as eucaloric and hypercaloric diets supplemented with glucose- or fructose-sweetened beverages (45, 46). It should be noted that studies to date, including ours, comparing the effect of dietary sugars in NAFLD have been limited in duration (i.e., 10–16 wk), and longer studies could be needed to elicit a more dramatic increase in hepatic fat content or to observe differences among sugar sources. Maersk et al. (19) observed a 30–40% increase in hepatic fat infiltration in healthy individuals following a 6-mo intake of 1 L/d sucrose-sweetened soft drinks. Alternatively, it is possible that severe fat accumulation/inflammation in the liver can only be observed when excess sugar intake is combined with a high-fat diet. We have previously shown evidence of hepatomegaly, a 10-fold increase in hepatic TAG accumulation, and nonalcoholic steatohepatitis in >80% of juvenile Iberian pigs fed a high-fat, high-fructose hypercaloric diet starting at 10 d of age for 10 wk (27). Similarly, Sobrecases et al. (47) demonstrated a greater increase in liver fat accumulation in response to 7-d hypercaloric diets enriched with saturated fat compared with fructose.
Given the comparable sugar, fat, and total caloric content between diets, the differences in subcutaneous fat and lean mass suggest that the higher fructose consumption provided by HFCS increased lipogenesis in the juvenile pigs. Previous clinical studies in obese and overweight adults have shown a postprandial upregulation of hepatic de novo lipogenesis, hypertriglyceridemia, and increased visceral adipose volume following 10-wk intake of fructose- but not glucose-sweetened beverages (14). Short-term high-fructose intake was also associated with increased de novo lipogenesis in healthy men fed weight-maintaining diets (4), whereas a 4-wk hypercaloric diet supplemented with an extra 600 kcal/d added either as fructose or glucose increased fasting TAG concentrations only in the fructose-fed group (46). Consistent with these studies, several TAG species increased in plasma of HFCS- compared with SUC-fed pigs, possibly due to an overproduction of VLDLs in response to the elevated fructose intake (14, 48, 49). In addition, HFCS decreased short-chain acylcarnitines in the liver, likely by a reduction of lipolysis and β-oxidation flux (50, 51). Interestingly, the increase in subcutaneous fat thickness over the loin in HFCS-fed pigs was not paralleled by changes in intramuscular and intrahepatic fat between diets, suggesting that fructose-induced lipid accumulation occurs mainly in adipose tissue. Because ectopic fat deposition in muscle and liver fat contributes to insulin resistance (52, 53), this finding can also explain the fact that neither fasting insulin concentration nor hepatic activation of PKB, AMPK, and mTOR, which are essential components in the insulin-regulated lipogenic pathway (54), differed between HFCS- and SUC-fed pigs.
In vivo tracing studies using labeled glucose in pigs have shown that the metabolic conversion of sugar carbons into TAGs takes place mostly in the adipose tissue (55, 56). However, when SCFA acetate is used as a substrate, the contribution of the liver to de novo lipogenesis is significantly increased (55). Therefore, conditions leading to extensive hindgut fermentation, such as fructose malabsorption (57, 58), might increase SCFA flux into the liver and upregulate hepatic de novo lipogenesis leading to steatosis (59, 60). In this regard, HFCS increased butyrate concentrations in colon digesta, and promoted compositional shifts in colonic microbiota consistent with enhanced SCFA production, possibly increasing the pig's capability to harvest energy from the gut (61, 62). For instance, Catenibacterium, an anaerobe that utilizes glucose to produce acetic, lactic, butyric, and isobutyric acids (63, 64), and is abundant in insulin-resistant morbidly obese patients (65), was significantly increased in HFCS-fed pigs compared with SUC-fed pigs. Blautia, which utilizes carbohydrates to produce acetic acid, lactic acid, and ethanol (66), and has been linked to BMI and diabetes in patients (67, 68), and to SCFA production in pigs (63), was also enriched in HFCS pigs and positively correlated with relative liver weight, hypertriglyceridemia, and hyperleptinemia. Moreover, functional profiles of the microbiome in the colon predicted that bacteria in HFCS-fed pigs might have enhanced “β-alanine metabolism” and “methane metabolism” pathways, which are associated with obesity (69, 70), as well as “lysine biosynthesis,” an essential amino acid that can be used by anaerobic bacteria for the synthesis of butyrate (71).
Dietary fructose intake and intravenous infusion of a fructose bolus have been associated with impaired hepatic energy metabolism in obese patients with type 2 diabetes (72). Unlike glycolysis, the rapid initial steps of fructose metabolism in the liver cause a drop in the ATP/AMP ratio by trapping inorganic phosphate required for ATP resynthesis (73, 74). In turn, ATP deficiency can increase the vulnerability of hepatocytes to injury (72, 75), and increases the risk of NAFLD development or progression (72, 76). In this regard, our metabolomic analysis showed a decrease in UMP in HFCS livers compared with SUC, indicative of pyrimidine degradation in response to ATP depletion (77, 78). Because UTP is produced by UDP phosphorylation using ATP as a phosphate donor, a decrease in ATP concentration decreases the phosphorylation of UDP to UTP, promoting the degradation of uracil nucleotides (77, 78). A fructose-induced ATP depletion could also have led to the dysregulation of the urea cycle, causing the decrease in creatinine and blood urea nitrogen in HFCS- compared with SUC-fed pigs (79).
In conclusion, we have demonstrated that a 16-wk hypercaloric diet supplemented with HFCS increased colonic butyrate synthesis, circulating TAGs, and lipid deposition in subcutaneous tissue without increasing the severity of NAFLD when compared with a sucrose-enriched diet. Given that accumulation of adipose tissue and hypertriglyceridemia are predisposing factors for pediatric NAFLD, longer studies are needed to elucidate whether the severity of NAFLD in children is associated with the type of dietary sugar consumed. Furthermore, when compared with our previous work, this study suggests that the dominant dietary ingredient that causes NAFLD appears to be excessive fat rather than sugar. The metabolic mechanisms that explain the relative influence of excessive dietary fat and different types of fat compared with sugar on NAFLD warrant further study.
Supplementary Material
ACKNOWLEDGEMENTS
We thank the Animal Science Department for making available the Veterinary Clinic and Animal Facilities, and Susan Tonik, Manuel Murga, Sergio Marsal, Beth Reynolds, Catherine Johnson, and Kayla Dillard for their technical assistance.
The authors’ responsibilities were as follows––MM, MSE, DGB, BH, and RM: designed research; MM, BH, PAT, GVH, VAS, and RM: conducted research; RM, RKF, HSG, DGB, TMS-R, and MRLF: analyzed samples or performed statistical analysis; RM and MM: wrote the paper; and all authors: read and approved the final manuscript.
Notes
This work was supported by the California State University Agriculture Research Institute (grants 58873 and 58913), California Polytechnic State University internal funding programs Baker/Koob, RSCA, FROST, and STRIDE, the USDA Agricultural Research Service grant 3092-51000-060-01, grants from the National Institutes of Health Grant DK-094616, and the Texas Medical Center Digestive Diseases Center (NIH Grant P30 DK-56338), BiOWiSH Technologies, Hilmar Ingredients, and Acorn Seekers.
Author disclosures: The authors report no conflicts of interest.
Supplemental Tables 1–3, Supplemental Figures 1–5, and Supplemental File 1 are available from the “Supplementary data” link in the online posting of the article and from the same link in the online table of contents at http://academic.oup.com/jn.
Abbreviations used: AMPKα, 5'-AMP-activated protein kinase α; BSL, baseline; BW, body weight; DI, distal ileum; FDR, false discovery rate; HFCS, high-fructose corn syrup–enriched diet; KEGG, Kyoto Encyclopedia of Genes and Genomes; mTOR, mammalian target of rapamycin; NAFLD, nonalcoholic fatty liver disease; OTU, operational taxonomic unit; PCoA, principal coordinate analysis; PICRUSt, Phylogenetic Investigation of Communities by Reconstruction of Unobserved States; PKB, protein kinase B; QIIME, Quantitative Insights Into Microbial Ecology; SDS, sodium dodecyl sulfate; SIMPER, similarity percentage procedure; SUC, sucrose-enriched diet; TAG, triacylglyceride.
Contributor Information
Magdalena Maj, Biological Sciences Department, California Polytechnic State University, San Luis Obispo, CA, USA; Center for Applications in Biotechnology, California Polytechnic State University, San Luis Obispo, CA, USA.
Brooke Harbottle, Animal Science Department, California Polytechnic State University, San Luis Obispo, CA, USA.
Payton A Thomas, Animal Science Department, California Polytechnic State University, San Luis Obispo, CA, USA.
Gabriella V Hernandez, Animal Science Department, California Polytechnic State University, San Luis Obispo, CA, USA.
Victoria A Smith, Animal Science Department, California Polytechnic State University, San Luis Obispo, CA, USA.
Mark S Edwards, Animal Science Department, California Polytechnic State University, San Luis Obispo, CA, USA.
Rob K Fanter, College of Agriculture, Food and Environmental Sciences, California Polytechnic State University, San Luis Obispo, CA, USA; Center for Health Research, California Polytechnic State University, San Luis Obispo, CA, USA.
Hunter S Glanz, Statistics Department, California Polytechnic State University, San Luis Obispo, CA, USA.
Chad Immoos, Chemistry and Biochemistry Department, California Polytechnic State University, San Luis Obispo, CA, USA.
Douglas G Burrin, United States Department of Agriculture-Agricultural Research Services, Children's Nutrition Research Center, Section of Pediatric Gastroenterology, Hepatology, and Nutrition, Department of Pediatrics, Baylor College of Medicine, Houston, TX, USA.
Tasha M Santiago-Rodriguez, Diversigen, Inc., Houston, TX, USA.
Michael R La Frano, Center for Health Research, California Polytechnic State University, San Luis Obispo, CA, USA; Food Science and Nutrition Department, California Polytechnic State University, San Luis Obispo, CA, USA.
Rodrigo Manjarín, Animal Science Department, California Polytechnic State University, San Luis Obispo, CA, USA.
References
- 1. Schwimmer JB, Deutsch R, Kahen T, Lavine JE, Stanley C, Behling C. Prevalence of fatty liver in children and adolescents. Pediatrics. 2006;118(4):1388–93. [DOI] [PubMed] [Google Scholar]
- 2. Xanthakos S, Miles L, Bucuvalas J, Daniels S, Garcia V, Inge T. Histologic spectrum of nonalcoholic fatty liver disease in morbidly obese adolescents. Clin Gastroenterol Hepatol. 2006;4(2):226–32. [DOI] [PubMed] [Google Scholar]
- 3. Hudgins LC, Hellerstein M, Seidman C, Neese R, Diakun J, Hirsch J. Human fatty acid synthesis is stimulated by a eucaloric low fat, high carbohydrate diet. J Clin Invest. 1996;97(9):2081–91. [DOI] [PMC free article] [PubMed] [Google Scholar]
- 4. Schwarz JM, Linfoot P, Dare D, Aghajanian K. Hepatic de novo lipogenesis in normoinsulinemic and hyperinsulinemic subjects consuming high-fat, low-carbohydrate and low-fat, high-carbohydrate isoenergetic diets. Am J Clin Nutr. 2003;77(1):43–50. [DOI] [PubMed] [Google Scholar]
- 5. Kang H, Greenson JK, Omo JT, Chao C, Peterman D, Anderson L, Foess-Wood L, Sherbondy MA, Conjeevaram HS. Metabolic syndrome is associated with greater histologic severity, higher carbohydrate, and lower fat diet in patients with NAFLD. Am J Gastroenterol. 2006;101(10):2247–53. [DOI] [PubMed] [Google Scholar]
- 6. Solga S, Alkhuraishe AR, Clark JM, Torbenson M, Greenwald A, Diehl AM, Magnuson T. Dietary composition and nonalcoholic fatty liver disease. Dig Dis Sci. 2004;49(10):1578–83. [DOI] [PubMed] [Google Scholar]
- 7. Faeh D, Minehira K, Schwarz JM, Periasamy R, Park S, Tappy L. Effect of fructose overfeeding and fish oil administration on hepatic de novo lipogenesis and insulin sensitivity in healthy men. Diabetes. 2005;54(7):1907–13. [DOI] [PubMed] [Google Scholar]
- 8. Schwarz JM, Noworolski SM, Wen MJ, Dyachenko A, Prior JL, Weinberg ME, Herraiz LA, Tai VW, Bergeron N, Bersot TPet al. Effect of a high-fructose weight-maintaining diet on lipogenesis and liver fat. J Clin Endocrinol Metab. 2015;100(6):2434–42. [DOI] [PMC free article] [PubMed] [Google Scholar]
- 9. Schwimmer JB, Deutsch R, Rauch JB, Behling C, Newbury R, Lavine JE. Obesity, insulin resistance, and other clinicopathological correlates of pediatric nonalcoholic fatty liver disease. J Pediatr. 2003;143(4):500–5. [DOI] [PubMed] [Google Scholar]
- 10. Dâmaso AR, do Prado WL, de Piano A, Tock L, Caranti DA, Lofrano MC, Carnier J, Cristofalo DJM, Lederman H, Tufik Set al. Relationship between nonalcoholic fatty liver disease prevalence and visceral fat in obese adolescents. Dig Liver Dis. 2008;40(2):132–9. [DOI] [PubMed] [Google Scholar]
- 11. Welsh JA, Karpen S, Vos MB. Increasing prevalence of nonalcoholic fatty liver disease among United States adolescents, 1988–1994 to 2007–2010. J Pediatr. 2013;162(3):496–500. [DOI] [PMC free article] [PubMed] [Google Scholar]
- 12. Vos MB, Kimmons JE, Gillespie C, Welsh J, Blanck HM. Dietary fructose consumption among US children and adults: the Third National Health and Nutrition Examination Survey. Medscape J Med. 2008;10(7):160. [PMC free article] [PubMed] [Google Scholar]
- 13. Schwarz JM, Noworolski SM, Wen MJ, Dyachenko A, Prior JL, Weinberg ME, Herraiz LA, Tai VW, Bergeron N, Bersot Tet al. Effect of a high-fructose weight-maintaining diet on lipogenesis and liver fat. J Clin Endocrinol Metab. 2015;100(6):2434–42. [DOI] [PMC free article] [PubMed] [Google Scholar]
- 14. Stanhope KL, Schwarz JM, Keim NL, Griffen SC, Bremer AA, Graham JL, Hatcher B, Cox CL, Dyachenko A, Zhang Wet al. Consuming fructose-sweetened, not glucose-sweetened, beverages increase visceral adiposity and lipids and decreases insulin sensitivity in overweight/obese humans. J Clin Invest. 2009;119(5):1322–34. [DOI] [PMC free article] [PubMed] [Google Scholar]
- 15. Schwarz JM, Noworolski SM, Erkin-Cakmak A, Korn NJ, Wen MJ, Tai VW, Jones GM, Palii SP, Velasco-Alin M, Pan Ket al. Effects of dietary fructose restriction on liver fat, de novo lipogenesis, and insulin kinetics in children with obesity. Gastroenterology. 2017;153(3):743–52. [DOI] [PMC free article] [PubMed] [Google Scholar]
- 16. White JS. Challenging the fructose hypothesis: new perspectives on fructose consumption and metabolism. Adv Nutr. 2013;4(2):246–56. [DOI] [PMC free article] [PubMed] [Google Scholar]
- 17. Coca Cola Freestyle Dispenser User's Manual. The Coca-Cola Company; 2010. pp.4, 13. Retrieved 12 August 2016. [Internet] [Cited 2021 Jan 30]. Available from: https://fccid.io/document.php?id=1255893. [Google Scholar]
- 18. Ventura EE, Davis JN, Goran MI. Sugar content of popular sweetened beverages based on objective laboratory analysis: focus on fructose content. Obesity (Silver Spring). 2011;19(4):868–74. [DOI] [PubMed] [Google Scholar]
- 19. Maersk M, Belza A, Stødkilde-Jørgensen H, Ringgaard S, Chabanova E, Thomsen H, Pedersen SB, Astrup A, Richelsen B. Sucrose-sweetened beverages increase fat storage in the liver, muscle, and visceral fat depot: a 6-mo randomized intervention study. Am J Clin Nutr. 2012;95(2):283–9. [DOI] [PubMed] [Google Scholar]
- 20. Le MT, Frye RF, Rivard CJ, Cheng J, McFann KK, Segal MS, Johnson RJ, Johnson JA. Effects of high-fructose corn syrup and sucrose on the pharmacokinetics of fructose and acute metabolic and hemodynamic responses in healthy subjects. Metabolism. 2012;61(5):641–51. [DOI] [PMC free article] [PubMed] [Google Scholar]
- 21. Bravo S, Lowndes J, Sinnett S, Yu Z, Rippe J. Consumption of sucrose and high-fructose corn syrup does not increase liver fat or ectopic fat deposition in muscles. Appl Physiol Nutr Metab. 2013;38(6):681–8. [DOI] [PubMed] [Google Scholar]
- 22. Lowndes J, Sinnett S, Pardo S, Nguyen VT, Melanson KJ, Yu Z, Lowther BE, Rippe JM. The effect of normally consumed amounts of sucrose or high fructose corn syrup on lipid profiles, body composition and related parameters in overweight/obese subjects. Nutrients. 2014;6(3):1128–44. [DOI] [PMC free article] [PubMed] [Google Scholar]
- 23. Nier A, Brandt A, Conzelmann IB, Özel Y, Bergheim I. Non-alcoholic fatty liver disease in overweight children: role of fructose intake and dietary pattern. Nutrients. 2018;10(9):1329. [DOI] [PMC free article] [PubMed] [Google Scholar]
- 24. Wehmeyer MH, Zyriax BC, Jagemann B, Roth E, Windler E, Schulze Zur Wiesch J, Lohse AW, Kluwe J. Nonalcoholic fatty liver disease is associated with excessive calorie intake rather than a distinctive dietary pattern. Medicine (Baltimore). 2016;95(23):e3887. [DOI] [PMC free article] [PubMed] [Google Scholar]
- 25. Spurlock ME, Gabler NK. The development of porcine models of obesity and the metabolic syndrome. J Nutr. 2008;138(2):397–402. [DOI] [PubMed] [Google Scholar]
- 26. Torres-Rovira L, Astiz S, Caro A, Lopez-Bote C, Ovilo C, Pallares P, Perez-Solana ML, Sanchez-Sanchez R, Gonzalez-Bulnes A. Diet-induced swine model with obesity/leptin resistance for the study of metabolic syndrome and type 2 diabetes. Scientific World Journal. 2012;2012:510149. [DOI] [PMC free article] [PubMed] [Google Scholar]
- 27. Hernandez GV, Smith VA, Melnyk M, Burd MA, Sprayberry KA, Edwards MS, Peterson DG, Bennet DC, Fanter RK, Columbus DAet al. Dysregulated FXR-FGF19 signaling and choline metabolism is associated with gut dysbiosis and hyperplasia in a novel pig model of pediatric NASH. Am J Physiol Liver Physiol. 2020;318(3):G582–609. [DOI] [PMC free article] [PubMed] [Google Scholar]
- 28. Óvilo C, Fernández A, Noguera JL, Barragán C, Letón R, Rodríguez C, Mercadé A, Alves E, Folch JM, Varona Let al. Fine mapping of porcine chromosome 6 QTL and LEPR effects on body composition in multiple generations of an Iberian by Landrace intercross. Genet Res. 2005;85(1):57–67. [DOI] [PubMed] [Google Scholar]
- 29. Fernández-Fígares I, Lachica M, Nieto R, Rivera-Ferre MG, Aguilera JF. Serum profile of metabolites and hormones in obese (Iberian) and lean (Landrace) growing gilts fed balanced or lysine deficient diets. Liv Sci. 2007;110:73–81. [Google Scholar]
- 30. Zeltser N, Meyer I, Hernandez GV, Trahan MJ, Fanter RK, Ismail MA, Glanz H, Strand CR, Burrin DG, La Frano MRet al. Neurodegeneration in juvenile Iberian pigs with diet-induced non-alcoholic fatty liver disease. Am J Physiol Endocrinol Metab. 2020;319(3):E592–606. [DOI] [PMC free article] [PubMed] [Google Scholar]
- 31. National Research Council . Nutrient requirements of swine, 10th rev. ed. Washington (DC): National Academies Press; 1998. [Google Scholar]
- 32. De Blas C, Gasa J, Mateos GG. Necesidades nutricionales para ganado porcino: normas FEDNA. (2ª edición)[Internet]. Universidad Politécnica de Madrid and Universidad Autónoma de Barcelona. [Cited 2020 Jan 8]. Available from: http://www.fundacionfedna.org/sites/default/files/Normas%20PORCINO_2013rev2_0.pdf. [Google Scholar]
- 33. US Department of Agriculture, Agricultural Research Service. FoodData Central. Sugars granulated [Internet]. [Cited 2020 Sep 30]. Available from: https://fdc.nal.usda.gov/fdc-app.html#/food-details/746784/nutrients. [Google Scholar]
- 34. US Department of Agriculture, Agricultural Research Service. FoodData Central. Syrups, corn, high fructose [Internet]. [Cited 2020 Sep 30]. Available from: https://fdc.nal.usda.gov/fdc-app.html#/food-details/169659/nutrients. [Google Scholar]
- 35. Burson D. Procedures for estimating pork carcass composition. [Internet]. US Pork Center of Excellence. [Cited 2020 Jan 1]. Available from: https://alec.unl.edu/documents/cde/2017/livestock-management/2017-procedures-for-estimating-pork-carcass-composition-2006.pdf [Google Scholar]
- 36. Al-Ghalith GA, Knights D. BURST enables optimal exhaustive DNA alignment for big data. [Internet]. GitHub; 2017. [Cited 2020 Aug 10]. Available from: https://github.com/knights-lab/burst [Google Scholar]
- 37. Kanehisa M, Goto S. KEGG: Kyoto Encyclopedia of Genes and Genomes. Nucleic Acids Res. 2000;28(1):27–30. [DOI] [PMC free article] [PubMed] [Google Scholar]
- 38. Zaneveld J, Caporaso JG, McDonald D, Knights D, Reyes JA, Clemente JC, Burkepile DE, Thurber RLV, Knight R, Beiko Ret al. Predictive functional profiling of microbial communities using 16S rRNA marker gene sequences. Nat Biotechnol. 2013;31(9):814–21. [DOI] [PMC free article] [PubMed] [Google Scholar]
- 39. Piepho HP. Data transformation in statistical analysis of field trials with changing treatment variance. Agron J. 2009;101:865–69. [Google Scholar]
- 40. Manjarin R, Maj M, La Frano M, Hunter G. PolyNova: a SAS macro for modelling fixed and random effects in factorial analysis of variance for metabolomics datasets. PLoS One 2020;. 15(12):e0244013. [DOI] [PMC free article] [PubMed] [Google Scholar]
- 41. Benjamini Y, Hochberg Y. Controlling the false discovery rate: a practical and powerful approach to multiple testing. J R Stat Soc B. 1995;57:289–300. [Google Scholar]
- 42. Caporaso JG, Kuczynski J, Stombaugh J, Bittinger K, Bushman FD, Costello EK, Fierer N, Peña AG, Goodrich JK, Gordon JIet al. QIIME allows analysis of high-throughput community sequencing data. Nat Methods. 2010;7(5):335–6. [DOI] [PMC free article] [PubMed] [Google Scholar]
- 43. R Core Team . Version R 3.6.2. for Windows. The R Project for Statistical Computing [Internet]. Available from: https://cran.r-project.org/bin/windows/base/old/3.6.2/ [Google Scholar]
- 44. Clarke KR. Non-parametric multivariate analyses of changes in community structure. Austral Ecol. 1993;18:117–43. [Google Scholar]
- 45. Johnston RD, Stephenson MC, Crossland H, Cordon SM, Palcidi E, Cox EF, Taylor MA, Aithal GP, Macdonald IA. No difference between high-fructose and high-glucose diets on liver triacylglycerol or biochemistry in healthy overweight men. Gastroenterology. 2013;145(5):1016–25.e2. [DOI] [PubMed] [Google Scholar]
- 46. Silbernagel G, Machann J, Unmuth S, Schick F, Stefan N, Häring HU, Fritsche A. Effects of 4-week very-high-fructose/glucose diets on insulin sensitivity, visceral fat and intrahepatic lipids: an exploratory trial. Br J Nutr. 2011;106(1):79–86. [DOI] [PubMed] [Google Scholar]
- 47. Sobrecases H, Lê KA, Bortolotti M, Schneiter P, Ith M, Kreis R, Boesch C, Tappy L. Effects of short-term overfeeding with fructose, fat and fructose plus fat on plasma and hepatic lipids in healthy men. Diabetes Metab. 2010;36(3):244–6. [DOI] [PubMed] [Google Scholar]
- 48. Adiels M, Olofsson SO, Taskinen MR, Borén J. Overproduction of very low-density lipoproteins is the hallmark of the dyslipidemia in the metabolic syndrome. Arterioscler Thromb Vasc Biol. 2008;28(7):1225–36. [DOI] [PubMed] [Google Scholar]
- 49. Sevastianova K, Santos A, Kotronen A, Hakkarainen A, Makkonen J, Silander K, Peltonen M, Romero S, Lundbom J, Lundbom N et al. Effect of short-term carbohydrate overfeeding and long-term weight loss on liver fat in overweight humans. Am J Clin Nutr. 2012;96(4):727–34. [DOI] [PubMed] [Google Scholar]
- 50. Hochuli M, Aeberli I, Weiss A, Hersberger M, Troxler H, Gerber PA, Spinas GA, Berneis K. Sugar-sweetened beverages with moderate amounts of fructose, but not sucrose, induce fatty acid synthesis in healthy young men: a randomized crossover study. J Clin Endocrinol Metab. 2014;99(6):2164–72. [DOI] [PubMed] [Google Scholar]
- 51. Schooneman MG, Ten Have GAM, van Vlies N, Houten SM, Deutz NEP, Soeters MR. Transorgan fluxes in a porcine model reveal a central role for liver in acylcarnitine metabolism. Am J Physiol Metab. 2015;309(3):E256–64. [DOI] [PubMed] [Google Scholar]
- 52. Jacob S, Machann J, Rett K, Brechtel K, Volk A, Renn W, Maerker E, Matthaei S, Schick F, Claussen CDet al. Association of increased intramyocellular lipid content with insulin resistance in lean nondiabetic offspring of type 2 diabetic subjects. Diabetes. 1999;48(5):1113–9. [DOI] [PubMed] [Google Scholar]
- 53. Samuel VT, Petersen KF, Shulman GI. Lipid-induced insulin resistance: unravelling the mechanism. Lancet. 2010;375(9733):2267–77. [DOI] [PMC free article] [PubMed] [Google Scholar]
- 54. Li S, Brown MS, Goldstein JL. Bifurcation of insulin signaling pathway in rat liver: mTORC1 required for stimulation of lipogenesis, but not inhibition of gluconeogenesis. Proc Natl Acad Sci U S A. 2010;107(8):3441–6. [DOI] [PMC free article] [PubMed] [Google Scholar]
- 55. O'Hea EK, Leveille GA. Significance of adipose tissue and liver as sites of fatty acid synthesis in the pig and the efficiency of utilization of various substrates for lipogenesis. J Nutr. 1969;99(3):338–44. [DOI] [PubMed] [Google Scholar]
- 56. Dunshea F, D'Souza D. Review: fat deposition and metabolism in the pig. In: PatersonJE,editor. Manipulating pig production IX: proceedings of the Ninth Biennial Conference of the Australasian Pig Science Association (APSA), Fremantle, W.A., November 23 to 26, 2003. Australasian Pig Science Association; 2003. p. 127–50. [Google Scholar]
- 57. Latulippe ME, Skoog SM. Fructose malabsorption and intolerance: effects of fructose with and without simultaneous glucose ingestion. Crit Rev Food Sci Nutr. 2011;51(7):583–92. [DOI] [PMC free article] [PubMed] [Google Scholar]
- 58. Wei X, Song M, Yin X, Schuschke DA, Koo I, McClain CJ, Zhang X. Effects of dietary different doses of copper and high fructose feeding on rat fecal metabolome. J Proteome Res. 2015;14(9):4050–8. [DOI] [PMC free article] [PubMed] [Google Scholar]
- 59. Liu H, Wang J, He T, Becker S, Zhang G, Li D, Ma X. Butyrate: a double-edged sword for health?. Adv Nutr. 2018;9(1):21–9. [DOI] [PMC free article] [PubMed] [Google Scholar]
- 60. van der Beek CM, Bloemen JG, van den Broek MA, Lenaerts K, Venema K, Buurman WA, Dejong CH. Hepatic uptake of rectally administered butyrate prevents an increase in systemic butyrate concentrations in humans. J Nutr. 2015;145(9):2019–24. [DOI] [PubMed] [Google Scholar]
- 61. Arslan N. Obesity, fatty liver disease and intestinal microbiota. World J Gastroenterol. 2014;20(44):16452–63. [DOI] [PMC free article] [PubMed] [Google Scholar]
- 62. Schwiertz A, Taras D, Schäfer K, Beijer S, Bos NA, Donus C, Hardt PD. Microbiota and SCFA in lean and overweight healthy subjects. Obesity (Silver Spring). 2010;18(1):190–5. [DOI] [PubMed] [Google Scholar]
- 63. Yan H, Potu R, Lu H, Vezzoni de Almeida V, Stewart T, Ragland D, Armstrong A, Adeola O, Nakatsu CH, Ajuwon KM. Dietary fat content and fiber type modulate hind gut microbial community and metabolic markers in the pig. PLoS One. 2013;8(4):e59581. [DOI] [PMC free article] [PubMed] [Google Scholar]
- 64. Kageyama A, Benno Y. Catenibacterium mitsuokai gen. nov., sp. nov., a gram-positive anaerobic bacterium isolated from human faeces. Int J Syst Evol Microbiol. 2000;50(4):1595–9. [DOI] [PubMed] [Google Scholar]
- 65. Moreno-Indias I, Sánchez-Alcoholado L, García-Fuentes E, Cardona F, Queipo-Ortuño MI, Tinahones FJ. Insulin resistance is associated with specific gut microbiota in appendix samples from morbidly obese patients. Am J Transl Res. 2016;8(12):5672–84. [PMC free article] [PubMed] [Google Scholar]
- 66. Liu C, Finegold SM, Song Y, Lawson PA. Reclassification of Clostridium coccoides, Ruminococcus hansenii, Ruminococcus hydrogenotrophicus, Ruminococcus luti, Ruminococcus productus and Ruminococcus schinkii as Blautia coccoides gen. nov., comb. nov., Blautia hansenii comb. nov., Blautia hydrogenotrophica comb. nov., Blautia luti comb. nov., Blautia producta comb. nov., Blautia schinkii comb. nov. and description of Blautia wexlerae sp. nov., isolated from human faeces. Int J Syst Evol Microbiol. 2008;58:1896–902. [DOI] [PubMed] [Google Scholar]
- 67. Del Chierico F, Abbatini F, Russo A, Quagliariello A, Reddel S, Capoccia D, Coccamo R, Corradini SG, Nobili V, De Peppo Fet al. Gut microbiota markers in obese adolescent and adult patients: age-dependent differential patterns. Front Microbiol. 2018;9:1210. [DOI] [PMC free article] [PubMed] [Google Scholar]
- 68. Ottosson F, Brunkwall L, Ericson U, Nilsson PM, Almgren P, Fernandez C, Melander O, Orho-Melander M. Connection between BMI-related plasma metabolite profile and gut microbiota. J Clin Endocrinol Metab. 2018;103(4):1491–501. [DOI] [PubMed] [Google Scholar]
- 69. Del Chierico F, Abbatini F, Russo A, Quagliariello A, Reddel S, Capoccia D, Caccamo R, Ginanni Corradini S, Nobili V, De Peppo Fet al. Gut microbiota markers in obese adolescent and adult patients: age-dependent differential patterns. Front Microbiol. 2018;9:1210. [DOI] [PMC free article] [PubMed] [Google Scholar]
- 70. Basseri RJ, Basseri B, Pimentel M, Chong K, Youdim A, Low K, Hwang L, Soffer E, Chang C, Mathur R. Intestinal methane production in obese individuals is associated with a higher body mass index. Gastroenterol Hepatol (N Y). 2012;8(1):22–8. [PMC free article] [PubMed] [Google Scholar]
- 71. Barker HA. Amino acid degradation by anaerobic bacteria. Annu Rev Biochem. 1981;50:23–40. [DOI] [PubMed] [Google Scholar]
- 72. Abdelmalek MF, Lazo M, Horska A, Bonekamp S, Lipkin EW, Balasubramanyam A, Bantle JP, Johnson RJ, Diehl AM, Clark JMet al. Higher dietary fructose is associated with impaired hepatic adenosine triphosphate homeostasis in obese individuals with type 2 diabetes. Hepatology. 2012;56(3):952–60. [DOI] [PMC free article] [PubMed] [Google Scholar]
- 73. Iles RA, Griffiths JR, Stevens AN, Gadian DG, Porteous R. Effects of fructose on the energy metabolism and acid-base status of the perfused starved-rat liver. A 31phosphorus nuclear magnetic resonance study. Biochem J. 1980;192(1):191–202. [DOI] [PMC free article] [PubMed] [Google Scholar]
- 74. Bode JC, Zelder O, Rumpelt HJ, Wittkamp U. Depletion of liver adenosine phosphates and metabolic effects of intravenous infusion of fructose or sorbitol in man and in the rat. Eur J Clin Invest. 1973;3(5):436–41. [DOI] [PubMed] [Google Scholar]
- 75. Chavin KD, Yang S, Lin HZ, Chatham J, Chacko VP, Hoek JB, Walajtzy-Rode E, Rashid A, Chen CH, Huang CCet al. Obesity induces expression of uncoupling protein-2 in hepatocytes and promotes liver ATP depletion. J Biol Chem. 1999;274(9):5692–700. [DOI] [PubMed] [Google Scholar]
- 76. Szendroedi J, Chmelik M, Schmid AI, Nowotny P, Brehm A, Krssak M, Moser E, Roden M. Abnormal hepatic energy homeostasis in type 2 diabetes. Hepatology. 2009;50(4):1079–86. [DOI] [PubMed] [Google Scholar]
- 77. Yamamoto T, Moriwaki Y, Takahashi S, Tsutsumi Z, Yamakita J, Higashino K. Effects of fructose and xylitol on the urinary excretion of adenosine, uridine, and purine bases. Metabolism. 1999;48(4):520–4. [DOI] [PubMed] [Google Scholar]
- 78. Yamamoto T, Moriwaki Y, Takahashi S, Yamakita J, Tsutsumi Z, Ohata H, Hiroishi K, Nakano T, Higashino K. Effect of ethanol and fructose on plasma uridine and purine bases. Metabolism. 1997;46(5):544–7. [DOI] [PubMed] [Google Scholar]
- 79. De Chiara F, Heebøll S, Marrone G, Montoliu C, Hamilton-Dutoit S, Ferrandez A, Andreola F, Rombouts K, Grønbæk H, Felipo V. Urea cycle dysregulation in non-alcoholic fatty liver disease. J Hepatol. 2018;69(4):905–15. [DOI] [PubMed] [Google Scholar]
Associated Data
This section collects any data citations, data availability statements, or supplementary materials included in this article.