

SUMMARY
The deleterious effects of psychological stress on mainstream T lymphocytes are well documented. However, how stress impacts innate-like T cells is unclear. We report that long-term stress surprisingly abrogates both T helper 1 (TH1)- and TH2-type responses orchestrated by invariant natural killer T (iNKT) cells. This is not due to iNKT cell death because these cells are unusually refractory to stress-inflicted apoptosis. Activated iNKT cells in stressed mice exhibit a “split” inflammatory signature and trigger sudden serum interleukin-10 (IL-10), IL-23, and IL-27 spikes. iNKT cell dysregulation is mediated by cell-autonomous glucocorticoid receptor signaling and corrected upon habituation to predictable stressors. Importantly, under stress, iNKT cells fail to potentiate cytotoxicity against lymphoma or to reduce the burden of metastatic melanoma. Finally, stress physically spares mouse mucosa-associated invariant T (MAIT) cells but hinders their TH1-/TH2-type responses. The above findings are corroborated in human peripheral blood and hepatic iNKT/MAIT cell cultures. Our work uncovers a mechanism of stress-induced immunosuppression.
In brief
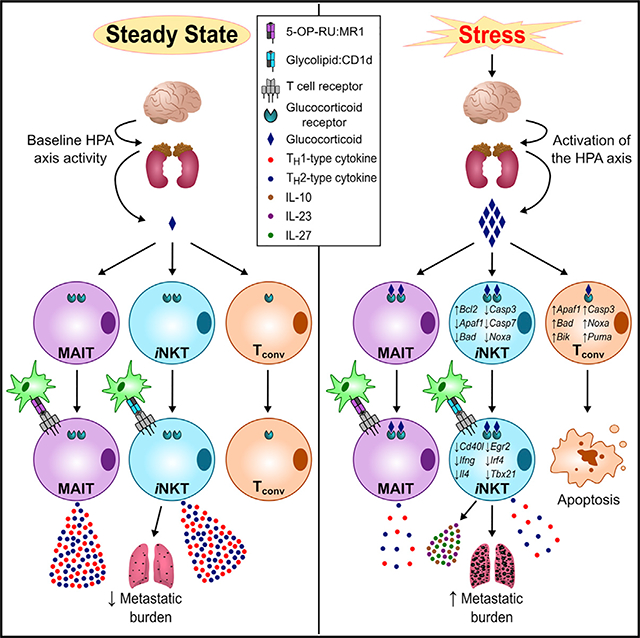
Invariant T cells are emergency responders to infection and cancer. Rudak et al. report that psychological stress unusually spares these innate-like T lymphocytes but alters or impairs their cytokine production and cytotoxic and/or antimetastatic capacities through a cell-autonomous, glucocorticoid receptor-dependent mechanism. This may explain certain aspects of stress-induced immunosuppression.
Graphical Abstract
INTRODUCTION
Long-term stress due to persistent negative emotions or repeated exposure to environmental stressors carries adverse immunological consequences (Glaser and Kiecolt-Glaser, 2005). Individuals experiencing greater relative levels of perceived stress mount weaker responses to vaccination and infection (Glaser and Kiecolt-Glaser, 2005). Stress has also been linked to cancer progression in animal models, often implicating diminished or dysregulated antitumor immunity (Kamiya et al., 2019; Kokolus et al., 2013; Partecke et al., 2016; Saul et al., 2005; Yang et al., 2019). According to prospective epidemiological studies, a higher degree of stress is associated with elevated incidences of neoplasia and cancer mortality in previously healthy individuals, and with poorer prognosis in cancer patients (Batty et al., 2017; Chida et al., 2008). Despite such findings, the mechanisms underlying stress-induced immunosuppression are ill defined.
A stress response is typically launched via the coordinated activation of the sympathetic nervous system (SNS) and the hypothalamic-pituitary-adrenal (HPA) axis (Glaser and Kiecolt-Glaser, 2005). Dense innervation of various organs by the SNS, including lymphoid tissues, enables targeted release of specific neurotransmitters into the extracellular milieu in which immune cells operate (Elenkov et al., 2000). Norepinephrine (NE), the most dominant neurotransmitter utilized by post-ganglionic sympathetic nerve termini, signals through α- and/or β-adrenergic receptors (Elenkov et al., 2000). Under profound sympathetic stimulation, NE is co-transmitted from large intraneuronal storage vesicles with neuropeptide Y (NPY) (Straub et al., 2000), which utilizes Y1, Y2, Y4, Y5, and Y6 receptors (Prod’homme et al., 2006). The activation of the HPA axis raises the circulating levels of glucocorticoids, which exert broad anti-inflammatory effects by binding to the glucocorticoid receptor (GR) encoded by Nr3c1 (Cain and Cidlowski, 2017). Stress-elicited defects in antimicrobial and antitumor immunity are often attributable to the operation of the SNS and/or the HPA axis (Pruett, 2003).
Previous studies on stress and immunity have focused heavily on conventional T (Tconv) cells (Calcagni and Elenkov, 2006). By inducing apoptosis in CD4+CD8+ thymocytes and mature Tconv cells, glucocorticoids shrink the size of T cell pools (Haeryfar and Berczi, 2001; Herold et al., 2006). Moreover, stress creates T helper 2 (TH2) bias (Calcagni and Elenkov, 2006), for instance by favoring interleukin-4 (IL-4) production in the context of ex vivo Tconv cell stimulation (Hu et al., 2014) or within tumor microenvironments (TMEs) (Hou et al., 2013). NE (Elenkov et al., 2000), NPY (Buttari et al., 2014), and glucocorticoids (Taves and Ashwell, 2020) have each been reported to permit or promote TH2-skewed phenotypes while inhibiting TH1-type responses.
To date, how psychological stress affects innate-like invariant T (iT) cells, including invariant natural killer T (iNKT) and mucosa-associated invariant T (MAIT) cells, has not been explored. This is a critical question given the remarkable immunomodulatory, cytotoxic, antitumor, antibacterial, and antiviral properties of these cells (Haeryfar and Mallevaey, 2015; Haeryfar et al., 2018; Lisbonne et al., 2004; Rudak et al., 2018; Zhang et al., 2019).
iNKT cells bear a CD1d-restricted, glycolipid-reactive, semi-invariant T cell receptor (iTCR), which contains a canonically rearranged α chain (Vα14-Jα18 in mice and Vα24-Jα18 in humans) paired with one of only few Vβ chain choices (Lantz and Bendelac, 1994). Activated iNKT cells swiftly produce copious quantities of TH1, TH2, and/or TH17 cytokines that shape ensuing immune responses (Matsuda et al., 2008). The prototypic glycolipid ligand of iNKT cells, α-galactosylceramide (αGC) (Kawano et al., 1997), prompts the transactivation of several effector cell types, including NK cells (Smyth et al., 2002), precursors to mature NK (pre-mNK) cells (Choi et al., 2019), and CD8+ Tconv cells (Nakagawa et al., 2004). Therefore, αGC and its analogs are pursued as potential therapeutics (Fujii and Shimizu, 2019; Matsuda et al., 2008).
MAIT cells too harbor iTCR α chains (typically Vα19-Jα33 in mice and Vα7.2-Jα33 in humans) and minimal Vβ chain diversity (Lepore et al., 2014; Rahimpour et al., 2015). They are abundant in human peripheral blood (PB) and strategically poised in the human liver, lungs, and mucosal layers (Dusseaux et al., 2011; Franciszkiewicz et al., 2016; Tang et al., 2013), the ports of entry for many pathogens and common sites of neoplastic transformation or metastatic growth. Upon stimulation with vitamin B intermediates of bacterial and fungal origin (e.g., 5-[2-oxopropylideneamino]-6-d-ribitylaminouracil; 5-OP-RU) (Corbett et al., 2014), certain drugs and drug-like metabolites (Keller et al., 2017; Kjer-Nielsen et al., 2012), and other compounds presented by major histocompatibility complex (MHC)-related protein 1 (MR1), MAIT cells quickly produce a wide array of inflammatory mediators, including TH1-, TH2-, and TH17-type cytokines (Kelly et al., 2019; Kurioka et al., 2017), and transactivate key downstream effectors (Salio et al., 2017). Although best known for their antimicrobial activities, MAIT cells may also play significant roles in various TMEs (Haeryfar et al., 2018; Yao et al., 2020). Both iNKT and MAIT cells can also respond to viral infections in a TCR-independent fashion, primarily through cytokines such as IL-12 and IL-18 (Tyznik et al., 2008; van Wilgenburg et al., 2016).
Here, we leveraged multiple mouse models of psychological stress as well as human cell culture systems to investigate the impact of stress on iT cell functions.
RESULTS
Psychological stress impairs the ability of iNKT cells to trigger IL-4 and IFN-γ production and forces them to promote an atypical systemic inflammatory signature
iNKT cells are unconventional, innate-like T cells with emergency response roles in antitumor and antimicrobial immunity (Fujii and Shimizu, 2019); yet, how stress shapes iNKT cell responses has been largely unknown.
We compared wild-type (WT) C57BL/6 (B6) mice that were left undisturbed or subjected to prolonged physical restraint (Figure 1A) for their in vivo IL-4 and interferon-γ (IFN-γ) responses to αGC (Figures 1A–1C). The primary source of IL-4 in response to this glycolipid are iNKT cells—hence, the rapidity with which they release this cytokine (Crowe et al., 2003). To our surprise, confinement stress resulted in dramatically reduced IL-4 levels (Figure 1B), which goes against the TH2 paradigm of stress and immunity (Calcagni and Elenkov, 2006; Hou et al., 2013; Hu et al., 2014). Peak IFN-γ levels were also similarly decreased in stressed animals (Figure 1C).
Figure 1. Prolonged stress impairs iNKT cells’ capacity to trigger IL-4 and IFN-γ production and potentiates an abnormal inflammatory response to glycolipid Ags.

(A) WT B6 mice were restrained for 12 h. Control animals remained undisturbed but were deprived of food and water. Mice subsequently received αGC, αCGC, or vehicle (Veh) i.p., or a combination of IL-12 and IL-18 i.v.
(B and C) At the indicated time points post-αGC injection, serum IL-4 (B) and IFN-γ (C) were quantified by ELISA (n = 10 per group).
(D and E) Two hours after αGC injection, IL-4+ and IFN-γ+ cell frequencies among hepatic (D) and splenic (E) TCRβ+PBS-57-loaded CD1d tetramer+ iNKT cells were determined by flow cytometry.
(F) Two, 12, and 24 h after αGC (or Veh) administration, serum cytokine levels were measured via multiplex assays, and average values (n = 3 per cohort) were used to generate a heatmap.
(G) Separate cohorts (n = 4) were injected with αCGC or Veh, and blood IL-4 and IFN-γ levels were measured by ELISA.
(H) Parallel cohorts received IL-12 and IL-18 and were sacrificed 1 h later for their livers and spleens, in which IFN-γ+ iNKT cell percentages were determined.
Each symbol in (D), (E), and (H) represents an individual mouse. Error bars represent SEM. *, **, ***, and **** denote differences with p < 0.05, p < 0.01, p < 0.001, and p < 0.0001, respectively, by two-way ANOVA with Dunnett’s correction (B, C, and G) or unpaired Student’s t tests (D, E, and H).
iNKT cells are not the only source of serum IFN-γ, which is also secreted by secondary effectors such as NK cells after αGC administration (Hayakawa et al., 2001; Smyth et al., 2002). To assess the impact of stress on IFN-γ production by iNKT cells, hepatic (Figure 1D) and splenic (Figure 1E) iNKT cells were identified via CD1d tetramer staining and examined for their intracellular cytokine content 2 h after αGC treatment. Consistent with serum cytokine results, far fewer iNKT cells from stressed mice generated IL-4 or IFN-γ (Figures 1D, 1E, and S1A). Furthermore, purified hepatic iNKT cells, which were sorted after restraint stress and exposed to αGC in co-cultures with CD11c+ bone-marrow-derived dendritic cells (BMDCs), were weak cytokine producers (Figure S1B). In contrast, upon ex vivo stimulation with phorbol 12-myristate 13-acetate (PMA) and ionomycin, iNKT cells from stressed animals demonstrated intact IL-4 and IFN-γ production capacities (Figure S1C). PMA and ionomycin work synergistically to activate protein kinase C and Ca2+/calmodulin-dependent kinases, resulting in T cell activation independently of TCR engagement (Chatila et al., 1989). Therefore, under stress, poor iNKT cell responses to cognate antigens (Ags) are likely due to impaired iTCR-proximal signaling events. We found splenic iNKT cells from stressed animals to express reduced levels of iTCR αβ, CD28, and inducible T cell costimulator (ICOS) (Figure S1D). These changes were accompanied by decreased phospho-SLP76 (pY128) levels and a trend toward diminished phospho-CD3ζ (pY142) and phospho-ZAP70 (pY319)/phospho-Syk (pY352) levels, but not phospho-Lck (pY505), in hepatic iNKT cells (data not shown).
Intrinsic host factors dictate or contribute to skewed cytokine responses in genetically diverse mammals. For instance, B6 and BALB/c mice are considered TH1- and TH2-dominant animals, respectively (Mills et al., 2000; Watanabe et al., 2004). Previous reports have suggested differences between these strains in terms of susceptibility to stress (Flint and Tinkle, 2001). However, similar to B6 mice, BALB/c mice that had been stressed before receiving αGC had lower blood IL-4 and IFN-γ levels (Figure S2A).
There is sexual dimorphism in sensitivity to various stressors (Buynitsky and Mostofsky, 2009). In addition, iNKT cell frequencies and cytokine profiles, including IL-4 and IFN-γ responses to αGC, may differ between males and females (Bernin et al., 2016; Gourdy et al., 2005). We found restraint stress to similarly reduce serum IL-4 and IFN-γ concentrations in both sexes (Figure S2B).
IL-4 and IFN-γ are classic TH2 and TH1 cytokines, respectively. However, numerous other cytokines and chemokines also participate in inflammatory processes. To more widely capture the iNKT cell response landscape amid prolonged stress, we performed multiplex analysis on serum samples collected 2, 12, and 24 h after treatment with αGC or vehicle. A multitude of cytokines, other than IL-4 and IFN-γ, were significantly reduced at one or several time points in the serum of stressed mice. These included IL-2, IL-5, IL-13, eotaxin, granulocyte-macrophage colony-stimulating factor (GM-CSF), IFN-γ-inducible protein 10 (IP-10)/CXCL10, monocyte chemoattractant protein-1 (MCP-1)/CCL2, RANTES/CCL5, and tumor necrosis factor α (TNF-α) (Figures 1F and S3). In our cytofluorimetric analyses, we confirmed diminished intracellular levels of IL-2, IL-5, and IL-13 in αGC-stimulated iNKT cells from stressed animals (Figures S1E–S1G). In contrast with the above mediators, IL-10, IL-23, and IL-27 became notably detectable at strikingly high quantities in animals that had been restrained (Figures 1F and S3). Furthermore, stress augmented the production of IL-1α, IL-1β, macrophage inflammatory protein-1α (MIP-1α)/CCL3, and MIP-3α/CCL20 in αGC-treated mice (Figures 1F and S3) and also resulted in a trend toward increased IL-17A levels at the 12-h time point (p = 0.075).
There were a number of cytokines whose serum levels were not different between stressed and control cohorts, including granulocyte colony-stimulating factor (G-CSF), IL-6, IL-7, IL-9, IL-15, IL-17E/IL-25, IL-17F, IL-21, IL-22, IL-28B/IFNL3, IL-31, IL-33, keratinocyte-derived chemokine (KC)/CXCL1, leukemia inhibitory factor (LIF), lipopolysaccharide-inducible CXC chemokine (LIX)/CXCL5, macrophage colony-stimulating factor (M-CSF), monokine induced by IFN-γ (MIG)/CXCL9, MIP-1β/CCL4, MIP-2/CXCL2, transforming growth factor β1 (TGF-β1), TGF-β2, TGF-β3, and vascular endothelial growth factor (VEGF) (Figure 1F and data not shown).
Taken together, our cytokine analyses indicate that iNKT cells defy the popular belief that stress indiscriminately steers all T cell responses toward a purely or heavily TH2-biased phenotype. Instead, iNKT cells display a mixed signature dominated by “select” pro- and anti-inflammatory cytokines. Even within the same general category, atypical patterns emerged. For example, whereas stress raised the levels of IL-1α and IL-1β after αGC injection, TNF-α was diminished and IL-6 remained unaltered.
Our multiplexing analyses did not include a 6-h time point post-αGC administration, at which IL-12 reaches its peak levels (Fujii et al., 2002). This was remedied in separate ELISAs in which a nearly 10-fold reduction in IL-12 was evident. To be exact, serum IL-12 levels were 4,355 ± 422 pg/mL and 403 ± 278 pg/mL in control and stressed animals, respectively. Given the prominent role of DCs in IL-12 production following in vivo iNKT cell activation (Blumenfeld et al., 2011; Fujii et al., 2006), we examined the frequency of IL-12+ DCs, which was significantly reduced in stressed mice that had received αGC 6 h earlier (Figure S1H). The above results are consistent with a “split mini-signature” even among classic pro-inflammatory cytokines.
Next, we determined whether stress alters iNKT cell responses to CD1d-binding glycolipids other than αGC. We found prolonged restraint (Figure 1A) to suppress cytokine responses triggered by α-C-galactosylceramide (αCGC), a TH1-polarizing analog of αGC that carries a single glycosidic O-to-CH2 substitution (Figure 1G) (Schmieg et al., 2003). To ascertain whether stress compromises CD1d/iTCR-independent, cytokine-driven iNKT cell responses, we used a combination of IL-12 and IL-18, which enables NK cells and innate-like T cells to produce IFN-γ (Velázquez et al., 2008). Therefore, we subjected mice to restraint before injecting them with IL-12 and IL-18 (Figure 1A). Both hepatic and splenic iNKT cells from stressed mice failed to produce IFN-γ in this setting (Figure 1H). Similarly, NK cells from a stressed cohort were unable to mount an optimal IFN-γ response to IL-12 and IL-18 (Figure S1I).
Collectively, prolonged psychological stress abrogates IL-4 and IFN-γ responses that are either elicited or potentiated by αGC-exposed iNKT cells. This finding appears reproducible across different genetic backgrounds in both sexes and irrespective of iNKT cells’ tissue location and activation mode. The mixed inflammatory signature observed in stressed animals represents a stark contrast with TH2-polarized Tconv responses.
Unlike other lymphocyte subsets, iNKT cells are refractory to stress- and glucocorticoid-induced apoptosis
Mediators of stress disrupt certain defense mechanisms by inducing apoptosis in lymphocytes (Herold et al., 2006; Tseng et al., 2005; Yin et al., 2000). As expected, non-parenchymal hepatic mononuclear cell (HMNC) and splenocyte counts were significantly lower in stressed mice than in controls immediately after restraint (2.2 × 10⁶ ± 0.2 × 10⁶ versus 3.5 × 10⁶ ± 0.3 × 10⁶ for HMNCs; 54.7 × 10⁶ ± 7.8 × 10⁶ versus 77.6 × 10⁶ ± 6.3 × 10⁶ for splenocytes; n = 6 per group) and also 2 h after αGC administration (1.2 × 10⁶ ± 0.1 × 10⁶ versus 2.3 × 10⁶ ± 0.1 × 10⁶ for HMNCs; 33.2 × 10⁶ ± 7.0 × 10⁶ versus 62.0 × 10⁶ ± 8.3 × 10⁶ for splenocytes; n = 5 per group). Therefore, because physical restraint impeded IL-4 and IFN-γ responses to αGC (Figure 1), we asked whether cytokine-producing cells had simply died. We found increases, rather than decreases, in hepatic and splenic iNKT cell frequencies in stressed mice (Figure 2A). This was curious because Ki67+ iNKT cell frequencies were similar between stressed and control animals (30.3% ± 6.7% versus 27.0% ± 3.0% for hepatic iNKT cells; 17.6% ± 3.3% versus 21.7% ± 5.3% for splenic iNKT cells; n = 4 per group), dismissing the possibility that iNKT cells had undergone expeditious proliferation during stress. Our finding that iNKT cells’ absolute numbers remained stable in contrast with marked drops in Tconv cell numbers (Figure 2B) suggested that iNKT cells were insensitive to stress-provoked apoptosis. This was validated by measuring the intracellular active caspase content of these cells (Figure 2C).
Figure 2. Unlike Tconv cells, iNKT cells are resistant to glucocorticoid-induced apoptosis.

(A) WT B6 mice were left undisturbed or restrained for 12 h, after which HMNCs and splenocytes were harvested and stained with a monoclonal antibody (mAb) to TCRβ along with empty (control) or PBS-57-loaded CD1d tetramers. Representative dot plots and summary data depict hepatic and splenic iNKT cell frequencies in stressed and control mice.
(B) The absolute numbers of iNKT and TCRβ+PBS-57-loaded CD1d tetramer− Tconv cells were also calculated.
(C) In addition, the percentages of iNKT and Tconv cells containing active caspases were determined by flow cytometry.
(D) Hepatic iNKT and Tconv cells were purified from ≥5 mice that had been either subjected to 2, 6, or 12 h of restraint stress or left undisturbed. After obtaining cDNA, the indicated gene products were amplified by quantitative PCR. Gene expression fold changes in iNKT and Tconv cells isolated from stressed mice relative to corresponding cell populations from control animals were calculated using the 2−(ΔΔCt) method and used to generate a heatmap.
(E) Hepatic iNKT and Tconv cells were analyzed for their intracellular Bcl-2 content.
(F) Hepatic Tconv cells were enumerated in Nr3c1fl and Nr3c1flLckcre mice that had been either restrained or left undisturbed.
(G) Cohorts of WT B6 mice were given corticosterone (CS) or Veh in drinking water for 21 days before they were sacrificed for their livers and spleens, in which iNKT and Tconv cells were enumerated.
Each symbol in (A)–(C) and (E)–(G) represents an individual mouse, and error bars represent SEM. *p < 0.05, **p < 0.01, ****p < 0.0001 by unpaired Student’s t tests. NS, not significant.
iNKT cells are “pre-activated, memory-like” T cells (D’Andrea et al., 2000; Park et al., 2000). Therefore, we asked whether their resistance to apoptosis was a mere reflection of this feature and thus mimicable by the memory subset of Tconv cells. Naive and memory Tconv pools were distinguished based on CD44 expression (Figure S4A). Similar to unfractionated and naive Tconv cells, and unlike iNKT cells, CD44+ memory Tconv cells were less frequent and contained more active caspases in restrained animals (Figure S4B). Therefore, iNKT cells’ resistance to stress is not linked to their memory-like property.
To shed light on the molecular mediators of cell survival and death in our system, we analyzed the transcript levels of relevant genes in sorted cells 2, 6, and 12 h into restraint stress. Compared with baseline levels, several pro-apoptotic genes were upregulated in Tconv but not in iNKT cells. These included the apoptosome component Apaf1, the Bcl-2 family members Bad, Bbc3, Bik, and Pmaip1, and the executioner caspases-3 and −6 (Figure 2D). In fact, a number of these genes were downregulated in iNKT cells. At the protein level, the pro-survival molecule Bcl-2 was elevated in iNKT cells, but not in the remaining Tconv cells (Figure 2E). Therefore, Bcl-2 may have a preventative or compensatory role in circumventing the apoptogenic effects of stress on iNKT cells.
Glucocorticoids are culprits of T cell apoptosis under certain circumstances (Haeryfar and Berczi, 2001; Herold et al., 2006). As such, we posited that the dimorphic impact of stress on iNKT and Tconv cells stems from differential glucocorticoid actions in these cell types. To this end, we generated mice whose T cells were devoid of GR. Indeed, restraint stress reduced Tconv cell numbers in B6.Nr3c1fl/fl (Nr3c1fl) controls but not in B6.Nr3c1fl/flLckcre/WT (Nr3c1flLckcre) mice (Figure 2F). We also observed a sharp numerical decline in hepatic and splenic NK and B cells during prolonged stress, which was reversible by treatment with the GR antagonist RU486 (Figure S4C).
Exogenous glucocorticoids are prescribed for many diseases and conditions. Therefore, we tested the effect of long-term, oral administration of corticosterone (CS), the main glucocorticoid in rodents (Pruett, 2003), on T cell apoptosis. Similar to endogenous glucocorticoids, CS reduced Tconv, but not iNKT, cell numbers both in the liver and in the spleen (Figure 2G), a finding that also serves to confirm the dominant role of glucocorticoids in stress-induced Tconv cell demise.
To summarize, iNKT cells’ unusual resilience in the face of a stress response is mediated by glucocorticoid-GR interactions. Importantly, the above results also rule out cell death as the reason behind the dwarfed IL-4 and IFN-γ responses of iNKT cells to glycolipid Ags or cytokines (Figure 1) in stressed animals.
Stress suppresses αGC-elicited cytokine responses through an iNKT cell-intrinsic, GR signaling-dependent mechanism independently of neurotransmission from post-ganglionic sympathetic neurons
We next attempted to elucidate the upstream neurological pathway(s) governing iNKT cell hyporesponsiveness in the context of prolonged restraint stress. Given the paramount role of the SNS in the fight-or-flight response (Elenkov et al., 2000), we first looked into the expression of SNS neurotransmitter receptors in iNKT cells purified from the liver of treatment-naive B6 mice. We did not detect Npy1r, Npy2r, Npy4r, Npy5r, or Npy6r transcripts (data not shown), and synthetic NPY failed to modulate cytokine production by the iNKT cell hybridoma DN32.D3 in response to αGC (data not shown). Hepatic iNKT cells had detectable mRNAs encoding the adrenergic receptors Adra2a, Adra2b, Adrb1, and Adrb2 at levels comparable to or lower than those found in matched hepatic Tconv cells (Figure S5A). In addition, NE inhibited IL-2 production by αGC-stimulated DN32.D3 cells (Figure S5B), which was preventable by β-adrenergic receptor antagonism with propranolol (Figure S5C). However, this was only an in vitro event because chemical sympathectomy through 6-hydroxydopamine (OHDA) administration failed to restore IL-4 and IFN-γ production in restrained mice that subsequently received αGC (Figure 3A). Sympathectomy was confirmed by reduced tyrosine hydroxylase (TH) staining in the spleens of OHDA-treated animals (Figure 3B). In these experiments, the brain served as a negative control because OHDA does not cross the blood-brain barrier (Schober, 2004).
Figure 3. Stress-induced suppression of iNKT cell responses is mediated by glucocorticoids, not by SNS signals.

(A) WT B6 mice (n = 3 or 4 per group) were injected i.p. with OHDA or Veh 6 days before they were restrained. Control cohorts were left undisturbed. Stressed and control animals were injected with αGC and bled at the indicated time points. Circulating IL-4 and IFN-γ levels were measured by ELISA.
(B) Protein extracts from flash-frozen spleen and brain samples from mice in (A) were loaded onto the same SDS-polyacrylamide gel and examined for their tyrosine hydroxylase (TH) content by western blotting. Staining for β-actin was used to ensure equal protein loading. Summary data illustrate normalized TH levels after densitometry analyses.
(C) Separate cohorts that had been restrained for 12 h or left undisturbed were bled for serum CS quantification by ELISA.
(D and E) Mice were injected i.p. with metyrapone (D) or RU486 (E) 1 h before they were restrained for 12 h (or not) followed by an i.p. injection of αGC. Box-and-whisker plots show IL-4 and IFN-γ levels at 2- and 12-h time points post-αGC administration, respectively, with each symbol representing an individual mouse.
Statistical comparisons were made by two-way ANOVA with Dunnett’s correction (A), unpaired Student’s t test (C), or one-way ANOVA with Tukey’s correction (D and E). *p < 0.05, **p < 0.01, ***p < 0.001, ****p < 0.0001; NS, not significant.
We then shifted our focus back onto the HPA axis and glucocorticoids. Elevated serum CS in stressed mice reassured us that prolonged restraint in our hands could induce robust activation of the HPA axis (Figure 3C). We found pretreatment with the glucocorticoid synthesis inhibitor metyrapone to rescue IL-4 and IFN-γ production in stressed mice receiving αGC (Figure 3D). To ensure that our results were not confounded by the reported buildup of circulating 11-deoxycorticosterone upon metyrapone treatment (Cao et al., 2002), we used a second pharmacological approach, namely GR antagonism by RU486. Similar to metyrapone, RU486 could prevent the suppressive effect of stress on cytokine production in restrained animals (Figure 3E). Of note, we used male mice in these experiments out of an abundance of caution to avoid the antagonistic action of RU486 on progesterone receptors (Pruett, 2003).
Although the systemic ablation of GR signaling could relieve iNKT cell hyporesponsiveness during stress, it was unclear whether glucocorticoids were acting on iNKT cells directly or on other cell types such as glycolipid Ag-presenting cells. We first demonstrated that iNKT cells from naive mice express the GR, at a greater level than that in matched Tconv cells. This was manifest at both mRNA and protein levels (Figures 4A and 4B). Second, we observed that stress instigates GR signaling in hepatic and splenic iNKT cells as judged by increased intracellular levels of the anti-inflammatory protein glucocorticoid-induced leucine zipper (GILZ), a known transcriptional target of the activated GR (Figure 4C) (Bereshchenko et al., 2019). Finally, unlike in the Nr3c1fl control cohort, stress failed to compromise the IFN-γ response of αGC-injected Nr3c1flLckcre mice (Figure 4D). This was not due to the possible off-target effects of the Cre recombinase because IFN-γ levels were not rescued in stressed B6.Lckcre/WT (Lckcre) mice (Figure 4E). Tconv cells do not contribute to rapid IFN-γ production in αGC-treated animals. Therefore, one may infer that direct GR signaling disrupts the ability of iNKT cells to generate or trigger inflammatory cytokine responses in vivo.
Figure 4. Stress impedes iNKT cell responses to αGC in a cell-autonomous, GR-dependent manner and creates a transcriptomic signature consistent with extensive iNKT cell dysfunctions.

(A) Hepatic iNKT and Tconv cells from naive B6 mice (n = 10 per experiment) were fluorescence-activated cell sorting (FACS) purified and the Nr3c1 mRNA content of iNKT cells relative to that of Tconv cells was PCR quantitated. Fold-change values were determined in 3 independent experiments.
(B) HMNCs and splenocytes were stained with an anti-GR mAb or a mouse IgG2aκ isotype control. Open histograms illustrate the GR positivity of hepatic iNKT and Tconv cells, and the filled histogram corresponds to the staining of TCRβ+ cells with the above isotype control. Summary data depict the geometric mean fluorescence intensity (gMFI) of GR staining.
(C) HMNCs and splenocytes from mice that had been restrained or left undisturbed were stained with an anti-GILZ mAb or a rat IgG2aκ isotype control. Representative contour plots depict GILZ+ iNKT cell frequencies, which are summarized in scatterplots.
(D and E) Nr3c1fl and Nr3c1flLckcre mice (n = 6–9) (D) and Lckcre mice (n = 4 or 5) (E) were restrained or left undisturbed before they received αGC, and serum IFN-γ was quantitated by ELISA.
(F) HMNCs and splenocytes from stressed and control mice were stained with mAbs against CD25, CD44, CD62L, and CD69 or with appropriate isotype controls. Box-and-whisker plots illustrate the frequencies of iNKT cells staining positively for each marker.
(G) Hepatic iNKT cells were sorted using FACS from stressed and control B6 mice (n ≥ 5 per group per experiment). Gene expression fold changes were determined by quantitative PCR in 3 independent experiments.
Each symbol in (B), (C), and (F) represents an individual mouse. Error bars in (A), (C)–(E), and (G) represent SEM. *p < 0.05, **p < 0.01, ***p < 0.001, ****p < 0.0001 by paired (B) or unpaired (C and F) Student’s t tests or by two-way ANOVA with Sidak’s correction (D and E).
Next, we asked whether physical restraint per se alters the activation status of iNKT cells. Consistent with their “pre-activated” phenotype (D’Andrea et al., 2000; Park et al., 2000), hepatic and splenic iNKT cells expressed high surface levels of CD25, CD44, and CD69 and minimal CD62L in their steady state (Figure 4F). Moreover, confinement stress failed to appreciably change these baseline levels (Figure 4F). Therefore, we took a more comprehensive approach by comparing the transcriptional profiles of purified iNKT cells from stressed and control mice. Although stress upregulated Bcl2 and CD127 (Il7ra), the mRNA levels of a number of genes that support the effector functions of iNKT cells were reduced. These include Cd40l, Il18rap, Egr2, Irf4, Nfatc3, Tbx21, Ifng, Il4, Gzma, Tnf, Tnfrsf9, and TNFsf10 (Figure 4G). Therefore, wide-ranging iNKT cell dysfunctions, beyond select cytokine production, can be expected in the aftermath of stress-induced GR signaling.
Long-term exposure to multiple unpredictable stressors, but not to the same stressor, hinders iNKT cell functions
Chronic stress can be due to long-term exposure to different stressful events or elements, resulting in sustained glucocorticoid release in the absence of organismal “habituation.” This can be simulated by the chronic variable stress (CVS) model whereby mice are subjected to heterotypic psychological and/or physical stressors, once daily and once nightly, for 21 days (Figure 5A). Given the importance of GR signaling in restraint-induced iNKT cell impairments, we hypothesized that CVS should impede in vivo cytokine production in response to αGC. We first confirmed elevated blood CS levels at the conclusion of the CVS experiment (Figure 5B), consistent with previous reports that CVS continuously activates the HPA axis (Franco et al., 2016). In addition, hepatic and splenic iNKT cells maintained their absolute numbers in mice that had been subjected to CVS (Figure 5C). Finally, and as hypothesized, animals that were injected with αGC after CVS had lower levels of IL-4, IFN-γ, and IL-2 (Figure 5D). We also exposed parallel cohorts of mice repeatedly to the same stressor, physical restraint, for 21 consecutive days before αGC treatment. In this repeated restraint stress (RRS) model, animals predict the stressor and habituate and adapt to it by gradually de-escalating glucocorticoid release (Girotti et al., 2006). Indeed, αGC-induced cytokine production remained impeccable in mice that had undergone RRS (Figure 5D), a sharp contrast with the CVS model.
Figure 5. Prolonged exposure to unpredictable stressors impairs cytokine production in response to αGC.

(A) B6 mice were subjected to 21 days of chronic variable stress (CVS) involving 3 weekly cycles of exposure to the indicated heterotypic stressors. Control mice remained undisturbed in home cages with food and water supplied ad libitum.
(B and C) At the conclusion of the third cycle, serum CS was measured by ELISA (B), and hepatic and splenic iNKT cells were enumerated (C).
(D) In additional experiments, parallel cohorts of mice (n = 4 per group) were subjected to CVS, or to repeated restraint stress (RRS) involving 1 h of daily physical confinement for 21 consecutive days. Control mice were left undisturbed. At the conclusion of the 21-day period, animals were injected with αGC and assessed for their serum IL-4, IFN-γ, and IL-2 levels at the indicated time points.
Each symbol in (B) and (C) represents a mouse. Error bars denote SEM. Statistical comparisons were conducted using unpaired Student’s t tests (B and C) or two-way ANOVA with Tukey’s correction (D). *p < 0.05, **p < 0.01; NS, not significant.
The above results further enforce our conclusion that the activation of the HPA axis mediates stress-induced iNKT cell dysfunctions.
Glucocorticoid secretion due to prolonged stress interferes with iNKT cells’ antimetastatic function
iNKT cells participate in anticancer immune surveillance, and their glycolipid agonists have been used in clinical trials for multiple malignancies (Fujii and Shimizu, 2019; van den Heuvel et al., 2011). However, whether stress alters the antitumor property of iNKT cells has not been addressed.
We first assessed the oncolytic capacity of splenocytes from mice that had been subjected to prolonged restraint before they received an αGC injection. Effector cells isolated from stressed mice were less competent in killing YAC-1 lymphoma cells in vitro (Figure 6A). We then used an in vivo killing assay with which to test the ability of αGC-transactivated NK cells and pre-mNK cells to destroy B6.β2M−/− (β2M−/−) splenocytes (Choi et al., 2019). Consistent with our in vitro results, β2M−/− target cells were only poorly cleared in previously restrained animals (Figure 6B).
Figure 6. GR signaling during stress compromises the ability of iNKT cells to trigger oncolytic and antimetastatic responses.

B6 mice were restrained or left undisturbed before they were given αGC (n = 6 or 7) or Veh (n = 2).
(A) Twenty-four hours later, mice were euthanized, and their splenocytes were employed at the indicated effector:target ratios against 51Cr-labeled YAC-1 lymphoma cells. Percent specific cytotoxicity was calculated as described in STAR Methods.
(B) Twenty-four hours after αGC administration, previously stressed and control mice were injected i.v. with a 1:1 mixture of CFSElo WT B6 and CFSEhi β2M−/− B6 splenocytes. After 2 h, the relative proportion of each population was determined by flow cytometry, and percent cytotoxicity against NK-susceptible β2M−/− target cells was calculated as described in STAR Methods.
(C) In separate experiments, 6 h after αGC (or Veh) administration, mice were injected i.v. with B16-F10 cells. Lungs were photographed 14 days later for representative images, and metastatic lung nodules were visually counted as a measure of tumor burden. Mice bearing too many nodules to count (>400) are conservatively represented on the dotted line.
(D) In similar experiments, B6 albino mice received B16-FLuc cells. Twenty-one days later, they received an i.p. injection of luciferin and were subjected to whole-body bioluminescence imaging.
(E) In additional experiments, B6 mice were used as in (C) except they were injected i.p. with RU486 (or Veh) 1 h before they were restrained (or not).
Each symbol in (B)–(E) represents a mouse. Error bars denote SEM. * denotes a difference with p < 0.05 by two-way ANOVA with Tukey’s correction (A) or by unpaired Student’s t tests (B and D).
Next, we examined whether stress interferes with the ability of αGC-primed iNKT cells to prevent metastatic cancer in vivo. Mice were restrained, or not, before receiving a single intraperitoneal (i.p.) injection of αGC or vehicle, followed shortly by an intravenous (i.v.) inoculum of B16-F10 melanoma cells. Visual enumeration of pulmonary metastases revealed a complete loss of αGC-mediated protection in stressed mice (Figure 6C). This finding was validated by whole-body bioluminescence imaging of tumor-bearing B6 albino mice that showed far greater B16-F10-Red-FLuc (B16-FLuc) tumor burden in their lungs if they were previously restrained (Figure 6D). Furthermore, RU486 treatment before stress reinstated the efficacy of αGC therapy against B16-F10 metastasis (Figure 6E). Therefore, through a GR-dependent pathway, prolonged psychological stress abolishes the capacity of iNKT cells to orchestrate antimetastatic responses.
MAIT cells are resistant to glucocorticoid-induced apoptosis but fail to mount optimal cognate responses under stress
Dubbed “the human cousins” of mouse iNKT cells, MAIT cells are MR1-restricted iT cells with key roles in host defense (Legoux et al., 2017; Salou et al., 2019). They are scarce in conventional laboratory mice (Cui et al., 2015) but frequent in the human PB, liver, and lungs (Dusseaux et al., 2011; Franciszkiewicz et al., 2016; Tang et al., 2013).
We asked whether similar to mouse iNKT cells, human iT cells survive exposure to glucocorticoids. We incubated human PB mononuclear cells (PBMCs) (Figure 7A) or HMNCs (Figure 7B) for 24 h with hydrocortisone (HC), the main stress-induced glucocorticoid produced in humans, or with dexamethasone (DEX), a commonly prescribed synthetic glucocorticoid. Exposure to either HC or DEX elevated the intracellular active caspase levels of PB Tconv cells (Figure 7A). By contrast, matched blood iNKT and MAIT cells contained very low and stable levels of active caspases. A similar pattern was evident among hepatic MAIT cells (Figure 7B). Moreover, in two liver samples in which iNKT cells were detectable, there was no evidence of increased caspase activity after incubation with HC or DEX (data not shown).
Figure 7. Stress and glucocorticoids fail to program MAIT cells for apoptosis but render them hyporesponsive to 5-OP-RU.

(A and B) Human PBMCs (A) and HMNCs (B) were exposed to hydrocortisone (HC), dexamethasone (DEX), or Veh for 24 h before they were analyzed by flow cytometry to detect intracellular active caspases in the indicated T cell subsets. gMFI values are summarized in bar graphs.
(C) Immediately after prolonged restraint stress (or not), HMNCs from B6-MAITCAST mice were stained with 6-FP- (control) or 5-OP-RU-loaded MR1 tetramers along with anti-TCRβ and -B220 mAbs. Representative zebra plots illustrate MAIT cell populations after gating on TCRβ+B220− events, and scatterplots summarize MAIT cell frequencies among total αβ T cells.
(D) The absolute numbers of hepatic MAIT cells were also calculated.
(E) B6-MAITCAST and MR1−/− mice (n ≥ 3) were injected i.p. with 5-OP-RU or Veh, and serum IL-4 and IFN-γ levels were quantified at the indicated time points.
(F) B6-MAITCAST mice were restrained (or left undisturbed), injected with 5-OP-RU (n = 8) or Veh (n = 3 or 4), and bled for serum IL-4 and IFN-γ measurements.
(G) Stressed and control B6-MAITCAST mice were injected with 5-OP-RU (or Veh) 30 min before they were sacrificed for their liver. Hepatic MAIT cells were identified by MR1 tetramers, and IL-4+ and IFN-γ+ MAIT cell frequencies were determined via staining with anti-cytokine mAbs or isotype controls.
Each symbol in (A)–(D) and (G) represents an individual sample or mouse. Error bars represent SEM. *, **, ***, and **** denote differences with p < 0.05, p < 0.01, p < 0.001, and p < 0.0001, respectively, by two-way ANOVA with Dunnett’s (A and B) or Tukey’s (E and F) correction or by unpaired Student’s t tests (C, D, and G); NS, not significant.
Similar to mouse iNKT and Tconv cells from stressed animals, which upregulate CD127 in a cell-autonomous, GR-dependent manner to respond to the pro-survival cytokine IL-7 (Figures S6A–S6E), human MAIT, iNKT, and Tconv cells increased their surface CD127 levels upon exposure to glucocorticoids (Figure S6F). This phenomenon may serve as a defense mechanism at the cellular level.
In vivo studies on MAIT cells can be challenging due to the low frequency of these cells in standard mouse strains. Therefore, we used B6-MAITCAST mice that contain ~20 times more MAIT cells than do WT B6 mice (Cui et al., 2015). Subjecting these mice to prolonged restraint increased, rather than decreased, hepatic MAIT cell frequencies among αβ T cells (Figure 7C), accompanied by enhanced CD127 expression (Figure S6G). Furthermore, stress failed to reduce absolute MAIT cell numbers (Figure 7D).
To assess the impact of stress on MAIT cell functions, we first demonstrated that a single i.p. injection of 5-OP-RU gives rise to early serum IL-4 and IFN-γ spikes in B6-MAITCAST mice but not in MR1−/− B6-MAITCAST (MR1−/−) MAIT-deficient animals (Figure 7E). This indicated a requirement for MAIT cells in these responses and provided us with reliable readouts to work with. B6-MAITCAST mice that had undergone restraint stress before they received 5-OP-RU had significantly lower blood levels of IL-4 and IFN-γ compared with control animals (Figure 7F). Likewise, as quickly as 30 min post-5-OP-RU administration, IL-4 and IFN-γ became detectable inside MAIT cells from control mice but not in stressed animals (Figure 7G). Therefore, stress lessens MAIT cell capacities to potentiate TH1- and TH2-type responses in vivo.
DISCUSSION
iT cells link the innate and adaptive arms of immunity (Matsuda et al., 2008; Rudak et al., 2018). Therefore, revealing how stress affects iT cell responses is important both from a basic biological standpoint and in light of their therapeutic potentials.
We demonstrate that stress compromises the ability of iNKT cells to trigger TH1- and TH2-type responses and to promote antimetastatic immune surveillance. Mechanistically, this hyporesponsive state is dependent upon direct GR signaling in iNKT cells, which remain uniquely and remarkably recalcitrant to glucocorticoid-inflicted apoptosis.
Many studies to date have suggested that mediators of stress promote TH2-type immunity (Calcagni and Elenkov, 2006; Hou et al., 2013; Hu et al., 2014). Tamada et al. argued that glucocorticoids selectively retain IL-4-producing NKT cells in the T cell repertoire (Tamada et al., 1998). Our findings indicate that psychological stress limits iNKT cell-mediated TH2-type responses, albeit not exclusively. In fact, stress generates a mixed inflammatory signature and also skews iNKT cell responses in favor of select anti-inflammatory cytokines, namely IL-10 and IL-27, but not TGF-β. To what extent these immunosuppressive cytokines inhibit TH1 and/or TH2 immunity following iNKT cell stimulation remains to be determined. We also found that stressed mice exposed to αGC generate greater levels of TH17-associated cytokines, including IL-23 and, to a lesser degree, IL-17A. Although the exact cellular source(s) of these cytokines will need to be identified, our results point to an adaptation mechanism that may preserve fast-acting TH17-type responses to a wide range of bacterial and fungal pathogens in the face of a stressful event.
The anticancer function of iNKT cells depends, in large part, on their ability to induce DC maturation and to transactivate additional effector cells (Fujii and Shimizu, 2019). These functions require the expression of CD40L and IFN-γ, both of which were reduced in iNKT cells during stress. Serum concentrations of multiple chemokines (e.g., IP-10, MCP-1, and RANTES) were also diminished in stressed mice receiving αGC, suggesting a weakened iNKT cell capacity in mobilizing other immune cell types toward inflammatory sites and infectious foci.
We found iNKT cells from stressed mice to launch weak cytokine responses upon iTCR triggering but to behave normally upon stimulation with PMA and ionomycin. Splenic iNKT cells from these animals had diminished iTCR, CD28, and ICOS levels on their surface. Further, we found reduced levels of phospho-SLP76 (pY128) and a trend toward lower phospho-CD3ζ (pY142) and phospho-ZAP70 (pY319)/phospho-Syk (pY352) levels, but not phospho-Lck (pY505), in hepatic iNKT cells (data not shown). These findings are consistent with a previous report that in vitro exposure to DEX lowers phospho-CD3ζ and phospho-ZAP70 levels, but not the kinase activity of Lck, in mouse T cells (Van Laethem et al., 2001). Deciphering the biochemical bases of the above changes and their tissue-selective patterns warrants further investigation.
The plasticity of iNKT cells was evident by virtue of their constitutive mRNA expression of T-bet, AP-1, nuclear factor κB (NF-κB), and nuclear factor of activated T cells (NFAT) family transcription factors (Das et al., 2010). These levels were either reduced or remained stable during stress, with the sole exception of the AP-1 subunit c-Fos. Intriguingly, the transcript levels of c-Jun, c-Fos’s binding partner, were not impacted by stress. How the stoichiometric changes of Fos-Jun interactions may affect the activity of AP-1 during stress will also be a subject of future studies.
The SNS controls the activity of the HPA axis (Engeland and Arnhold, 2005), and we found iNKT cells to amply express adrenergic receptors. Adrenergic agonists reportedly suppress in vivo NK and Tconv cell responses (Bucsek et al., 2017; Diaz-Salazar et al., 2020; Wieduwild et al., 2020). Therefore, our finding that iNKT cell dysfunctions in prolonged stress stem, exclusively, from GR engagement, and not from post-ganglionic sympathetic neurotransmission, is curious. This is, however, in agreement with our recent report that OHDA-induced sympathectomy has no effect on glucocorticoid levels during prolonged stress (Rudak et al., 2019). We propose that the SNS’s dominant role is likely to manifest during a fight-or-flight response to an acute stressor, which may not jeopardize iNKT cell functions. In fact, we have found that a brief period (15 min) of physical restraint, which results in acute stress (Dhabhar et al., 2012), fails to alter αGC-elicited cytokine production (data not shown). Consistent with the above theory, plasma NE and epinephrine levels reach their peak as early as 5–20 min after restraint in rats whereas CS levels peak later, around 60 min following physical restraint (Kvetnansky et al., 1978, 1993).
In a mouse model of cerebral stroke, Wong et al. demonstrated that NE released by post-ganglionic sympathetic neurons induces IL-10 production by hepatic iNKT cells, which leads to immunosuppression and secondary bacterial infection (Wong et al., 2011). However, whether or not SNS mediators, including NE, interfere with iTCR-mediated iNKT cell activation was not assessed. Nissen and coworkers reported that sustained adrenergic receptor stimulation influences the efficacy of αGC-based cancer immunotherapy only minimally (Nissen et al., 2018), and our current work indicates that SNS mediators do not appreciably impact iNKT cell responses to glycolipid Ags. Therefore, in the absence or presence of concomitant iTCR stimulation, adrenergic receptor signaling may have different outcomes.
iNKT cell impairments in stressed animals were accompanied by increased levels of GILZ, a transcriptional target of the GR (Monczor et al., 2019). GILZ exerts broad anti-inflammatory activities mediated, partially, by protein-protein interactions that inhibit NF-κB and AP-1 (Ronchetti et al., 2015). It has been speculated that GILZ binds directly to DNA to repress the transcription of several genes that control T cell functions (Yosef et al., 2013). GILZ was recently shown to abolish the efficacy of immunostimulatory therapies against murine tumors, and greater GILZ expression within TMEs correlated with poorer prognosis in human cancers (Yang et al., 2019). It is conceivable that GILZ contributes to suppressed iNKT cell functions in stressed individuals. As such, selective inhibitors of GILZ may be beneficial.
We recently reported that long-term stress upregulates the immune checkpoint molecule T cell immunoreceptor with immunoglobulin and ITIM domains (TIGIT) on iNKT cells in a cell-autonomous, GR-dependent fashion (Rudak et al., 2019). Our preliminary results indicate that systemic blockade of TIGIT moderately but significantly restores serum IFN-γ levels in stressed animals responding to αGC (Figure S7A). Therefore, TIGIT may be partially responsible for iNKT cell dysfunctions during stress, and its blockade may be a viable option in reversing stress-induced immunosuppression. Of note, iNKT cell responses to αGC remained impaired for at least 1 day post-stress (Figure S7B) but were restored to control levels after 1 week (Figure S7C). Therefore, although TIGIT may mediate cellular exhaustion (Johnston et al., 2014; Zhang et al., 2018), the impact of its engagement appears to be transient because iNKT cells from stressed mice do not exhibit signs of long-term impairments.
Consistent with the literature (Herold et al., 2006; Tseng et al., 2005), exposure to glucocorticoids contracted the size of several populations, including Tconv, B, and NK cells. On the contrary, however, iNKT and MAIT cells were resistant to glucocorticoid-induced apoptosis. Our results thus unveil a glucocorticoid-induced signaling pathway within iT cells that operates in a fundamentally distinctive manner. We noted that iNKT cells express relatively high levels of Bcl-2, which becomes even more pronounced during physical restraint. This is reminiscent of a higher Bcl-2 content in NKT cells compared with “NK1.1− T cells” as well as Bcl-2 upregulation upon radiotherapy or in vitro exposure to DEX as previously described (Tamada et al., 1998; Yao et al., 2009). Therefore, Bcl-2 expression may be crucial for the survival of iNKT cells encountering various apoptogenic stimuli, including but not limited to endogenous glucocorticoids.
GR transcriptionally controls Cd127 in DEX-treated T cells in vitro (Lee et al., 2005). Here, we found GR to drive CD127 expression in iNKT and Tconv cells during stress. We also observed CD127 upregulation by hepatic mouse MAIT cells during physical confinement and also among human iNKT, MAIT, and Tconv cells exposed to HC or DEX. CD127 may allow T cells to receive survival signals counteracting the pro-apoptotic properties of endogenous glucocorticoids. Of note, we detected no changes in serum IL-7 levels immediately or shortly after restraint stress (data not shown). Nevertheless, we cannot discount a role for locally produced IL-7 in mainstream and invariant T cell homeostasis and survival in the course of a stress response. IL-7 enhances the effector functions of both iNKT and MAIT cells (de Lalla et al., 2008; Leeansyah et al., 2015). Therefore, its administration may be useful in bolstering iT cell functions in stressed subjects.
Unlike Tconv cells that are restricted by polymorphic MHC molecules, iNKT and MAIT cells recognize cognate Ags complexed with monomorphic molecules, namely CD1d and MR1, respectively (Kawano et al., 1997; Treiner et al., 2003). Therefore, CD1d and MR1 ligands should work across genetically distinct individuals, which makes iT cells attractive targets in immunotherapeutic interventions for microbial infections and/or malignancies (Haeryfar and Mallevaey, 2015; Rudak et al., 2018). A growing body of evidence implicates psychological stress as an obstacle to cancer immunotherapy (Levi et al., 2011; Sommershof et al., 2017; Yang et al., 2019), and our findings provide a mechanism of stress-induced immunosuppression with wide-ranging repercussions for antitumor immunity. In addition, stress curbed or drastically altered systemic inflammatory responses to αGC and 5-OP-RU, both of which are derived from microbes. It is thus likely that stress also impedes iT cell responses to pathogens in natural or therapeutic settings, which will be a subject of future investigations.
STAR★METHODS
RESOURCE AVAILABILITY
Lead contact
Further information and requests for resources and reagents should be directed to and will be fulfilled by the Lead Contact, Dr. Mansour Haeryfar (Mansour.Haeryfar@schulich.uwo.ca).
Materials availability
The B6.Nr3c1fl/flLckcre/wt and B6.Lckcre/wt mouse lines generated in this study can be bred using commercially available parental strains as described under Experimental model and subject details. This study did not generate any other new unique reagents.
Data and code availability
This study did not generate/analyze datasets or codes.
EXPERIMENTAL MODEL AND SUBJECT DETAILS
Mice
Adult WT B6 and BALB/c mice, between 8 and 16 weeks of age, were purchased from Charles River Canada (Saint-Constant, QC). B6(Cg)-Tyrc−2J/J (B6 albino) mice (#000058) were purchased from The Jackson Laboratory (Bar Harbor, ME). B6-MAITCAST mice, a congenic strain harboring a larger MAIT cell compartment relative to WT B6 mice, and MAIT cell-deficient MR1−/− B6-MAITCAST mice have been previously described (Cui et al., 2015). β2M−/− mice were provided by Dr. Anthony Jevnikar (Western University, London, ON). Nr3c1flLckcre mice, whose T cells lack the GR, were generated by crossing B6.Nr3c1fl/fl (Jackson #021021) with B6.Lckcre/cre mice (Jackson #003802), followed by backcrossing the offspring with Nr3c1fl mice. Lckcre mice were generated by crossing offspring with WT B6 mice. PCR-based genotyping was conducted throughout breeding. Animals were housed in an institutional barrier facility with constant light/dark cycles. Prior to any experiment, mice were randomly assigned to treatment groups. Both male and female mice were included in our initial serum cytokine analyses (Figures 1B, 1C, 7E, 7F, and S2) and immunophenotyping studies (Figures 2A, 2B, 7C, and 7D). Male mice were used in all other in vivo experiments. Cohorts were always age- and sex-matched. Mouse experiments were conducted following Animal Use Protocols 2010–241, 2018–093 and 2018–130, which were approved by the Animal Care Committee of Animal Care and Veterinary Services at Western University.
Human specimens
HMNCs were obtained from tumor-free liver samples from patients undergoing surgical resection, without prior neoadjuvant therapy, at University Hospital (London Health Sciences Centre, London, ON). Three patients had undergone surgery for colorectal liver metastasis, one for ampullary cancer, one for ampullary adenoma, and one for pancreatic cancer. Patients had a mean age of 64 (range: 37–80) and were all male.
PBMCs were isolated from 4 healthy blood donors, two males and two females, with a mean age of 37 (range: 29–51). Human specimens were collected after obtaining written, informed consent from participants as per study protocols 5545, 2597 and 113362 approved by the Western University Research Ethics Board for Health Sciences Research Involving Human Subjects.
Cell lines
The mouse lymphoma cell line YAC-1 (ATCC TIB-160) was grown at 37°C in RPMI 1640 medium supplemented with 10% fetal bovine serum (FBS), 2 mM GlutaMAX-I, 0.1 mM MEM nonessential amino acids, 1mM sodium pyruvate, 100 U/mL penicillin, 100 μg/mL streptomycin, and 10 mM HEPES, which has been referred to as complete medium. The mouse melanoma line B16-F10 was provided by Dr. Ann Chambers (Western University, London, ON) and maintained in MEM Alpha medium supplemented with 10% FBS. Luciferase-expressing B16-FLuc cells (PerkinElmer #BW124734) were grown in RPMI 1640 containing 10% FBS. DN32.D3, a CD4−CD8− iNKT hybridoma cell line from Dr. Albert Bendelac (University of Chicago, Chicago, IL), was cultured in RPMI 1640 containing 10% FBS, 2 mM GlutaMAX-I, and 0.1 mM MEM nonessential amino acids.
METHOD DETAILS
Models of psychological stress
To induce prolonged confinement stress, mice were held horizontally for 12 h inside well-ventilated 50-mL conical tubes. This immobilization procedure prompts psychological stress in rodents without causing pain or physical compression and activates the SNS and the HPA axis (Buynitsky and Mostofsky, 2009). Cage-mate controls remained undisturbed but were deprived of access to food and water for 12 h. To model acute stress, mice were restrained for 15 minutes (Dhabhar et al., 2012) while control animals were left in home cages without food and water.
Repeated restraint stress (RRS) was inflicted by subjecting mice to 21 days of physical immobilization for 1 h daily. The experimenter and the time at which each stressor was applied remained constant throughout the entire procedure.
The chronic variable stress (CVS) model entailed daily exposures to heterotypic psychological or physical stressors for 21 days. One brief stressor during the light cycle and one overnight (O/N) stressor during the dark cycle were introduced each day. In no particular order, brief stressors included placement in a 4°C environment for 1 h, physical restraint for 1 h, horizontal cage shaking at 80 rpm for 1 h, and placement in 30°C water for 15 minutes. O/N stressors included water deprivation, cage tilting at a 45-degree angle, constant exposure to light, wet bedding (through pouring ~200 mL of water onto cage bedding), and food deprivation. Unlike RRS, mice fail to habituate to unpredictable stressors in the CVS model and display continuously elevated stress responses as a consequence (Franco et al., 2016). Parallel cohorts of non-stressed control mice were left undisturbed with food and water ad libitum for 21 days.
Chemical sympathectomy
Six days before mice were subjected to prolonged restraint stress, 6-hydroxydopamine (OHDA) (Sigma-Aldrich) was administered i.p. at 200 mg/kg in a vehicle containing 0.9% NaCl and 10−7 M ascorbic acid in phosphate-buffered saline (PBS). Successful sympathectomy was confirmed by immunoblotting for TH in splenic and brain tissues of OHDA-treated mice. We used a rabbit polyclonal Ab (ab117112 from abcam) to capture mouse TH, and an anti-mouse β-actin mAb (mAbGEa from Thermo Scientific) served as a loading control. Horseradish peroxidase-conjugated goat anti-rabbit IgG and anti-mouse IgG secondary Abs were from Thermo Scientific. Enzymatic reactions were initiated using the Amersham ECL Prime Western Blotting Detection Reagent (GE Healthcare). Blots were digitally imaged using a C-DiGit Blot Scanner (LI-COR Biosciences).
Administration and pharmacological inhibition of glucocorticoids
To simulate stress-elicited rise in glucocorticoids, corticosterone (CS) (Sigma-Aldrich) was administered orally. CS was dissolved in absolute ethanol and then diluted in standard drinking water to yield a final concentration of 25 μg/mL of water with 1% ethanol. CS-containing water was provided for 21 days with weekly replenishments. This regimen gives rise to CS serum levels that are comparable to those found in chronically stressed mice as we previously reported (Rudak et al., 2019).
In several experiments, mice were injected i.p. with 200 mg/kg of the glucocorticoid synthesis inhibitor metyrapone (Sigma-Aldrich) or with 25 mg/kg of the GR antagonist RU486 (Sigma-Aldrich) 1 h prior to prolonged restraint stress.
In vivo administration of iT cell ligands/stimuli
Glycolipid stimulation of iNKT cells was achieved via i.p. administration of 100 μg/kg of KRN7000/αGC (Funakoshi, Tokyo, Japan) or 200 μg/kg of αCGC in a vehicle containing 5.6% sucrose, 0.75% L-histidine and 0.5% Tween-20, which was further diluted in PBS. αCGC was supplied by the NIH Tetramer Core Facility (Atlanta, GA). To stimulate iNKT cells in a cytokine-dependent manner, each animal was injected i.v. with 2 ng recombinant mouse IL-12 (Peprotech, Rocky Hill, NJ) plus 200 ng recombinant mouse IL-18 (R&D Systems) in PBS.
To activate MAIT cells, mice were injected i.p. with 200 μL of PBS containing 20 μL of a 5-OP-RU stock solution. The stock solution was prepared by mixing equal volumes of 2 mM 5-amino-6-D-ribitylaminouracil (5-ARU) and 2 mM methylglyoxal in DMSO for 24 h at room temperature. Aliquots were stored at −80°C until use. Control mice received vehicle (2 mM methylglyoxal in DMSO) diluted in PBS.
Where indicated, mice were given 200 μg of a TIGIT-blocking mAb (clone 1B4) or a mouse IgG1κ isotype control (clone MOPC-21 from BioXCell) 1 h prior to αGC administration.
Quantification of serum cytokines and CS
Mice were bled immediately after stress or at 2, 12 and 24 h post-treatment with αGC, αCGC, 5-OP-RU, or an appropriate vehicle. Sera were isolated, aliquoted and stored at −20°C. Mouse IFN-γ, IL-2 and IL-4 concentrations were measured using eBioscience Ready-SET-Go! ELISA Kits. Cytokine multiplex analyses were performed by Eve Technologies (Calgary, AB). CS levels were measured using a DetectX Corticosterone Enzyme Immunoassay kit (Arbor Assays, Ann Arbor, MI).
Cytofluorometric analyses
After cervical dislocation, mouse spleens were mechanically homogenized and depleted of erythrocytes through exposure to ACK (Ammonium-Chlorine-Potassium) lysis buffer for 3 minutes at room temperature. HMNCs were isolated from mouse livers or human tumor-free liver samples. Specimens were homogenized, and parenchymal cells were removed by density gradient centrifugation at 700 × g in 33.75% Percoll PLUS (GE Healthcare). This was followed by treatment with ACK lysis buffer to eliminate erythrocytes. To isolate human PBMCs, uncoagulated blood from healthy donors was spun at 1,200 × g in 50 mL SepMate PBMC Isolation Tubes (STEMCELL Technologies) containing Ficoll-Paque PLUS (GE Healthcare).
Before surface staining, mouse cell suspensions were incubated for 10 minutes on ice with 5 μg/mL of an anti-mouse CD16/CD32 mAb (clone 2.4G2) to prevent non-specific binding to Fcγ receptors. Cell surface staining was conducted for 30 minutes at 4°C in PBS containing 2% FBS. Intracellular detection of cytoplasmic proteins was performed using the Intracellular Fixation & Permeabilization Buffer Set (Thermo Scientific). To stain nuclear proteins, we used the Foxp3/Transcription Factor Staining Buffer Set (Thermo Scientific). A FITC CaspaTag Pan-Caspase In Situ Assay Kit (EMD Millipore) was used to detect intracellular active caspases.
Mouse iNKT cells were defined as TCRβ+PBS-57-loaded mCD1d tetramer+ cells, and human iNKT cells as CD3+PBS-57-loaded hCD1d tetramer+ cells, while empty CD1d tetramers served as staining controls. Mouse MAIT cells were defined as B220−TCRβ+5-OP-RU-loaded mMR1 tetramer+ cells, and human MAIT cells as CD3+5-OP-RU-loaded hMR1+ cells. 6-formylpterin (6-FP)-loaded MR1 tetramer reagents, which do not react with the iTCR of MAIT cells, were utilized in parallel as staining controls. We identified mouse Tconv cells as TCRβ+PBS-57-loaded mCD1d tetramer− cells, and human Tconv cells as CD3+PBS-57-loaded hCD1d tetramer−5-OP-RU-loaded hMR1 tetramer− cells. Mouse NK cells, B cells and DCs were immunophenotyped as TCRβ−NK1.1+, TCRβ−B220+ and TCRβ−CD11c+ cells, respectively. Staining with isotype controls was used to draw gates as appropriate.
The fluorochrome-conjugated mAbs and tetramer reagents employed in this study are listed in the Key Resources Table. Cells were interrogated using a BD FACSCanto II flow cytometer equipped with BD FACSDiva version 6.1.2 software.
KEY RESOURCES TABLE.
| REAGENT or RESOURCE | SOURCE | IDENTIFIER |
|---|---|---|
| Antibodies | ||
| Alexa 700-conjugated anti-mouse/human B220 (Clone RA3-6B2) | Thermo Fisher Scientific | Cat # 56-0452-82; RRID: AB_891458 |
| Alexa 700-conjugated anti-human CD3 (Clone UCHT1) | Thermo Fisher Scientific | Cat # 56-0038-42; RRID: AB_10597906 |
| PE-Cy7-conjugated anti-mouse CD3ε (Clone 145-2C11) | Thermo Fisher Scientific | Cat # 25-0031-82; RRID: AB_469572 |
| FITC-conjugated anti-mouse CD4 (Clone GK1.5) | Thermo Fisher Scientific | Cat # 11-0041-81; RRID: AB_464891 |
| PE-eFluor610-conjugated anti-mouse CD11c (Clone N418) | Thermo Fisher Scientific | Cat # 61-0114-80; RRID: AB_2574529 |
| PE-conjugated anti-mouse CD25 (Clone PC61.5) | Thermo Fisher Scientific | Cat # 12-0251-81; RRID: AB_465606 |
| PerCP-Cy5.5-conjugated anti-mouse CD28 (Clone 37.51) | Thermo Fisher Scientific | Cat # 45-0281-80; RRID: AB_925744 |
| PE-Cy5-conjugated anti-mouse/human CD44 (Clone IM7) | Thermo Fisher Scientific | Cat # 15-0441-81; RRID: AB_468748 |
| FITC-conjugated anti-mouse/human CD44 (Clone IM7) | Thermo Fisher Scientific | Cat # 11-0441-81; RRID: AB_465044 |
| PE-conjugated anti-mouse CD45 (Clone 30-F11) | Thermo Fisher Scientific | Cat # 12-0451-82; RRID: AB_465668 |
| APC-eFluor780-conjugated anti-mouse CD62L (Clone MEL-14) | Thermo Fisher Scientific | Cat # 47-0621-80; RRID: AB_1603258 |
| PerCP-Cy5.5-conjugated anti-mouse CD69 (Clone H1.2F3) | Thermo Fisher Scientific | Cat # 45-0691-82; RRID: AB_1210703 |
| PE-conjugated anti-mouse CD127 (Clone A7R34) | Thermo Fisher Scientific | Cat # 12-1271-82; RRID: AB_465844 |
| PerCP-Cy5.5-conjugated anti-human CD127 (Clone eBioRDR5) | Thermo Fisher Scientific | Cat # 45-1278-41; RRID: AB_10669708 |
| FITC-conjugated anti-mouse/rat/Rhesus monkey CD278/ICOS (Clone C398.4A) | Thermo Fisher Scientific | Cat # 11-9949-82; RRID: AB_465458 |
| PE-Cy7-conjugated anti-mouse NK1.1 (Clone PK136) | Thermo Fisher Scientific | Cat # 25-5941-82; RRID: AB_469665 |
| FITC-conjugated anti-mouse TCRβ (Clone H57-597) | Thermo Fisher Scientific | Cat # 11-5961-85; RRID: AB_465324 |
| PE-Cy7-conjugated anti-mouse TCRβ (Clone H57-597) | Thermo Fisher Scientific | Cat # 25-5961-82; RRID: AB_2573507 |
| APC-eFluor780-conjugated anti-mouse TCRβ (Clone H57-597) | Thermo Fisher Scientific | Cat # 47-5961-82; RRID: AB_1272173 |
| PE-Cy7-conjugated anti-mouse/rat Bcl-2 (Clone 10C4) | Thermo Fisher Scientific | Cat # 25-6992-42; RRID: AB_2573516 |
| PE-conjugated anti-mouse/human GILZ (Clone CFMKG15) | Thermo Fisher Scientific | Cat # 12-4033-80; RRID: AB_1659717 |
| PE-conjugated anti-mouse IFN-γ (Clone XMG1.2) | Thermo Fisher Scientific | Cat# 12-7311-82; RRID: AB_466193 |
| PE-Cy7-conjugated anti-mouse IL-2 (Clone JES6-5H4) | Thermo Fisher Scientific | Cat # 25-7021-82; RRID: AB_1235004 |
| PE-Cy7-conjugated anti-mouse IL-4 (Clone 11B11) | BD Biosciences | Cat # 560699; RRID: AB_1727548 |
| PE-Cy7-conjugated anti-mouse IL-4 (Clone BVD6-24G2) | Thermo Fisher Scientific | Cat # 25-7042-82; RRID: AB_469674 |
| PE-conjugated anti-mouse/human IL-5 (Clone TRFK5) | Thermo Fisher Scientific | Cat # 12-7052-81; RRID: AB_763588 |
| eFluor660-conjugated anti-mouse IL-12p35 (Clone 4D10p35) | Thermo Fisher Scientific | Cat # 50-7352-80; RRID: AB_2574284 |
| APC-eFluor780-conjugated anti-mouse IL-13 (Clone eBio13A) | Thermo Fisher Scientific | Cat # 47-7133-80; RRID: AB_2716963 |
| PerCP-eFluor710-conjugated anti-mouse/rat/human/non-human primate/cynomolgus monkey/dog Ki67 (Clone SolA15) | Thermo Fisher Scientific | Cat # 46-5698-82; RRID: AB_11040981 |
| PE-conjugated anti-mouse/rat/human/guinea pig/rabbit/sheep/yeast glucocorticoid receptor (Clone BuGR2) | Novus Biologicals | Cat # NB300-731PE; RRID: AB_2298869 |
| PE-Cy5-conjugated rat IgG2bκ isotype control (Clone eB149/10H5) | Thermo Fisher Scientific | Cat # 15-4031-82; RRID: AB_470133 |
| FITC-conjugated rat IgG2bκ isotype control (Clone Eb149/10H5) | Thermo Fisher Scientific | Cat # 11-4031-81; RRID: AB_470003 |
| APC-eFluor780-conjugated rat IgG2aκ isotype control (Clone eBR2a) | Thermo Fisher Scientific | Cat # 47-4321-80; RRID: AB_1272001 |
| PerCP-Cy5.5-conjugated Armenian hamster IgG isotype control (Clone eBio299Arm) | Thermo Fisher Scientific | Cat # 45-4888-80; RRID: AB_906260 |
| PE-conjugated rat IgG2aκ isotype control (Clone eBR2a) | Thermo Fisher Scientific | Cat # 12-4321-42; RRID: AB_1518773 |
| PerCP-Cy5.5-conjugated mouse IgG1κ isotype control (Clone P3.6.2.8.1) | Thermo Fisher Scientific | Cat # 45-4714-82; RRID: AB_906257 |
| PE-Cy7-conjugated mouse IgG1κ isotype control (Clone P3.6.2.8.1) | Thermo Fisher Scientific | Cat # 25-4714-42; RRID: AB_1548705 |
| PE-conjugated rat IgG1κ isotype control (Clone eBRG1) | Thermo Fisher Scientific | Cat # 12-4301-82; RRID: AB_470047 |
| PE-Cy7-conjugated rat IgG2bκ isotype control (Clone eB149/10H5) | Thermo Fisher Scientific | Cat # 25-4031-82; RRID: AB_891624 |
| eFluor660-conjugated rat IgG2aκ isotype control (Clone eBR2a) | Thermo Fisher Scientific | Cat # 50-4321-80; RRID: AB_10598640 |
| APC-eFluor780-conjugated rat IgG1κ isotype control (Clone eBRG1) | Thermo Fisher Scientific | Cat # 47-4301-80; RRID: AB_1271986 |
| PE-Cy7-conjugated rat IgG1κ isotype control (Clone R3-34) | BD Biosciences | Cat # 557645; RRID: AB_396762 |
| PE-Cy7-conjugated rat IgG1κ isotype control (Clone eBRG1) | Thermo Fisher Scientific | Cat # 25-4301-82; RRID: AB_470198 |
| PerCP-eFluor 710-conjugated rat IgG2aκ isotype control (Clone eBR2a) | Thermo Fisher Scientific | Cat # 46-4321-82; RRID: AB_1834455 |
| PE-conjugated mouse IgG2aκ isotype control (Clone G155-178) | BD Biosciences | Cat # 556653; RRID: AB_396517 |
| PE-Cy7-conjugated Armenian hamster IgG isotype control (Clone eBio299Arm) | Thermo Fisher Scientific | Cat # 25-4888-82; RRID: AB_470204 |
| FITC-conjugated Armenian hamster IgG isotype control (Clone eBio299Arm) | Thermo Fisher Scientific | Cat # 11-4888-85; RRID: AB_470038 |
| PE-conjugated rat IgG2bκ isotype control (Clone eB149/10H5) | Thermo Fisher Scientific | Cat # 12-4031-82; RRID: AB_470042 |
| Anti-mouse/rat tyrosine hydroxylase (polyclonal) | Abcam | Cat # ab117112 |
| Anti-mouse/rat/human/cow/fruit fly/sheep/plant/Xenopus/yeast/zebrafish β-actin (Clone mAbGEa) | Thermo Fisher Scientific | Cat # MA1-744; RRID: AB_2223496 |
| HRP-conjugated goat anti-Rabbit IgG (H+L) (Polyclonal) | Thermo Fisher Scientific | Cat # 31460; RRID: AB_228341 |
| HRP-conjugated goat anti-mouse IgG (H+L) (Polyclonal) | Thermo Fisher Scientific | Cat # 31430; RRID: AB_228307 |
| Anti-mouse TIGIT (Clone 1B4) | Cell Essentials, Inc. (Boston, MA): http://www.cell-essentials.com | Lot # 111704 |
| Mouse IgG1κ isotype control (Clone MOPC-21) | BioXCell | Cat # BE0083; RRID: AB_1107784 |
| Biological samples | ||
| Human tumor-free liver samples | This paper/University Hospital at London Health Sciences Centre | N/A |
| Healthy human blood samples | This paper | N/A |
| Chemicals, peptides, and recombinant proteins | ||
| APC- or PE-conjugated PBS-57-loaded mouse or human CD1d tetramer | NIH Tetramer Core Facility | N/A |
| APC- or PE-conjugated unloaded mouse or human CD1d tetramer | NIH Tetramer Core Facility | N/A |
| APC- or PE-conjugated 5-OP-RU-loaded mouse or human MR1 tetramer (Corbett et al., 2014) | NIH Tetramer Core Facility | N/A |
| APC- or PE-conjugated 6-FP-loaded mouse or human MR1 tetramer (Corbett et al., 2014) | NIH Tetramer Core Facility | N/A |
| αGC | Funakoshi | Cat # KRN7000 |
| αCGC | NIH Tetramer Core Facility | N/A |
| 5-amino-6-D-ribitylaminouracil (5-ARU) | Dr. Olivier Lantz | N/A |
| Methylglyoxal solution | Sigma-Aldrich | Cat # M0252 |
| Phorbol 12-myristate 13-acetate (PMA) | Sigma-Aldrich | Cat # P1585 |
| Ionomycin | Sigma-Aldrich | Cat # I9657 |
| Brefeldin A | Sigma-Aldrich | Cat # B7651 |
| Recombinant mouse GM-CSF | Peprotech | Cat # 315-03 |
| Recombinant mouse IL-4 | Peprotech | Cat # 214-14 |
| Recombinant mouse IL-12p70 | Peprotech | Cat # 210-12 |
| Recombinant mouse IL-18 | R&D Systems | Cat # 9139-IL-050 |
| 6-hydroxydopamine hydrobromide | Sigma-Aldrich | Cat # 162957 |
| Corticosterone | Sigma-Aldrich | Cat # 27840 |
| Hydrocortisone | Sigma-Aldrich | Cat # H0888 |
| Dexamethasone | Sigma-Aldrich | Cat # D4902 |
| Metyrapone | Sigma-Aldrich | Cat # M2696 |
| RU486 | Sigma-Aldrich | Cat # M8046 |
| Norepinephrine | Sigma-Aldrich | Cat # A7257 |
| Neuropeptide Y | Sigma-Aldrich | Cat # N5017 |
| Propranolol hydrochloride | Sigma-Aldrich | Cat # P0884 |
| Percoll PLUS | GE Healthcare | Cat # 17-5445-01 |
| Ficoll-Paque PLUS | GE Healthcare | Cat # 17-1440-02 |
| Na251CrO4 | PerkinElmer | Cat # NEZ030S001MC |
| Triton X-100 | Sigma-Aldrich | Cat # T8787 |
| XenoLight D-Luciferin | PerkinElmer | Cat # 127799 |
| 7-aminoactinomycin D (7-AAD) viability dye | Thermo Fisher Scientific | Cat # 00-6993-50 |
| Critical commercial assays | ||
| Amersham ECL Prime Western Blotting Detection Reagent | GE Healthcare | Cat # RPN2232 |
| eBioscience Ready-SET-Go! Mouse IFN-γ ELISA Kit | Thermo Fisher Scientific | Cat # 88-7314-88 |
| eBioscience Ready-SET-Go! Mouse IL-2 ELISA Kit | Thermo Fisher Scientific | Cat # 88-7024-88 |
| eBioscience Ready-SET-Go! Mouse IL-4 ELISA Kit | Thermo Fisher Scientific | Cat # 88-7044-88 |
| DetectX Corticosterone Enzyme Immunoassay Kit | Arbor Assays | Cat # K014-H1 |
| Intracellular Fixation & Permeabilization Buffer Set | Thermo Fisher Scientific | Cat # 88-8824-00 |
| Foxp3/Transcription Factor Staining Buffer Set | Thermo Fisher Scientific | Cat # 00-5523-00 |
| FITC CaspaTag Pan-Caspase In Situ Assay Kit | EMD Millipore | Cat # APT420 |
| EasySep Mouse CD11c Positive Selection Kit II | STEMCELL Technologies | Cat# 18780A |
| PureLink RNA Mini Kit | Thermo Fisher Scientific | Cat# 12183018A |
| SuperScript VILO cDNA Synthesis Kit | Thermo Fisher Scientific | Cat # 11755-050 |
| Taqman Fast Advanced Master Mix | Thermo Fisher Scientific | Cat # 4444557 |
| CellTrace CFSE Cell Proliferation Kit | Thermo Fisher Scientific | Cat # C34554 |
| Experimental models: Cell lines | ||
| Mouse: YAC-1 lymphoma cells | ATCC | Cat # TIB-160; RRID: CVCL_2244 |
| Mouse: B16-F10 melanoma cells | Dr. Ann Chambers, Western University | Available from ATCC (Cat # CRL-6475; RRID: CVCL_0159) |
| Mouse: B16-F10-Red-FLuc (B16-FLuc) melanoma cells | PerkinElmer | Cat # BW124734 |
| Mouse: DN32.D3 hybridoma cells | Dr. Albert Bendelac, University of Chicago | N/A |
| Experimental models: Organisms/strains | ||
| Mouse: C57BL/6 | Charles River Canada | Cat # 027; RRID: IMSR_CRL:027 |
| Mouse: BALB/c | Charles River Canada | Cat # 028; RRID: IMSR_CRL:028 |
| Mouse: β2M−/−: B6.129P2-B2mtm1Unc/DcrJ | Dr. Anthony Jevnikar, Western University | Available from The Jackson Laboratory (Cat # 002087; RRID: IMSR_JAX:002087) |
| Mouse: B6 albino: B6(Cg)-Tyrc-2J/J | The Jackson Laboratory | Cat # 000058; RRID: IMSR_JAX:000058 |
| Mouse: B6.Nr3c1fl/fl: B6.Cg-Nr3c1tm1.1Jda/J | The Jackson Laboratory | Cat # 021021; RRID: IMSR_JAX:021021 |
| Mouse: B6.Lckcre/cre: B6.Cg-Tg(Lck-cre)548Jxm/J | The Jackson Laboratory | Cat # 003802; RRID: IMSR_JAX:003802 |
| Mouse: Nr3c1flLckcre: B6.Nr3c1fl/flLckcre/wt | This paper | N/A |
| Mouse: Lckcre: B6.Lckcre/wt | This paper | N/A |
| Mouse: B6-MAITCAST (Cui et al., 2015) | Dr. Olivier Lantz | N/A |
| Mouse: MR1−/− B6-MAITCAST (Cui et al., 2015) | Dr. Olivier Lantz | N/A |
| Oligonucleotides | ||
| See Table S1 for qPCR primer/probe sets | Thermo Fisher Scientific | N/A |
| Software and algorithms | ||
| FlowJo version 10.0.7 software | Tree Star | https://www.flowjo.com/ |
| Image Studio version 3.1.4 software | LI-COR Biosciences | https://www.licor.com/bio/image-studio/ |
| LivingImage software | PerkinElmer | https://www.perkinelmer.com/product/spectrum-200-living-image-v4series-1-128113 |
| GraphPad Prism version 6.0 software | GraphPad | https://www.graphpad.com/ |
Quantitative PCR analyses
Hepatic iNKT and/or Tconv cells from ≥ 5 stressed or control mice were sorted to 100% purity using a BD FACSAria III Cell Sorter. Total RNA was isolated using a PureLink RNA Mini Kit (Thermo Scientific), and cDNA was synthesized using a SuperScript VILO cDNA Synthesis Kit (Thermo Scientific). Taqman Fast Advanced Master Mix (Applied Biosystems) was added to each cDNA sample, and the resulting mixture was plated in Custom Taqman Array Fast Plates (Thermo Scientific) containing probe/primer sets listed in Table S1. Cycle threshold (Ct) values from amplified transcripts were generated using a StepOne Plus Real-Time PCR instrument (Applied Biosystems). Normalized Ct (ΔCt) values were calculated by subtracting each Ct value by that of Actb and/or Tbp. The following formula was used to determine the relative mRNA content of the cells: Fold Change = 2−(ΔΔCt).
Generation of bone marrow-derived dendritic cells (BMDCs)
Marrow cells were flushed out of femurs and tibias of B6 mice and depleted of erythrocytes. Cells were then washed, filtered and placed inside a T75 polystyrene flask at a density of 1 × 10⁶ cells/mL of complete medium supplemented with 10 ng/mL each of recombinant mouse GM-CSF and IL-4 (Peprotech, Rocky Hill, NJ). Cultures were maintained for 6 days at 37°C in a humidified atmosphere containing 6% CO2. Every other day, non-adherent cells were discarded, and cultures were replenished with fresh medium, GM-CSF and IL-4. Upon completion of the culture, cells were harvested using a cell scraper and CD11c+ BMDCs were magnetically enriched using an EasySep Mouse CD11c Positive Selection Kit II (STEMCELL Technologies).
Ex vivo and in vitro treatments and stimulations
DN32.D3 cells were seeded at 1 × 10⁵ cells/well of a U-bottom microplate and treated for 20 minutes with NE (0.1–10 μM) or NPY (10−6–1 μM), both from Sigma-Aldrich, before they were stimulated with 100 ng/mL of αGC. Where indicated, cells were pretreated with 10 μM propranolol hydrochloride (Sigma-Aldrich) for 20 minutes before they were exposed to NE. After 24 h at 37°C, cell viability was assessed by 7-AAD staining, and the IL-2 content of supernatants was measured by ELISA.
Hepatic mouse iNKT cells were FACS-sorted from ≥ 5 stressed animals or controls. In a U-bottom microplate, iNKT cells were mixed with purified CD11c+ BMDCs at an iNKT:DC ratio of 2:1. Co-cultures were stimulated with 100 ng/mL of αGC for 24 h at 37°C, after which cell-free supernatants were stored at −20°C for subsequent cytokine measurements.
In indicated experiments, HMNCs and splenocytes were seeded at 5 × 10⁵ cells/well in a microplate and stimulated with 15 ng/mL of PMA plus 500 ng/mL of ionomycin in the presence of 10 μg/mL brefeldin A, all of which were purchased from Sigma-Aldrich. After 2 h at 37°C, cells were washed and stained for intracellular cytokines.
Hydrocortisone (HC) and dexamethasone (DEX) were purchased from Sigma-Aldrich, dissolved in absolute ethanol and diluted in RPMI 1640. In a U-bottom microplate, 1 × 10⁵ human HMNCs/well or 5 × 10⁵ human PBMCs/well were incubated for 24 h at 37°C in complete medium containing 0.01–10 μM HC or DEX.
51-chromium (51Cr) release assay
YAC-1 target cells were incubated for 90 minutes at 37°C with 100 μCi Na251CrO4 (PerkinElmer). Labeled target cells were washed and then co-cultured at indicated effector:target ratios with splenocytes from stressed or control B6 mice that had received αGC or vehicle 24 hours before cytotoxicity assays. Cell-free supernatants were collected 4 h later, in which the 51Cr activity was quantified using a PerkinElmer Wizard 1470 Automatic Gamma Counter. Experimental release (ER) values were obtained from wells in which effector and target cells were both present. Spontaneous release (SR) and total release (TR) were measured from wells containing medium alone or 1% Triton X-100, respectively. Cytotoxicity was calculated using the following formula: % specific lysis = [(ER-SR) ÷ (TR-SR)] × 100.
In vivo killing assay
Donor splenocytes from WT B6 and β2M−/− mice were labeled with 0.2 μM and 2 μM 5-(and-6)-carboxyfluorescein diacetate N-succinimidyl ester (CFSE), respectively, and used as target cells. Cells were washed, mixed at a 1:1 ratio, and analyzed by flow cytometry before injection. Approximately 1 × 10⁷ cells from the resulting suspension were injected i.v. into stressed recipients that were treated with αGC or vehicle. Two h later, animals were sacrificed for their spleen in which the remaining CFSEhi and CFSElo target cells were traced by flow cytometry. In vivo killing was calculated using the following formula: % specific killing = {1 - [(CFSEhi events in recipient ÷ CFSElo events in recipient) ÷ (CFSEhi events pre-injection ÷ CFSElo events pre-injection)]} × 100 as we previously described (Choi et al., 2019).
Metastatic melanoma model
Six h after administration of αGC or vehicle, stressed and control B6 mice received between 2.5 × 10⁵ – 1 × 10⁶ B16-F10 cells in 200 μL PBS i.v. Fourteen days later, lungs were harvested for digital imaging, and distinct tumor nodules on each lung were visually counted. Lungs harboring > 400 nodules were deemed to carry too many nodules for accurate enumeration. Therefore, they were conservatively represented as containing at least 400 nodules.
As an alternative method of measuring the metastatic tumor burden, B6 albino mice were injected with 5 × 10⁵ B16-FLuc cells. After 21 days, they were anaesthetized with isoflurane and injected i.p. with 3 mg XenoLight D-Luciferin (PerkinElmer) in PBS. For up to 35 minutes thereafter, whole body bioluminescence imaging was conducted in an IVIS Lumina XRMS In Vivo Imaging System (PerkinElmer).
QUANTIFICATION AND STATISTICAL ANALYSIS
Flow cytometry results were analyzed using FlowJo version 10.0.7 software (Tree Star, Ashland, OR). The relative pixel intensities of bands in western blot images were quantified using Image Studio version 3.1.4 software. For bioluminescence imaging, total signal (photons/second/cm2/steradian) was quantified by region-of-interest analysis using LivingImage software (PerkinElmer).
Throughout this investigation, objective quantification methods, as opposed to subjective scoring, were used. Therefore, blinding was not necessary. Sufficient sample sizes were not statistically predetermined but were consistent with those from comparable studies and based on our prior experience.
Student’s t tests or one- or two-way ANOVA were employed, as appropriate, using GraphPad Prism version 6.0 software (La Jolla, CA). *, **, *** and **** denote statistically significant differences with p < 0.05, p < 0.01, p < 0.001 and p < 0.0001, respectively. Details related to sample sizes, measures of dispersion and the specific statistical tests used can be found in figure legends.
Supplementary Material
Highlights.
iT cells are unusually refractory to stress- and glucocorticoid-induced apoptosis
Chronic stress curbs both TH1- and TH2-type responses orchestrated by iT cells
Stress incapacitates iNKT cells via intrinsic glucocorticoid receptor signaling
Stress-elicited glucocorticoids impair the antitumor activity of iNKT cells
ACKNOWLEDGMENTS
This work was funded through a Discovery Grant (04706-2019 RGPIN) from the Natural Sciences and Engineering Research Council of Canada (NSERC; to S.M.M.H.). P.T.R. is a recipient of an Alexander Graham Bell Canada Graduate Scholarship (CGS-Doctoral) from NSERC. J.C. was supported by a Careers in Immunology Fellowship from the American Association of Immunologists. V.K.K. is supported by National Institutes of Health grant R01 AI139536. O.L. is partly funded by European Research Council grant ERC-ADG-885435 and Agence Nationale de la Recherche (MAIT). Tunyalux Langsub assisted with figure preparation.
Footnotes
DECLARATION OF INTERESTS
The authors declare no competing interests.
SUPPLEMENTAL INFORMATION
Supplemental information can be found online at https://doi.org/10.1016/j.celrep.2021.108979.
REFERENCES
- Batty GD, Russ TC, Stamatakis E, and Kivimäki M (2017). Psychological distress in relation to site specific cancer mortality: pooling of unpublished data from 16 prospective cohort studies. BMJ 356, j108. [DOI] [PMC free article] [PubMed] [Google Scholar]
- Bereshchenko O, Migliorati G, Bruscoli S, and Riccardi C (2019). Glucocorticoid-induced leucine zipper: a novel anti-inflammatory molecule. Front. Pharmacol. 10, 308. [DOI] [PMC free article] [PubMed] [Google Scholar]
- Bernin H, Fehling H, Marggraff C, Tannich E, and Lotter H (2016). The cytokine profile of human NKT cells and PBMCs is dependent on donor sex and stimulus. Med. Microbiol. Immunol. (Berl.) 205, 321–332. [DOI] [PMC free article] [PubMed] [Google Scholar]
- Blumenfeld HJ, Tohn R, Haeryfar SM, Liu Y, Savage PB, and Delovitch TL (2011). Structure-guided design of an invariant natural killer T cell agonist for optimum protection from type 1 diabetes in non-obese diabetic mice. Clin. Exp. Immunol. 166, 121–133. [DOI] [PMC free article] [PubMed] [Google Scholar]
- Bucsek MJ, Qiao G, MacDonald CR, Giridharan T, Evans L, Niedzwecki B, Liu H, Kokolus KM, Eng JW, Messmer MN, et al. (2017). β-adrenergic signaling in mice housed at standard temperatures suppresses an effector phenotype in CD8+ T cells and undermines checkpoint inhibitor therapy. Cancer Res. 77, 5639–5651. [DOI] [PMC free article] [PubMed] [Google Scholar]
- Buttari B, Profumo E, Domenici G, Tagliani A, Ippoliti F, Bonini S, Businaro R, Elenkov I, and Riganò R (2014). Neuropeptide Y induces potent migration of human immature dendritic cells and promotes a Th2 polarization. FASEB J. 28, 3038–3049. [DOI] [PubMed] [Google Scholar]
- Buynitsky T, and Mostofsky DI (2009). Restraint stress in biobehavioral research: recent developments. Neurosci. Biobehav. Rev. 33, 1089–1098. [DOI] [PubMed] [Google Scholar]
- Cain DW, and Cidlowski JA (2017). Immune regulation by glucocorticoids. Nat. Rev. Immunol. 17, 233–247. [DOI] [PMC free article] [PubMed] [Google Scholar]
- Calcagni E, and Elenkov I (2006). Stress system activity, innate and T helper cytokines, and susceptibility to immune-related diseases. Ann. N Y Acad. Sci. 1069, 62–76. [DOI] [PubMed] [Google Scholar]
- Cao L, Filipov NM, and Lawrence DA (2002). Sympathetic nervous system plays a major role in acute cold/restraint stress inhibition of host resistance to Listeria monocytogenes. J. Neuroimmunol. 125, 94–102. [DOI] [PubMed] [Google Scholar]
- Chatila T, Silverman L, Miller R, and Geha R (1989). Mechanisms of T cell activation by the calcium ionophore ionomycin. J. Immunol. 143, 1283–1289. [PubMed] [Google Scholar]
- Chida Y, Hamer M, Wardle J, and Steptoe A (2008). Do stress-related psychosocial factors contribute to cancer incidence and survival? Nat. Clin. Pract. Oncol. 5, 466–475. [DOI] [PubMed] [Google Scholar]
- Choi J, Rudak PT, Lesage S, and Haeryfar SMM (2019). Glycolipid stimulation of invariant NKT cells expands a unique tissue-resident population of precursors to mature NK cells endowed with oncolytic and antimetastatic properties. J. Immunol. 203, 1808–1819. [DOI] [PubMed] [Google Scholar]
- Corbett AJ, Eckle SB, Birkinshaw RW, Liu L, Patel O, Mahony J, Chen Z, Reantragoon R, Meehan B, Cao H, et al. (2014). T-cell activation by transitory neo-antigens derived from distinct microbial pathways. Nature 509, 361–365. [DOI] [PubMed] [Google Scholar]
- Crowe NY, Uldrich AP, Kyparissoudis K, Hammond KJ, Hayakawa Y, Sidobre S, Keating R, Kronenberg M, Smyth MJ, and Godfrey DI (2003). Glycolipid antigen drives rapid expansion and sustained cytokine production by NK T cells. J. Immunol. 171, 4020–4027. [DOI] [PubMed] [Google Scholar]
- Cui Y, Franciszkiewicz K, Mburu YK, Mondot S, Le Bourhis L, Premel V, Martin E, Kachaner A, Duban L, Ingersoll MA, et al. (2015). Mucosal-associated invariant T cell-rich congenic mouse strain allows functional evaluation. J. Clin. Invest. 125, 4171–4185. [DOI] [PMC free article] [PubMed] [Google Scholar]
- D’Andrea A, Goux D, De Lalla C, Koezuka Y, Montagna D, Moretta A, Dellabona P, Casorati G, and Abrignani S (2000). Neonatal invariant Valpha24+ NKT lymphocytes are activated memory cells. Eur. J. Immunol. 30, 1544–1550. [DOI] [PubMed] [Google Scholar]
- Das R, Sant’Angelo DB, and Nichols KE (2010). Transcriptional control of invariant NKT cell development. Immunol. Rev. 238, 195–215. [DOI] [PMC free article] [PubMed] [Google Scholar]
- de Lalla C, Festuccia N, Albrecht I, Chang HD, Andolfi G, Benninghoff U, Bombelli F, Borsellino G, Aiuti A, Radbruch A, et al. (2008). Innate-like effector differentiation of human invariant NKT cells driven by IL-7. J. Immunol. 180, 4415–4424. [DOI] [PubMed] [Google Scholar]
- Dhabhar FS, Malarkey WB, Neri E, and McEwen BS (2012). Stress-induced redistribution of immune cells—from barracks to boulevards to battlefields: a tale of three hormones—Curt Richter Award winner. Psycho-neuroendocrinology 37, 1345–1368. [DOI] [PMC free article] [PubMed] [Google Scholar]
- Diaz-Salazar C, Bou-Puerto R, Mujal AM, Lau CM, von Hoesslin M, Zehn D, and Sun JC (2020). Cell-intrinsic adrenergic signaling controls the adaptive NK cell response to viral infection. J. Exp. Med. 217, e20190549. [DOI] [PMC free article] [PubMed] [Google Scholar]
- Dusseaux M, Martin E, Serriari N, Péguillet I, Premel V, Louis D, Milder M, Le Bourhis L, Soudais C, Treiner E, and Lantz O (2011). Human MAIT cells are xenobiotic-resistant, tissue-targeted, CD161hi IL-17-secreting T cells. Blood 117, 1250–1259. [DOI] [PubMed] [Google Scholar]
- Elenkov IJ, Wilder RL, Chrousos GP, and Vizi ES (2000). The sympathetic nerve—an integrative interface between two supersystems: the brain and the immune system. Pharmacol. Rev. 52, 595–638. [PubMed] [Google Scholar]
- Engeland WC, and Arnhold MM (2005). Neural circuitry in the regulation of adrenal corticosterone rhythmicity. Endocrine 28, 325–332. [DOI] [PubMed] [Google Scholar]
- Flint MS, and Tinkle SS (2001). C57BL/6 mice are resistant to acute restraint modulation of cutaneous hypersensitivity. Toxicol. Sci. 62, 250–256. [DOI] [PubMed] [Google Scholar]
- Franciszkiewicz K, Salou M, Legoux F, Zhou Q, Cui Y, Bessoles S, and Lantz O (2016). MHC class I-related molecule, MR1, and mucosal-associated invariant T cells. Immunol. Rev. 272, 120–138. [DOI] [PubMed] [Google Scholar]
- Franco AJ, Chen C, Scullen T, Zsombok A, Salahudeen AA, Di S, Herman JP, and Tasker JG (2016). Sensitization of the hypothalamic-pituitary-adrenal axis in a male rat chronic stress model. Endocrinology 157, 2346–2355. [DOI] [PMC free article] [PubMed] [Google Scholar]
- Fujii SI, and Shimizu K (2019). Immune networks and therapeutic targeting of iNKT cells in cancer. Trends Immunol. 40, 984–997. [DOI] [PubMed] [Google Scholar]
- Fujii S, Shimizu K, Kronenberg M, and Steinman RM (2002). Prolonged IFN-gamma-producing NKT response induced with alpha-galactosylceramide-loaded DCs. Nat. Immunol. 3, 867–874. [DOI] [PubMed] [Google Scholar]
- Fujii S, Shimizu K, Hemmi H, Fukui M, Bonito AJ, Chen G, Franck RW, Tsuji M, and Steinman RM (2006). Glycolipid alpha-C-galactosylceramide is a distinct inducer of dendritic cell function during innate and adaptive immune responses of mice. Proc. Natl. Acad. Sci. USA 103, 11252–11257. [DOI] [PMC free article] [PubMed] [Google Scholar]
- Girotti M, Pace TW, Gaylord RI, Rubin BA, Herman JP, and Spencer RL (2006). Habituation to repeated restraint stress is associated with lack of stress-induced c-fos expression in primary sensory processing areas of the rat brain. Neuroscience 138, 1067–1081. [DOI] [PubMed] [Google Scholar]
- Glaser R, and Kiecolt-Glaser JK (2005). Stress-induced immune dysfunction: implications for health. Nat. Rev. Immunol. 5, 243–251. [DOI] [PubMed] [Google Scholar]
- Gourdy P, Araujo LM, Zhu R, Garmy-Susini B, Diem S, Laurell H, Leite-de-Moraes M, Dy M, Arnal JF, Bayard F, and Herbelin A (2005). Relevance of sexual dimorphism to regulatory T cells: estradiol promotes IFN-gamma production by invariant natural killer T cells. Blood 105, 2415–2420. [DOI] [PubMed] [Google Scholar]
- Haeryfar SM, and Berczi I (2001). The thymus and the acute phase response. Cell. Mol. Biol. 47, 145–156. [PubMed] [Google Scholar]
- Haeryfar SM, and Mallevaey T (2015). Editorial: CD1- and MR1-restricted T cells in antimicrobial immunity. Front. Immunol. 6, 611. [DOI] [PMC free article] [PubMed] [Google Scholar]
- Haeryfar SMM, Shaler CR, and Rudak PT (2018). Mucosa-associated invariant T cells in malignancies: a faithful friend or formidable foe? Cancer Immunol. Immunother. 67, 1885–1896. [DOI] [PMC free article] [PubMed] [Google Scholar]
- Hayakawa Y, Takeda K, Yagita H, Kakuta S, Iwakura Y, Van Kaer L, Saiki I, and Okumura K (2001). Critical contribution of IFN-gamma and NK cells, but not perforin-mediated cytotoxicity, to anti-metastatic effect of alpha-galactosylceramide. Eur. J. Immunol. 31, 1720–1727. [PubMed] [Google Scholar]
- Herold MJ, McPherson KG, and Reichardt HM (2006). Glucocorticoids in T cell apoptosis and function. Cell. Mol. Life Sci. 63, 60–72. [DOI] [PMC free article] [PubMed] [Google Scholar]
- Hou N, Zhang X, Zhao L, Zhao X, Li Z, Song T, and Huang C (2013). A novel chronic stress-induced shift in the Th1 to Th2 response promotes colon cancer growth. Biochem. Biophys. Res. Commun. 439, 471–476. [DOI] [PubMed] [Google Scholar]
- Hu D, Wan L, Chen M, Caudle Y, LeSage G, Li Q, and Yin D (2014). Essential role of IL-10/STAT3 in chronic stress-induced immune suppression. Brain Behav. Immun. 36, 118–127. [DOI] [PMC free article] [PubMed] [Google Scholar]
- Johnston RJ, Comps-Agrar L, Hackney J, Yu X, Huseni M, Yang Y, Park S, Javinal V, Chiu H, Irving B, et al. (2014). The immunoreceptor TIGIT regulates antitumor and antiviral CD8(+) T cell effector function. Cancer Cell 26, 923–937. [DOI] [PubMed] [Google Scholar]
- Kamiya A, Hayama Y, Kato S, Shimomura A, Shimomura T, Irie K, Kaneko R, Yanagawa Y, Kobayashi K, and Ochiya T (2019). Genetic manipulation of autonomic nerve fiber innervation and activity and its effect on breast cancer progression. Nat. Neurosci. 22, 1289–1305. [DOI] [PubMed] [Google Scholar]
- Kawano T, Cui J, Koezuka Y, Toura I, Kaneko Y, Motoki K, Ueno H, Nakagawa R, Sato H, Kondo E, et al. (1997). CD1d-restricted and TCR-mediated activation of valpha14 NKT cells by glycosylceramides. Science 278, 1626–1629. [DOI] [PubMed] [Google Scholar]
- Keller AN, Eckle SB, Xu W, Liu L, Hughes VA, Mak JY, Meehan BS, Pediongco T, Birkinshaw RW, Chen Z, et al. (2017). Drugs and drug-like molecules can modulate the function of mucosal-associated invariant T cells. Nat. Immunol. 18, 402–411. [DOI] [PubMed] [Google Scholar]
- Kelly J, Minoda Y, Meredith T, Cameron G, Philipp MS, Pellicci DG, Corbett AJ, Kurts C, Gray DH, Godfrey DI, et al. (2019). Chronically stimulated human MAIT cells are unexpectedly potent IL-13 producers. Immunol. Cell Biol. 97, 689–699. [DOI] [PMC free article] [PubMed] [Google Scholar]
- Kjer-Nielsen L, Patel O, Corbett AJ, Le Nours J, Meehan B, Liu L, Bhati M, Chen Z, Kostenko L, Reantragoon R, et al. (2012). MR1 presents microbial vitamin B metabolites to MAIT cells. Nature 491, 717–723. [DOI] [PubMed] [Google Scholar]
- Kokolus KM, Capitano ML, Lee CT, Eng JW, Waight JD, Hylander BL, Sexton S, Hong CC, Gordon CJ, Abrams SI, and Repasky EA (2013). Baseline tumor growth and immune control in laboratory mice are significantly influenced by subthermoneutral housing temperature. Proc. Natl. Acad. Sci. USA 110, 20176–20181. [DOI] [PMC free article] [PubMed] [Google Scholar]
- Kurioka A, Jahun AS, Hannaway RF, Walker LJ, Fergusson JR, Sverremark-Ekström E, Corbett AJ, Ussher JE, Willberg CB, and Klenerman P (2017). Shared and distinct phenotypes and functions of human CD161++ Vα7.2+ T cell subsets. Front. Immunol. 8, 1031. [DOI] [PMC free article] [PubMed] [Google Scholar]
- Kvetnansky R, Sun CL, Lake CR, Thoa N, Torda T, and Kopin IJ (1978). Effect of handling and forced immobilization on rat plasma levels of epinephrine, norepinephrine, and dopamine-beta-hydroxylase. Endocrinology 103, 1868–1874. [DOI] [PubMed] [Google Scholar]
- Kvetnansky R, Fukuhara K, Pacák K, Cizza G, Goldstein DS, and Kopin IJ (1993). Endogenous glucocorticoids restrain catecholamine synthesis and release at rest and during immobilization stress in rats. Endocrinology 133, 1411–1419. [DOI] [PubMed] [Google Scholar]
- Lantz O, and Bendelac A (1994). An invariant T cell receptor alpha chain is used by a unique subset of major histocompatibility complex class I-specific CD4+ and CD4−8− T cells in mice and humans. J. Exp. Med. 180, 1097–1106. [DOI] [PMC free article] [PubMed] [Google Scholar]
- Lee HC, Shibata H, Ogawa S, Maki K, and Ikuta K (2005). Transcriptional regulation of the mouse IL-7 receptor alpha promoter by glucocorticoid receptor. J. Immunol. 174, 7800–7806. [DOI] [PubMed] [Google Scholar]
- Leeansyah E, Svärd J, Dias J, Buggert M, Nyström J, Quigley MF, Moll M, Sönnerborg A, Nowak P, and Sandberg JK (2015). Arming of MAIT cell cytolytic antimicrobial activity is induced by IL-7 and defective in HIV-1 infection. PLoS Pathog. 11, e1005072. [DOI] [PMC free article] [PubMed] [Google Scholar]
- Legoux F, Salou M, and Lantz O (2017). Unconventional or preset αβ T cells: evolutionarily conserved tissue-resident T cells recognizing nonpeptidic ligands. Annu. Rev. Cell Dev. Biol. 33, 511–535. [DOI] [PubMed] [Google Scholar]
- Lepore M, Kalinichenko A, Colone A, Paleja B, Singhal A, Tschumi A, Lee B, Poidinger M, Zolezzi F, Quagliata L, et al. (2014). Parallel T-cell cloning and deep sequencing of human MAIT cells reveal stable oligoclonal TCRβ repertoire. Nat. Commun. 5, 3866. [DOI] [PubMed] [Google Scholar]
- Levi B, Benish M, Goldfarb Y, Sorski L, Melamed R, Rosenne E, and Ben-Eliyahu S (2011). Continuous stress disrupts immunostimulatory effects of IL-12. Brain Behav. Immun. 25, 727–735. [DOI] [PMC free article] [PubMed] [Google Scholar]
- Lisbonne M, Hachem P, Tonanny MB, Fourneau JM, Sidobre S, Kronenberg M, Van Endert P, Dy M, Schneider E, and Leite-de-Moraes MC (2004). In vivo activation of invariant V alpha 14 natural killer T cells by alpha-galactosylceramide sequentially induces Fas-dependent and -independent cytotoxicity. Eur. J. Immunol. 34, 1381–1388. [DOI] [PubMed] [Google Scholar]
- Matsuda JL, Mallevaey T, Scott-Browne J, and Gapin L (2008). CD1drestricted iNKT cells, the ‘Swiss-army knife’ of the immune system. Curr. Opin. Immunol. 20, 358–368. [DOI] [PMC free article] [PubMed] [Google Scholar]
- Mills CD, Kincaid K, Alt JM, Heilman MJ, and Hill AM (2000). M-1/M-2 macrophages and the Th1/Th2 paradigm. J. Immunol. 164, 6166–6173.10843666 [Google Scholar]
- Monczor F, Chatzopoulou A, Zappia CD, Houtman R, Meijer OC, and Fitzsimons CP (2019). A model of glucocorticoid receptor interaction with coregulators predicts transcriptional regulation of target genes. Front. Pharmacol. 10, 214. [DOI] [PMC free article] [PubMed] [Google Scholar]
- Nakagawa R, Inui T, Nagafune I, Tazunoki Y, Motoki K, Yamauchi A, Hirashima M, Habu Y, Nakashima H, and Seki S (2004). Essential role of bystander cytotoxic CD122+CD8+ T cells for the antitumor immunity induced in the liver of mice by alpha-galactosylceramide. J. Immunol. 172, 6550–6557. [DOI] [PubMed] [Google Scholar]
- Nissen MD, Sloan EK, and Mattarollo SR (2018). β-adrenergic signaling impairs antitumor CD8+ T-cell responses to B-cell lymphoma immunotherapy. Cancer Immunol. Res. 6, 98–109. [DOI] [PubMed] [Google Scholar]
- Park SH, Benlagha K, Lee D, Balish E, and Bendelac A (2000). Unaltered phenotype, tissue distribution and function of Valpha14(+) NKT cells in germ-free mice. Eur. J. Immunol. 30, 620–625. [DOI] [PubMed] [Google Scholar]
- Partecke LI, Speerforck S, Käding A, Seubert F, Kühn S, Lorenz E, Schwandke S, Sendler M, Keßler W, Trung DN, et al. (2016). Chronic stress increases experimental pancreatic cancer growth, reduces survival and can be antagonised by beta-adrenergic receptor blockade. Pancreatology 16, 423–433. [DOI] [PubMed] [Google Scholar]
- Prod’homme T, Weber MS, Steinman L, and Zamvil SS (2006). A neuropeptide in immune-mediated inflammation, Y? Trends Immunol. 27, 164–167. [DOI] [PubMed] [Google Scholar]
- Pruett SB (2003). Stress and the immune system. Pathophysiology 9, 133–153. [DOI] [PubMed] [Google Scholar]
- Rahimpour A, Koay HF, Enders A, Clanchy R, Eckle SB, Meehan B, Chen Z, Whittle B, Liu L, Fairlie DP, et al. (2015). Identification of phenotypically and functionally heterogeneous mouse mucosal-associated invariant T cells using MR1 tetramers. J. Exp. Med. 212, 1095–1108. [DOI] [PMC free article] [PubMed] [Google Scholar]
- Ronchetti S, Migliorati G, and Riccardi C (2015). GILZ as a mediator of the anti-inflammatory effects of glucocorticoids. Front. Endocrinol. (Lausanne) 6, 170. [DOI] [PMC free article] [PubMed] [Google Scholar]
- Rudak PT, Choi J, and Haeryfar SMM (2018). MAIT cell-mediated cytotoxicity: roles in host defense and therapeutic potentials in infectious diseases and cancer. J. Leukoc. Biol. 104, 473–486. [DOI] [PubMed] [Google Scholar]
- Rudak PT, Gangireddy R, Choi J, Burhan AM, Summers KL, Jackson DN, Inoue W, and Haeryfar SMM (2019). Stress-elicited glucocorticoid receptor signaling upregulates TIGIT in innate-like invariant T lymphocytes. Brain Behav. Immun. 80, 793–804. [DOI] [PubMed] [Google Scholar]
- Salio M, Gasser O, Gonzalez-Lopez C, Martens A, Veerapen N, Gileadi U, Verter JG, Napolitani G, Anderson R, Painter G, et al. (2017). Activation of human mucosal-associated invariant T cells induces CD40L-dependent maturation of monocyte-derived and primary dendritic cells. J. Immunol. 199, 2631–2638. [DOI] [PMC free article] [PubMed] [Google Scholar]
- Salou M, Legoux F, Gilet J, Darbois A, du Halgouet A, Alonso R, Richer W, Goubet AG, Daviaud C, Menger L, et al. (2019). A common transcriptomic program acquired in the thymus defines tissue residency of MAIT and NKT subsets. J. Exp. Med. 216, 133–151. [DOI] [PMC free article] [PubMed] [Google Scholar]
- Saul AN, Oberyszyn TM, Daugherty C, Kusewitt D, Jones S, Jewell S, Malarkey WB, Lehman A, Lemeshow S, and Dhabhar FS (2005). Chronic stress and susceptibility to skin cancer. J. Natl. Cancer Inst. 97, 1760–1767. [DOI] [PMC free article] [PubMed] [Google Scholar]
- Schmieg J, Yang G, Franck RW, and Tsuji M (2003). Superior protection against malaria and melanoma metastases by a C-glycoside analogue of the natural killer T cell ligand alpha-galactosylceramide. J. Exp. Med. 198, 1631–1641. [DOI] [PMC free article] [PubMed] [Google Scholar]
- Schober A (2004). Classic toxin-induced animal models of Parkinson’s disease: 6-OHDA and MPTP. Cell Tissue Res. 318, 215–224. [DOI] [PubMed] [Google Scholar]
- Smyth MJ, Crowe NY, Pellicci DG, Kyparissoudis K, Kelly JM, Takeda K, Yagita H, and Godfrey DI (2002). Sequential production of interferon-gamma by NK1.1(+) T cells and natural killer cells is essential for the antimetastatic effect of alpha-galactosylceramide. Blood 99, 1259–1266. [DOI] [PubMed] [Google Scholar]
- Sommershof A, Scheuermann L, Koerner J, and Groettrup M (2017). Chronic stress suppresses anti-tumor TCD8+ responses and tumor regression following cancer immunotherapy in a mouse model of melanoma. Brain Behav. Immun. 65, 140–149. [DOI] [PubMed] [Google Scholar]
- Straub RH, Schaller T, Miller LE, von Hörsten S, Jessop DS, Falk W, and Schölmerich J (2000). Neuropeptide Y cotransmission with norepinephrine in the sympathetic nerve-macrophage interplay. J. Neurochem. 75, 2464–2471. [DOI] [PubMed] [Google Scholar]
- Tamada K, Harada M, Abe K, Li T, and Nomoto K (1998). IL-4-producing NK1.1+ T cells are resistant to glucocorticoid-induced apoptosis: implications for the Th1/Th2 balance. J. Immunol. 161, 1239–1247. [PubMed] [Google Scholar]
- Tang XZ, Jo J, Tan AT, Sandalova E, Chia A, Tan KC, Lee KH, Gehring AJ, De Libero G, and Bertoletti A (2013). IL-7 licenses activation of human liver intrasinusoidal mucosal-associated invariant T cells. J. Immunol. 190, 3142–3152. [DOI] [PubMed] [Google Scholar]
- Taves MD, and Ashwell JD (2020). Glucocorticoids in T cell development, differentiation and function. Nat. Rev. Immunol. Published online November 4, 2020. 10.1038/s41577-020-00464-0. [DOI] [PubMed] [Google Scholar]
- Treiner E, Duban L, Bahram S, Radosavljevic M, Wanner V, Tilloy F, Affaticati P, Gilfillan S, and Lantz O (2003). Selection of evolutionarily conserved mucosal-associated invariant T cells by MR1. Nature 422, 164–169. [DOI] [PubMed] [Google Scholar]
- Tseng RJ, Padgett DA, Dhabhar FS, Engler H, and Sheridan JF (2005). Stress-induced modulation of NK activity during influenza viral infection: role of glucocorticoids and opioids. Brain Behav. Immun. 19, 153–164. [DOI] [PubMed] [Google Scholar]
- Tyznik AJ, Tupin E, Nagarajan NA, Her MJ, Benedict CA, and Kronenberg M (2008). Cutting edge: the mechanism of invariant NKT cell responses to viral danger signals. J. Immunol. 181, 4452–4456. [DOI] [PMC free article] [PubMed] [Google Scholar]
- van den Heuvel MJ, Garg N, Van Kaer L, and Haeryfar SM (2011). NKT cell costimulation: experimental progress and therapeutic promise. Trends Mol. Med. 17, 65–77. [DOI] [PMC free article] [PubMed] [Google Scholar]
- Van Laethem F, Baus E, Smyth LA, Andris F, Bex F, Urbain J, Kioussis D, and Leo O (2001). Glucocorticoids attenuate T cell receptor signaling. J. Exp. Med. 193, 803–814. [DOI] [PMC free article] [PubMed] [Google Scholar]
- van Wilgenburg B, Scherwitzl I, Hutchinson EC, Leng T, Kurioka A, Kulicke C, de Lara C, Cole S, Vasanawathana S, Limpitikul W, et al. ; STOPHCV Consortium (2016). MAIT cells are activated during human viral infections. Nat. Commun. 7, 11653. [DOI] [PMC free article] [PubMed] [Google Scholar]
- Velázquez P, Cameron TO, Kinjo Y, Nagarajan N, Kronenberg M, and Dustin ML (2008). Cutting edge: activation by innate cytokines or microbial antigens can cause arrest of natural killer T cell patrolling of liver sinusoids. J. Immunol. 180, 2024–2028. [DOI] [PubMed] [Google Scholar]
- Watanabe H, Numata K, Ito T, Takagi K, and Matsukawa A (2004). Innate immune response in Th1- and Th2-dominant mouse strains. Shock 22, 460–466. [DOI] [PubMed] [Google Scholar]
- Wieduwild E, Girard-Madoux MJ, Quatrini L, Laprie C, Chasson L, Rossignol R, Bernat C, Guia S, and Ugolini S (2020). β2-adrenergic signals downregulate the innate immune response and reduce host resistance to viral infection. J. Exp. Med. 217, e20190554. [DOI] [PMC free article] [PubMed] [Google Scholar]
- Wong CH, Jenne CN, Lee WY, Léger C, and Kubes P (2011). Functional innervation of hepatic iNKT cells is immunosuppressive following stroke. Science 334, 101–105. [DOI] [PubMed] [Google Scholar]
- Yang H, Xia L, Chen J, Zhang S, Martin V, Li Q, Lin S, Chen J, Calmette J, Lu M, et al. (2019). Stress-glucocorticoid-TSC22D3 axis compromises therapy-induced antitumor immunity. Nat. Med. 25, 1428–1441. [DOI] [PubMed] [Google Scholar]
- Yao Z, Liu Y, Jones J, and Strober S (2009). Differences in Bcl-2 expression by T-cell subsets alter their balance after in vivo irradiation to favor CD4+Bcl-2hi NKT cells. Eur. J. Immunol. 39, 763–775. [DOI] [PMC free article] [PubMed] [Google Scholar]
- Yao T, Shooshtari P, and Haeryfar SMM (2020). Leveraging public single-cell and bulk transcriptomic datasets to delineate MAIT cell roles and phenotypic characteristics in human malignancies. Front. Immunol. 11, 1691. [DOI] [PMC free article] [PubMed] [Google Scholar]
- Yin D, Tuthill D, Mufson RA, and Shi Y (2000). Chronic restraint stress promotes lymphocyte apoptosis by modulating CD95 expression. J. Exp. Med. 191, 1423–1428. [DOI] [PMC free article] [PubMed] [Google Scholar]
- Yosef N, Shalek AK, Gaublomme JT, Jin H, Lee Y, Awasthi A, Wu C, Karwacz K, Xiao S, Jorgolli M, et al. (2013). Dynamic regulatory network controlling TH17 cell differentiation. Nature 496, 461–468. [DOI] [PMC free article] [PubMed] [Google Scholar]
- Zhang Q, Bi J, Zheng X, Chen Y, Wang H, Wu W, Wang Z, Wu Q, Peng H, Wei H, et al. (2018). Blockade of the checkpoint receptor TIGIT prevents NK cell exhaustion and elicits potent anti-tumor immunity. Nat. Immunol. 19, 723–732. [DOI] [PubMed] [Google Scholar]
- Zhang Y, Springfield R, Chen S, Li X, Feng X, Moshirian R, Yang R, and Yuan W (2019). α-GalCer and iNKT cell-based cancer immunotherapy: realizing the therapeutic potentials. Front. Immunol. 10, 1126. [DOI] [PMC free article] [PubMed] [Google Scholar]
Associated Data
This section collects any data citations, data availability statements, or supplementary materials included in this article.
Supplementary Materials
Data Availability Statement
This study did not generate/analyze datasets or codes.