Abstract
Protein disorder is a pervasive phenomenon in biology and a natural consequence of polymer evolution that facilitates cell signaling by organizing sites for posttranslational modifications and protein-protein interactions into arrays of short linear motifs that can be rearranged by RNA splicing. Disordered proteins are missing the long-range nonpolar interactions that form tertiary structures, but they often contain regions with residual secondary structure that are stabilized by protein binding. NMR spectroscopy is uniquely suited to detect residual secondary structure in a disordered protein and it can provide atomic resolution data on the structure and dynamics of disordered protein interaction sites. Here we describe how backbone chemical shifts are used for assigning residual secondary structure in disordered proteins and discuss some of the tools available for estimating secondary structure populations with a focus on disordered proteins containing different levels of alpha helical secondary structure which are stabilized by protein binding.
1. INTRODUCTION
Intrinsically disordered proteins (IDPs) or intrinsically disordered regions of proteins (IDRs) do not form stable tertiary structures, instead they are highly dynamic and sample a broad range of conformational space (Daughdrill, Pielak, Uversky, Cortese, & Dunker, 2005; Dunker, Brown, Lawson, Iakoucheva, & Obradovic, 2002; Dunker et al., 2001, 2008; Dyson & Wright, 2005; Uversky, 2002; van der Lee et al., 2014; Vendruscolo, 2007; Wright & Dyson, 1999). IDPs are abundant in nature with most eukaryotic proteins predicted to have at least one region of disorder longer than 40 residues (Dunker, Obradovic, Romero, Garner, & Brown, 2000; Ward, Sodhi, McGuffin, Buxton, & Jones, 2004). They are enriched in cell signaling and regulatory functions and sites for posttranslational modifications and protein–protein interactions are concentrated into groups of short linear motifs that can be reorganized by RNA splicing (Dunker, Cortese, Romero, Iakoucheva, & Uversky, 2005; Dunker et al., 2001, 2008; Dyson & Wright, 2005; Radivojac et al., 2007; Tompa, 2002, 2005; van der Lee et al., 2014; Vucetic et al., 2007; Xie et al., 2007a, 2007b). In many cases, IDPs and IDRs contain short linear motifs with some residual secondary structure that is stabilized by protein binding (Fuxreiter, Simon, Friedrich, & Tompa, 2004; Mohan et al., 2006; Oldfield et al., 2005; Si-Hyung et al., 2012). Identifying these protein binding sites using nuclear magnetic resonance (NMR) chemical shifts to estimate residual secondary structure has been a major focus of the lab for the last 10 years (Borcherds et al., 2014; Crabtree et al., 2017; Poosapati, Gregory, Borcherds, Chemes, & Daughdrill, 2018). During this time, several groups have observed that the presence of transient helical secondary structure in an IDR is usually predictive of a protein interaction site, providing some motivation to make chemical shift estimation of IDR secondary structure a routine part of drug target identification and validation (Fuxreiter et al., 2004; Kriwacki, Hengst, Tennant, Reed, & Wright, 1996; Mendoza-Espinosa, García-González, Moreno, Castillo, & Mas-Oliva, 2009; Oldfield et al., 2005; Shammas, Crabtree, Dahal, Wicky, & Clarke, 2016; Si-Hyung et al., 2012). The highly dynamic behavior of IDPs makes it difficult or impossible to crystallize them for X-ray crystallography. Even in proteins that do crystalize, if there is an IDR it is frequently represented by low electron density (Dunker et al., 1998). In contrast, NMR is a solution technique that provides atomic resolution dynamic and structural information for IDPs and IDRs (Dyson & Wright, 2004).
Chemical shifts are one of the principle observables from NMR spectroscopy. They are the NMR frequency of a given nucleus compared to a reference compound. Chemical shifts are mostly dependent on the external field produced by the NMR spectrometer, but are also influenced by the local electromagnetic environment of a given nucleus and therefore reports on this environment. They are measured in Hertz and reported in parts per million (PPM) to provide a value that is uniform across different magnetic field strengths. Chemical shifts are sensitive to protein secondary structure, a phenomenon first reported in the late 1960s, however, it was not until the early 1990s that there was a sufficient database of protein chemical shifts to establish a reliable correlation with secondary structure (Meadows, Markley, Cohen, & Jardetzky, 1967; Pastore & Saudek, 1990; Wishart, Sykes, & Richards, 1991). These newly established correlations allowed for the development of the Chemical Shift Index (CSI) which could be used to determine the secondary structure of ordered proteins (Wishart & Case, 2001; Wishart, Sykes, & Richards, 1992). The CSI is still in use today and continues to be updated with a CSI 3.0 version published as recently as 2015 (Hafsa, Arndt, & Wishart, 2015). Like other NMR observables, chemical shifts are a population-weighted average of the molecules in the sample and are therefore a powerful tool for examining transient secondary structures in IDPs and IDRs.
Chemical shifts of 13Cα, 13C′,1Hα, 13Cβ, 15N, and 1HN nuclei are determined by the residue type, the Φ/Ψ torsion angles of the backbone, the side chain structure, ring current effects, hydrogen bonding, local electrical field, solvent, and temperature, as such they contain contributions from both the dynamic and structural properties of the polypeptide backbone (Berjanskii & Wishart, 2017; Wishart & Case, 2001). In particular, chemical shifts for 13Cα, 13C′, and 1Hα nuclei are particularly sensitive to the Φ/Ψ torsion angles of the backbone. Chemical shifts provide precise estimates of secondary structure populations down to a few percent (Camilloni, De Simone, Vranken, & Vendruscolo, 2012; Tamiola & Mulder, 2012).
Using chemical shifts to estimate secondary structure populations in IDPs and IDRs have numerous practical advantages over other NMR measurements like residual dipolar couplings (RDCs). They are easier to measure and do not require special media to partially align the protein in the magnetic field (Chen & Tjandra, 2012). The chemical shift assignments needed to estimate secondary structure populations in IDPs and IDRs are routinely made during most protein NMR studies.
There are still some open challenges in using chemical shifts to determine secondary structure populations for IDPs. The biggest challenge is deciding which random coil chemical shift (RCCS) library to use as a reference, although there has been some convergence on this issue in the last decade (Kjaergaard & Poulsen, 2011; Nielsen & Mulder, 2018). RCCS libraries provide amino acid-specific chemical shift values that are intended to represent the structural properties of the denatured state. They are either measured using data from model peptides or large chemical shift databases (De Simone, Cavalli, Hsu, Vranken, & Vendruscolo, 2009; Kjaergaard & Poulsen, 2011; Nielsen & Mulder, 2018; Schwarzinger, Kroon, Foss, Wright, & Dyson, 2000; Tamiola, Acar, & Mulder, 2010; Wishart, Bigam, Holm, Hodges, & Sykes, 1995; Zhang, Neal, & Wishart, 2003). Both approaches have advantages and drawbacks, which we will illustrate using two IDRs that contain either low or high levels of transient helical secondary structure in important protein binding sites (Borcherds et al., 2014; Crabtree et al., 2017; Poosapati et al., 2018). We will provide examples showing the simplest interpretation of secondary chemical shifts as well as more elaborate methods that provide distributions of populations for alpha helix, beta-strand, polyproline II helix, and coil structures.
In addition to the choice of a random coil library, one must also pay attention to the referencing standard. Because chemical shifts are the resonant frequency of a given nucleus compared to a reference standard, they are relative not absolute measurements (Wishart & Case, 2001). Historically there were many chemical shift standards in use which could result in systematic inconsistencies in the chemical shifts when comparing between spectra that were referenced using a different standard (Wishart & Case, 2001). Errors as small as 0.3 PPM can have a significant impact on the identification of secondary structure for ordered proteins, errors that large are even more impactful for IDPs (Osapay & Case, 1994; Wishart et al., 1992; Wishart & Case, 2001). The IUPAC and IUBMB adopted a set of standards published in 1998 that recommends an internal standard DSS (2,2-dimethyl-2-silapentane-5-sulfonic acid) for referencing 1H and 13C and an external anhydrous liquid ammonia for 15N referencing for biological molecules in aqueous solvents (Markley et al., 1998). Additionally it is possible to use the 1H frequency of internal DSS to indirectly determine the other nuclei shifts, by using predetermined nucleus-specific frequency ratios, for example, the ratio from 1H to 15N is 1:0.101329118 (Bax & Subramanian, 1986; Markley et al., 1998; Wishart, Bigam, Yao, et al., 1995). If you are confident of the temperature regulation on your instrument the water peak can be used for referencing. However, the water peak is both pH and temperature sensitive, so it is recommended that the DSS standard can be used to establish the chemical shifts of the water peak under any specific experimental conditions. The Wishart lab has also developed a method to adjust the chemical shift referencing if necessary (Wang & Wishart, 2005).
2. EXPERIMENTAL CONSIDERATIONS
2.1. Design Considerations for IDR Expression Constructs
Although disordered proteins do not suffer from increasing transverse relaxation rates as the protein size increases, which limits the size of ordered proteins that can be studied with standard NMR techniques; there are practical limitations on the size of the IDR fragment we can easily study due to the resonance overlap problem. As mentioned earlier, chemical shifts are influenced by the local electromagnetic environment around a given nucleus. In ordered proteins, this environment will be heterogeneous leading to chemical shift values with either an upfield or downfield shift relative to the RCCSs. This leads to a property referred to as chemical shift dispersion, which is particularly strong for the backbone amide protons. Since the backbone amide protons of IDPs experience a more homogeneous structural environment their chemical shift dispersion is typically less than that of an ordered protein, which results in resonance overlap.
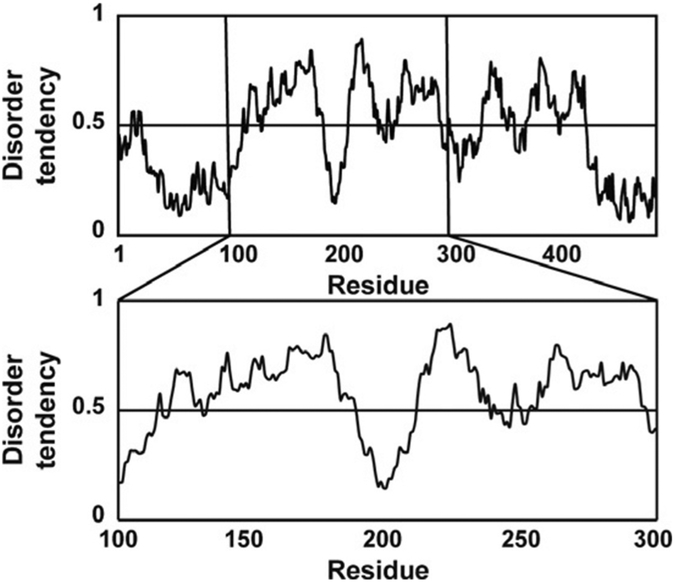
To limit the resonance overlap problem, we recommend designing the cDNA for your IDR fragment to contain 80–100 amino acids. This is usually long enough to incorporate the functionally relevant linear motif(s) that are sites for posttranslational modifications and protein-protein interactions. A disorder predictor like IUPred can be used to identify regions in an IDR sequence that may contain binding sites, the web portal can be found here http://iupred.enzim.hu/Help.php/ (Dosztányi, Csizmok, Tompa, & Simon, 2005; Zsuzsanna, 2018). Fig. 1 shows an IUPred plot of human MdmX. It contains regions that are both ordered (disorder tendency <0.5) and disordered (disorder tendency >0.5). MdmX is a homolog of the E3 ubiquitin ligase Mdm2 and a negative regulator of the p53 tumor suppressor (Wade, Li, & Wahl, 2013). It contains an ordered region from residues 23 to 111 that interacts with the p53 transactivation domain (TAD) and a long, disordered region from residues 111 to 300. This long, disordered region has a segment from residues 190 to 210 with disorder tendencies <0.5, which is characteristic of protein–protein interaction sites in IDRs. In the case of MdmX, this dip corresponds to an intramolecular binding motif that inhibits p53 binding. If you were interested in studying the transient secondary structure of the intramolecular binding motif, you could design a cDNA fragment that contains amino acids 112–210. There is another smaller dip in the IUPred plot from 220 to 270, so a fragment from residue 170 to 270 may also be a reasonable choice. We have investigated numerous fragments of MdmX that contain both ordered and disordered regions (Borcherds et al., 2017; Chen et al., 2015).
Fig. 1.
Disorder prediction and construct design. IUPred plot showing the predicted disorder for the full sequence of MdmX, and an expanded view of residues 100–300.
2.2. Resonance Overlap Problem
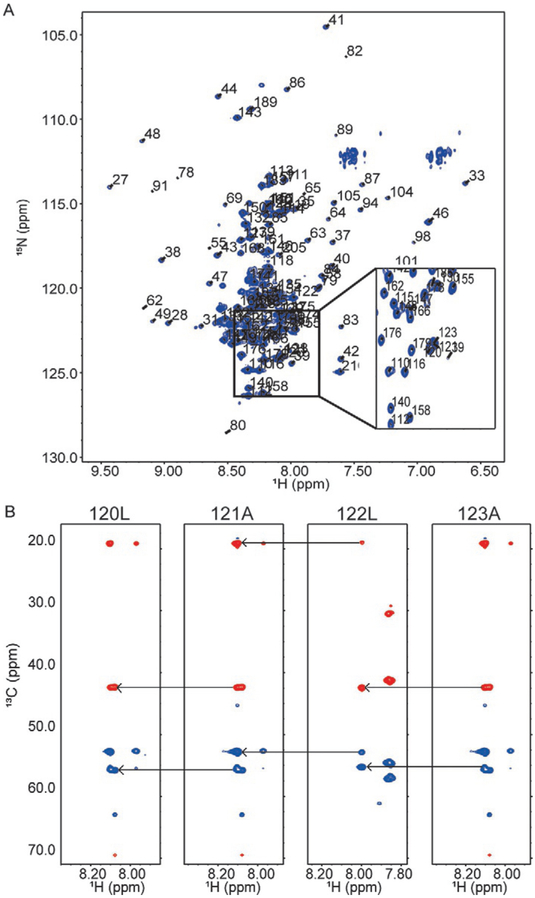
To demonstrate the resonance overlap problem, we show the 1H–15N heteronuclear single quantum coherence (HSQC) spectrum for a fragment of MdmX containing residues 23–210, which contain the p53 binding domain (residues 23–111) and the intramolecular binding motif (residues 190–210) (Fig. 2A). In this spectrum, chemical shift dispersion in the amide proton frequency dimension is sensitive to the heterogeneity of the local electromagnetic environment for a given amino acid created by the close proximity of other amino acids. The amide nitrogen frequency dimension is less sensitive to this effect and instead shows a very clear pattern of chemical shifts based on amino acid type (Wishart & Case, 2001). Most of the residues with disperse chemical shifts in the proton frequency dimension are in the ordered p53 binding domain (residues 23–111). Note the relatively high peak intensities and lack of chemical shift dispersion between the disordered peaks in the center of the amide proton frequency dimension, compared with the more dispersed but weaker ordered peaks. Resonance overlap makes resonance assignments for disordered fragments longer than 100 amino acids increasingly difficult, longer fragments may require using NMR pulse sequences with more than three frequency dimensions (see below), however, it depends greatly on a given construct’s sequence complexity (Dyson & Wright, 2002). For instance, a standard NMR experiment used for making protein assignments is the HNCACB. This experiment correlates the amide nitrogen and proton ofeach residue with its own alpha and beta carbons, as well as the preceding residue’s alpha and beta carbon. The example in Fig. 2B shows the HNCACB strip plot for MdmX residues 120–123, which show overlap in the HSQC spectra (see inset in Fig. 2A). These four residues have the sequence LALA, repetitive motifs like this are common in disordered proteins. The lower peak intensity observed for the ordered domain in Fig. 2A is due to the slower tumbling of the ordered domain and thus the increased transverse relaxation rate, this results in line broadening and the lower peak intensities (Kay, Torchia, & Bax, 1989; Pervushin, Riek, Wider, & Wüthrich, 1997).
Fig. 2.
Resonance overlap problem for IDPs. (A) 1H–15N HSQC of MdmX residues 23–210, a protein with both an ordered domain and disordered domain (Fig. 1). Inset shows crowding in the central region of the spectrum due resonance overlap from disordered residues. Panel (B) shows 1H–13C planes of correlated i and i – 1 spin systems from the HNCACB spectrum of four residues and the connectivity of the resonances. Blue resonances correspond to alpha carbons (>45 PPM) and red resonances correspond to beta carbons (<45 PPM). Each panel shows the correlated spin systems for residue i and i – 1. Arrows connect i – 1 resonances from one spin system with the i resonances of the previous spin system.
2.3. NMR Experiments
Proteins for NMR should be at least 95% pure which can be checked by running a concentrated sample on SDS-PAGE. Following purification of a 13C, 15N isotope-labeled protein sample, a 1H–15N HSQC can be collected to determine whether the protein is ordered or disordered and provide some indication of aggregation, dimerization, or chemical exchange(Bodenhausen & Ruben, 1980; Klein et al., 2001; Sugiki et al., 2009). This is also a good opportunity to properly set the sweep widths of all future experiments as maximizing your experimental resolution is necessary for separating the overlapping peaks as much as possible. The most common experiments for making backbone resonance assignments are the HNCACB and HNCO. These experiments will provide chemical shifts of the amide proton, nitrogen, alpha carbon, beta carbon, and carbonyl carbon (Grzesiek & Bax, 1992b, 1992c; Kay, Ikura, Tschudin, & Bax, 1990; Muhandiram & Kay, 1994). The CBCA(CO)NH and HNCA experiments are also useful for completing resonance assignments. If 1Hα and 1Hβ shifts are desired additional experiments like the HBHA(CO)NH and HCCHTOCSY can be used (Bax, Clore, & Gronenborn, 1990; Farmer, Venters, Spicer, Wittekind, & Müller, 1992; Grzesiek & Bax, 1992a, 1992c, 1993; Kay et al., 1990; Olejniczak, Xu, & Fesik, 1992). The chemical shifts that most reliably report on alpha helical structure in order of decreasing reliability are 13Cα, 13C′, 1Hα, 13Cβ, 15N, and 1HN, and the chemical shifts that report beta or extended structures most reliably in decreasing order are 1Hα, 13Cβ, 1HN, 15N, 13Cα, and 13C′ (Tamiola & Mulder, 2012).
There are additional experiments that may be helpful for assigning particularly overlapped spectra, these include experiments ofhigher dimensionality that are possible due to the slower transverse relaxation rates of IDPs, as well as experiments that rely on the detection of more chemically dispersed nuclei than 1HN (Kjaergaard & Poulsen, 2012). There are pseudo 4D/3D experiments that cause differential shifting for i and i−1 peaks, like HN(CO)CA(CON)CA, and 7D experiments like the HNCO(CA) CBCANH that yields reduced signal overlap (Bagai, Ragsdale, & Zuiderweg, 2011; Hiller, Wasmer, Wider, & Wüthrich, 2007). There are also several experiments that are 1Hα detected rather than 1HN, such as the HACABCANH and H(CA)CON experiments that are less sensitive to pH than the 1HN methods and possibly reduce signal overlap (Mäntylahti, Aitio, Hellman, & Permi, 2010; Motáčková et al., 2010). Finally there are a growing number of 13C detected experiments that take advantage of the greater chemical shift dispersion of the carbon nuclei when compared with the proton nuclei, like the (H)CBCACO, or the CBCACON-IPAP and COCON-IPAP experiments that allow the connectivity to be made through three residues at a time from i to i − 1, and through i + 1 (Bermel et al., 2006, 2009; Hsu, Bertoncini, & Dobson, 2009).
3. SECONDARY CHEMICAL SHIFTS AND RCCS LIBRARIES
3.1. Random Coils and Secondary Chemical Shifts
The random coil shift for a polypeptide may be described as the state where the backbone Φ and Ψ torsion angles of one amino acid are independent of neighboring residues. As such the backbone samples conformational space broadly with no local or long-range interactions (Smith, Fiebig, Schwalbe, & Dobson, 1996). A random coil can be modeled using a random flight chain, where the global behavior of the polymer is defined by the number of monomers connected by bonds of fixed length oriented in random directions (Kuhn, 1934; Smith et al., 1996).
The secondary chemical shifts for the different nuclei of an amino acid in a polypeptide are the difference between its measured chemical shift and its RCCS (Wishart et al., 1992). Since they are referenced to a random coil standard, secondary chemical shifts can be used to identify and estimate transient secondary structure in disordered proteins. The sign of the shift for a given nucleus will provide an indication of the structural behavior of the polypeptide at that residue. Table 1 provides the sign of the secondary chemical shift for the given structure, for example, trends of positive secondary chemical shifts for the 13Cα, and 13C′ indicate helical structure while positive 13Cβ, 15N, 1Hα, indicate beta structure.
Table 1.
Relationship Between Secondary Chemical Shift Sign and Secondary Structure for Each Nucleus
| Structure | 13Cα | 13Cβ | 13CO | 15N | 1HN | 1Hα |
|---|---|---|---|---|---|---|
| Helix | + | − | + | − | − | − |
| Beta | − | + | − | + | + | + |
Residue-specific RCCSs have been determined using either model peptides in denaturing conditions or estimated using chemical shift databases (De Simone et al., 2009; Kjaergaard & Poulsen, 2011; Nielsen & Mulder, 2018; Schwarzinger et al., 2000; Tamiola et al., 2010; Wishart, Bigam, Holm, et al., 1995; Zhang et al., 2003). Early studies used short peptides with the sequence GGXA, where X is one of the 20 common amino acids, which was thought to behave like a random coil (Bundi & Wuthrich, 1979; Richarz & Wuthrich, 1978). Over time it became clear that short peptides did have structural preferences and that neighboring residues affected the chemical shifts ofresidues at the X position. New libraries relying on different strategies have been developed to produce more accurate random coil values. This is especially important for disordered proteins that may have small secondary chemical shifts corresponding to small secondary structure populations, which can be easily overlooked if the RCCSs do not represent random coil behavior in a polypeptide. To analyze our chemical shift data, we use three RCCS libraries that were developed using different methodologies.
3.2. Calculating Secondary Chemical Shifts Using RCCS Libraries
3.2.1. IDRs Used for Chemical Shift Analysis
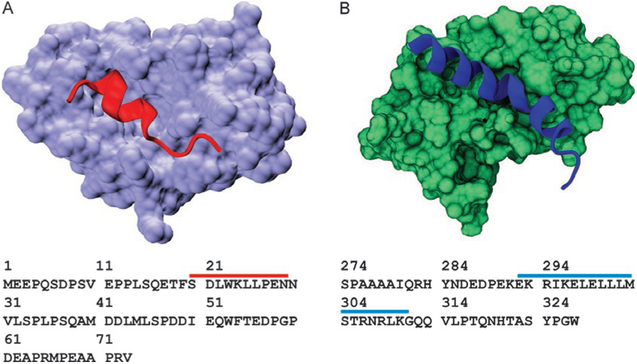
We present an analysis of the backbone chemical shifts from two model systems using three RCCS libraries and three methods for estimating secondary structure populations. One of our model systems is the N-terminal TAD of the tumor suppressor p53 and two mutants P27A and a mutant with all prolines mutated to alanines (all P to A) (Borcherds et al., 2014). p53 TAD is disordered in its free form with some helical propensity that is stabilized to form an amphipathic helix from residues 19 through 25 when bound by its negative regulator Mdm2 (Fig. 3A) (Lee et al., 2000; Vise, Baral, Latos, & Daughdrill, 2005; Wells et al., 2008). The P27A mutant increases the helical propensity of the Mdm2 binding site, and the all P to A mutant further increase the helical content (Borcherds et al., 2014). The second model system is the TAD of the myeloblastosis oncoprotein c-Myb which is also disordered and has a longer segment of partial helicity, from residues 291 through 315, that is stabilized when binding the KIX domain of the CREB binding protein (Fig. 3B) (Shammas, Travis, & Clarke, 2013, 2014; Zor, De Guzman, Dyson, & Wright, 2004). A range of mutations were designed to modulate the helicity while attempting to maintain the integrity of the c-Myb/KIX binding interface the mutants used for the random coil and structural method comparison are the L300G and L300P as they, respectively, have moderate and large effects on the helical content (Crabtree et al., 2017; Poosapati et al., 2018). We think these two models and the associated mutants provide examples of IDRs with a broad range of secondary structure content and demonstrate the effectiveness of the various RCCS libraries and the methods for estimating secondary structures. The data were all collected with at least a digital resolution for the 13Cα and 13C′ nuclei of 0.27 and 0.156 PPM, respectively.
Fig. 3.
Model systems used in this study. (A) Ribbon structure of p53 TAD peptide (red) forming a stable helix when bound to Mdm2 (lavender, PDB ID 1YCR). Sequence of p53 TAD residues 1–73 is shown below the structure. Red bar shows amino acids that fold upon binding to Mdm2. (B) Ribbon structure of c-Myb TAD peptide forming a stable helix when bound to KIX (PDB ID 1SB0). Sequence of c-Myb TAD residues 274–327 is shown below the structure. Blue bar shows amino acids that fold upon binding to KIX.
3.2.2. Secondary Chemical Shifts Using the RCCS Library Developed by Wishart and Colleagues
The Wishart lab used chemically protected pentapeptides (GGXGG) where X can be any of the 20 common amino acids, to measure RCCSs (Wishart, Bigam, Holm, et al., 1995). The hexapeptide series GGXYGG is then used to calculate the neighbor correction, where X and Y can each be any of the 20 amino acids and the effect ofX on Y and Y on X determines the neighbor corrections for each residue in the i − 1, or i + 1 position (Wishart, Bigam, Holm, et al., 1995). Other labs have used the same GGXGG peptide design to generate RCCSs for them under a range of conditions. This included measuring the RCCS of oxidized and reduced cysteines, phosphorylated serine, threonine, and tyrosine, measuring them under pressure, under a range of denaturing conditions, with the addition of cosolvents like 2,2,2-Trifluoroethanol (TFE) and, varying temperatures (Arnold, Kremer, Ludemann, & Kalbitzer, 2002; Bienkiewicz & Lumb, 1999; Merutka, Dyson, & Wright, 1995; Plaxco et al., 1997; Schwarzinger et al., 2000).
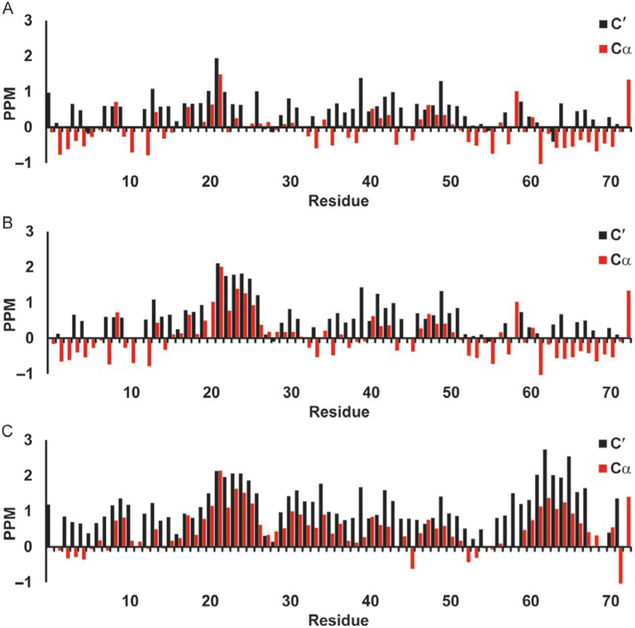
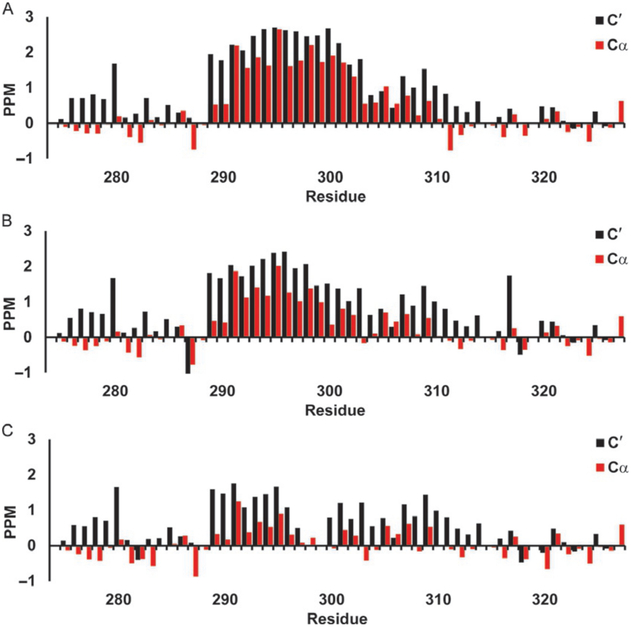
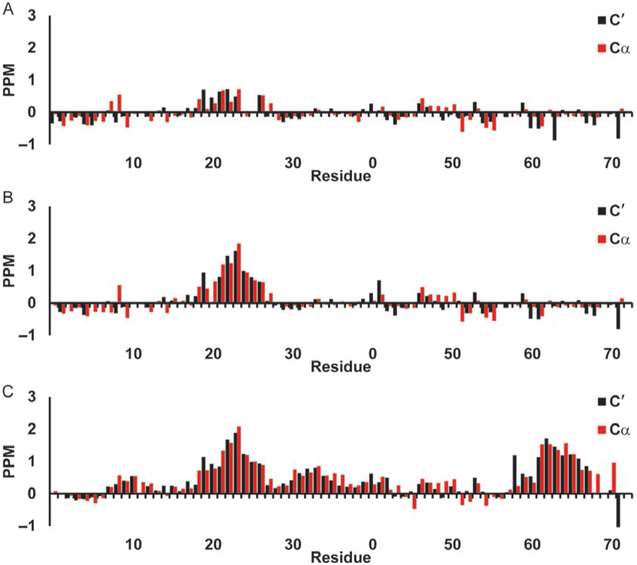
Fig. 4 shows the neighbor-corrected secondary chemical shifts for the 13Cα, and 13C′ of p53 TAD calculated using the Wishart random coil library. These are the most sensitive shifts to alpha helical structures, a positive sec-ondary chemical shift for either 13Cα or 13C′ spanning four or more residues is an indication of helix. Fig. 4A-C shows the WT (a), P27A mutant (b), and the all P to A mutant (c). It is hard to discern much helicity in the WT (a), however increased helicity for the 19 through 25 region is visible in the P27A mutant (b), and a general increase in overall helical content is visible in the all P to A mutant (c). Fig. 5A-C shows WT c-Myb (a), the L300G (b), and L300P (c) mutants. The WT c-Myb (Fig. 5A) has a greater degree of helical content than the WT p53 TAD (Fig. 4A) as can be seen by the broader region of positive secondary chemical shifts as well as the larger shifts. The positive secondary chemical shifts for L300G (Fig. 5B) span about the same number of residues as the WT secondary chemical shifts, however the secondary chemical shifts themselves are lower than the WT shifts, indicating a lower population of helical content. The L300P mutant (Fig. 5C) shows an even smaller positive shift than L300G, again indicating lower helical content. The negative 13Cα values seen mainly in WT p53 TAD (Fig. 4A) and P27A (Fig. 4B) may indicate beta sheet structure, however the 13C′ values do not corroborate this as they are either positive or near 0.
Fig. 4.
Secondary chemical shifts for p53 TAD using Wishart library. Red bars show 13Cα secondary chemical shifts and black bars show 13C′ secondary chemical shifts in parts per million (PPM). (A) p53 TAD WT, (B) p53 TAD P27A, and (C) p53 TAD all P to A.
Fig. 5.
Secondary chemical shifts for c-Myb TAD using Wishart library. Red bars show 13Cα secondary chemical shifts and black bars show 13C′ secondary chemical shifts in parts per million (PPM). (A) c-Myb TAD WT, (B) c-Myb TAD L300G, and (C) c-Myb TAD L300P.
3.2.3. Secondary Chemical Shifts Using the RCCS Library Developed by Poulsen and Colleagues
Of the 20 common amino acids, glycine is unique in its lack of any side chain carbons, allowing it greater flexibility. Conformational studies demonstrate that, like chemical shifts, the Ramachandran distribution of an amino acid varies depending on its neighboring residues. The same study also illustrates that the changes in the Ramachandran distribution caused by the neighboring residues were significantly different for glycine, when compared with the other residue types (Ting et al., 2010). Based on this new information, Poulsen et al. decided to create a new chemically protected pentapeptide, with the sequence QQXQQ, measuring the neighbor effects on each glutamine residue instead of glycine. They chose glutamine because it was found to have the Ramachandran distribution that was most representative of an average amino acid (Kjaergaard & Poulsen, 2011; Ting et al., 2010). The Poulsen lab has studied the effects of temperature on the RCCS. These corrections can be incorporated into the RCCS calculations (Kjaergaard, Brander, & Poulsen, 2011).
There is a web portal https://spin.niddk.nih.gov/bax/nmrserver/ Poulsen_rc_CS/ that allows the user to provide the amino acid sequence and enter the temperature and pH for automatic correction of the random coil shifts, as the chemical shifts are sensitive to both (Kjaergaard et al., 2011). There is also an option to utilize the GGXGG values for glycine specifically, or to utilize perdeuterated shifts. They did not measure the chemical shifts of phosphorylated serine, threonine, and tyrosine, the oxidized chemical shifts for cysteine, or the chemical shifts in TFE.
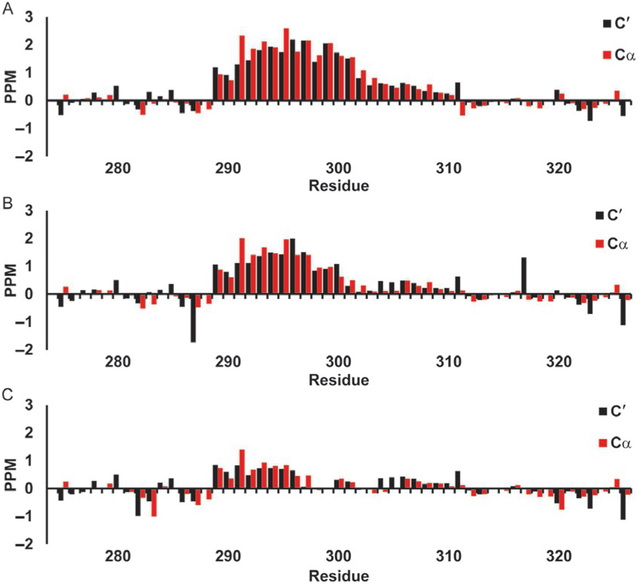
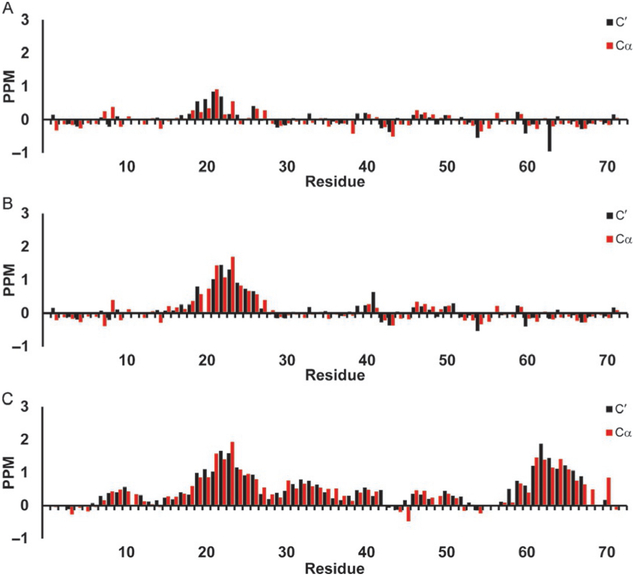
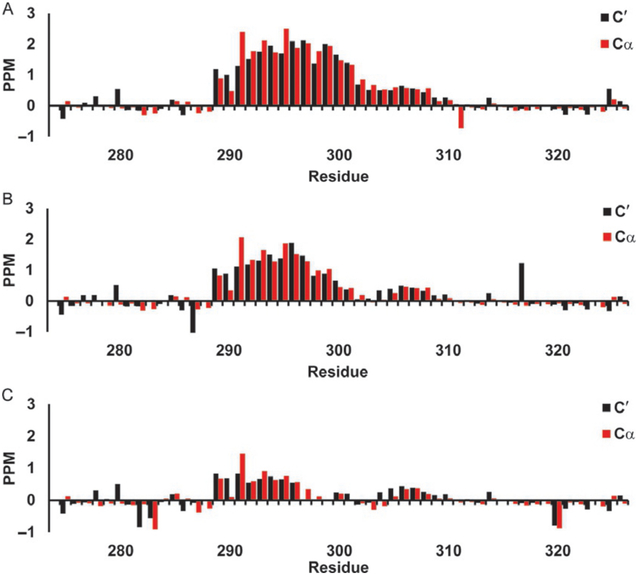
The secondary chemical shifts of the 13Cα and 13C′ for the WT p53 TAD (a) and its two mutants P27A (b), and all P to A (c) calculated using Poulsen’s RCCS library are shown in Fig. 6. Positive secondary chemical shift values are an indication of helical propensity. There is a small positive signal in the Mdm2 binding site of p53 TAD WT (Fig. 6A), with little positive or negative shifts elsewhere to indicate much structural preference. The P27A mutant shows an increased positive shift with greater magnitude though confined to about the same number of residues (Fig. 6B). The all P to A mutant secondary chemical shifts seen in Fig. 6C in general indicate mostly helical tendencies spread throughout much of the polypeptide. Fig. 7 shows the 13C′ and 13Cα secondary chemical shifts for WT c-Myb (a) and its two mutants L300G (b) and L300P (c), using the Poulsen random coil librar and corrections. The WT (Fig. 7C) shows the strongest positive shifts (a) with the L300G (b) and L300P (c) each seeing notable decreases in the helical signal.
Fig. 6.
Secondary chemical shifts for p53 TAD using Poulsen library. Red bars show 13Cα secondary chemical shifts and black bars show 13C′ secondary chemical shifts in parts per million (PPM). (A) p53 TAD WT, (B) p53 TAD P27A, and (C) p53 TAD all P to A.
Fig. 7.
Secondary chemical shifts for c-Myb TAD using Poulsen library. Red bars show 13Cα secondary chemical shifts and black bars show 13C′ secondary chemical shifts in parts per million (PPM). (A) c-Myb TAD WT, (B) c-Myb TAD L300G, and (C) c-Myb TAD L300P.
The secondary chemical shifts generated using the Poulsen RCCS library (Figs. 6 and 7) show a better agreement in the 13Cα and 13C′ than the secondary chemical shifts generated using the Wishart RCCS library (Figs. 4 and 5). Additionally the nascent helices in both the Mdm2 binding site of p53 TAD, and in the KIX binding site of c-Myb are more defined and readily apparent. The Poulsen referenced shifts also show fewer negative 13Cα shifts for all the constructs, the few negative shifts observed however are also in better agreements with the 13C′.
3.2.4. Secondary Chemical Shifts Using the RCCS Library Developed by Mulder and Colleagues
The Mulder lab has produced two neighbor-corrected RCCS libraries, the first one is termed the neighbor-corrected intrinsically disordered protein, ncIDP, library and the more recent prediction of temperature, neighbor and pH-corrected shifts for intrinsically disordered proteins (POTENCI) (Nielsen & Mulder, 2018; Tamiola et al., 2010). They took a different approach to generate these libraries compared with the two previously described. For the ncIDP they used 14 confirmed IDPs containing 6903 unique chemical shifts, reduced to 4439 with outliers removed and used a singular value decomposition methodology to elucidate the random coil value for each residue and the correction factor necessary for the nearest neighbor (Tamiola et al., 2010). With the newer POTENCI library, they drastically increased their training set of disordered proteins to 137, with 9810 confirmed disordered residues, with a total of 47,757 unique chemical shifts. The increase in database size as well as the incorporation of an algorithm to account for pH and ionic strength allows them to account for the protonation state of the side chains at different pH, ionic strength, and temperature, as well as expand their neighbor corrections out to the next nearest neighbor and incorporate second-order corrections (Nielsen & Mulder, 2018). Both the ncIDP and the POTENCI libraries are available at the web portal http://nmr.chem.rug.nl/wordpress/ where you provide the protein sequence and in the case of POTENCI the pH, temperature, and ionic strength are supplied as well as to allow for the correction for these parameters.
The secondary chemical shifts for the WT p53 TAD (a), its mutants P27A (b), and all P to A (c) calculated using the POTENCI RCCS are shown in Fig. 8. As before 13Cα and 13C′ have positive secondary chemical shifts indicating helical content. The nascent helix forming the Mdm2 binding site is clearly defined with gradual increases from WT (a) to P27A (b) and finally to all P to A (c) with the all P to A also having newly introduced nascent helical signals across much of the polypeptide. The WT c-Myb TAD (a) and its two mutants L300G (b) and L300P (c) secondary chemical shifts calculated using the POTENCI random coil library are shown in Fig. 9. The KIX binding site again shows a strong helical signal in the WT (a) and is decreased in the L300G (b) and L300P (c). As can be seen in Figs. 8 and 9, the nascent helix is at least as well defined with the POTENCI as with the Poulsen Figs. 6 and 7. Like the Poulsen secondary chemical shifts, the 13Cα and 13C′ shifts are all in strong agreement, with POTENCI showing even smaller deviations from 0 PPM outside the defined helices of the Mdm2 KIX binding sites.
Fig. 8.
Secondary chemical shifts for p53 TAD using POTENCI library. Red bars show 13Cα secondary chemical shifts and black bars show 13C′ secondary chemical shifts in parts per million (PPM). (A) p53 TAD WT, (B) p53 TAD P27A, and (C) p53 TAD all P to A.
Fig. 9.
Secondary chemical shifts for c-Myb TAD using POTENCI library. Red bars show 13Cα secondary chemical shifts and black bars show 13C′ secondary chemical shifts in parts per million (PPM). (A) c-Myb TAD WT, (B) c-Myb TAD L300G, and (C) c-Myb TAD L300P.
4. ESTIMATING SECONDARY STRUCTURE POPULATIONS OF IDRs
4.1. Direct Estimation of Secondary Structure Populations From Chemical Shifts
The structural propensities reported by secondary chemical shifts were noticed early in ordered proteins (Wishart et al., 1991). For example, in alpha helices the Cα shifts downfield by about 3.1 ± 1.0 PPM, whereas the Cα in beta sheets shifts upfield by about 1.5 ± 1.2 PPM (Spera&Bax, 1991). Because chemical shifts are a population-weighted average even small deviations from the RCCS values will correspond to small populations of helical or beta structures. For instance, the average helical shift for Cα can be used to estimate helical populations using the following relationship: ∑i, j(ΔδCαi,j)/3.1, where ΔδCα is the alpha carbon secondary chemical shifts for residues i through j. The sum of the secondary chemical shifts of the alpha carbon for residues i through j is divided by the average helical secondary chemical shift of3.1 PPM, which yields the approximate helical propensity for that region (Dyson & Wright, 2002). However, not all residues will have the same secondary chemical shift when they assume a helical or beta structure and the standard deviation for the helical secondary chemical shift is 1 PPM which is much greater than the typical digital resolution of alpha carbon chemical shift measurements (≈0.2 PPM). A more precise method is to use a residue-specific database of helical chemical shifts, so that each residue type is being divided by its own residue type’s average secondary chemical shift when in a helix. Wishart published a table of these chemical shift trends based on a database using 229,518 chemical shifts from ordered proteins, providing residue-specific average chemical shifts for helix, sheet, and coil for each of the backbone atoms (Neal, Nip, Zhang, & Wishart, 2003; Wishart, 2011; Wishart & Nip, 1998). For this method of calculation, the formula would be ∑i(ΔδCαi)/(Hδi − RCδi) where ΔδCα is the alpha carbon secondary chemical shift for residue i, Hδi is the helical chemical shift for the residue type i, and RCδi is the RCCS of residue type i.
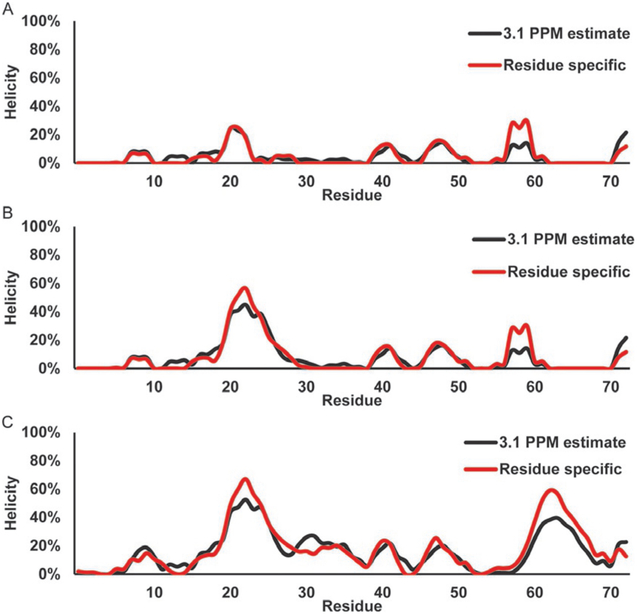
Fig. 10 shows the helical secondary structure populations for the WT p53TAD (a), P27A (b), and all P to A (c). The helicity is calculated by dividing the secondary chemical shifts by 3.1 PPM (black) or by dividing the secondary chemical shifts by the residue-specific alpha helical secondary chemical shifts as described earlier. Both the 3.1 PPM and the residue- specific plots detect helical content in the WT p53 TAD from residues 20 through 24, overlaying well with the stable helix formed when bound to Mdm2 with the 3.1 PPM method reporting about a helicity maximum of 19% and the residue-specific method reporting a maximum of 25%. Both of these methods also identify two small segments of helix from residues 40 to 43 and 47 to 52, very close to regions (residues 41–44 and 47–55) that are found to form stable helices when bound by RPA (Bochkareva et al., 2005). The spike of helicity at residue 59 for the residue-specific helicity is caused by an incorrect neighbor correction coming from the GP motif, the correction for a proline in the i + 1 position is too high for a glycine residue. The P27A mutation (b) causes an increase in helicity as detected by both methods, but again the level is slightly different, with the 3.1 PPM method estimating a maximum helicity of 40% helicity, and the residue- specific method identifying a maximum 57% helicity in the Mdm2 binding site. A similar pattern of helical population is observed using the residue-specific method generally reporting an elevated helical content compared with the 3.1 PPM methodology is observed for the all P to A mutant (c) with the C-terminus displaying a significantly increased helical content compared with WT (a).
Fig. 10.
Direct estimation of helical secondary structure populations for p53 TAD using 13Cα chemical shifts. Red line shows population estimate based on a residue-specific helical chemical shift library. Black line shows population estimate based on a 3.1 PPM helical secondary chemical shift for all residues. (A) p53 TAD WT, (B) p53 TAD P27A, and (C) p53 TAD all P to A.
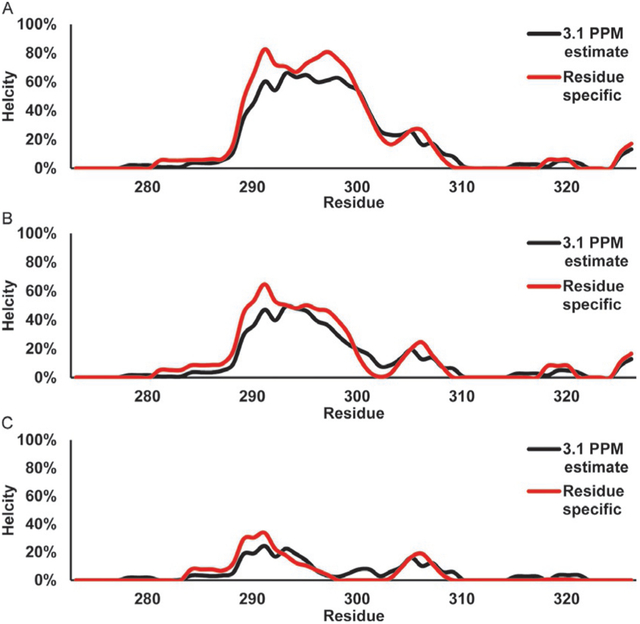
Fig. 11 shows the helical propensity calculated with the 3.1 PPM a specific methodology for c-Myb WT (a), its two mutants, L300G (b), and L300P (c). The helical region detected for the c-Myb WT (a) shows a weak helix starting around residue 281 and increasing to a maximum of 60% and 83% using the 3.1 PPM and residue-specific methods, respectively, before showing a dip at residue 304 and ending by residue 310. The L300G (b) shows a similar pattern, except with a maximum helical content of 47% and 63% for the 3.1 PPM and residue-specific content, the dip at 304 in WT now reaches 0% helicity by 303 as well. The helicity is then decreased further in the L300P mutant (c) with a maximum helicity of 25%, and 34% with the 3.1 PPM and residue-specific methodologies, respectively. Additionally, the helical plot for L300P reaches 0% by residue 299. The plots for Figs. 10 and 11 were created using a sliding average of three residues to smooth the curves.
Fig. 11.
Direct estimation of helical secondary structure populations for c-Myb TAD using 13Cα chemical shifts. Red line shows population estimate based on a residue- specific helical chemical shift library. Black line shows population estimate based on a 3.1 PPM helical secondary chemical shift for all residues. (A) c-Myb TAD WT, (B) c-Myb TAD L300G, and (C) c-Myb TAD L300P.
4.2. Secondary Structure Population Estimates Using Chemical Shift Databases
4.2.1. Neighbor-Corrected Structural Propensity Calculator (NcSPC)
A potential problem with estimating secondary structure populations using chemical shift values from a single nucleus, as shown in Figs. 10 and 11, is that the information from the other chemical shifts are lost. In this section, we will discuss methods that incorporate multiple chemical shifts to increase the accuracy of the population estimate and expand the secondary structure types. Since the chemical shifts of the nuclei in the polypeptide are not all equally sensitive to the structural changes, these methods rely on weighting algorithms that more heavily weight the data from the more sensitive nuclei. An early example of this approach was the secondary structure propensity (SSP) algorithm developed by Forman-Kay’s lab (Marsh, Singh, Jia, & Forman-Kay, 2006). Mulder’s lab based their neighbor-corrected structure propensity calculator (ncSPC) on SSP, adding an additional weighting pro-cedure that accounts for the backbone conformational sensitivity of each amino acid (Tamiola & Mulder, 2012). An additional difference between SSP and ncSPC is that ncSPC by default bases its calculations on the ncIDP random coil library rather than the older RefDB (Zhang et al., 2003). Both the SSP and the ncSPC generate a per residue score ranging from −1 to 1, with −1 representing complete beta structure, and +1 representing complete helical structure, with values in between representing the structural propensity as a fraction of 1. For example +0.25 would suggest about 25% helical propensity at that given position.
There is a web portal to access the ncSPC at: http://nmr.chem.rug.nl/ wordpress/index.php/tools/ncspc/ where you can directly connect to the BMRB from which the program will directly pull previously uploaded chemical shifts. Chemical shifts can also be directly uploaded in TALOS format. There are tools available online to convert other file formats like NMRStar or Sparky. The portal lets you apply a manual reference offset correction if necessary, or apply an automatic 13C rereferencing based on Z-scoring developed for SSP as well as account for deuteration (Marsh et al., 2006). The user will then have the option of choosing one of six possible random coil libraries, with the ncIDP being the default. As of this publication neither Poulsen’s library nor the newer POTENCI library has been incorporated into ncSPC. The user can then select a series of analyses on their data with the default option being the ncSPC with a default moving window size of five residues.
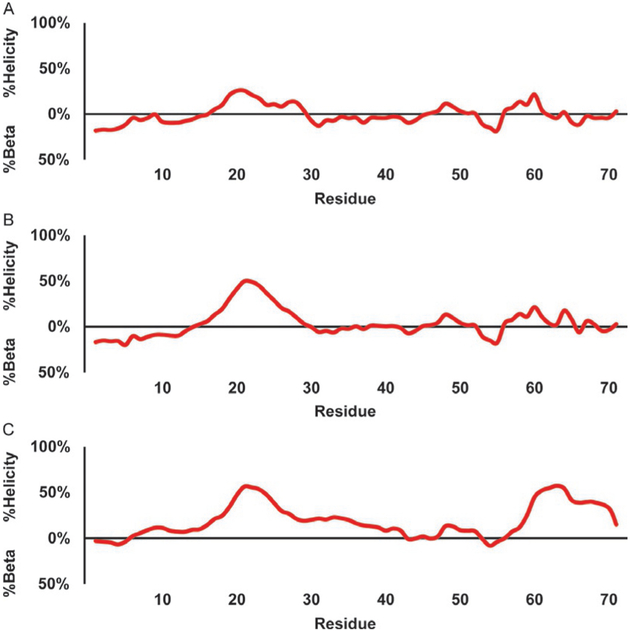
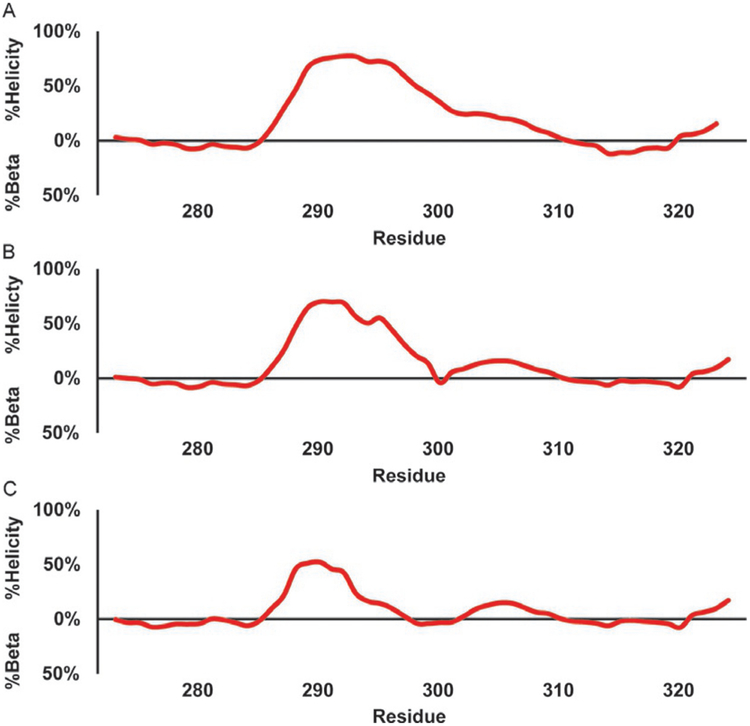
The ncSPC plots seen in Fig. 12 are for the same p53 and c-Myb mutants described earlier. The ncSPC also detects a helical signal in the Mdm2 binding region, with a longer contiguous stretch of helical signal from residue 17 through 30, but a similar maximum as the residue-specific method described previously, at 26%. There is also a weak (11%) short helical signal at residues 48 through 51. The other weak helix around residues 41 through 44 is not detected here. Finally there is also a weak helical signal running from residues 57 through 61, however the random coil library ncIDP that the ncSPC uses is also prone to GP errors in the neighbor corrections of the random coil value, so that signal is likely erroneous. The ncSPC also reports on beta structural content which is largely absent here with a few maximums at residues 5, 32, and 56 showing 17%, 13%, and 18%, respectively. The P27A mutant (b) is similar but with an increased helical signal in the Mdm2 binding site with a new maximum of 50% higher than the 3.1 PPM method’s 40%, but lower than the residue-specific value’s 57%. The all P to A mutant (c) shows a slight increase in the Mdm2 binding site to 57% and an overall increase in helicity across much of the polypeptide with a notable increase in helical signal near the C-terminus of 58%, compared to the 3.1 PPM and residue-specific methods’ 41% and 59%. In Fig. 13, the c-Myb WT and its mutants do not show the weak helix running from 281 to 288 that the 3.1 PPM and residue-specific methods above showed, instead there is weak beta structure predicted here. The KIX binding site shows a 76% maximum with a gradual tapering rather than a dip at residue 304, before the helical signal gradually reaches 0%, and ncSPC starts reporting weak beta structure. The L300G (e) and L300P (f) mutants display similar weak beta signals, but now have a dip at residues 302 and 300, respectively. The maximum helicity is also decreased from the WT’s 76%–70% for the L300G and 50% for the L300P, notably higher than either the 3.1 PPM or the residue-specific estimates.
Fig. 12.
Estimation of secondary structure populations for p53 TAD using NcSPC. The red line traces the secondary structure population estimate with values greater than zero indicating helical populations and values less than zero indicating beta populations. (A) p53 TAD WT, (B) p53 TAD P27A, and (C) p53 TAD all P to A.
Fig. 13.
Estimation of secondary structure populations for c-Myb TAD using NcSPC. The red line traces the secondary structure population estimate with values greater than zero indicating helical populations and values less than zero indicating beta populations. (A) c-Myb TAD WT, (B) c-Myb TAD L300G, and (C) c-Myb TAD L300P.
4.2.2. Calculating Secondary Structure Populations Using δ32D
The Vendruscolo lab has also produced a methodology to estimate secondary structure populations for disordered proteins called the δ2D method (Camilloni et al., 2012). They utilize a database of 1772 proteins with known chemical shifts and structures. The chemical shifts are divided into three libraries, one for all the alpha helical fragments longer than thee residues (with 55,470 residues), one for all the beta-strand fragments longer than 1 residue (36,871 residues), and for all polyprolyl II fragments longer than three residues (2419 residues) (Camilloni et al., 2012). Ninety percent of the database was used to calculate the average chemical shifts and correction factors for each residue type for each of the three structural elements, the remaining 10% was then used to test the method. The software uses an improved version of the CamCoil random coil library which is based on the same database, utilizing the chemical shifts in the loop regions of ordered proteins (De Simone et al., 2009). The δ2D software has been updated twice since it was first released, in 2013 with an update to version 1.2 that expanded the database and then again in 2015 again with a larger database and with the ability to take chemical shift correlations ofneighbor- ing residues into account. The δ2D method does not yet take into account the conformational bias of each residue type. The original iteration was calculated to be 86% accurate. The δ2D gives an output for the fractional secondary structure of alpha helix, beta sheet, polyproline helix, and coil.
There is a web portal to use δ2D that requires a login to be set up at http://www-mvsoftware.ch.cam.ac.uk/. The measured chemical shifts must be in Sparky format and can include the Ha, 13Cα, 13Cβ, 13C′, 15N, 1HN shifts, the more complete the data the better the estimate will be. They do allow you to account for oxidized cysteines with an X instead of C, and the calculations can be done under either low pH conditions (less than or equal to pH 3) or “Neutral” (above pH 3).
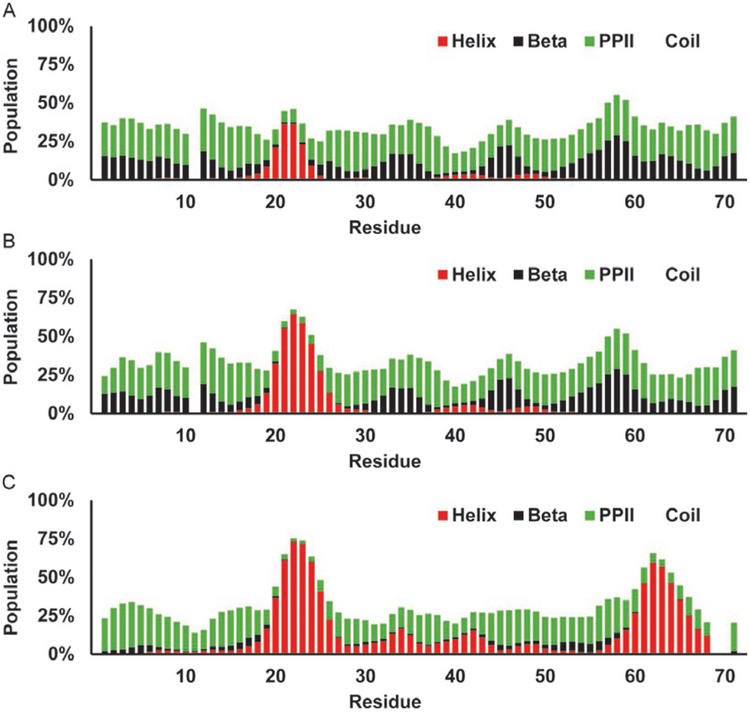
δ2D provides population estimates for helical, beta, PPII, and coil. The estimates for WT p53 TAD (a), its mutants P27A (b), and all P to A (c) can be seen in Fig. 14. As with the previously described methods δ2D report a helical region for the Mdm2 binding site ofp53, however it has a more gradual increase in the population and a more defined peak with maximums for WT, P27A, and all P to A of, 36%, 64%, and 73%, respectively. These are notably higher than any of the previous methodologies. δ2D also detects the two weaker helices from residues 40 to 44, and 47 to 51, however the signal is quite weak here with the WT p53 having 3.8%, and 3.9% helicity, P27A showing 5.8%, and 4.5%, and the all P to A mutant reporting 15.4%, and 6.4%. The beta populations for the WT seem to fluctuate in opposition to the helicity. The beta signal is the weakest, less than 1%, in the Mdm2 binding site, and then fluctuates to local maximums between the three helical regions, at residues 32 through 37, and 45 through 48, and again toward the C-terminus. The beta signal may correspond to the turn in between the two helices that form when bound by RPA. The beta population estimate is all but gone in the all P to A mutant. The PPII pop-ulation estimate is nearly uniform across the sequence of WT and P27A with a value of approximately 28% except in the Mdm2 binding site. The PPII for all P to A is also pretty consistent, however it decreases wherever there is a helical peak, for example the Mdm2 binding site, near residues 35, 43, and the large helical region near the C-terminus.
Fig. 14.
Estimation of secondary structure populations for p53 TAD using δ2D. Red bars indicate helical population estimate, black bars indicate beta population estimates, green bars indicate PPII population estimates, and remaining white is random coil. (A) p53 TAD WT, (B) p53 TAD P27A, and (C) p53 TAD all P to A.
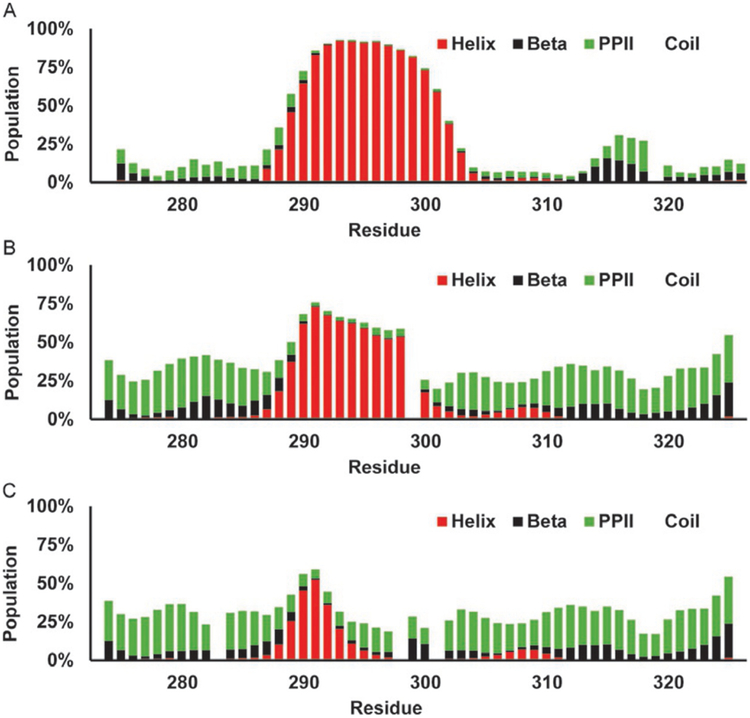
In the δ2D analysis on the WT c-Myb seen in Fig. 15A, one can see a clear strong helical population from residues 288 through 304 peaking at 92%, again higher than the previous methods, and a weak beta peak from residues 314 to 319 peaking at 15%. There are weak PPII signals near the N- and C-terminus ofthis construct with nearly 0% in the KIX binding site. The L300G mutation (Fig. 15B) decreases the helical signal to 73% while slightly increasing the beta and PPII populations in across the whole polypeptide, with the non KIX binding residues all showing approximately 29% PPII. The L300P further decreases the helicity of the KIX binding site and has the effect ofincreasing PPII, and beta populations are increased near the mutation (Fig. 15C). Again the PPII population outside the KIX binding site is near 28% for most of the polypeptide. This level of PPII population has been reported in other IDPs and in the denatured states of proteins before, and this partial PPII populated state may indeed be common for IDPs (Mantsyzov et al., 2014; Toal & Schweitzer-Stenner, 2014; Whittington, Chellgren, Hermann, & Creamer, 2005).
Fig. 15.
Estimation of secondary structure populations for c-Myb TAD using δ2D. Red bars indicate helical population estimate, black bars indicate beta population estimates, green bars indicate PPII population estimates, and remaining white is random coil. (A) c-Myb TAD WT, (B) c-Myb TAD L300G, and (C) c-Myb TAD L300P.
5. SUMMARY AND CONCLUSIONS
There has been significant progress refining RCCS libraries in the last 20 years. There is a clear convergence in the newer Poulsen and POTENCI methodologies over the older Wishart library. However, due to the extra conditions that the Wishart group and others have measured RCCS for the GGXGG pentapeptide, there are instances where those random coil values would be the most appropriate. Random coil libraries have improved to the point that secondary chemical shifts that do not fit the pattern of the adjacent residues’ shifts are often an indication of an error in the assignment and should be checked.
We have compared the averaged helicity provided by each method described in Section 4 for a series of six c-Myb TAD constructs: WT, P289A, P289/316A, E292D, L300G, and L300P with circular dichroism (CD) data where the percent helicity was estimated using the molar residual ellipticity at 222nm (Munoz & Serrano, 1994, 1995; Poosapati et al., 2018). As can be seen in Table 2, the c-Myb TAD fragments used for this comparison have a broad range of helical populations from 8% up to 28% based on CD measurements. According to Table 2, with the exception of the 3.1 PPM method, there is good agreement between the helicity estimates based on chemical shifts using the approaches described in this chapter and the global helicity estimates based on CD. Excluding the 3.1 PPM estimate, most of the average estimated helicity values were within 1% of the CD data, with only the L300P mutant showing any values differing by more than 3%. The population estimates for the L300P mutant are also the most variable between the different methods, with a spread of 4% average helicity where all the others were within 3% of one another (again excluding the 3.1 PPM estimate).
Table 2.
Average Helical Content (%) of Full Polypeptide of c-Myb Constructs
| WT | P289A | P289,316A | E292D | L300G | L300P | |
|---|---|---|---|---|---|---|
| CD | 21 | 27 | 28 | 21 | 14 | 8 |
| δ2D | 21 | 27 | 28 | 20 | 14 | 6 |
| NcSPC | 21 | 26 | 28 | 18 | 15 | 9 |
| Wishart/3.1 PPM | 18 | 21 | 23 | 15 | 12 | 4 |
| Wishart residue specific | 21 | 28 | 30 | 20 | 14 | 5 |
The methods described in this chapter allow a researcher to define regions of residual secondary structure in IDPs and IDRs. The presence of residual secondary structure in IDPs and IDRs is strongly correlated with protein—protein interaction sites, providing a direct link between IDP/IDR chemical shift analysis and function.
ACKNOWLEDGMENT
G.W.D. is supported by the National Institutes of Health (2R01CA14124406-A1 and 1R01GM115556–01A1).
REFERENCES
- Arnold MR, Kremer W, Ludemann HD, & Kalbitzer HR (2002). H-1-NMR parameters of common amino acid residues measured in aqueous solutions of the linear tetrapeptides Gly-Gly-X-Ala at pressures between 0.1 and 200 MPa. Biophysical Chemistry, 96(2–3), 129–140. 10.1016/S0301-4622(02)00018-2. [DOI] [PubMed] [Google Scholar]
- Bagai I, Ragsdale SW, & Zuiderweg ERP (2011). Pseudo-4D triple resonance experiments to resolve HN overlap in the backbone assignment of unfolded proteins. Journal of Biomolecular NMR, 49(2), 69–74. 10.1007/s10858-010-9465-1. [DOI] [PMC free article] [PubMed] [Google Scholar]
- Bax A, Clore GM, & Gronenborn AM (1990). 1H-1H correlation via isotropic mixing of 13C magnetization, a new three-dimensional approach for assigning 1H and 13C spectra of 13C-enriched proteins. Journal of Magnetic Resonance (1969), 88(2), 425–431. 10.1016/0022-2364(90)90202-K. [DOI] [Google Scholar]
- Bax A, & Subramanian S (1986). Sensitivity-enhanced two-dimensional heteronuclear shift correlation NMR-spectroscopy. Journal of Magnetic Resonance, 67(3), 565–569. 10.1016/0022-2364(86)90395-1. [DOI] [Google Scholar]
- Berjanskii MV, & Wishart DS (2017). Unraveling the meaning of chemical shifts in protein NMR. Biochimica et Biophysica Acta—Proteins and Proteomics, 1865(11), 1564–1576. 10.1016/j.bbapap.2017.07.005. [DOI] [PubMed] [Google Scholar]
- Bermel W, Bertini I, Csizmok V, Felli IC, Pierattelli R, & Tompa P (2009). H-start for exclusively heteronuclear NMR spectroscopy: The case of intrinsically disordered proteins. Journal of Magnetic Resonance, 198(2), 275–281. 10.1016/j.jmr.2009.02.012. [DOI] [PubMed] [Google Scholar]
- Bermel W, Bertini I, Felli IC, Lee Y-M, Luchinat C, & Pierattelli R (2006). Protonless NMR experiments for sequence-specific assignment of backbone nuclei in unfolded proteins. Journal of the American Chemical Society, 128(12), 3918–3919. 10.1021/ja0582206. [DOI] [PubMed] [Google Scholar]
- Bienkiewicz EA, & Lumb KJ (1999). Random-coil chemical shifts of phosphorylated amino acids. Journal of Biomolecular NMR, 15(3), 203–206. 10.1023/A:1008375029746. [DOI] [PubMed] [Google Scholar]
- Bochkareva E, Kaustov L, Ayed A, Yi GS, Lu Y, Pineda-Lucena A, et al. (2005). Single-stranded DNA mimicry in the p53 transactivation domain interaction with replication protein A. Proceedings of the National Academy of Sciences of the United States of America, 102(43), 15412–15417. 10.1073/pnas.0504614102. [DOI] [PMC free article] [PubMed] [Google Scholar]
- Bodenhausen G, & Ruben DJ (1980). Natural abundance nitrogen-15 NMR by enhanced heteronuclear spectroscopy. Chemical Physics Letters, 69(1), 185–189. 10.1016/0009-2614(80)80041-8. [DOI] [Google Scholar]
- Borcherds W, Becker A, Chen L, Chen J, Chemes LB, & Daughdrill GW (2017). Optimal affinity enhancement by a conserved flexible linker controls p53 mimicry in MdmX. Biophysical Journal, 112(10), 2038–2042. 10.1016/j.bpj.2017.04.017. [DOI] [PMC free article] [PubMed] [Google Scholar]
- Borcherds W, Theillet F-X, Katzer A, Finzel A, Mishall KM, Powell AT, et al. (2014). Disorder and residual helicity alter p53-Mdm2 binding affinity and signaling in cells. Nature Chemical Biology, 10, 1000. 10.1038/nchembio.1668. [DOI] [PubMed] [Google Scholar]
- Bundi A, & Wuthrich K (1979). H-1-NMR parameters of the common amino-acid residues measured in aqueous-solutions of the linear tetrapeptides H-Gly-Gly-X-L-Ala- Oh. Biopolymers, 18(2), 285–297. 10.1002/bip.1979.360180206. [DOI] [Google Scholar]
- Camilloni C, De Simone A, Vranken WF, & Vendruscolo M (2012). Determination of secondary structure populations in disordered states of proteins using nuclear magnetic resonance chemical shifts. Biochemistry, 51(11), 2224–2231. 10.1021/bi3001825. [DOI] [PubMed] [Google Scholar]
- Chen L, Borcherds W, Wu S, Becker A, Schonbrunn E, Daughdrill GW,et al. (2015). Autoinhibition of MDMX by intramolecular p53 mimicry. Proceedings of the National Academy of Sciences, 112(15), 4624–4629. 10.1073/pnas.1420833112. [DOI] [PMC free article] [PubMed] [Google Scholar]
- Chen K, & Tjandra N (2012). The use of residual dipolar coupling in studying proteins by NMR. NMR of Proteins and Small Biomolecules, 326, 47–67. 10.1007/128_2011_215. [DOI] [PMC free article] [PubMed] [Google Scholar]
- Crabtree MD, Borcherds W, Poosapati A, Shammas SL, Daughdrill GW, & Clarke J (2017). Conserved helix-flanking prolines modulate intrinsically disordered protein: Target affinity by altering the lifetime of the bound complex. Biochemistry, 56(18), 2379–2384. 10.1021/acs.biochem.7b00179. [DOI] [PMC free article] [PubMed] [Google Scholar]
- Daughdrill GW, Pielak GJ, Uversky VN, Cortese MS, & Dunker AK (2005). Natively disordered proteins. In Buchner J & Kiefhaber T (Eds.), Vol. 3. Protein folding handbook (pp. 275–357). Darmstadt: Wiley-VCH. [Google Scholar]
- De Simone A, Cavalli A, Hsu STD, Vranken W, & Vendruscolo M (2009). Accurate random coil chemical shifts from an analysis of loop regions in native states of proteins. Journal of the American Chemical Society, 131(45), 16332. 10.1021/ja904937a. [DOI] [PubMed] [Google Scholar]
- Dosztányi Z, Csizmok V, Tompa P, & Simon I (2005). IUPred: Web server for the prediction of intrinsically unstructured regions of proteins based on estimated energy content. Bioinformatics, 21(16), 3433–3434. 10.1093/bioinformatics/bti541. [DOI] [PubMed] [Google Scholar]
- Dunker AK, Brown CJ, Lawson JD, Iakoucheva LM, & Obradovic Z (2002). Intrinsic disorder and protein function. Biochemistry, 41(21), 6573–6582. 10.1021/bi012159+. [DOI] [PubMed] [Google Scholar]
- Dunker AK, Cortese MS, Romero P, Iakoucheva LM, & Uversky VN (2005). Flexible nets. The roles of intrinsic disorder in protein interaction networks. FEBS Journal, 272(20), 5129–5148. 10.1111/j.1742-4658.2005.04948.x. [DOI] [PubMed] [Google Scholar]
- Dunker AK, Garner E, Guilliot S, Romero P, Albrecht K, Hart J, et al. (1998). Protein disorder and the evolution of molecular recognition: Theory, predictions and observations. Pacific Symposium on Biocomputing, 473–484. [PubMed] [Google Scholar]
- Dunker AK, Lawson JD, Brown CJ, Williams RM, Romero P, Oh JS, et al. (2001). Intrinsically disordered protein. Journal of Molecular Graphics & Modelling, 19(1), 26–59. [DOI] [PubMed] [Google Scholar]
- Dunker AK, Obradovic Z, Romero P, Garner EC, & Brown CJ (2000). Intrinsic protein disorder in complete genomes. Genome Informatics Workshop on Genome Informatics, 11, 161–171. [PubMed] [Google Scholar]
- Dunker AK, Oldfield CJ, Meng J, Romero P, Yang JY, Chen JW, et al. (2008). The unfoldomics decade: An update on intrinsically disordered proteins. BMC Genomics, 9(Suppl. 2), S1. 10.1186/1471-2164-9-S2-S1. [DOI] [PMC free article] [PubMed] [Google Scholar]
- Dyson HJ, & Wright PE (2002). Insights into the structure and dynamics of unfolded proteins from nuclear magnetic resonance. Unfolded Proteins, 62, 311–340. [DOI] [PubMed] [Google Scholar]
- Dyson HJ, & Wright PE (2004). Unfolded proteins and protein folding studied by NMR. Chemical Reviews, 104(8), 3607–3622. 10.1021/cr030403s. [DOI] [PubMed] [Google Scholar]
- Dyson HJ, & Wright PE (2005). Intrinsically unstructured proteins and their functions. Nature Reviews. Molecular Cell Biology, 6(3), 197–208. [DOI] [PubMed] [Google Scholar]
- Farmer BT, Venters RA, Spicer LD, Wittekind MG, & Müller L (1992). A refocused and optimized HNCA: Increased sensitivity and resolution in large macromolecules. Journal of Biomolecular NMR, 2(2), 195–202. 10.1007/bf01875530. [DOI] [PubMed] [Google Scholar]
- Fuxreiter M, Simon I, Friedrich P, & Tompa P (2004). Preformed structural elements feature in partner recognition by intrinsically unstructured proteins. Journal of Molecular Biology, 338(5), 1015–1026. 10.1016/j.jmb.2004.03.017. [DOI] [PubMed] [Google Scholar]
- Grzesiek S, & Bax A (1992a). Correlating backbone amide and side chain resonances in larger proteins by multiple relayed triple resonance NMR. Journal of the American Chemical Society, 114(16), 6291–6293. 10.1021/ja00042a003. [DOI] [Google Scholar]
- Grzesiek S, & Bax A (1992b). An efficient experiment for sequential backbone assignment of medium-sized isotopically enriched proteins. Journal of Magnetic Resonance (1969), 99(1), 201–207. 10.1016/0022-2364(92)90169-8. [DOI] [Google Scholar]
- Grzesiek S, & Bax A (1992c). Improved 3D triple-resonance NMR techniques applied to a 31 kDa protein. Journal of Magnetic Resonance (1969), 96(2), 432–440. 10.1016/0022-2364(92)90099-S. [DOI] [Google Scholar]
- Grzesiek S, & Bax A (1993). Amino acid type determination in the sequential assignment procedure of uniformly 13C/15N-enriched proteins. Journal of Biomolecular NMR, 3(2), 185–204. 10.1007/bf00178261. [DOI] [PubMed] [Google Scholar]
- Hafsa NE, Arndt D, & Wishart DS (2015). CSI 3.0: A web server for identifying secondary and super-secondary structure in proteins using NMR chemical shifts. Nucleic Acids Research, 43(W1), W370–W377. 10.1093/nar/gkv494. [DOI] [PMC free article] [PubMed] [Google Scholar]
- Hiller S, Wasmer C, Wider G, & Wüthrich K (2007). Sequence-specific resonance assignment of soluble nonglobular proteins by 7D APSY-NMR spectroscopy. Journal of the American Chemical Society, 129(35), 10823–10828. 10.1021/ja072564+. [DOI] [PubMed] [Google Scholar]
- Hsu S-TD, Bertoncini CW, & Dobson CM (2009). Use of protonless NMR spectroscopy to alleviate the loss of information resulting from exchange-broadening. Journal of the American Chemical Society, 131(21), 7222–7223. 10.1021/ja902307q. [DOI] [PubMed] [Google Scholar]
- Kay LE, Ikura M, Tschudin R, & Bax A (1990). Three-dimensional triple-resonance NMR spectroscopy of isotopically enriched proteins. Journal of Magnetic Resonance (1969), 89(3), 496–514. 10.1016/0022-2364(90)90333-5. [DOI] [PubMed] [Google Scholar]
- Kay LE, Torchia DA, & Bax A (1989). Backbone dynamics of proteins as studied by N-15 inverse detected heteronuclear Nmr-spectroscopy—Application to staphylococcal nuclease. Biochemistry, 28(23), 8972–8979. 10.1021/bi00449a003. [DOI] [PubMed] [Google Scholar]
- Kjaergaard M, Brander S, & Poulsen FM (2011). Random coil chemical shift for intrinsically disordered proteins: Effects of temperature and pH. Journal of Biomolecular NMR, 49(2), 139–149. 10.1007/s10858-011-9472-x. [DOI] [PubMed] [Google Scholar]
- Kjaergaard M, & Poulsen FM (2011). Sequence correction of random coil chemical shifts: Correlation between neighbor correction factors and changes in the Ramachandran distribution. Journal of Biomolecular NMR, 50(2), 157–165. 10.1007/s10858-011-9508-2. [DOI] [PubMed] [Google Scholar]
- Kjaergaard M, & Poulsen FM (2012). Disordered proteins studied by chemical shifts. Progress in Nuclear Magnetic Resonance Spectroscopy, 60, 42–51. 10.1016/j.pnmrs.2011.10.001. [DOI] [PubMed] [Google Scholar]
- Klein C, Planker E, Diercks T, Kessler H, Kunkele KP, Lang K, et al. (2001). NMR spectroscopy reveals the solution dimerization interface of p53 core domains bound to their consensus DNA. Journal of Biological Chemistry, 276(52), 49020–49027. 10.1074/jbc.M107516200. [DOI] [PubMed] [Google Scholar]
- Kriwacki RW, Hengst L, Tennant L, Reed SI, & Wright PE (1996). Structural studies of p21Waf1/Cip1/Sdi1 in the free and Cdk2-bound state: Conformational disorder mediates binding diversity. Proceedings of the National Academy of Sciences of the United States of America, 93(21), 11504–11509. [DOI] [PMC free article] [PubMed] [Google Scholar]
- Kuhn W (1934). Concerning the shape of thread shapes molecules in solution. Kolloid- Zeitschrift, 68(1), 2–15. 10.1007/Bf01451681. [DOI] [Google Scholar]
- Lee H, Mok KH, Muhandiram R, Park KH, Suk JE, Kim DH, et al. (2000). Local structural elements in the mostly unstructured transcriptional activation domain of human p53. Journal of Biological Chemistry, 275(38), 29426–29432. 10.1074/jbc.M003107200. [DOI] [PubMed] [Google Scholar]
- Mantsyzov AB, Maltsev AS, Ying J, Shen Y, Hummer G, & Bax A (2014). A maximum entropy approach to the study of residue-specific backbone angle distributions in α-synuclein, an intrinsically disordered protein. Protein Science, 23(9), 1275–1290. 10.1002/pro.2511. [DOI] [PMC free article] [PubMed] [Google Scholar]
- Mäntylahti S, Aitio O, Hellman M, & Permi P (2010). HA-detected experiments for the backbone assignment of intrinsically disordered proteins. Journal of Biomolecular NMR, 47(3), 171–181. 10.1007/s10858-010-9421-0. [DOI] [PubMed] [Google Scholar]
- Markley JL, Bax A, Arata Y, Hilbers CW, Kaptein R, Sykes BD, et al. (1998). Recommendations for the presentation of NMR structures of proteins and nucleic acids—IUPAC-IUBMB-IUPAB inter-union task group on the standardization of data bases of protein and nucleic acid structures determined by NMR spectroscopy. Journal of Biomolecular NMR, 12(1), 1–23. 10.1023/A:1008290618449. [DOI] [PubMed] [Google Scholar]
- Marsh JA, Singh VK, Jia ZC, & Forman-Kay JD (2006). Sensitivity of secondary structure propensities to sequence differences between alpha- and gamma-synuclein: Implications for fibrillation. Protein Science, 15(12), 2795–2804. 10.1110/ps.062465306. [DOI] [PMC free article] [PubMed] [Google Scholar]
- Meadows DH, Markley JL, Cohen JS, & Jardetzky O (1967). Nuclear magnetic resonance studies of structure and binding sites of enzymes. I. Histidine residues. Proceedings of the National Academy of Sciences of the United States of America, 58(4), 1307. 10.1073/pnas.58.4.1307. [DOI] [PMC free article] [PubMed] [Google Scholar]
- Mendoza-Espinosa P, García-González V, Moreno A, Castillo R, & Mas-Oliva J (2009). Disorder-to-order conformational transitions in protein structure and its relationship to disease. Molecular and Cellular Biochemistry, 330(1), 105–120. 10.1007/s11010-009-0105-6. [DOI] [PubMed] [Google Scholar]
- Merutka G, Dyson HJ, & Wright PE (1995). Random coil H-1 chemical-shifts obtained as a function of temperature and trifluoroethanol concentration for the peptide series Ggxgg. Journal of Biomolecular NMR, 5(1), 14–24. 10.1007/Bf00227466. [DOI] [PubMed] [Google Scholar]
- Mohan A, Oldfield CJ, Radivojac P, Vacic V, Cortese MS, Dunker AK, et al. (2006). Analysis of molecular recognition features (MoRFs). Journal of Molecular Biology, 362(5), 1043–1059. 10.1016/j.jmb.2006.07.087. [DOI] [PubMed] [Google Scholar]
- Motáčková V, Nováček J, Zawadzka-Kazimierczuk A, Kazimierczuk K, Žídek L, Šanderová H, et al. (2010). Strategy for complete NMR assignment of disordered proteins with highly repetitive sequences based on resolution-enhanced 5D experiments. Journal of Biomolecular NMR, 48(3), 169–177. 10.1007/s10858-010-9447-3. [DOI] [PMC free article] [PubMed] [Google Scholar]
- Muhandiram DR, & Kay LE (1994). Gradient-enhanced triple-resonance three-dimensional NMR experiments with improved sensitivity. Journal of Magnetic Resonance, Series B, 103(3), 203–216. 10.1006/jmrb.1994.1032. [DOI] [Google Scholar]
- Munoz V, & Serrano L (1994). Elucidating the folding problem of helical peptides using empirical parameters. Nature Structural Biology, 1(6), 399–409. 10.1038/nsb0694-399. [DOI] [PubMed] [Google Scholar]
- Munoz V, & Serrano L (1995). Elucidating the folding problem of helical peptides using empirical parameters. 2. Helix macrodipole effects and rational modification of the helical content of natural peptides. Journal of Molecular Biology, 245(3), 275–296. 10.1006/jmbi.1994.0023. [DOI] [PubMed] [Google Scholar]
- Neal S, Nip AM, Zhang HY, & Wishart DS (2003). Rapid and accurate calculation of protein H-1, C-13 and N-15 chemical shifts. Journal of Biomolecular NMR, 26(3), 215–240. 10.1023/A:1023812930288. [DOI] [PubMed] [Google Scholar]
- Nielsen JT, & Mulder FAA (2018). POTENCI: Prediction of temperature, neighbor and pH-corrected chemical shifts for intrinsically disordered proteins. Journal of Biomolecular NMR, 70(3), 141–165. 10.1007/s10858-018-0166-5. [DOI] [PubMed] [Google Scholar]
- Oldfield CJ, Cheng YG, Cortese MS, Romero P, Uversky VN, & Dunker AK (2005). Coupled folding and binding with alpha-helix-forming molecular recognition elements. Biochemistry, 44(37), 12454–12470. 10.1021/bi050736e. [DOI] [PubMed] [Google Scholar]
- Olejniczak ET, Xu RX, & Fesik SW (1992). A 4D HCCH-TOCSY experiment for assigning the side chain 1H and13C resonances of proteins. Journal of Biomolecular NMR, 2(6), 655–659. 10.1007/bf02192854. [DOI] [PubMed] [Google Scholar]
- Osapay K, & Case DA (1994). Analysis of proton chemical-shifts in regular secondary structure of proteins. Journal of Biomolecular NMR, 4(2), 215–230. [DOI] [PubMed] [Google Scholar]
- Pastore A, & Saudek V (1990). The relationship between chemical-shift and secondary structure in proteins. Journal of Magnetic Resonance, 90(1), 165–176. 10.1016/0022-2364(90)90375-J. [DOI] [Google Scholar]
- Pervushin K, Riek R, Wider G, & Wüthrich K (1997). Attenuated T2 relaxation by mutual cancellation of dipole-dipole coupling and chemical shift anisotropy indicates an avenue to NMR structures of very large biological macromolecules in solution. Proceedings of the National Academy of Sciences, 94(23), 12366–12371. 10.1073/pnas.94.23.12366. [DOI] [PMC free article] [PubMed] [Google Scholar]
- Plaxco KW, Morton CJ, Grimshaw SB, Jones JA, Pitkeathly M, Campbell ID, et al. (1997). The effects of guanidine hydrochloride on the ‘random coil’ conformations and NMR chemical shifts of the peptide series GGXGG. Journal of Biomolecular NMR, 10(3), 221–230. 10.1023/A:1018340217891. [DOI] [PubMed] [Google Scholar]
- Poosapati A, Gregory E, Borcherds WM, Chemes LB, & Daughdrill GW (2018). Uncoupling the folding and binding of an intrinsically disordered protein. Journal of Molecular Biology, 430(16), 2389–2402. 10.1016/j.jmb.2018.05.045. [DOI] [PMC free article] [PubMed] [Google Scholar]
- Radivojac P, Iakoucheva LM, Oldfield CJ, Obradovic Z, Uversky VN, & Dunker AK (2007). Intrinsic disorder and functional proteomics. Biophysical Journal, 92(5), 1439–1456. 10.1529/biophysj.106.094045. [DOI] [PMC free article] [PubMed] [Google Scholar]
- Richarz R, & Wuthrich K (1978). C-13 NMR chemical-shifts of common amino-acid residues measured in aqueous-solutions of linear tetrapeptides H-Gly-Gly-X-L-Ala-oh. Biopolymers, 17(9), 2133–2141. 10.1002/bip.1978.360170908. [DOI] [Google Scholar]
- Schwarzinger S, Kroon GJA, Foss TR, Wright PE, & Dyson HJ (2000). Random coil chemical shifts in acidic 8 M urea: Implementation of random coil shift data in NMR view. Journal of Biomolecular NMR, 18(1), 43–48. 10.1023/A:1008386816521. [DOI] [PubMed] [Google Scholar]
- Shammas SL, Crabtree MD, Dahal L, Wicky BIM, & Clarke J (2016). Insights into coupled folding and binding mechanisms from kinetic studies. Journal of Biological Chemistry, 291(13), 6689–6695. 10.1074/jbc.R115.692715. [DOI] [PMC free article] [PubMed] [Google Scholar]
- Shammas SL, Travis AJ, & Clarke J (2013). Remarkably fast coupled folding and binding of the intrinsically disordered transactivation domain of cMyb to CBP KIX. Journal of Physical Chemistry B, 117(42), 13346–13356. 10.1021/jp404267e. [DOI] [PMC free article] [PubMed] [Google Scholar]
- Shammas SL, Travis AJ, & Clarke J (2014). Allostery within a transcription coactivator is predominantly mediated through dissociation rate constants. Proceedings of the National Academy of Sciences of the United States of America, 111(33), 12055–12060. 10.1073/pnas.1405815111. [DOI] [PMC free article] [PubMed] [Google Scholar]
- Si-Hyung L, Do-Hyoung K, Joan JH, Eun-Ji C, Ji-Eun L, Ye-Jin C, et al. (2012). Understanding pre-structured motifs (PreSMos) in intrinsically unfolded proteins. Current Protein & Peptide Science, 13(1), 34–54. 10.2174/138920312799277974. [DOI] [PubMed] [Google Scholar]
- Smith LJ, Fiebig KM, Schwalbe H, & Dobson CM (1996). The concept of a random coil—residual structure in peptides and denatured proteins. Folding & Design, 1(5), R95–R106. 10.1016/S1359-0278(96)00046-6. [DOI] [PubMed] [Google Scholar]
- Spera S, & Bax A (1991). Empirical correlation between protein backbone conformation and C-alpha and C-beta C-13 nuclear-magnetic-resonance chemical-shifts. Journal of the American Chemical Society, 113(14), 5490–5492. 10.1021/ja00014a071. [DOI] [Google Scholar]
- Sugiki T, Yoshiura C, Kofuku Y, Ueda T, Shimada I, & Takahashi H (2009). High- throughput screening of optimal solution conditions for structural biological studies by fluorescence correlation spectroscopy. Protein Science, 18(5), 1115–1120. 10.1002/pro.92. [DOI] [PMC free article] [PubMed] [Google Scholar]
- Tamiola K, Acar B,& Mulder FA (2010). Sequence-specific random coil chemical shifts of intrinsically disordered proteins. Journal of the American Chemical Society, 132(51), 18000–18003. 10.1021/ja105656t. [DOI] [PubMed] [Google Scholar]
- Tamiola K, & Mulder FAA (2012). Using NMR chemical shifts to calculate the propensity for structural order and disorder in proteins. Biochemical Society Transactions, 40, 1014–1020. 10.1042/Bst20120171. [DOI] [PubMed] [Google Scholar]
- Ting D, Wang GL, Shapovalov M, Mitra R, Jordan MI, & Dunbrack RL (2010). Neighbor-dependent Ramachandran probability distributions of amino acids developed from a hierarchical Dirichlet process model. PLoS Computational Biology, 6(4), 1–21. 10.1371/journal.pcbi.1000763. [DOI] [PMC free article] [PubMed] [Google Scholar]
- Toal S, & Schweitzer-Stenner R (2014). Local order in the unfolded state: Conformational biases and nearest neighbor interactions. Biomolecules, 4(3), 725. [DOI] [PMC free article] [PubMed] [Google Scholar]
- Tompa P (2002). Intrinsically unstructured proteins. Trends in Biochemical Sciences, 27(10), 527–533. [DOI] [PubMed] [Google Scholar]
- Tompa P (2005). The interplay between structure and function in intrinsically unstructured proteins. FEBS Letters, 579(15), 3346–3354. 10.1016/j.febslet.2005.03.072. [DOI] [PubMed] [Google Scholar]
- Uversky VN (2002). What does it mean to be natively unfolded? European Journal of Biochemistry, 269(1), 2–12. [DOI] [PubMed] [Google Scholar]
- van der Lee R, Buljan M, Lang B, Weatheritt RJ, Daughdrill GW, Dunker AK, et al. (2014). Classification of intrinsically disordered regions and proteins. Chemical Reviews, 114(13), 6589–6631. 10.1021/cr400525m. [DOI] [PMC free article] [PubMed] [Google Scholar]
- Vendruscolo M (2007). Determination of conformationally heterogeneous states of proteins. Current Opinion in Structural Biology, 17(1), 15–20. [DOI] [PubMed] [Google Scholar]
- Vise PD, Baral B, Latos AJ, & Daughdrill GW (2005). NMR chemical shift and relaxation measurements provide evidence for the coupled folding and binding of the p53 transactivation domain. Nucleic Acids Research, 33(7), 2061–2077. 10.1093/nar/gki336. [DOI] [PMC free article] [PubMed] [Google Scholar]
- Vucetic S, Xie HB, Iakoucheva LM, Oldfield CJ, Dunker AK, Obradovic Z, et al. (2007). Functional anthology of intrinsic disorder. 2. Cellular components, domains, technical terms, developmental processes, and coding sequence diversities correlated with long disordered regions. Journal of Proteome Research, 6(5), 1899–1916. 10.1021/pr060393m. [DOI] [PMC free article] [PubMed] [Google Scholar]
- Wade M, Li Y-C, & Wahl GM (2013). MDM2, MDMX and p53 in oncogenesis and cancer therapy. Nature Reviews Cancer, 13, 83. 10.1038/nrc3430. [DOI] [PMC free article] [PubMed] [Google Scholar]
- Wang YJ, & Wishart DS (2005). A simple method to adjust inconsistently referenced C-13 and N-15 chemical shift assignments of proteins. Journal of Biomolecular NMR, 31(2), 143–148. 10.1007/s10858-004-7441-3. [DOI] [PubMed] [Google Scholar]
- Ward JJ, Sodhi JS, McGuffin LJ, Buxton BF, & Jones DT (2004). Prediction and functional analysis of native disorder in proteins from the three kingdoms of life. Journal of Molecular Biology, 337(3), 635–645. 10.1016/j.jmb.2004.02.002. [DOI] [PubMed] [Google Scholar]
- Wells M, Tidow H, Rutherford TJ, Markwick P, Jensen MR, Mylonas E, et al. (2008). Structure of tumor suppressor p53 and its intrinsically disordered N-terminal transactivation domain. Proceedings of the National Academy of Sciences of the United States of America, 105(15), 5762–5767. 10.1073/pnas.0801353105. [DOI] [PMC free article] [PubMed] [Google Scholar]
- Whittington SJ, Chellgren BW, Hermann VM, & Creamer TP (2005). Urea promotes polyproline II helix formation: Implications for protein denatured states. Biochemistry, 44(16), 6269–6275. 10.1021/bi050124u. [DOI] [PubMed] [Google Scholar]
- Wishart DS (2011). Interpreting protein chemical shift data. Progress in Nuclear Magnetic Resonance Spectroscopy, 58(1–2), 62–87. 10.1016/j.pnmrs.2010.07.004. [DOI] [PubMed] [Google Scholar]
- Wishart DS, Bigam CG, Holm A, Hodges RS, & Sykes BD (1995). H-1, C-13 and N-15 random coil NMR chemical-shifts of the common amino-acids. 1. Investigations of nearest-neighbor effects (Vol. 5, Pg 67, 1995). Journal of Biomolecular NMR, 5(3), 332. [DOI] [PubMed] [Google Scholar]
- Wishart DS, Bigam CG, Yao J, Abildgaard F, Dyson HJ, Oldfield E, et al. (1995). H-1, C-13 and N-15 chemical-shift referencing in biomolecular NMR. Journal of Biomolecular NMR, 6(2), 135–140. [DOI] [PubMed] [Google Scholar]
- Wishart DS, & Case DA (2001). Use of chemical shifts in macromolecular structure determination. Nuclear Magnetic Resonance of Biologica Macromolecules, 338, Pt. A, 3–34. [DOI] [PubMed] [Google Scholar]
- Wishart DS, & Nip AM (1998). Protein chemical shift analysis: A practical guide. Biochemistry and Cell Biology—Biochimie Et Biologie Cellulaire, 76(2–3), 153–163. 10.1139/bcb-76-2-3-153. [DOI] [PubMed] [Google Scholar]
- Wishart DS, Sykes BD, & Richards FM (1991). Relationship between nuclear- magnetic-resonance chemical-shift and protein secondary structure. Journal of Molecular Biology, 222(2), 311–333. 10.1016/0022-2836(91)90214-Q. [DOI] [PubMed] [Google Scholar]
- Wishart DS, Sykes BD, & Richards FM (1992). The chemical-shift index—A fast and simple method for the assignment of protein secondary structure through NMR- spectroscopy. Biochemistry, 31(6), 1647–1651. 10.1021/bi00121a010. [DOI] [PubMed] [Google Scholar]
- Wright PE, & Dyson HJ (1999). Intrinsically unstructured proteins: Re-assessing the protein structure-function paradigm. Journal of Molecular Biology, 293(2), 321–331. [DOI] [PubMed] [Google Scholar]
- Xie HB, Vucetic S, Iakoucheva LM, Oldfield CJ, Dunker AK, Obradovic Z, et al. (2007a). Functional anthology of intrinsic disorder. 3. Ligands, post-translational modifications, and diseases associated with intrinsically disordered proteins. Journal of Proteome Research, 6, 1917–1932. 10.1021/pr060394e. [DOI] [PMC free article] [PubMed] [Google Scholar]
- Xie HB, Vucetic S, Iakoucheva LM, Oldfield CJ, Dunker AK, Uversky VN, et al. (2007b). Functional anthology of intrinsic disorder. 1. Biological processes and functions of proteins with long disordered regions. Journal of Proteome Research, 6, 1882–1898. 10.1021/pr060392u. [DOI] [PMC free article] [PubMed] [Google Scholar]
- Zhang HY, Neal S, & Wishart DS (2003). RefDB: A database of uniformly referenced protein chemical shifts. Journal of Biomolecular NMR, 25(3), 173–195. 10.1023/A:1022836027055. [DOI] [PubMed] [Google Scholar]
- Zor T, De Guzman RN, Dyson HJ, & Wright PE (2004). Solution structure of the KIX domain of CBP bound to the transactivation domain of c-Myb. Journal of Molecular Biology, 337(3), 521–534. 10.1016/j.jmb.2004.01.038. [DOI] [PubMed] [Google Scholar]
- Zsuzsanna D (2018). Prediction of protein disorder based on IUPred. Protein Science, 27(1), 331–340. 10.1002/pro.3334. [DOI] [PMC free article] [PubMed] [Google Scholar]


