

Abstract
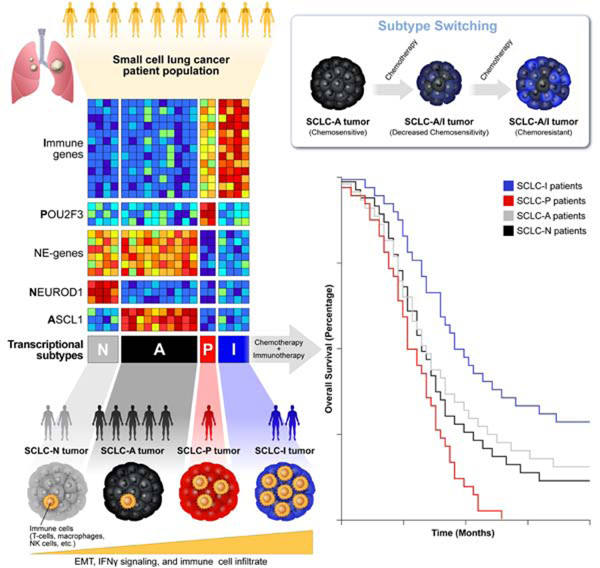
Despite molecular and clinical heterogeneity, small cell lung cancer (SCLC) is treated as a single entity with predictably poor results. Using tumor expression data and non-negative matrix factorization, we identify four SCLC subtypes defined largely by differential expression of transcription factors ASCL1, NEUROD1, and POU2F3 or low expression of all three transcription factor signatures accompanied by an Inflamed gene signature (SCLC-A, N, P and I, respectively). SCLC-I experiences the greatest benefit from the addition of immunotherapy to chemotherapy, while the other subtypes each have distinct vulnerabilities, including to inhibitors of PARP, Aurora kinases, or BCL-2. Cisplatin treatment of SCLC-A patient-derived xenografts induces intratumoral shifts toward SCLC-I, supporting subtype switching as a mechanism of acquired platinum resistance. We propose that matching baseline tumor subtype to therapy, as well as manipulating subtype switching on therapy, may enhance depth and duration of response for SCLC patients.
Keywords: SCLC, neuroendocrine, ASCL1, NEUROD1, POU2F3, EMT, intratumoral heterogeneity
Graphical Abstract
eTOC Blurb
Gay et al. provide a classification for four subtypes of small cell lung cancer, each with unique molecular features and therapeutic vulnerabilities. An inflamed, mesenchymal subtype predicts benefit with the addition of immunotherapy to chemotherapy. Intratumoral switching between chemosensitive and chemoresistant subtypes accompanies therapeutic resistance.
Introduction
Small cell lung cancer (SCLC) is an aggressive neuroendocrine malignancy with dismal survival rates (Byers and Rudin, 2015). Despite the addition of immunotherapy to platinum-based frontline chemotherapy, the absolute improvements in progression-free survival (PFS) and overall survival (OS) are modest (Antonia et al., 2016; Chung et al., 2020; Horn et al., 2018; Paz-Ares et al., 2019). In contrast to non-small cell lung cancer (NSCLC), where biomarker selection for targeted- and immuno- therapies has dramatically altered treatment approaches (Zimmermann et al., 2018), clinical trials for SCLC patients have largely focused on unselected populations and have yielded predictably disappointing results. A clearer definition of the features of SCLC that govern response to targeted- and immuno-therapies represents a fundamental unmet need.
SCLC was once characterized as molecularly homogeneous due to near-universal loss of TP53 and RB1 and neuroendocrine/epithelial differentiation. The identification of subsets of MYC-driven SCLC that possess unique therapeutic vulnerabilities (Cardnell et al., 2017; Chalishazar et al., 2019; Mollaoglu et al., 2017) or chemoresistant, mesenchymal SCLC variants (Allison Stewart et al., 2017; Bottger et al., 2019) suggested the need to refine this characterization to accommodate inter-tumoral heterogeneity. The consensus definition of SCLC subtypes has evolved from classic/variant to neuroendocrine (NE)/non-neuroendocrine (non-NE) to transcription factor defined subsets (Carney et al., 1985; Gazdar et al., 1985; Rudin et al., 2019; Zhang et al., 2018). Historically, these subsets centered on the expression of NE transcription factors ASCL1 and/or NEUROD1 (Borromeo et al., 2016). A third transcription factor, POU2F3, was recently identified as defining a previously unappreciated non-NE, tuft-cell variant of SCLC (Huang et al., 2018). Despite the addition of this third subtype, many SCLC tumors fall outside of these three groups. A putative fourth subtype driven by the transcription factor YAP1 (Rudin et al., 2019) proposed a partial solution to these unclassified tumors, although subsequent immunohistochemical (IHC) analyses failed to confirm a unique YAP1 subtype (Baine et al., 2020). It is unknown whether these classifications predict responses to most chemo-, targeted-, or immune-based therapies.
In addition to inter-tumoral heterogeneity, several reports have demonstrated the impact that intra-tumoral heterogeneity (ITH) may exert on the natural history of SCLC. In SCLC genetically engineered mouse models (GEMMs), intra-tumoral variation in Notch pathway activation governs juxtaposition of chemosensitive, NE (Notch-low) cells and chemoresistant, non-NE (Notch-high) cells (Lim et al., 2017). Additional time-series single-cell RNA sequencing (scRNAseq) analyses of GEMMs suggest that MYC is capable of activating Notch to promote the dedifferentiation of ASCL1-positive, NE cells into, eventually, YAP1-positive, non-NE cells (Ireland et al., 2020). Consistent with these observations, we and others have shown that multiple transcriptional subtypes may exist within a single tumor (Gay CM, 2019; Ireland et al., 2020; Simpson et al., 2020). Our own scRNAseq analyses of SCLC circulating tumor cells (CTC)-derived xenograft (CDX) models demonstrate higher transcriptional ITH following platinum-resistance (Stewart et al., 2020b). These studies provide evidence of SCLC’s transcriptional plasticity and suggest that subtype plasticity could underlie evolving tumor response/resistance.
Here, we investigate whether transcriptional subtyping of SCLC inter-tumoral heterogeneity can identify molecular and immune subtypes with discrete therapeutic vulnerabilities. Furthermore, we consider whether subtype-specific ITH in response to treatment may underlie acquired therapeutic resistance.
Results
Defining the transcriptional subtypes of SCLC
In an unbiased attempt to identify SCLC subtypes, we applied non-negative matrix factorization (NMF) (Skoulidis et al., 2015) to previously published RNAseq data from 81 surgically resected, mostly limited-stage SCLC (LS-SCLC) tumors (George et al., 2015). Maximization of cophenetic correlation values was used to guide the optimal number of distinct clusters, with both three- and four-cluster options possessing virtually equivalent values approaching 1.0 (Figure 1A; Supplementary Figure 1A). The three- and four-cluster options included nearly identical groups with high ASCL1 (SCLC-A) or high NEUROD1 (SCLC-N) (Figure 1B-C, Supplementary Figure 1B-C). However, the four-cluster option separated the remaining tumors into a POU2F3 (SCLC-P) subgroup and a distinct group of SCLC tumors with lower expression of all three transcription factor signatures (Figure 1B-C, Supplementary Figure 1B-C). Differential expression of ASCL1, NEUROD1, and POU2F3 (Figure 1C) along with subsequent analyses support SCLC-P and this fourth subtype as biologically distinct and, thus, the four cluster approach was preferred.
Figure 1: NMF identifies four transcriptional subtypes of SCLC.
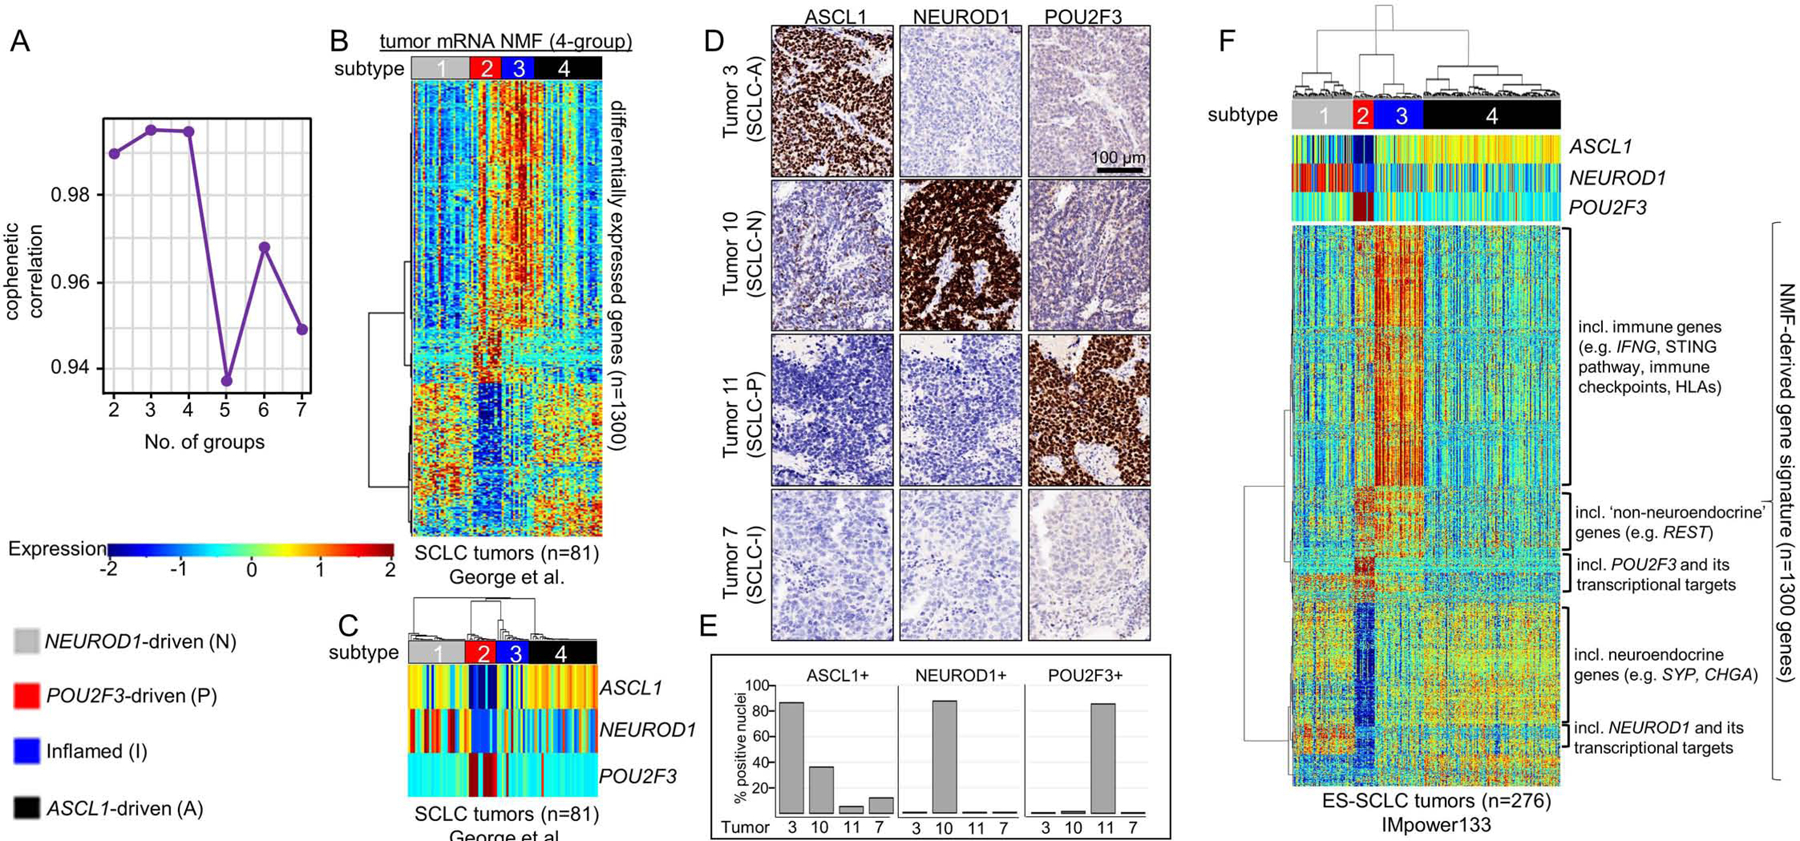
Cophenetic correlation from NMF analysis of resected SCLC tumors (A). Differential expression of NMF-selected genes (B) and, specifically, ASCL1, NEUROD1, and POU2F3 (C) across 4 clusters. IHC analysis of consecutive sections of patient SCLC tumor for ASCL1, NEUROD1, and POU2F3 demonstrating staining pattern for example of each of four subtypes (D). Bar graph indicating percentage of tumor cell nuclei positive for ASCL1, NEUROD1, and POU2F3 by IHC in each of four tumors above (E). Application of NMF-derived gene signature to independent ES-SCLC (IMpower133) tumor dataset revealing four SCLC subtypes (F). Sample sizes: n=81 tumors (B-C) and n=276 tumors (F).
Among the NMF-defined gene list (Supplementary Table 1), we observed differential expression of each transcription factor (Supplementary Figure 1D-F) and their targets (Supplementary Figure 1G) (Borromeo et al., 2016; Huang et al., 2018). In the fourth subtype, no prevailing transcriptional signature emerged, but the uniquely expressed genes included numerous immune checkpoints and human leukocyte antigens (HLAs). Thus, this subtype was designated SCLC-inflamed, or SCLC-I. SCLC tumors were not equally distributed across the four subtypes, demonstrating proportions as follows in the George et al. set: SCLC-A – 36%, SCLC-N – 31%, SCLC-I – 17%, and SCLC-P – 16%. Previously, in addition to the three transcription factor-defined subtypes (SCLC-A, -N, and –P), a fourth subtype defined by the transcription factor YAP1 was proposed (Rudin et al., 2019). We observed the expression of YAP1 (Supplementary Figure 1H) and its transcriptional targets (Supplementary Figure 1G) was higher in both SCLC-P and SCLC-I compared to the other two subtypes, but did not exclusively define a subtype – consistent with recent IHC characterization of SCLC tumors (Baine et al., 2020). Using monoclonal antibodies for ASCL1, NEUROD1, and POU2F3, we performed IHC on SCLC tumors and scored each for the fraction of tumor nuclei positive for each protein, as well as intensity (as measured by percentage of tumor nuclei multiplied by intensity on 0–3 scale, or H-score) (Supplementary Table 2). We identified representative examples of each of the four subtypes (Figure 1D-E), including a tumor with low expression of all three transcription factors, typical of SCLC-I.
While transcriptional SCLC tumor data sets are rare, we validated these subtypes in independent cohorts, including RNA microarray data from 23 SCLC tumor samples (Sato et al., 2013) (Supplementary Figure 1I). However, like the George et al. dataset, these tumors were mostly LS-SCLC. To ensure that no subtype was a feature restricted to early stage patients, we validated the subtypes using RNAseq from treatment-naïve patients enrolled on the Phase 3 IMpower133 trial (n=276). This registration study enrolled treatment-naïve patients with confirmed extensive stage SCLC (ES-SCLC) and randomized 1:1 to carboplatin/etoposide (EP) with or without the anti-PD-L1 antibody atezolizumab and led to the approval of carboplatin/etoposide/atezolizumab (EP+atezo) as a standard of care for ES-SCLC (Horn et al., 2018). Using the same NMF-derived gene signature applied to the George et al. discovery set, we observe four subtypes defined by the aforementioned transcription factors, as well as other molecular features such as NE differentiation, inflammatory genes, and EMT (Figure 1F). The distribution of subtypes in IMpower133 (SCLC-A - 51%, SCLC-N - 23%, SCLC-I – 18%, SCLC-P – 7%) varies somewhat from George et al. Finally, using RNAseq from 62 SCLC cell lines (Stewart et al., 2020a) we identified representative cell line models of all four subtypes (Supplementary Figure 1J) confirming that subtype can be defined in the absence of tumor microenvironment.
Defining features of transcriptional subtypes
Using NE and non-NE gene lists (Zhang et al., 2018), we observed a clear distinction between NE subtypes (SCLC-A and –N) and non-NE subtypes (SCLC-P and –I) (Figure 2A). For example, SCLC-A and –N have significantly higher expression of two common NE markers, Chromogranin A (CHGA) and Synaptophysin (SYP) (Figure 2B-C), while RE1 Silencing Transcription Factor (REST), a repressor of NE genes (Lim et al., 2017), is higher in both SCLC-P and –I (Figure 2D).
Figure 2: Molecular and phenotypic distinctions between SCLC subtypes.
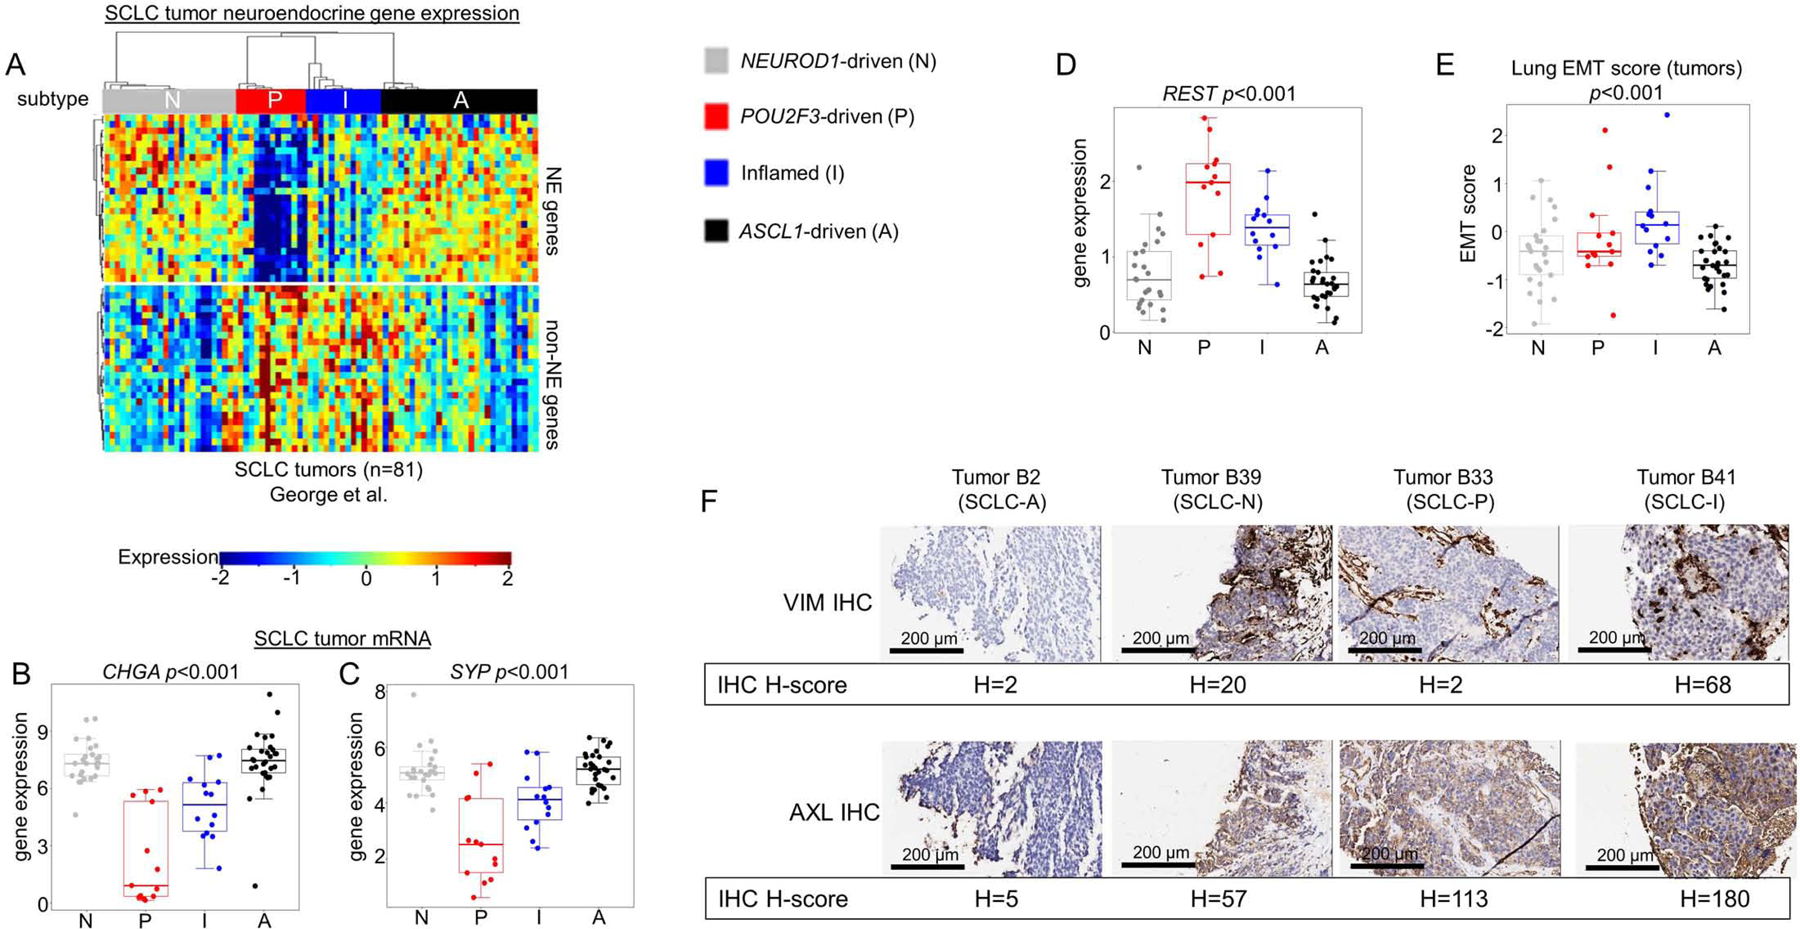
Differential expression of NE and non-NE genes across all SCLC tumors within each subtype (A), including comparison of mean expression of NE markers CHGA (B) and SYP (C) and REST, a transcriptional repressor of NE gene expression (D). Lung-specific epithelial-mesenchymal transition (EMT) score calculated for each SCLC tumor with comparison between mean EMT scores for each subtype (E). IHC analysis of representative tumors from SCLC-A and SCLC-N, as well as n=1 tumors of SCLC-I and SCLC-P, for Vimentin (VIM) and AXL protein expression with associated H-score (F). Sample sizes: n=81 tumors (A-E). p-values are the result of one-way ANOVA. Error bars: +/− 1.5x interquartile range (B-E).
While SCLC is considered an epithelial malignancy, EMT has been proposed as a potential mechanism of resistance (Allison Stewart et al., 2017; Bottger et al., 2019). Using a previously validated EMT score wherein more positive values indicate mesenchymal differentiation (Byers et al., 2013), SCLC-I is the most mesenchymal (highest mean score) and SCLC-A is the most epithelial (lowest mean score) (Figure 2E). Reverse-phase protein array (RPPA) data, which quantifies the expression of over 200 total and phospho-proteins for all 62 SCLC cell lines, supports this conclusion, as SCLC-I expresses very low levels of the epithelial marker E-cadherin (CDH1) and high levels of mesenchymal markers Vimentin (VIM) and AXL (Supplementary Figure 2A-C). Using representative tumors for each subtype identified by IHC (Supplementary Figure 2D), we compared IHC H-score for the mesenchymal markers VIM and AXL and found these most highly expressed in the SCLC-I tumor (Figure 2F). Such mesenchymal markers may serve as positive, confirmatory tumor assays to define SCLC-I.
Thyroid-transcription factor 1 (TTF1) expression is variable across SCLC tumors and its presence or absence has been proposed to define distinct SCLC subsets (Cardnell et al., 2017). Proteomic analysis of the SCLC cell lines demonstrates that the majority of TTF1-positive SCLC models fall within the SCLC-A subtype (Supplementary Figure 2E), consistent with NKX2–1 (the gene that encodes TTF1) as a known transcriptional target of ASCL1 (Borromeo et al., 2016).
Whole genome sequencing efforts revealed a high mutation rate in SCLC and near universal deleterious mutations in TP53 and RB1 (George et al., 2015). While RPPA assessment of p53 found no difference in expression between cell lines of the four subtypes (Supplementary Figure 2F), there was a modest increase in protein expression of RB1 in SCLC-I cell lines (Supplementary Figure 2G), although small sample sizes preclude strong conclusions. However, comparison between subtypes using tumor gene expression of the four most commonly deleted genes reported by George et al. in SCLC identified no stark differences (Supplementary Figure 2H). These investigators also reported several commonly amplified genes (George et al., 2015). While this copy number information is unavailable, we used gene expression values for these genes as a proxy for copy number variation (CNV) (Supplementary Figure 2I). The majority of these genes show no variation in expression across subtypes, with the exception that MYC expression is significantly higher in the SCLC-P subtype (Supplementary Figure 2J), suggesting that MYC-amplifications may preferentially associate with SCLC-P.
We tested whether these four distinct subtypes are associated with specific genomic alterations. Using the criteria established by George et al. for functional significance, we examined the mutational landscape across the four subtypes (Supplementary Figure 2K-N) and observed no significant differences in frequency between subtypes, including in TP53 and RB1 (George et al., 2015).
Thus, a phenotypic portrait of each subtype emerged from the coalescence of genomic, transcriptomic, and proteomic data across multiple cohorts. SCLC-A is an NE, epithelial subtype characteristic of TTF1-positive SCLC. While still highly NE, SCLC-N largely lacks TTF1 expression. Meanwhile, non-NE SCLC consists of SCLC-P and SCLC-I, which can be further subdivided based on EMT.
SCLC-I is a novel, inflamed SCLC subtype
In SCLC, responses to immune checkpoint blockade (ICB) are rare, likely due, in part, to low infiltration by immune cells and, specifically, cytotoxic T-cells (Hamilton and Rath, 2019). The expression of both CD8A and CD8B, is significantly higher in SCLC-I, suggesting greater cytotoxic T-cell infiltration (Figure 3A-B). For a comprehensive assessment of immune cell infiltration, we used CIBERSORTx deconvolution (Newman et al., 2019) to quantify various immune populations using gene expression. As expected, SCLC-I tumors have the highest total immune infiltrate (Figure 3C) and cytolytic activity (CYT) score (Supplementary Figure 3A). While similar immune cell types were present in each subtype (Supplementary Figure 3B), the absolute number of several immune cell populations were markedly increased in SCLC-I, including T-cells, NK cells, and macrophages (Figure 3D).
Figure 3: SCLC-I defines an inflamed subtype of SCLC.
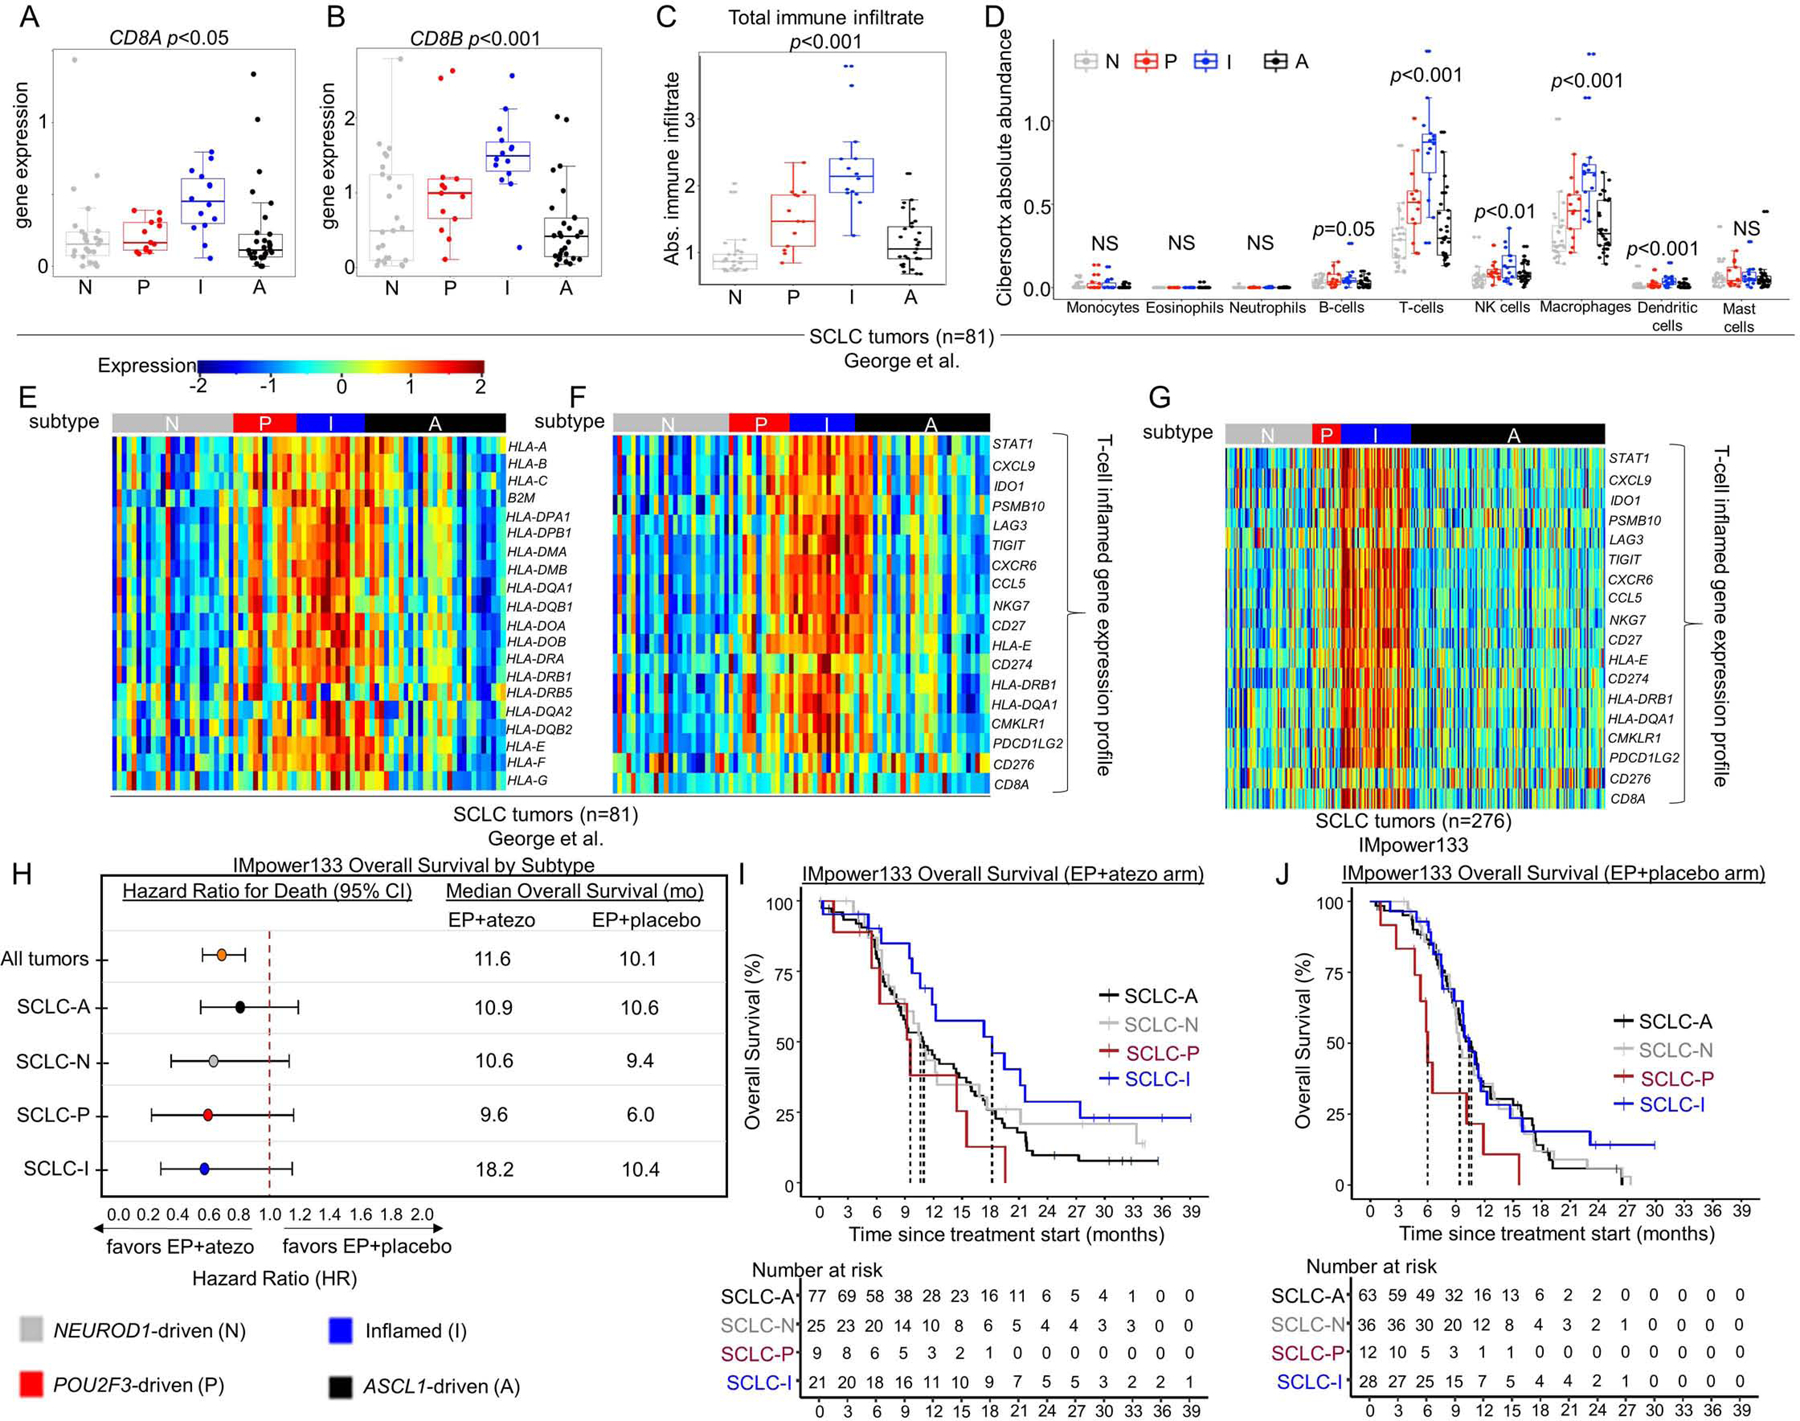
Comparison of mean gene expression of CD8+ T-cell markers (A-B). CIBERSORTx analysis of total immune infiltrate (C) and specific immune cell populations (D). Heatmaps comparing expression of HLA and antigen presenting genes (E) and 18-gene -γ-related T-cell gene expression profile (F) across subtyped SCLC tumors from George et al. Heatmap comparing expression of 18-gene -γ-related T-cell gene expression profile among tumors from IMpower133 (G). Forest plot demonstrating hazard ratios for overall survival and median overall survival values between carboplatin/etoposide + atezolizumab (EP+atezo) and EP+placebo arms in patients from IMpower133 as a collective (all tumors) and by subtype (H). Kaplan-Meier curves on a subtype-by-subtype basis for overall survival in EP+atezo (I) and EP+placebo (J) arms in IMpower133. Sample sizes: n=81 tumors (A-F), 276 tumors (G), and 132 patients (atezo arm) and 139 patients (placebo arm) (H-J). p-values in A-D are the result of one-way ANOVA testing. Error bars: +/− 1.5x interquartile range (A-D) and +/− 95% CI (H).
Other proposed mechanisms of ICB resistance in SCLC include low expression of HLAs, interferon signatures, and immune checkpoints (Hamilton and Rath, 2019). Genes encoding HLAs and other antigen presenting machinery are expressed at significantly higher levels in SCLC-I tumors from George et al. (Figure 3E). Expression of an 18-gene interferon-γ-related T-cell gene expression profile (GEP) (Ayers et al., 2017), which predicts response to ICB in solid tumors independent of tumor mutational burden (TMB) (Ott et al., 2019), was consistently higher in SCLC-I tumors (Figure 3F). While complete whole genome/exome DNA sequencing data was unavailable for these tumors to calculate precise TMBs, we utilized the proportion of mutated genes among the total genes as a proxy and observed no difference in mutation frequency across subtypes (Supplementary Figure 3C). SCLC-I tumors have higher expression of countless immune checkpoint molecules, including CD274, which encodes Programmed Death Ligand 1 (PD-L1), as well as PDCD1, which encodes its receptor Programmed Cell Death Protein 1 (PD-1) (Supplementary Figure 3D-E). The same is true for CD80 and CD86, which encode the ligands for Cytotoxic T-lymphocyte-associated protein 4 (CTLA4), and CTLA4 itself (Supplementary Figure 3F-H). Other targetable immune checkpoints more highly expressed in SCLC-I include CD38, IDO1, TIGIT, C10orf54 (VISTA), ICOS, and LAG3 (Supplementary Figure 3I-N). Additionally, Stimulator of Interferon Genes (STING)-induced T-cell attractant chemokines CCL5 and CXCL10 are more highly expressed in SCLC-I, again supporting an inflamed microenvironment primed for ICB response (Supplementary Figure 3O-P) (Della Corte et al., 2020; Kitajima et al., 2019; Pantelidou et al., 2019; Parkes et al., 2017; Sen et al., 2019).
SCLC-I tumors derive greater benefit from immune checkpoint blockade
IMpower133 was the first randomized trial to demonstrate PFS or OS improvements with ICB in SCLC (Horn et al., 2018). In this cohort, we again observed robust expression of the 18-gene T-cell GEP restricted to the SCLC-I group (Figure 3G). While the IMpower133 trial was not statistically powered for subtype-specific subgroup analyses, we investigated whether survival trends supported the hypothesis that SCLC-I tumors may preferentially benefit from ICB. When divided into assigned subtypes (Figure 1F), OS hazard ratios (HRs) support a trend toward benefit of EP+atezo across all four subtypes (Figure 3H), including a modest trend toward improved overall survival in SCLC-I (Figure 3I) relative to each of the other three subtypes that is not observed in the EP+placebo arm (Figure 3J). A subtype-by-subtype analysis comparing survival between EP+atezo and EP+placebo arms (Figure 3H; Supplementary Figure 4A-D) again highlights the trend toward survival benefit across subtypes, although the median overall survival and the magnitude of benefit with the addition of atezolizumab is numerically greater in SCLC-I. We found a median OS in SCLC-I of more than 18 months in the EP+atezo arm, compared to just over 10 months in the EP+placebo arm, the latter of which is comparable to that seen for SCLC-A and SCLC-N in the EP+placebo arm, suggesting that SCLC-I is not a prognostic marker. The addition of atezolizumab produces more modest gains in median OS in SCLC-A and –N than in SCLC-I. The SCLC-P sample size was small, but in this limited set, SCLC-P seemed to do especially poorly relative to the other three subtypes in each arm, despite the trend toward improvement with EP+atezo. These data suggest that SCLC-P subtype identity may be a poor prognostic marker. As expected, we observed a significant OS benefit for SCLC-I relative to all other tumors (HR=0.566, 95% CI:0.321 – 0.998) in the EP+atezo arm but not the EP+placebo arm (Supplementary Figure 4E-F), suggesting SCLC-I subtype assignment may be predictive of ICB benefit.
Unique therapeutic vulnerabilities across subtypes
To investigate other subtype-specific vulnerabilities, we utilized SCLC cell line in vitro drug response data for over 500 drugs from our own and publicly available data (Gay CM, 2019; Polley et al., 2016). While SCLC-P and SCLC-I cell line models represent small sample sizes, several consistent findings emerged. For cisplatin, the backbone of the standard of care for SCLC, we observed a trend toward SCLC-P models as the most sensitive (p=0.06), while SCLC-N and, especially, SCLC-I models were resistant to cisplatin and SCLC-A models demonstrated a range of sensitivities (Supplementary Figure 5A).
SCLC-P models were significantly more sensitive to all five PARP inhibitors (PARPi) tested in these data sets (Figure 4A; Supplementary Figure 5B). Additionally, the SCLC-P subtype was consistently most sensitive to anti-metabolites including anti-folates and nucleoside analogues (Figure 4A). Previous reports have identified the expression of SLFN11 as a key predictor of PARPi and platinum sensitivity in SCLC (Allison Stewart et al., 2017; Lok et al., 2017; Murai et al., 2016; Pietanza et al., 2018). It is notable that PARPi sensitivity observed for the SCLC-P subgroup was accompanied by modest and inconsistent expression of SLFN11, despite consistent response to PARPi. Most of the highest SLFN11-expressing models are SCLC-A (Supplementary Figure 5C). Within SCLC-A, there is bimodal expression of SLFN11 and, if separated by high and low expression of SLFN11, there are stark differences in sensitivity to cisplatin (Figure 4B) and the PARPi olaparib (Figure 4C). Thus, additional second-order biomarker analysis beyond binary consideration of ASCL1 may be required to identify further candidates in this subtype.
Figure 4. SCLC subtypes possess unique therapeutic vulnerabilities.
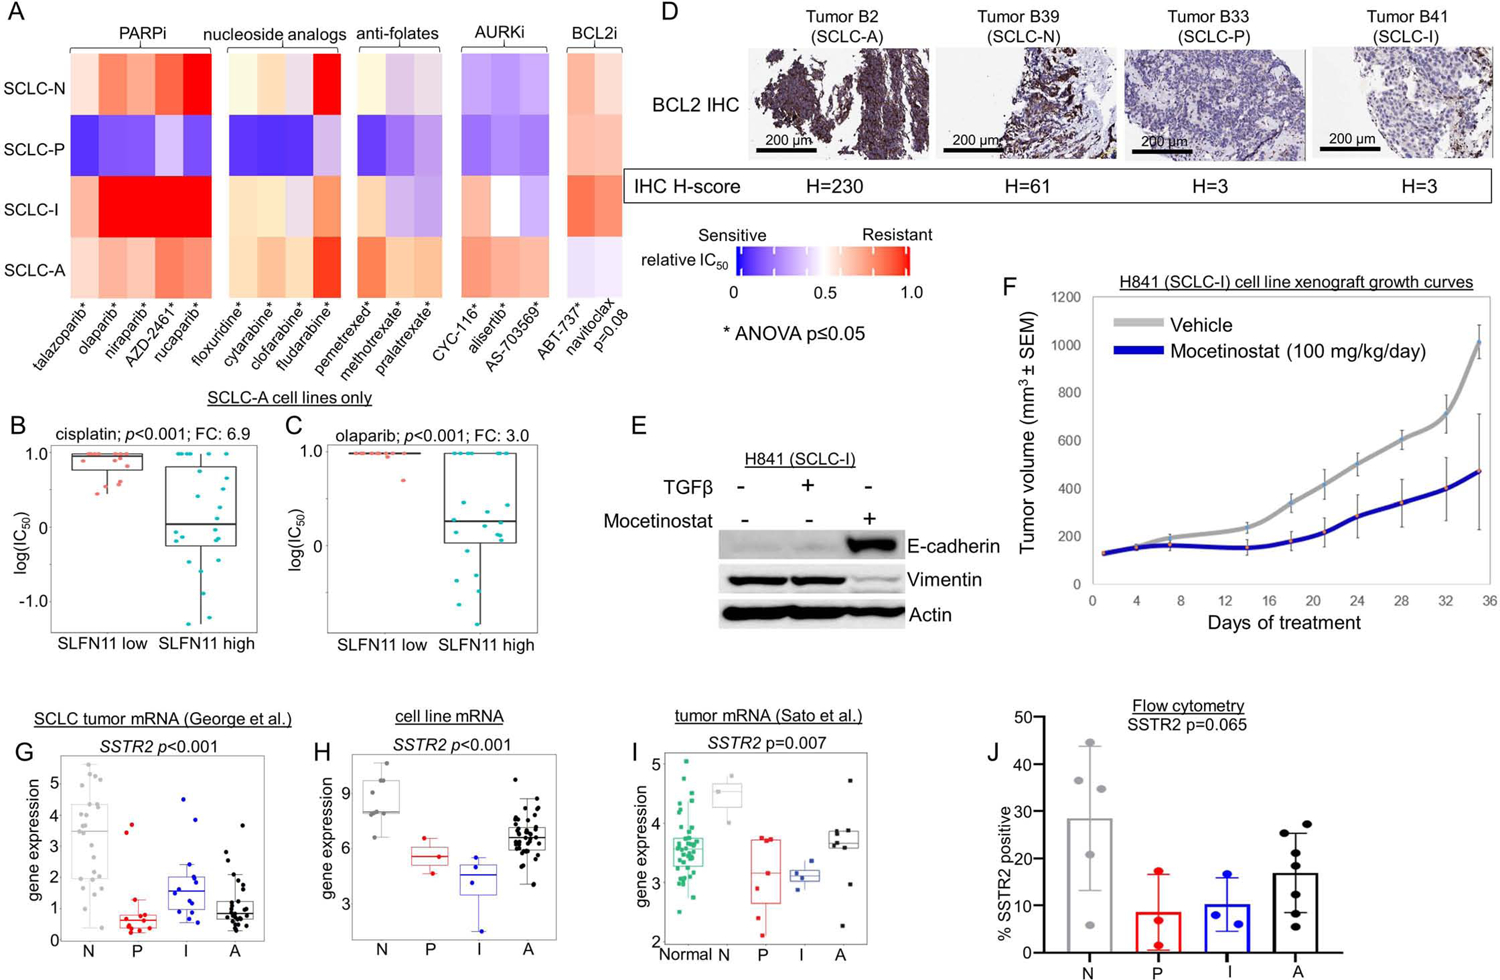
Comparison between each SCLC cell line subtype of mean relative in vitro IC50 values for PARP inhibitors, nucleoside analogs, anti-folates, AURK inhibitors, and BCL2 inhibitors (A). Comparison if IC50 values for cisplatin (B) and the PARPi olaparib (C) among SCLC-A cell lines separated into high and low SLFN11 expression. IHC analysis of tumors representing each subtype (representative images for SCLC-A and –N; and n=1 each for SCLC-P and –I) for expression of BCL2, with associated H-score noted (D). Western blot showing expression of E-cadherin and Vimentin in H-841 cell line with addition of TGFβ (EMT inducer) and mocetinostat (E). Murine H841 flank cell line xenograft growth curves with vehicle or mocetinostat treatment (F). Mean expression of the cell surface protein encoding gene SSTR2 in multiple datasets (G-I) along with flow cytometry analysis of proportion of analyzed cells that express SSTR2 protein in subtyped cell lines (J). Sample sizes: n=62 cell lines (A, H), n=38 cell lines (B-C), n=8 mouse tumors per treatment arm 81 tumors (G), n=23 tumors (I), and n=18 cell lines (J). p-values are the result of one-way two-sided T-test (B-C) or one-way ANOVA (A, G-J). Error bars: +/− 1.5x interquartile range (B-C, G-J) or +/− SEM (F).
SCLC-N models were highly sensitive to multiple Aurora kinase (AURK) inhibitors (AURKi) (Figure 4A, Supplementary Figure 5D). cMYC protein expression is a predictive biomarker for AURKi sensitivity (Cardnell et al., 2017; Gay et al., 2019; Mollaoglu et al., 2017; Owonikoko et al., 2020). Accordingly, SCLC-N cell lines have robust expression of cMYC (Supplementary Figure 5E), although this is in contrast to data showing that SCLC-P tumors have the highest MYC gene expression (Figure 2G). While this discrepancy is not easily explained given current models, we also observe SCLC-P cell lines are similarly sensitive to AURKi (Figure 4A, Supplementary Figure 5D).
SCLC-A models are sensitive to multiple B-cell lymphoma 2 (BCL2) inhibitors (BCL2i) (Figure 4A). Expression of BCL2 protein is a known correlate of BCL2i sensitivity in SCLC (Cardnell et al., 2017; Gay et al., 2019; Lochmann et al., 2018), and many of the cell lines with the highest BCL2 protein expression are among the SCLC-A subtype (Supplementary Figure 5F). Further, in our IHC analyses, we consistently observed higher expression of BCL2 in SCLC-A tumors (Figure 4D).
Although, we predict that ICBs will be most effective in SCLC-I, this cannot be assessed in vitro, or even easily in vivo given the lack of GEMMs representing SCLC-I. Interestingly, another target commonly associated with immune cells, Bruton’s tyrosine kinase (BTK), is highly expressed among SCLC-I tumors (Supplementary Figure 5G). Accordingly, this subtype was the most sensitive to the BTK inhibitor (BTKi) ibrutinib (Supplementary Figure 5H). BTKi are approved for several hematologic malignancies but have not been previously explored as a target in SCLC. Another potentially targetable feature of SCLC-I tumors, albeit one that has largely eluded therapeutics in the past, is EMT. We have shown that SCLC-I is the most mesenchymal of the subtypes and reasoned that epigenetic modification may alter its EMT status and make it more amenable to treatment. We found that the investigational histone deacetylase inhibitor (HDACi) mocetinostat was capable of reducing Vimentin expression and increasing E-cadherin expression in an SCLC-I (H841) cell line, consistent with EMT reversal (Figure 4E). We generated an SCLC-I xenograft model via injection of this human cell line (H841) into murine flanks and treated tumors with either mocetinostat 100 mg/kg/day or vehicle only and found improved tumor control in the HDACi treated animals (Figure 4F).
We also hypothesized that SCLC subtypes may possess unique expression patterns of cell surface proteins (i.e. the surfaceome). These candidates may be uncovered when querying on a subtype-specific basis and could prove amenable to immune-based therapies, including chimeric antigen receptor (CAR) and antibody-drug conjugate (ADC) strategies. The inhibitory Notch ligand Delta-like ligand 3 (DLL3), for instance, was previously identified as highly expressed in SCLC, and was the target for the ADC rovalpituzumab tesirine (Rova-T), which was assessed in a Phase II clinical trial for SCLC. While the trial demonstrated only modest activity, DLL3 remains a target of interest with CAR T-cell and bispecific T-cell engager (BiTE) products in development. We observed that DLL3 protein is more highly expressed in SCLC-A tumors and virtually unexpressed in SCLC-P and -I tumors (Supplementary Figure 5I), while across three transcriptional data sets, DLL3 was most highly expressed in SCLC-A and lowest in SCLC-P and –I ( Supplementary Figure 5J-L). To investigate known cell surface targets more broadly, we examined expression of genes that encode known targets of therapeutic monoclonal antibodies, CARs, or ADCs (George et al., 2015; Sato et al., 2013; Stewart et al., 2020a).
Somatostatin receptor 2 (SSTR2) is a well-established target of somatostatin analogues (e.g. lanreotide) and is also the target of an ADC, PEN-221, already under development for NETs (Whalen et al., 2019; White et al., 2019). While SSTR2 is not broadly expressed in all SCLCs, we observed high expression in both SCLC-N tumors and cell lines (Figure 4G-I). Flow cytometric analyses confirmed expression of SSTR2 protein in SCLC-N cell lines and supported the trend toward greater relative expression in SCLC-N (Figure 4J). For SCLC-P and SCLC-I, we identified MICA, the gene which encodes MHC class I polypeptide–related sequence A, as highly expressed (Supplementary Figure 5M-O). MICA is the target of a molecule (IPH43) currently in preclinical development (Bonnafous, 2013). Carcinoembryonic antigen-related cell adhesion molecule 5 (CEACAM5), is the target of labetuzumab govitecan, an ADC in clinical investigation for patients with refractory metastatic colorectal cancer, as well as a CAR T-cell (Das, 2017; Dotan et al., 2017; Sharkey et al., 2018; Thistlethwaite et al., 2017). While this molecule is not an established target in SCLC, we observed significantly higher CEACAM5 expression in SCLC-A (Supplementary Figure 5P-R).
Clinical features of SCLC subtypes
Basic clinical data for the patients from our NMF analysis are available (George et al., 2015). There were no significant differences in relapse-free survival (Supplementary Figure 5S) or OS (Supplementary Figure 5T). Demographic information such as age at diagnosis (Supplementary Figure 5U), mean total pack-years of smoking (Supplementary Figure 5V), and sex (Supplementary Figure 5W) were also not significantly different among the groups. The majority of these tumors were from LS-SCLC patients who underwent surgical resection and very few are from ES-SCLC patients. Survival exceeded that typically seen for SCLC (Byers and Rudin, 2015) due to the bias toward very early stage disease. The few ES-SCLC patients were among the SCLC-A and SCLC-N subtypes, but there was no significant difference in frequency of non-limited stage status (Supplementary Figure 5X).
Intratumoral heterogeneity of SCLC subtypes
The prior analyses focused upon subtype intertumoral heterogeneity among SCLCs. However, these data sets lack the resolution to discern whether subtype intratumoral heterogeneity exists. IHC analyses revealed instances of tumors that largely represent a single subtype (Figure 1D-E; Supplementary Table 2). However, even these tumors have small populations of cells expressing other transcription factors. Others have made similar observations regarding ITH (Simpson et al., 2020). In rare cases, tumors appear truly mixed, with multiple subtypes present in substantial proportions within a single tumor - consider tumor #5, wherein ASCL1 and NEUROD1 expressing cells are found in spatially distinct regions (Figure 5A). Thus, subtype ITH can exist, raising the possibility that these subtypes may represent a spectrum or continuum and that subtype ITH with may underlie the natural history of SCLC. Indeed, recent studies using SCLC GEMMs suggest that individual tumor cells undergo temporal evolution from one transcription-factor defined subtype to another (Ireland et al., 2020).
Figure 5: Intratumoral heterogeneity of SCLC subtypes in tumors and tumor-derived models.
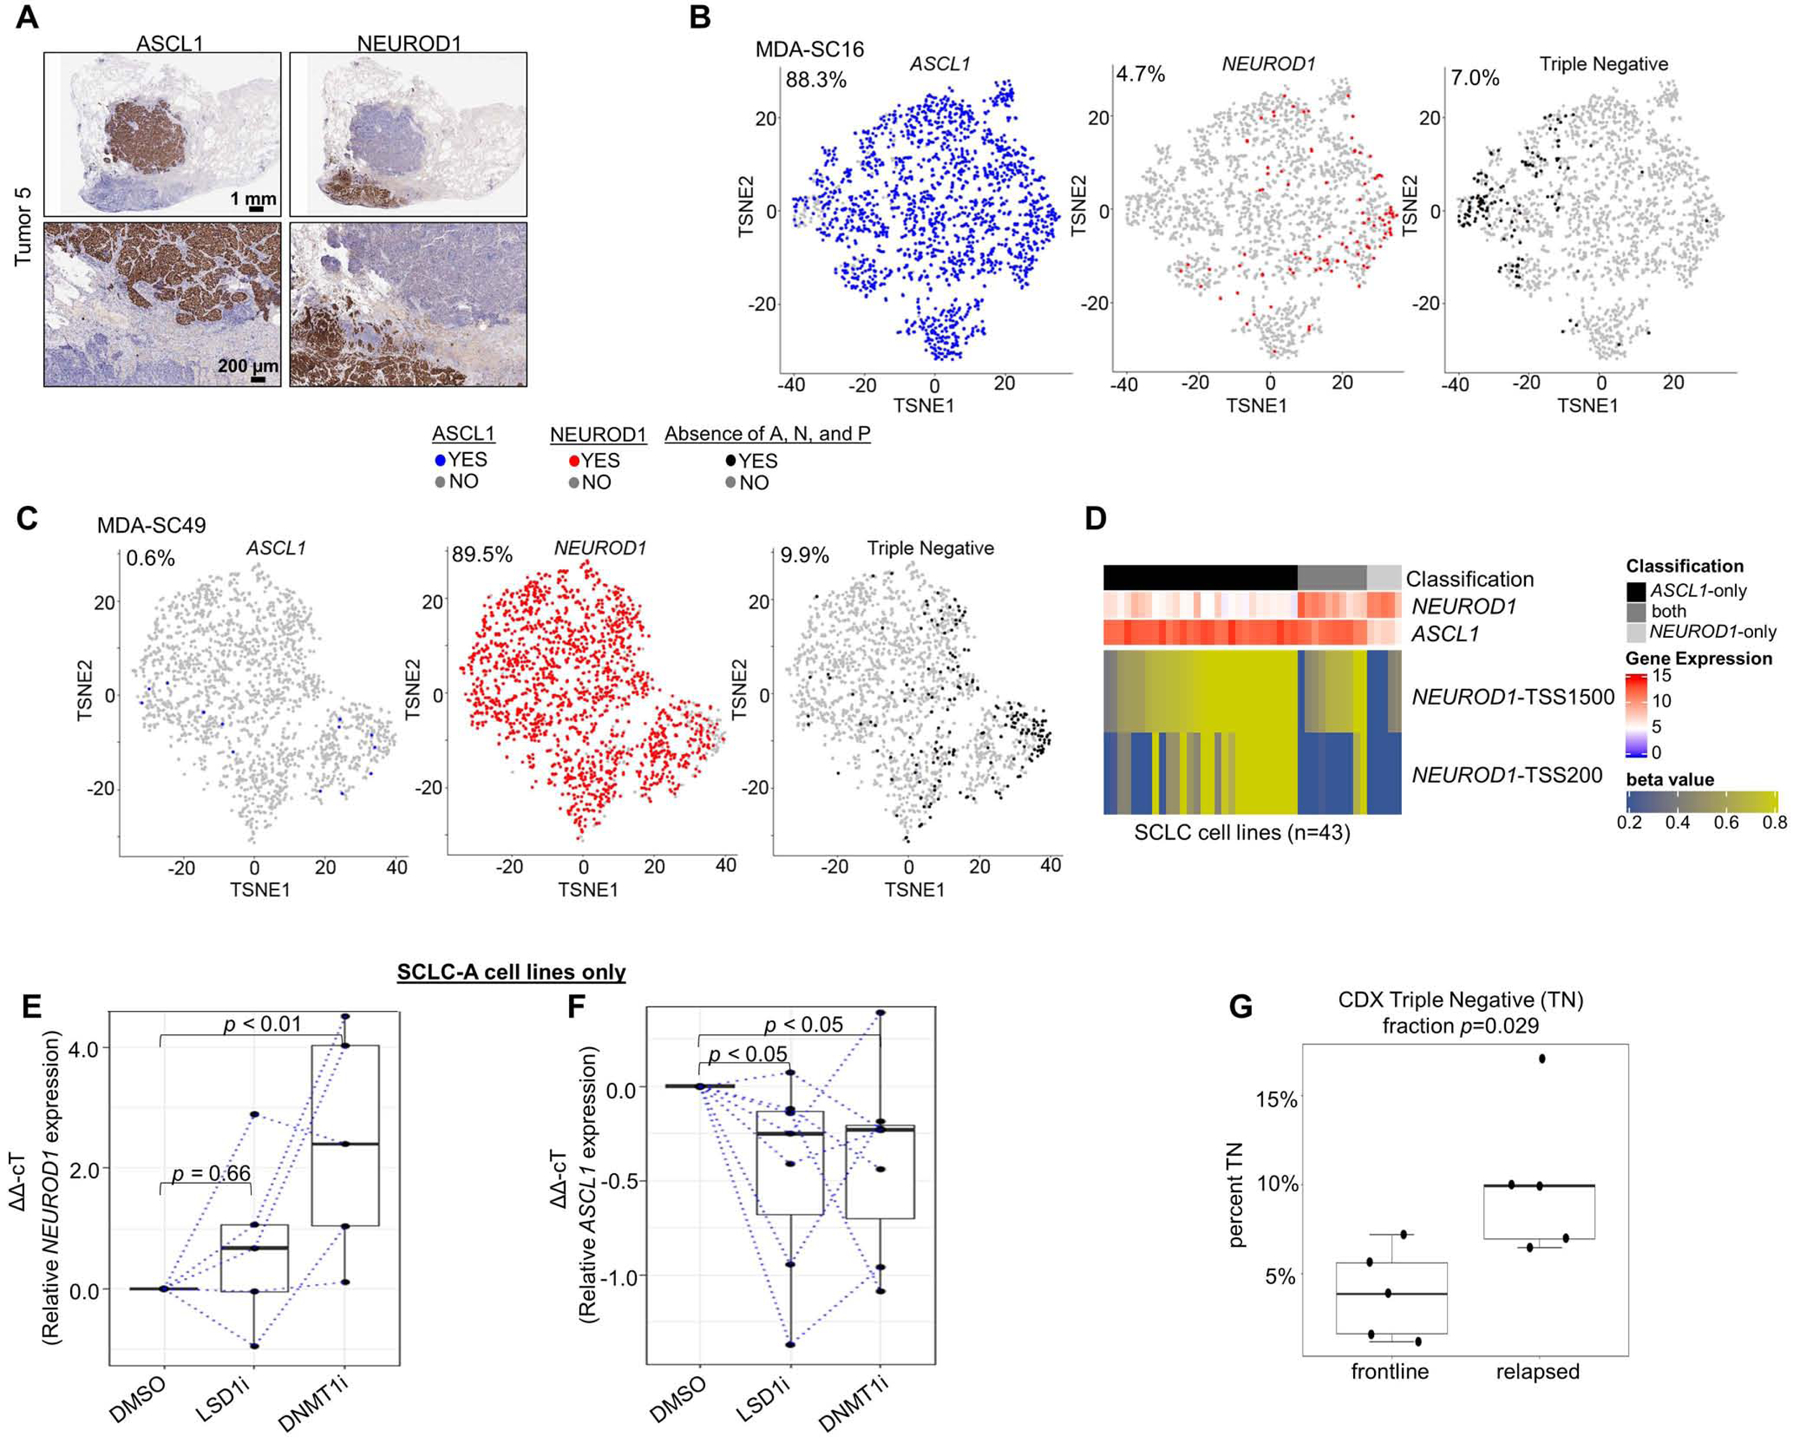
Spatially restricted IHC expression patterns of ASCL1 and NEUROD1 in heterogeneous tumor (A). t-SNE feature plots from scRNAseq for ASCL1, NEUROD1, and absence of ASCL1/NEUROD1/POU2F3 (SCLC-I; triple negative) in representative CDX model of SCLC-A (MDA-SC16) (B) and SCLC-N (MDA-SC49) (C) subtypes. Heatmap highlighting differential methylation (beta value) of NEUROD1 promoter both distal and proximal to transcriptional start site (TSS1500 and TSS200, respectively) in cell lines that express ASCL1-only, NEUROD1-only, or both (D). Relative expression of NEUROD1 (E) and ASCL1 (F) among SCLC-A cell lines following treatment with LSD1i and DNMT1i. Comparison of mean fraction of SCLC-I (triple-negative) cells from scRNAseq between CDXs derived from relapsed SCLC patients SCLC (relapsed) and those derived from never treated/currently frontline treated patients (frontline) (G). Sample sizes: n=2000 cells (B-C), n=28 cell lines (D), n=5 cell lines (E), and n=10 tumors (G). p-values are the result of Wilcoxon Rank Sum Test (E-F) or two-tailed T-test (G). Error bars: +/− 1.5x interquartile range (E-F) or +/− SEM (G).
We derived a series of CDX models from SCLC patients (Stewart et al., 2020b), including patients awaiting/receiving frontline therapy and patients whose disease has relapsed. These models have been extensively validated to ensure recapitulation of the original patient’s molecular and clinical response characteristics (Stewart et al., 2020b). Tumors from these models were dissociated into single-cell suspensions and subjected to 10xGenomics scRNAseq with subsequent filtering steps selecting 2,000 cells for each model (Stewart et al., 2020b). Based on single-cell expression of ASCL1, NEUROD1, and POU2F3, we find both SCLC-A and SCLC-N predominant models within our xenograft library (Supplementary Table 3). t-Distributed Stochastic Neighbor Embedding (t-SNE) feature plots illustrate the presence or absence of single-cell expression of ASCL1 and NEUROD1, along with cells that are considered triple negative (as in SCLC-I). These plots underscore that even in ASCL1-predominant (Figure 5B) or NEUROD1-predominant (Figure 5C) xenograft tumors, there is modest subtype ITH.
scRNAseq also permits exploration of co-expression of subtype-defining transcription factors. Each cell can be classified into one of seven categories on the basis of the binary presence/absence of ASCL1, NEUROD1, and POU2F3 expression (and co-expression) (Supplementary Table 3). While most cells express only one of the transcription factors, the expression is not entirely mutually exclusive. While fewer than 1% of cells in any of the models expressed POU2F3, these rare POU2F3-positive cells all exhibit co-expression of ASCL1. Furthermore, in MDA-SC39, nearly 10% of the cells express both ASCL1 and NEUROD1, although this fraction is much lower in other tumors. While we found in bulk analyses that ASCL1 and NEUROD1 may be sometimes co-expressed in the same tumor (examples in Figure 1C) and that this may occur in a mutually exclusive pattern (as in Figure 5A), these data demonstrate that such co-expression can occur at the single-cell level.
We considered that epigenetic regulation might govern a continuum of expression ranging from ASCL1-only to NEUROD1-only, with co-expression representing a transition state. We classified SCLC cell lines as ASCL1-only, NEUROD1-only, or “both” on the basis of gene expression. Using publicly available methylation data, we observed that these three classifications can be discriminated by the methylation beta-values of the region upstream of the NEUROD1 transcriptional start site (TSS) (Figure 5D; Supplementary Figure 6A-B). Specifically, ASCL1-only cell lines have relatively high methylation of sites both proximal and more distal to the NEUROD1 TSS, while NEUROD1-only cell lines have virtually no methylation of proximal and little methylation of more distal sites. Cell lines classified as “ both” demonstrate low methylation of proximal sites but methylation of more distal sites nearly as high as the ASCL1-only cell lines. As predicted, manipulation of epigenetic machinery can modulate the expression of NEUROD1 and, to some extent, ASCL1. We selected seven SCLC-A cell lines with low to undetectable expression of NEUROD1 at baseline, but robust expression of ASCL1. Treatment with an inhibitor of lysine-specific histone demethylase 1A (LSD1i) results in little change of NEUROD1 expression (Figure 5E). However, treatment with decitabine, an inhibitor of DNA methyltransferase 1 (DNMT1i), results in significant, consistent upregulation of NEUROD1 expression (Figure 5E), including in two cell lines with no detectable expression of NEUROD1 at baseline (data not shown). Meanwhile, both LSD1i and DNTM1i treatment results in modest, comparable downregulation of ASCL1 (Figure 5F). Together these data suggest that epigenetic mechanisms may regulate the distinction between SCLC-A and SCLC-N models.
Emergence of SCLC-I populations accompanies platinum resistance
In our scRNAseq data, we noted increased triple negative (i.e. SCLC-I) cells in platinum-relapsed models (Supplementary Table 3; Figure 5G). As SCLC-I represents a highly platinum-resistant subtype, we reasoned that intratumoral shifts toward increasing SCLC-I may underlie platinum resistance. We selected two platinum-sensitive, ASCL1-predominant CDX models developed from treatment-naïve patients (MDA-SC53 and MDA-SC68). These models were treated with cisplatin to maximal response and then throughout relapse (“cis-relapsed”) and collected for scRNAseq along with a matched vehicle treated tumor of same size (“treatment-naïve”) ( Supplementary Figure 7A and (Stewart et al., 2020b)). Using t-SNE feature plots, we compared the presence or absence of expression of ASCL1 between the parental treatment-naïve model and the cis-relapsed model and, in both cases, observed a reduction in ASCL1-positive proportion of cells (Figure 6A-B) and the emergence of a distinct “island” cluster (highlighted by rectangle, Figure 6A-B). In both cases, this cluster contains a majority of the ASCL1-negative cells that emerge post-relapse. A closer view of this cluster (Figure 6C-D), highlights that the ASCL1-negative cells do not gain expression of NEUROD1, POU2F3, or even YAP1 (Supplementary Figure 7B-C). Instead, we find that this cluster contains cells that are largely triple negative (SCLC-I) (Supplementary Figure 7D-E) and feature more mesenchymal EMT scores (Figure 6E-F) - again typical of SCLC-I cells. Furthermore, while cells from treatment-naïve models are almost universally negative for expression of HLAs, as expected for SCLC-A cells, those from the cis-relapsed model consistently gain expression of MHC class II genes, including HLA-DRB1 and HLA-DQA1 (Figure 6C-D, Supplementary Figure 7F-I), but only in cells within the SCLC-I island cluster.
Figure 6. Emergence of SCLC-I populations coincides with cisplatin resistance in SCLC-A predominant xenograft models.
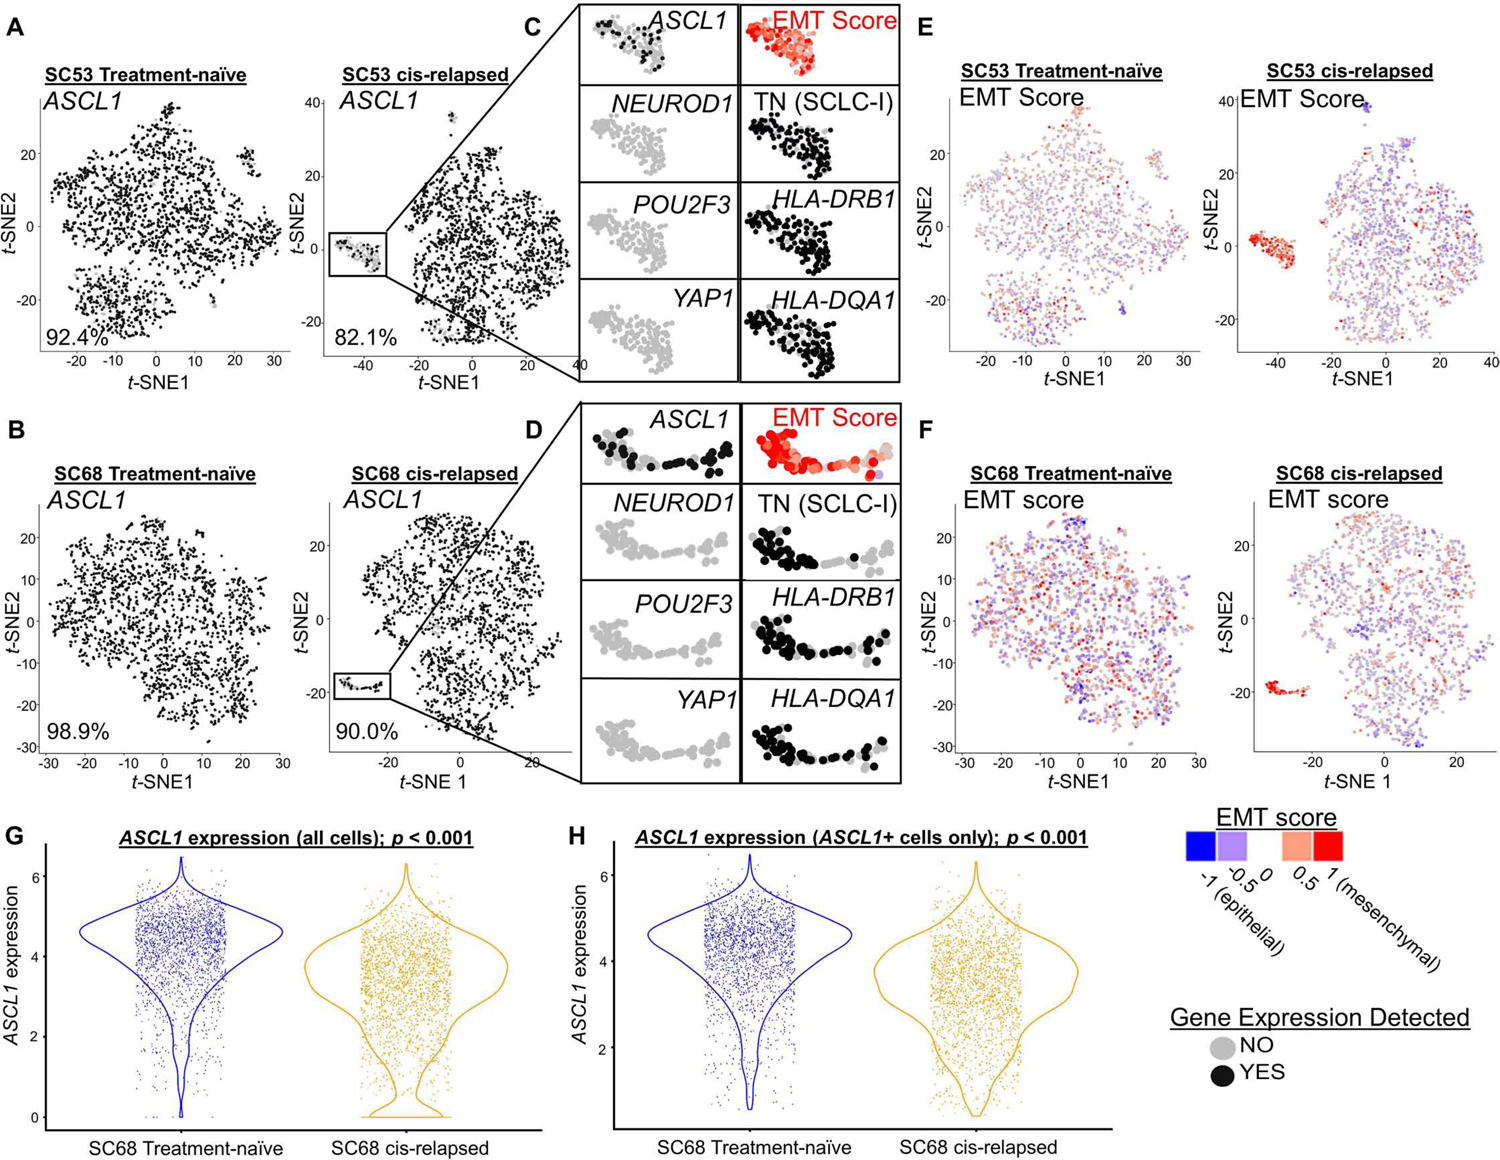
t-SNE feature plots from scRNAseq for ASCL1 comparing parental, treatment-naive and cisplatin-resistant/relapsed (cis-relapsed) CDX models (MDA-SC53, A; MDA-SC68, B). Highlighted portion of A and B illustrates distinct cluster with prominent ASCL1 loss (C, D). The cells in this region are now triple-negative (SCLC-I), with high EMT score (E, F). Violin plots comparing ASCL1 expression between MDA-SC68 treatment-naïve and cisplatin-relapsed xenograft tumors in all cells (G) and only ASCL1-positive cells (H). Sample sizes: n=2000 cells per arm. (A-H). p-values are the result of two-tailed T-test (G-H).
Prior studies have proposed that Notch activation is capable of mediating a switch between NE and non-NE SCLC cell fates (Ireland et al., 2020; Lim et al., 2017), similar to that observed in SCLC-A to SCLC-I. We compared expression of the Notch pathway transcriptional target HES1 between treatment-naïve and cis-relapsed pairs. In MDA-SC53, we see a modest increase in HES1 expression following relapse, indicating Notch activation, restricted to regions populated by SCLC-I cells (Supplementary Figure 7D; 8A). While in MDA-SC68, HES1 expression is modestly reduced following relapse, although the SCLC-I cluster maintains significant HES1 expression (Supplementary Figure 7E; 8B). The Notch inhibitory ligand, and putative SCLC target, DLL3 demonstrates precisely the inverse, as expected for a molecule that reduces Notch activation. In both MDA-SC53 and MDA-SC68, DLL3 expression is essentially absent in SCLC-I clusters (Supplementary Figure 8C-D), although overall DLL3 is modestly increased post-relapse in MDA-SC53 and markedly decreased in MDA-SC68. These fluctuations in Notch targets and inhibitors are consistent with prior data highlighting the role of Notch signaling in SCLC phenotypic switching. While one recent study identified MYC activation as a critical initiator of this process, our models demonstrated minimal MYC, MYCL, or MYCN expression in regions populated by SCLC-I (Supplementary Figure 8E-F; data not shown).
It is not clear whether the small populations of SCLC-I cells that emerge following cisplatin-relapse are sufficient to drive the observed platinum resistance. Two hypotheses account for ways that the observed subtype switching could drive global resistance. The first hypothesis suggests the limitations of the binary assessment of single-cell subtype used here underestimates the level of subtype evolution. In both MDA-SC68 and MDA-SC53, we see a global reduction in the level of ASCL1 expression following platinum resistance (Figure 6G; Supplementary Figure 8G). This reduction is not solely due to those cells which are now ASCL1 null, as illustrated by similar analyses using only those cells that retain some ASCL1 expression (Figure 6H; Supplementary Figure 8H). In both cases, the EMT score also significantly increases following cisplatin-relapse even when restricted to ASCL1-positive cells (Supplementary Figure 8I-J). Together, these data suggest that even outside of the SCLC-I cluster containing now fully triple-negative cells, there is ongoing evolution toward lower ASCL1 expression and increasing features of SCLC-I (e.g. EMT) that may account for decreasing platinum-sensitivity.
A second, complementary hypothesis is that the SCLC-I cells that emerge following platinum-resistance may serve as a highly resistant, highly plastic (i.e. stem-like) population with potential to replenish the tumor even as still platinum-sensitive cells undergo cell death. To address this question, we explored quantitative measures of single cell plasticity using RNA velocity. First, we applied tSNE and a clustering algorithm to pooled cells from both cisplatin-naïve and cisplatin-relapsed tumors (Figure 7A-B; Supplementary Figure 9A-B). In each case, we again identified non-NE islands, similar to Figure 6, here almost exclusively composed of relapsed cells and showing an absence of ASCL1 and presence of SCLC-I features (e.g. ZEB2, a transcriptional mediator of EMT) (Figure 7C-D; Supplementary Figure 9C-D). Outside of the island clusters in MDA-SC68, sensitive and resistant cells often cluster together (Clusters 3, 6, and 7), but a significant portion of cells from the resistant model shifts to occupy an adjacent region of phenotypic space (Clusters 4, 5 and 8). RNA velocity shows that both cisplatin-naïve and cisplatin-relapsed samples exhibit positive velocity trending toward Cluster 4, making it a sink in the phenotypic landscape (Figure 7E-H). The populations in Clusters 9–10 are enriched in resistant cells and SCLC-I markers. While the velocity vector lengths for cells in the SCLC-I cluster are significant, the direction of movement of these cells is less clear. Therefore, we used Partition-Based Graphical Abstraction (PAGA) to further investigate this movement. PAGA is a computational tool that reconciles clustering with continuous cell transitions inferred from RNA velocity. As shown in the PAGA maps (Figure 7F, H), the SCLC-I cluster in the resistant sample is able to transition to Cluster 5 in the main population. This suggests that, under dynamic equilibrium, SCLC-I cells act as a source that transitions toward the resistant sink Cluster 4, via Cluster 5, both of which are enriched with relapsed cells. Similar dynamics are observed in MDA-SC53, this time from Clusters 7, 9, and 10, which represent the island group of largely relapsed cells with SCLC-I features. As in MDA-SC68, velocity streams and PAGA maps suggest that these cells may act to replenish those cells in Clusters 1, 4, and 6, which are enriched for resistant cells (Supplementary Figure 9E-H).
Figure 7: Emerging SCLC-I populations support tumor-wide resistance via transcriptional plasticity.
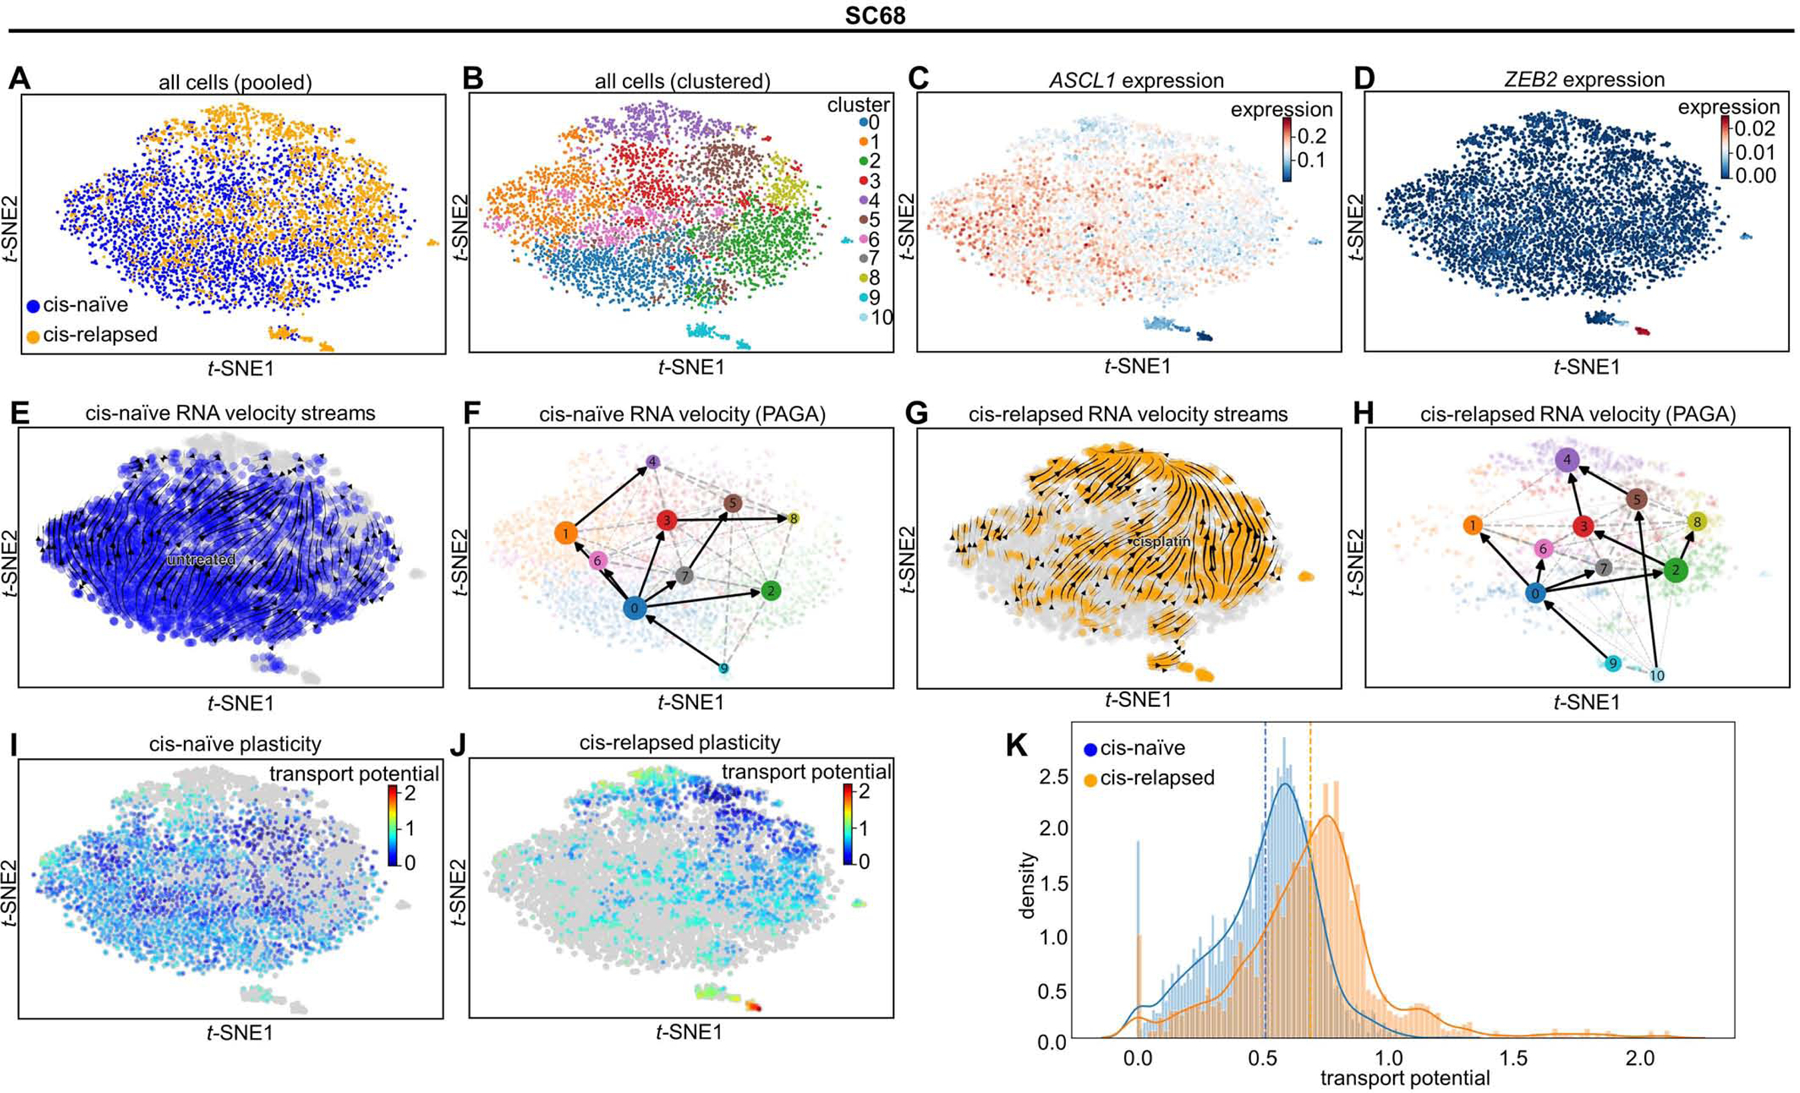
tSNE projection of all cells from MDA-SC68 CDXs with treatment history (A) or Leiden clustering assignment (B) denoted. Expression of ASCL1 (C) and ZEB2 (D) in these cells. Note the upper right, composed largely of cisplatin-relapsed cells, demonstrates lower ASCL1 expression, while the island clusters are essentially ASCL1-null. RNA velocity vector streams and PAGA maps for cells from cisplatin-naïve (E-F) and cisplatin-relapsed (G-H) CDX tumors. Cell plasticity, as measured by cell transport potential, for cells from cisplatin-naïve (I) and cisplatin-relapsed (J) tumors highlighting areas of greatest plasticity in island cluster within relapsed tumor. Comparison of transport potential between cisplatin-naïve and –relapsed cells (K) demonstrating higher overall plasticity in cisplatin-relapsed cells. Sample sizes: n=2000 cells per arm.
These observations suggest that the SCLC-I clusters in each model are highly plastic and may give rise to a more proliferative SCLC population. To test this possibility, we used RNA velocity to derive a metric for characterizing the plasticity of individual cells. Pulling from the theoretical notion of landscape potential, we call this metric Cell Transport Potential (CTrP). Briefly, CTrP is the average distance each cell is likely to travel through phenotypic space, calculated for each cell as the sum of distances to every other cell, weighted by the Markov-chain-model-derived probability of being found in each cell state (See Methods). Because the CTrP metric is a distance, it can be compared across samples, allowing us to compare the plasticity of SCLC-I cells to the rest of the resistant and the sensitive cells. The island clusters composed of relapsed, SCLC-I cells have markedly higher CTrP and, thus, plasticity (Figure 7I-J, Supplementary Figure 9I-J). Furthermore, resistant tumors show a near-universal increase in plasticity compared to sensitive tumors, and therefore SCLC-I cells are the most plastic phenotype regardless of treatment (Figure 7K; Supplementary Figure 19K). This suggests plasticity may be a defining characteristic of the resistant SCLC-I cells.
We also considered whether higher proliferation or lower death rates could explain SCLC-I as a source of progenitor, treatment-refractory cells. SCLC-I cells are not significantly upregulated in cell cycle (S or G2M) genes, nor do they significantly downregulate cell death markers (Supplementary Figure 9L-O). In fact, assigning a phase to each cell suggests most SCLC-I cells are quiescent, with increased G1 genes, and may upregulate death markers slightly. Thus, SCLC-I cells appear to be neither more proliferative nor less death-susceptible than the rest of the population.
Together, these single-cell analyses suggest that cisplatin resistance coincides with the emergence of a cluster of cells that typify the SCLC-I subtype, apparently derived from cells originally SCLC-A that have undergone subtype switching associated with fluctuations in Notch pathway activation. These SCLC-I cells, in turn, have stem-like features (e.g. plasticity) that may underlie the ability of a small population to drive a resistant tumor phenotype.
Discussion
SCLC has proven a challenge for the era of personalized therapy due, at least in part, to underappreciated inter- and intra-tumoral heterogeneity. Owing to their increased frequency, highly NE SCLC tumors driven by ASCL1 and NEUROD1, along with related factors such as cMYC and TTF1 expression, dominated previous efforts to delineate SCLC intertumoral heterogeneity (Cardnell et al., 2017; Carney et al., 1985; Gazdar et al., 1985; Zhang et al., 2018). The recent discovery of a non-NE, tuft cell variant of SCLC driven by POU2F3 (Huang et al., 2018) prompted a reevaluation of SCLC classification (Rudin et al., 2019). While non-NE SCLC has mostly been described as a single subtype (Zhang et al., 2018), we observed two unique non-NE molecular subtypes SCLC (SCLC-I and SCLC-P). SCLC-I exhibits EMT and an inflamed phenotype, with high expression of genes related to HLAs, interferon-γ activation, and immune checkpoints, consistent with the association between EMT and immune-related gene expression (Mak et al., 2016). Notably, SCLC-I is not specifically defined by YAP1 expression, distinguishing this classification from those proposed elsewhere (Rudin et al., 2019), and consistent with subsequent IHC analysis that failed to identify a distinct SCLC-Y population (Baine et al., 2020). While SCLC-I is defined partly by its inflammatory features, it is also identified in systems devoid of tumor immune microenvironment, suggesting both tumor-intrinsic and –extrinsic signaling may underlie the biology and distinct therapeutic vulnerabilities of this subtype.
The clinical implications of this subtype classification are significant, as each subtype demonstrates unique vulnerability to investigational therapies. Take, for instance, PARP inhibitors, for which high SLFN11 expression is the prevailing predictive biomarker at this time (Allison Stewart et al., 2017; Pietanza et al., 2018). It appears that POU2F3-expressing tumors may capture a unique, mostly SLFN11-independent cohort that is also sensitive to PARPi. Indeed, a recent study in which patient-derived xenografts (PDXs) were treated with the PARPi olaparib (plus temozolomide) in a murine co-clinical trial found the lone SCLC-P model had the longest time to progression (Farago et al., 2019). However, clinical validations are needed for many of the in vitro observations. Consider the disappointing efficacy of BCL-2 inhibitors in unselected SCLC patient populations (Paik et al., 2011; Rudin et al., 2012) in which, based on the prevalence of SCLC-A, we might predict greater benefit. In these trials, BCL2 inhibitors were assessed in relapsed patients only and this may highlight the potential for subtype evolution post-platinum impacting biomarker expression.
While ICB is now a standard-of-care for SCLC, predictive biomarkers for this therapeutic class have remained elusive, with evidence supporting (and opposing) TMB and PD-L1 expression (Chung et al., 2020; Hellmann et al., 2018). SCLC-I captures several features that are predictive of ICB response in other tumors. In the George et al. and IMpower133 data sets, SCLC-I constitutes ~17% and 18.5%, respectively, of all tumors, a comparable fraction to the response rates observed for ipilimumab/nivolumab (19–23%) and single-agent pembrolizumab (19%) in relapsed SCLC in CheckMate 032 (Antonia et al., 2016) and KEYNOTE-158 (Chung et al., 2020), respectively. Our subtype-specific analyses of the IMpower133 data supports the hypothesis that ICBs are especially effective in SCLC-I, while still supporting the use of the IMpower133 regimen irrespective of subtype. These analyses were, admittedly, unplanned and retrospective and, therefore, should be interpreted with these caveats in mind.
Single-cell analyses revealed that subtype-specific ITH may be a dynamic process, as populations of more chemoresistant triple negative (SCLC-I) cells increase with platinum treatment. In favor of subtype switching as the underlying mechanism, one of the two models analyzed (MDA-SC68), has essentially no pre-existing SCLC-I cells, as the few that are triple negative lack other features of SCLC-I, and may instead reflect gene dropout with scRNAseq. On the other hand, those triple-negative cells that emerge following relapse show consistent, robust features of SCLC-I, and we observe evidence of transcriptional shifts away from SCLC-A and toward SCLC-I even among cells that remain ASCL1 positive. Further, recent evidence from scRNAseq analysis of GEMMs show subtype and phenotypic evolution over developmental time (Ireland et al., 2020; Lim et al., 2017). Others demonstrated the spontaneous appearance of a mesenchymal, inflamed descendent in culture of an SCLC-A cell line (Canadas et al., 2018; Krohn et al., 2014). Our data, however, links this switching phenomena to treatment and, specifically, platinum resistance – consistent with the fact that SCLC-I cells are markedly platinum resistant in vitro. The presence of small populations of cells with features of multiple subtypes could highlight cells in transition between subtypes or cells with plasticity to adopt multiple subtypes. Downstream scRNAseq analyses also highlight the potential impact of even of a small population of highly plastic, SCLC-I cells. Thus, strategies aimed at targeting, or limiting, this treatment-induced population of SCLC-I cells are critical, in light of our analyses suggesting the stem-like features of this population.
Most SCLC tumors and models analyzed were easily classified into one of the four subtypes, permitting a realistic scenario in which prospective subtyping is performed in a single umbrella trial, wherein patients are assigned to a treatment arm (e.g. SCLC-I to combination ICB, SCLC-P to PARP inhibitors) on the basis of their SCLC subtype. Subtype could be determined, and then monitored dynamically, by transcriptional, proteomic, or even epigenetic classification. If any one of these predictions demonstrated significant benefit, it would represent the first standard-of-care molecular biomarker selection for SCLC and a foundational step toward personalized therapy for this devastating disease.
STAR METHODS
RESOURCE AVAILABILITY
Lead Contact
Further information and requests for resources and reagents should be directed to and will be fulfilled by the Lead Contact, Lauren A. Byers (lbyers@mdanderson.org).
Materials Availability
This study did not generate new unique reagents.
Data and Code Availability
The code generated during this study is available at GitHub (https://github.com/MD-Anderson-Bioinformatics/SCLC-Cancer-Cell-Manuscript). Previously unpublished datasets used and/or generated during this study are available as follows: SCLC cell line RNAseq via GEO Database (GSE151904), SCLC CDX single-cell RNAseq via GEO Database (GSE138474), and transcriptomic data from n=1302 genes for IMpower133 patients (EGAS00001004888).
EXPERIMENTAL MODEL AND SUBJECT DETAILS
All murine experiments were performed using 6 week old athymic nude mice from Envigo. All animals were maintained in accordance with the Institutional Animal Care and Use Committee of the M.D. Anderson Cancer Center and the NIH Guide for the Care and Use of Laboratory Animals.
No human experiments were performed within this context of this study. However, clinical outcome data that had previously been reported, including demographic information, (Horn et al., 2018) was subjected to subgroup analysis. The subgroup analysis included 271 patients with transcriptional and clinical outcome data available and within this subgroup ages ranged from 26 to 84 years (median = 64 years) and gender breakdown was 36.9% female and 63.1% male.
METHOD DETAILS
Gene and protein expression
Gene expression data included publically available data for SCLC tumors and cell lines (George et al., 2015; Polley et al., 2016; Sato et al., 2013). Protein expression was assessed for ~200 total and phosphor-proteins in SCLC cell lines by RPPA as previously described (Byers et al., 2012). In both cases, numeric values for gene or protein expression represent relative, or normalized, expression values and are log2 transformed, as previously described (Byers et al., 2012). Lung-specific EMT score was calculated using gene expression values as previously described (Byers et al., 2013). Tumor gene expression data is available via the European Genome-phenome Archive under the accession code EGAS00001000925 (George et al., 2015) and via NCBI Gene Expression Omnibus (GEO) Database under the accession code: GSE99312 (Sato et al., 2013). Cell line gene expression data is available via GEO Database under the accession code: GSE73162 (Polley et al., 2016). Additional cell line RNAseq data will be available via GEO Database under the accession code: GSE138474 at the time of publication, while RNAseq data from IMpower133 samples will be made public under planned publication embargo at the time of publication.
CIBERSORT deconvolution
Immune cell deconvolution of the RNAseq data was performed with CIBERSORTx (Newman et al., 2015; Newman et al., 2019), run in absolute mode using the LM22 signature over 1000 permutations. Cytolytic activity (CYT) score was calculated as previously described (Rooney et al., 2015) as the geometric mean of granzyme (GZMA) and perforin (PRF1) expression.
Drug response data
With the exception of cisplatin (Allison Stewart et al., 2017; Gay et al., 2019), drug response data included publically available data from (Polley et al., 2016) from http://www.sclccelllines.cancer.gov.
DNA methylation
For the methylation analysis, data was retrieved from and the NCI Small Cell Lung Cancer Screening Project (Polley et al., 2016) and available from GEO Database via accession code GSE145156 or from the following link: http://sclccelllines.cancer.gov/sclc/downloads/xhtml. For the methylation analysis, methylation beta values and gene expression data were retrieved from the NCI Small Cell Lung Cancer Screening Project (Polley et al., 2016) and can be accessed under the following link: https://sclccelllines.cancer.gov/sclc/downloads.xhtml. Methylation data from 66 cell lines was generated using the Infinium MethylationEPIC assay and averaged methylation beta-values of individual probes within each gene region was directly downloaded from the project homepage. Gene expression data was generated using the Human Exon 1.0 ST Array and processed data was directly retrieved from the project homepage. Data was analyzed using R v3.6.3 (R Foundation for Statistical Computing, Vienna, Austria) and figures were prepared using the ComplexHeatmap package and ggplot2 (H. Wickham. ggplot2: Elegant Graphics for Data Analysis. Springer-Verlag New York, 2016). Differential methylation was calculated using a two-sided unpaired t-test.
Histology and immunohistochemistry
Patients were consented to tissue collection protocol LAB90–020 (“Molecular Approaches to Novel Therapies for Cancer: Research Repository of Normal and Neoplastic Tissues”) (Figure 1D-E, Figure 5A, Supplementary Table 1) or to a therapeutic protocol that mandated tissue collection (Figure 2F, Supplementary Figure 2D, Figure 4D). Tissue, once collected, was reviewed by staff thoracic pathologist to confirm SCLC.
Consecutive four- micrometer-thick tissue sections were cut from formalin-fixed paraffin embedded (FFPE) tissue for immunohistochemistry. IHC staining was performed with a Bond Max automated staining system (Leica Microsystems Inc., Vista, CA) using standard automated protocols. Leica Bond Retrieval Solution #2 (Leica Biosystems, equivalent to EDTA, pH 9.0) for 20 minutes was used for epitope retrieval. The primary antibody (ASCL1: 1:100, Clone 24B72D11.1, 556604, BDBiosciences, San Jose, CA; NEUROD1: 1:100 Clone EPR20766, ab213725, Abcam, Cambridge, UK; and POU2F3: 1:200, polyclonal, NBP1–83966, Novus Biologicals, Centennial, CO, USA; Vimentin: 1:100, Clone D21H3, 5741, Cell Signaling Technology, Danvers, MA; AXL: 1:200, polyclonal, AF154, R&D Systems, Minneapolis, MN; BCL2: 1:200, Clone E17, ab32124, Abcam, Cambridge, UK) was incubated for 15 minutes at room temperature and detected using the Bond Polymer Refine Detection kit (Leica Biosystems) with DAB as chromogen. FFPE cell lines pellets with known protein expression of ASCL1, NEUROD1 and POU2F3 were used to establish the above optimal IHC conditions and assess sensitivity and specificity for each antibody. Positive tumor cells and H-scores were calculated as described previously (Pietanza et al., 2018).
Western blot
H841 human SCLC-I cells were treated with mocetinostat (1.0 μM; MGCD0103; Selleckchem), 10 ng/ml recombinant human TGFβ1 (GF111, Millipore Sigma) or DMSO for 72h. Cell lysates were harvested for western blot analysis. Antibodies used for western analysis include E-cadherin (3195, Cell Signaling Technology), Vimentin (3932, Cell Signaling Technology), and actin (sc-1616, Santa Cruz Biotechnology) as a loading control.
Murine drug treatment
Drug response studies were performed using 6 week old female athymic nude mice from Envigo. All animals were maintained in accordance with the Institutional Animal Care and Use Committee of the M.D. Anderson Cancer Center and the NIH Guide for the Care and Use of Laboratory Animals. One million H841 human SCLC-I cells were injected subcutaneously into each mouse left flank and mice were observed daily for appearance of tumors. Two weeks following cell injection, treatment of the mice began when the tumors reached 120–150 mm3. Vehicle was administered by oral gavage on week days and mocetinostat (100 mg/kg; Selleckchem) was administered by oral gavage on week days. Tumor volume and body weights were measured on all mice two times per week and calculated (width2 x length x 0.4).
Real-time quantitative reverse transcriptase PCR
H1930, DMS79, H865, H69, H146, H1105, H1836, and H345 human SCLC-A cells were treated with demethylase, 5-aza-2’-deoxycytidine (1.0 μM; Millipore Sigma), GSK-LSD1 inhibitor (1.0 μM; Millipore Sigma) or DMSO for 48h. Cell pellets were harvested for RNA extraction. RNA was extracted using the Zymo Direct-Zol RNA kit (Zymo Research, Irvine, CA-USA). 100 – 500 ng RNA were reverse transcribed using the Bio-Rad iScript Reverse Transcription Supermix (Bio-Rad, Hercules, CA-USA). Gene expression was assessed using qRT-PCR on a Bio-Rad CFX96 thermo cycler. Bio-Rad PrimePCR assays for ASCL1 (qHsaCED0007040) and NEUROD1 (qHsaCID0006095) were used and normalized against the median expression of two house-keeping genes GAPDH (PrimePCR assay no. qHsaCED0038674) and RPL13A (PrimePCR assay no. qHsaCED0020417) (delta cT). Change of gene expression was calculated by subtracting the normalized expression level of ASCL1 and NEUROD1 in the group treated with decitabine or the LSD1 inhibitor from the DMSO treated control group (delta-delta-cT).
Flow cytometry
Approximately one million cells for each of the following SCLC cell lines were plated for flow cytometry analysis: H446, H1048, H847, H211, H196, H526, H841, H82, DMS79, H1930, H341, H146, H250, H510A, DMS273, H69, H524 and H889. Cells were harvested after 72 hours and surface stained against Somatostatin R2 using the SSTR2 Alexa Fluor 594 antibody (Novus Biologicals; IC4224T). After staining, cells were fixed in 2% paraformaldehyde and analyzed within 24 hours on a BD LSRFortessa Flow Cytometer. Data analysis was performed using FlowJo 10.7.1.
Circulating-tumor cell derived xenograft model generation
Patients diagnosed with SCLC at the University of Texas M.D. Anderson Cancer Center were selected on the basis of extensive-stage disease irrespective of age, gender or other clinical criteria. These patients underwent informed consent to Institutional Review Board (IRB)-approved protocol LAB10–0442 (“Evaluation of blood-based test for the detection of circulating tumor cells and circulating proteins and microRNAs and molecular analysis for polymorphisms and mutations”) and blood was collected. Technical details are as previously described (Stewart et al., 2020b). One vial of blood was collected for isolation and banking of plasma and peripheral blood mononuclear cells for use as a normal control. Ten milliliters of blood collected in EDTA vials was used for isolation of CTCs according to a previously published protocol (Hodgkinson et al., 2014). CTCs were isolated within 24h of sample collection. Briefly, whole blood was incubated with RosetteSep™ CTC Enrichment Cocktail Containing Anti-CD36 (Stemcell Technologies) and layered over a Ficoll gradient. The CTC layer was isolated, cells were spun down, mixed 1:1 with Matrigel and injected subcutaneously into the flank of NOD.Cg-Prkdcscid Il2rgtm1Wjl/SzJ (NSG) mice. Mice were monitored for formation of a flank tumor and were euthanized when tumor burden reached 1000–1500 mm3. Pieces of the tumor were fixed in paraformaldehyde for histological analyses, snap frozen in liquid nitrogen for genetic and proteomic analyses, viably frozen in 10% DMSO in FBS for future use, and transplanted into the flank of athymic nude mice for CDX model maintenance. CDX models were maintained in vivo by serial transplantation of tumors and all analyses performed to date were from passages ≤4. CDXs were derived from extensive-stage (ES) patients at different points of their treatment course.
Cisplatin-relapsed variations of two models (MDA-SC53 and MDA-SC68) were generated as previously described (Stewart et al., 2020b). Briefly, after transplanted tumors reached 120–150 mm3 vehicle was administered intraperitoneally once per week or cisplatin 4–6 mg/kg was administered intraperitoneally once per week. For treatment naïve, tumors were harvested after they reached 1,000 mm3 for single-cell RNAseq. For cisplatin relapse, treatment was briefly halted at maximal response until tumors again reached 150 mm3, at which point it was resumed until tumor volume reached 1,000 mm3, at which point tumors were harvested and processed for single-cell RNAseq.
Mice used for establishment of CDX models were 6 week old female NSG mice from Jackson Labs, while maintenance of CDX models and drug treatment studies were performed using 6 week old female athymic nude mice from Envigo. All animals were maintained in accordance with the Institutional Animal Care and Use Committee of the M.D. Anderson Cancer Center and the NIH Guide for the Care and Use of Laboratory animals.
Single-cell RNAseq
Tumors were harvested from mice directly into cold tissue storage solution (MACS) and shipped overnight. The next day, tumors were processed by enzymatic dissociation with Collagenase IV (600U/mL) and DNAse (2ug/mL) for a maximum of 45min and neutralized in collection buffer (1% BSA, 10%FBS, 2mM EDTA in RPMI). Dissociated cells were spun down and treated with ACK lysis buffer (A1049201, GIBCO) for 3 min on ice and washed with collection buffer. Cells were then stained for anti-human HLA A647 (Biolegend 311414), Calcein AM (C3100MP) and DAPI (Lifetech D1306, 1ug/mL) and sorted by Fluoresence-Activated Cell sorting (FACS) to select only live, human cells for downstream single cell transcriptomic analyses.Sorted cells were washed once with 0.04% BSA in PBS and counted on Countess II automated cell counter (ThermoFisher). 12,200 cells were loaded per lane on the 10x Chromium platform and processed for cDNA synthesis and library preparation as per manufacturer’s protocol using version 2 chemistry. cDNA and libraries were checked for quality on Agilent 4200 Tapestation and quantified by KAPA qPCR before sequencing on a single lane of a HiSeq4000 (Illumina). Raw Single-cell RNAseq data is available in GEO Database under the accession code: GSE138474 (Stewart et al., 2020b).
Downstream analyses were performed as recently published by our group (Stewart et al., 2020b). Briefly, Cell Ranger v2.0 was used to convert Illumina base call files to FASTQ files. These FASTQ files were aligned to the hg19 human reference genome and transcriptome provided by 10X genomics. The gene vs cell count matrix from Cell Ranger was used for downstream analysis. The raw reads were processed using the Cell Ranger pipeline to obtain the UMI (unique molecular identifier). CDX samples from the same model were pooled together. Cells that have less than 3,000 expressed genes were filtered out, and genes that were expressed in less than 10% cells were also filtered out. After filtering, each CDX model was down-sampled to 2,000 for inter-model comparison. The UMI counts were transformed and normalized using the SEURAT package v2.3.1(Butler et al., 2018), using the “NormalizeData()” function with default parameters. Cell cycle effects were adjusted by regressing out the G2M and S phase gene expression scores using “ScaleData()” function in SEURAT. Principle component analysis (PCA) was performed using the highly variable genes that were identified by SEURAT function “ FindVariableGenes()”. The first seven principal components were used for clustering and tSNE transformation, representing 63.7% ~ 66.4% of total variances. The tSNE transformation was performed using the RunTSNE with default perplexity value 30. Cell populations were identified using the SEURAT “FindClusters()” function with resolution set to 0.6. Marker genes for each cluster were identified using SEURAT function “FindMarkers()” with default parameters. The binary expression plots were generated by coloring the tSNE plot with the expression status of selected genes, i.e. expressed (UMI count >0) or not expressed (UMI count =0).
RNA Velocity and Proliferation/Death Marker Analysis
In order to calculate RNA velocity for each sample, data was realigned to the genome using the ‘run10x’ function from the Python package velocyto (La Manno et al., 2018). This results in a loom file with spliced, unspliced, and ambiguous read count matrices. Data for each CDX model was pooled and preprocessed by normalizing and log-transforming the data using Scanpy. From there, we downsampled each matrix to include only the filtered cells described above. Using the ScVelo Python package, a neighbor graph (adjacency matrices) and moments were calculated using scvelo.pp.neighbors and scvelo.pp.moments, respectively. We computed a tSNE dimensionality reduction and Leiden clusters, and then used ScVelo’s velocity method with groupby = ‘treatment’ and mode = ‘deterministic.’ This allowed us to comput velocity independently for each sample (untreated or treated), while still using the neighbors in the full tSNE for downstream analyses. We then computed velocity graphs, confidences, lengths, and tSNE embeddings for each CDX. We used ScVelo’s implementation of PAGA (Wolf et al., 2019) to compute PAGA maps, grouped by Leiden clusters, for each CDX.
Gene scoring for death markers and cell cycle were computed using Scanpy’s functions score_genes and _score_genes_cell_cycle respectively. Death markers were taken from gene ontology terms: GO:170739 (cell death), GO:170836 (necrosis), and GO:165105 (apoptosis).
Cell Transport Potential (CTrP) Calculation
CTrp is a measure of the average distance a cell may travel according to its RNA velocity. For each independent sample (untreated or treated), we ran the following pipeline:
-
1
Using RNA velocity calculated as described above, and for each category (‘treatment’), compute a Markov Chain Model transition matrix. This is calculated using an adapted version of ScVelo’s transition_matrix function, in which transition probabilities between each two cells, i and j, is calculated from the velocity graph pairwise. Each entry is a probability describing the likelihood of moving from state i to state j, and each row is the probability distribution of transitions from state i. RNA velocity is compared to distances between other cells to get a pairwise cosine correlation matrix (velocity graph). A scale parameter (default 10) is used to scale a Gaussian kernel applied to the velocity graph, restricted to transitions in the PCA embedding. This transition matrix, T, has dimensions nxn, where n = number of cells. It is then normalized to ensure each row adds to 1 (because each row is the probability of cell i transitioning to any other cell j, which should total 100%. Diffusion for T is scaled to 0 (i.e., ignored).
-
2
Calculate absorbing states (end states) using eigenvectors. Eigenvalues are calculated for the transition matrix. Any eigenvalue l = 1 (here, with a tolerance of 0.01), is associated with an end state distribution (eigenvector v); i.e., T(v) = lv implies that a distribution of states v will not change under further transformation (transitions) from T. If the Markov Chain is an absorbing Markov Chain, it will contain both transient states (t = number of transient states, where T(i,i) < 1), and absorbing states (r = number of absorbing states, where T(i,i) = 1). For every absorbing state in the matrix, there will be an associated eigenvalue/vector pair, with l =1, because any initial configuration of states will continue to evolve until every cell has reached an absorbing state. Therefore, the multiplicity of l = 1 is equal to the number of end states (absorbing states, or irreducible cycles). The associated eigenvectors v thus correspond to the absorbing states in the Markov Chain, within the tolerance of 0.01.
-
3
Calculate the fundamental matrix. In an absorbing Markov Chain, it is possible for every cell to reach an absorbing state in a finite number of steps. Let us rewrite T, the transition matrix, as P:
where Q is a t X t matrix, R is a non-zero t x r matrix, 0 is an r X t zero matrix, and Ir is an r X r identity matrix. Thus, Q describes the probability of transitioning between transient states, and R describes the probability of transitioning from a transient state to an absorbing state. The fundamental matrix N of P describes the expected number of visits to a transient state j from a transient state i before being absorbed. Because the Markov Chain is absorbing, this number is the sum for all k of Qk (k in (0, inf)):
Because Qk eventually goes to the zero matrix (all cells are absorbed), this sum converges for all absorbing chains. Furthermore, each rowi of the fundamental matrix describes the expected amount of time spent in state j starting from state i, and thus the row can be thought of as a distribution of weights associated with each state j for each starting state i. In practice, N is calculated as written above: the inverse of Q subtracted from the identity matrix. In practice, Numpy’s function numpy.linalg.inv(I-Q) is used to calculate N. If, however, the determinant of I-Q = 0, which occurs when I-Q is a singular matrix, the pseudoinverse is instead calculated using numpy.linalg.pinv(I-Q).
-
4
Calculate a distance matrix. A distance matrix D (n X n) is then calculated using scipy’s function scipy.spatial.distance.cdist. Here, we calculate the Euclidean distance on the PCA embedding of each sample. Because PCA is a linear transformation, it preserves the Euclidean distance metric between states while reducing extraneous noisy dimensions, increasing the efficiency of the calculation. Distance may also be calculated directly on nonlinear dimensionality reduction techniques, such as UMAP and tSNE, but these distances tend to break down for samples that are highly discontinuous (discrete clusters) and should only be applied to continuous data that falls on a single manifold.
-
5
Calculate Cell Transport Potential. Finally, CTrP is calculated as the inner product of fundamental matrix N, and the distance matrix D. This gives an expected distance (sum of distances to j from i, weighted by time spent in j before absorption).
The advantage of this metric over similar techniques, such as pseudotime and other trajectory inference metrics, is that CTrP is an expected distance in linear (PCA) space, which can be compared across samples (assuming they have been embedded in the same PCA). In other words, unitless measures such as pseudotime cannot be compared between samples because their scales are arbritrary; alternatively, CTrP has a scale set across all samples, dependent only on transformations of the data itself (such as log-normalization and PCA).
QUANTIFICATION AND STATISTICAL ANALYSIS
Statistical Analyses
NMF algorithm (Skoulidis et al., 2015) with the following criteria for gene selection to optimally identify differentially expressed genes to separate clusters: gene expression bimodal index ≥ 1.5, mean expression value ≥ 25th percentile, and standard deviation of expression value ≥ 50th percentile was utilized to identify the optimal number of clusters for SCLC tumor data set. As stated in the text, cophenetic correlation coefficient maximization was used to select optimal cluster number for subsequent analyses. Three and four cluster approaches yielded nearly identical cophenetic correlation results as shown in Figure 1. Generalized linear model via penalized maximum likelihood (glmnet R package) was applied to identify markers. Briefly, we used the Glmnet package (glmet_2.0–16) to fit a generalized linear model via penalized maximum likelihood. This model was fitted with multinomial family. Fit is repeated 20 times and, for each repeat, we do 10-fold change to select best alpha and features. We used the features shown in 80% of the repeats to re-fit in the 10-fold cross-validation to select the final best alpha and selected features. We then performed hierarchical clustering using these selected markers to the independent SCLC tumor and cell line cohort. To predict in the other datasets and display heatmaps, clustering used Pearson correlation for gene level and Euclidean distance for sample level to calculate the distance matrix and used the Ward method to perform clustering. ANOVA was used to compare molecular profiling data including gene and protein expression, EMT score, and drug response data. Fisher’s exact test was used to compute the association between categorical clinical variables and mutations with each subtype. Log rank test was used to compare the Kaplan-Meier RFS and OS curves.
Software
Data statistics and bioinformatics analyses were performed using R (https://www.r-project.org/) and Bioconductor packages (https://www.bioconductor.org/). For NMF and generalized linear model, we used R versions 3.3.0 and 3.5.1 and the following R packages: NMF_0.20.6 and glmnet_2.0–16.. For DNA methylation analysis (Figure 5F) we used R version 4.0.1 (2020–06-06) with the following R packages: circlize_0.4.10, data.table_1.12.8, reshape2_1.4.4, ComplexHeatmap_2.4.2, tidyverse_1.3.0, readxl_1.3.1, readr_1.3.1. For single-cell RNAseq analysis, we used R version 4.0.1 and the following R packages: circlize_0.4.10, data.table_1.12.8, reshape2_1.4.4, ComplexHeatmap_2.4.2, tidyverse_1.3.0, readxl_1.3.1, and readr_1.3.1.
Supplementary Material
Supplementary Table 1, related to Figure 1: NMF-derived gene list and mean expression by subtypes in George et al.
See associated Excel file for Supplementary Table 1.
KEY RESOURCES TABLE
| REAGENT or RESOURCE | SOURCE | IDENTIFIER |
|---|---|---|
| Antibodies | ||
| Mouse monoclonal anti ASCL1 | BD Biosciences | Cat # 556604 Clone 24B72D11.1 |
| Rabbit monoclonal anti NEUROD1 | Abcam | Cat # ab213725 Clone EPR20766 |
| Rabbit polyclonal anti POU2F3 | Novus Biologicals | Cat # NBP1–83966 |
| Rabbit polyclonal anti vimentin | Cell Signaling Technologies | Cat # 5741 Clone D21H3 |
| Goat polyclonal anti AXL | R&D Systems | Cat# AF154 |
| Rabbit monoclonal anti BCL2 | Abcam | Cat# ab32124 Clone E17 |
| Rabbit polyclonal anti vimentin | Cell Signaling Technologies | Cat # 3932 |
| Rabbit monoclonal anti E-Cadherin | Cell Signaling Technologies | Cat # 3195 Clone 24E10 |
| Goat polyclonal anti actin | Santa Cruz | Cat # sc-1616 |
| Mouse monoclonal anti SSTR2 Alexa Fluor 594 conjugated | Novus Biological | Cat # IC4224T Clone 402038 |
| Mouse monoclonal anti BCL2 | Dako | Cat # M0887 Clone 124 |
| Mouse monoclonal anti AXL | Abcam | Cat # ab54803 |
| Rabbit polyclonal anti DLL3 | Cell Signaling Technologies | Cat # 2483 |
| Rabbit monoclonal anti cMYC | Abcam | Cat # ab32072 Clone Y69 |
| Rabbit monoclonal anti TTF1 | Epitomics | Cat # 5883–1 Clone EPR8190 |
| Rabbit polyclonal anti P53 | Cell Signaling Technologies | Cat # 9282 |
| Mouse monoclonal anti RB1 | Cell Signaling Technologies | Cat # 9309 Clone 4H1 |
| Polyclonal rabbit anti E-Cadherin | Cell Signaling Technologies | Cat # 4065 |
| Bacterial and Virus Strains | ||
| None | ||
| Biological Samples | ||
| Circulating tumor cell-derived xenografts (CDX) | MD Anderson Cancer Center (Stewart et al., 2020) |
MDA-SC16 MDA-SC49 MDA-SC53 MDA-SC68 |
| Chemicals, Peptides, and Recombinant Proteins | ||
| 5-aza-2’-deoxycytidine | Millipore Sigma | Cat # 189825 |
| GSK-LSD1 inhibitor | Millpore Sigma | Cat # SML1072 |
| Mocetinostat | Selleck Chemicals | Cat # S1122 |
| Recombinant TGFβ | Millipore Sigma | Cat # GF111 |
| Cisplatin | MD Anderson Pharmacy | |
| Critical Commercial Assays | ||
| None | ||
| Deposited Data | ||
| SCLC tumor transcriptomic data | George et al., 2015 | EGAS00001000925 |
| SCLC tumor transcriptomic data | Sato et al., 2013 | GSE99312 |
| SCLC cell line transcriptomic data | Polley et al., 2016 | GSE73162 |
| SCLC cell line methylation data | Polley et al., 2016 | GSE145156 |
| SCLC cell line transcriptomic data | This paper | GSE151904 |
| SCLC cell line drug response data | Polley et al., 2016 | https://sclccelllines.cancer.gov/sclc/ |
| SCLC cell line drug response data | Stewart et al., 2017 | N/A |
| SCLC CDX single-cell RNAseq | Stewart et al., 2020 | GSE138474 |
| IMpower133 tumor transcriptomic data | This paper | EGAS00001004888 |
| Experimental Models: Cell Lines | ||
| Human: H446 cells | ATCC | Cat # HTB-171 |
| Human: H1048 cells | ATCC | Cat # CRL-5853 |
| Human: H847 cells | ATCC | Cat # CRL-5846 |
| Human: H211 cells | ATCC | Cat # CRL-5824 |
| Human: H196 cells | ATCC | Cat # CRL-5823 |
| Human: H526 cells | ATCC | Cat # CRL-5811 |
| Human: H841 cells | ATCC | Cat # CRL-5845 |
| Human: H82 cells | ATCC | Cat # HTB-175 |
| Human: DMS79 cells | ATCC | Cat # CRL-2049 |
| Human: H1930 cells | ATCC | Cat # CRL-5906 |
| Human: H341 cells | ATCC | Cat # CRL-5864 |
| Human: H146 cells | ATCC | Cat # HTB-173 |
| Human: H250 cells | ATCC | Cat # CRL-5828 |
| Human: H510A cells | ATCC | Cat # HTB-184 |
| Human: DMS273 cells | Sigma Aldrich | Cat # 95062830–1VL |
| Human: H69 cells | ATCC | Cat # HTB-119 |
| Human: H524 cells | ATCC | Cat # CRL-5831 |
| Human: H889 cells | ATCC | Cat # CRL-5817 |
| Experimental Models: Organisms/Strains | ||
| Mouse: Athymic Nude-Foxn1nu | Envigo | Cat# 069-US |
| Oligonucleotides | ||
| qRT-PCR primers for ASCL1 | BioRad | qHsaCED0007040 |
| qRT-PCR primers for NEUROD1 | BioRad | qHsaCID0006095 |
| qRT-PCR primers for GAPDH | BioRad | pHsaCED0038674 |
| qRT-PCR primers for RPL13A | BioRad | qHsaCED0020417 |
| Recombinant DNA | ||
| None | ||
| Software and Algorithms | ||
| FlowJo version 10.7.1 | BD | www.flowjo.com |
| CIBERSORT | Stanford University | www.cibersort.stanford.edu/ |
| R versions 3.3.0; 3.5.1; 3.6.3; 4.0.1 |
R Foundation for Statistical Computing | www.r-project.org |
| Bioconductor | www.bioconductor.org | |
| Python version 3.7.6 | Python Software Foundation | www.python.org |
| Other | ||
| None | ||
Highlights.
Differential expression of ASCL1, NEUROD1, and POU2F3 defines SCLC subtypes
An inflamed SCLC subtype (SCLC-I) has low expression of ASCL1, NEUROD1, and POU2F3
SCLC-I experiences greatest benefit from the addition of anti-PD-L1 to chemotherapy
Subtype switching accompanies acquired resistance to platinum chemotherapy
ACKNOWLEDGEMENTS
We are grateful to all of the patients who provided blood and tissue samples for this work. We would like to dedicate this work to Dr. Adi Gazdar who made invaluable intellectual contributions to this study prior to his passing. We thank Jordan Pietz for illustrations. This work was supported by: The NIH/NCI CCSG P30-CA016672 (Bioinformatics Shared Resource); NIH/NCI T32 CA009666 (C.M.G.); NIH/NCI R50-CA243698 (C.A.S.); CPRIT Research Training Program (RP170067) (E.M.P.); The University of Texas-Southwestern and MD Anderson Lung SPORE (5 P50 CA070907) (C.M.G., J.R., I.I.W., J.W., J.M., J.V.H., L.A.B.); The Department of Defense LC170171 (L.A.B.); ASCO Young Investigator Award (C.M.G.); the Khalifa Bin Zayed Al Nahyan Foundation (C.M.G.); MD Anderson Sister Institute Network Fund (L.A.B.) and through generous philanthropic contributions to The University of Texas MD Anderson Lung Cancer Moon Shot Program (J.V.H., J.W., L.A.B.) and to the Byers Lab; The Andrew Sabin Family Fellowship (L.A.B.); C.M.G. and L.A.B. were supported by the Abell Hangar Foundation (B.S.G.); MD Anderson Physician Scientist Award (L.A.B.); The Hope Foundation SWOG/ITSC Pilot Program (P.R. and L.A.B.), the LUNGevity Foundation Career Development Award (C.M.G.), and the Rexanna Foundation for Fighting Lung Cancer (C.M.G., J.V.H., L.A.B.). We would also especially like to thank A.R.K., L.W.Y., and M.J.A. for their philanthropic support of these projects.
Footnotes
Publisher's Disclaimer: This is a PDF file of an unedited manuscript that has been accepted for publication. As a service to our customers we are providing this early version of the manuscript. The manuscript will undergo copyediting, typesetting, and review of the resulting proof before it is published in its final form. Please note that during the production process errors may be discovered which could affect the content, and all legal disclaimers that apply to the journal pertain.
DECLARATION OF INTERESTS
C.M.G. reports research funding from AstraZeneca. S.H. reports consulting/honoraria from Qiagen, Boehringer Ingelheim and travel funding from Roche. B.Y.Z. and D.S.S. are employees of Genentech, Inc. G.F. is an employee of AstraZeneca and has stock ownership in AstraZeneca. B.G. reports research funding from ISA Pharm, Cue Bio, Pfizer, and Medimmune. I.I.W. reports consulting/advisory roles for Medscape, MSD, Genentech/Roche, PlatformQ Health, Pfizer, Bayer, Bristol-Myers Squibb, AstraZeneca/Medimmune, HTG Molecular, Asuragen, Merck, GlaxoSmithKline, Guardant Health, Oncocyte, and MSD, research support from Genentech, Oncoplex, HTG Molecular, DepArray, Merck, Bristol-Myers Squibb, Medimmune, Adapative, Adaptimmune, EMD Serono, Pfizer, Takeda, Amgen, Karus, Johnson & Johnson, Bayer, Iovance, 4D, Novartis and Akoya. J.V.H. serves on advisory committees for AstraZeneca, Bristol Myers Squibb, GlaxoSmithKline, Guardant Health, Kairos Venture Investments, BrightPath Biotherapeutics, Hengrui Therapeutics, Eli Lilly, Spectrum, EMD Serono, Roche, and Foundation One Medicine and has research support from AstraZeneca, Spectrum, and Checkmate Pharmaceuticals, as well as royalties/licensing fees from Spectrum and Bio-Tree Systems. L.A.B. serves on advisory committees for AstraZeneca, AbbVie, GenMab, BergenBio, Pharma Mar SA, Sierra Oncology, Merck, Bristol Myers Squibb, Genentech, and Pfizer and has research support from AbbVie, AstraZeneca, GenMab, Sierra Oncology, Tolero Pharmaceuticals. C.M.G., L.A.B. and J.V.H. have pending patent applications for SCLC subtyping U.S. 62/895,322. Otherwise, there are no pertinent financial or non-financial conflicts of interest to report.
REFERENCES
- Allison Stewart C, Tong P, Cardnell RJ, Sen T, Li L, Gay CM, Masrorpour F, Fan Y, Bara RO, Feng Y, et al. (2017). Dynamic variations in epithelial-to-mesenchymal transition (EMT), ATM, and SLFN11 govern response to PARP inhibitors and cisplatin in small cell lung cancer. Oncotarget 8, 28575–28587. [DOI] [PMC free article] [PubMed] [Google Scholar]
- Antonia SJ, Lopez-Martin JA, Bendell J, Ott PA, Taylor M, Eder JP, Jager D, Pietanza MC, Le DT, de Braud F, et al. (2016). Nivolumab alone and nivolumab plus ipilimumab in recurrent small-cell lung cancer (CheckMate 032): a multicentre, open-label, phase 1/2 trial. Lancet Oncol 17, 883–895. [DOI] [PubMed] [Google Scholar]
- Ayers M, Lunceford J, Nebozhyn M, Murphy E, Loboda A, Kaufman DR, Albright A, Cheng JD, Kang SP, Shankaran V, et al. (2017). IFN-gamma-related mRNA profile predicts clinical response to PD-1 blockade. J Clin Invest 127, 2930–2940. [DOI] [PMC free article] [PubMed] [Google Scholar]
- Baine MK, Hsieh MS, Lai WV, Egger JV, Jungbluth A, Daneshbod Y, Beras A, Spencer R, Lopardo J, Bodd F, et al. (2020). Small Cell Lung Carcinoma Subtypes Defined by ASCL1, NEUROD1, POU2F3 and YAP1: Comprehensive Immunohistochemical and Histopathologic Characterization. J Thorac Oncol [DOI] [PMC free article] [PubMed] [Google Scholar]
- Bonnafous CP, Valentine; Trichard Sylvia; Perrot Ivan; Cornen Stéphanie ; Morel Ariane; Breso Violette; Morel Yannis; Rossi Benjamin; Paturel Carine; Gauthier Laurent; Blery Mathieu (2013). Abstract 5037: Targeting MICA with therapeutic antibodies for the treatment of cancer. Journal for ImmunoTherapy of Cancer 1, P41. [Google Scholar]
- Borromeo MD, Savage TK, Kollipara RK, He M, Augustyn A, Osborne JK, Girard L, Minna JD, Gazdar AF, Cobb MH, and Johnson JE (2016). ASCL1 and NEUROD1 Reveal Heterogeneity in Pulmonary Neuroendocrine Tumors and Regulate Distinct Genetic Programs. Cell Rep 16, 1259–1272. [DOI] [PMC free article] [PubMed] [Google Scholar]
- Bottger F, Semenova EA, Song JY, Ferone G, van der Vliet J, Cozijnsen M, Bhaskaran R, Bombardelli L, Piersma SR, Pham TV, et al. (2019). Tumor Heterogeneity Underlies Differential Cisplatin Sensitivity in Mouse Models of Small-Cell Lung Cancer. Cell Rep 27, 3345–3358 e3344. [DOI] [PMC free article] [PubMed] [Google Scholar]
- Butler A, Hoffman P, Smibert P, Papalexi E, and Satija R (2018). Integrating single-cell transcriptomic data across different conditions, technologies, and species. Nat Biotechnol 36, 411–420. [DOI] [PMC free article] [PubMed] [Google Scholar]
- Byers LA, Diao L, Wang J, Saintigny P, Girard L, Peyton M, Shen L, Fan Y, Giri U, Tumula PK, et al. (2013). An epithelial-mesenchymal transition gene signature predicts resistance to EGFR and PI3K inhibitors and identifies Axl as a therapeutic target for overcoming EGFR inhibitor resistance. Clin Cancer Res 19, 279–290. [DOI] [PMC free article] [PubMed] [Google Scholar]
- Byers LA, and Rudin CM (2015). Small cell lung cancer: where do we go from here? Cancer 121, 664–672. [DOI] [PMC free article] [PubMed] [Google Scholar]
- Byers LA, Wang J, Nilsson MB, Fujimoto J, Saintigny P, Yordy J, Giri U, Peyton M, Fan YH, Diao L, et al. (2012). Proteomic profiling identifies dysregulated pathways in small cell lung cancer and novel therapeutic targets including PARP1. Cancer Discov 2, 798–811. [DOI] [PMC free article] [PubMed] [Google Scholar]
- Canadas I, Thummalapalli R, Kim JW, Kitajima S, Jenkins RW, Christensen CL, Campisi M, Kuang Y, Zhang Y, Gjini E, et al. (2018). Tumor innate immunity primed by specific interferon-stimulated endogenous retroviruses. Nat Med 24, 1143–1150. [DOI] [PMC free article] [PubMed] [Google Scholar]
- Cardnell RJ, Li L, Sen T, Bara R, Tong P, Fujimoto J, Ireland AS, Guthrie MR, Bheddah S, Banerjee U, et al. (2017). Protein expression of TTF1 and cMYC define distinct molecular subgroups of small cell lung cancer with unique vulnerabilities to aurora kinase inhibition, DLL3 targeting, and other targeted therapies. Oncotarget 8, 73419–73432. [DOI] [PMC free article] [PubMed] [Google Scholar]
- Carney DN, Gazdar AF, Bepler G, Guccion JG, Marangos PJ, Moody TW, Zweig MH, and Minna JD (1985). Establishment and identification of small cell lung cancer cell lines having classic and variant features. Cancer Res 45, 2913–2923. [PubMed] [Google Scholar]
- Chalishazar MD, Wait SJ, Huang F, Ireland AS, Mukhopadhyay A, Lee Y, Schuman SS, Guthrie MR, Berrett KC, Vahrenkamp JM, et al. (2019). MYC-Driven Small-Cell Lung Cancer is Metabolically Distinct and Vulnerable to Arginine Depletion. Clin Cancer Res 25, 5107–5121. [DOI] [PMC free article] [PubMed] [Google Scholar]
- Chung HC, Piha-Paul SA, Lopez-Martin J, Schellens JHM, Kao S, Miller WH Jr., Delord JP, Gao B, Planchard D, Gottfried M, et al. (2020). Pembrolizumab After Two or More Lines of Previous Therapy in Patients With Recurrent or Metastatic SCLC: Results From the KEYNOTE-028 and KEYNOTE-158 Studies. J Thorac Oncol 15, 618–627. [DOI] [PubMed] [Google Scholar]
- Das M (2017). Labetuzumab govitecan in metastatic colorectal cancer. Lancet Oncol 18, e563. [DOI] [PubMed] [Google Scholar]
- Della Corte CM, Sen T, Gay CM, Ramkumar K, Diao L, Cardnell RJ, Rodriguez BL, Stewart CA, Papadimitrakopoulou VA, Gibson L, et al. (2020). STING Pathway Expression Identifies NSCLC With an Immune-Responsive Phenotype. J Thorac Oncol 15, 777–791. [DOI] [PMC free article] [PubMed] [Google Scholar]
- Dotan E, Cohen SJ, Starodub AN, Lieu CH, Messersmith WA, Simpson PS, Guarino MJ, Marshall JL, Goldberg RM, Hecht JR, et al. (2017). Phase I/II Trial of Labetuzumab Govitecan (Anti-CEACAM5/SN-38 Antibody-Drug Conjugate) in Patients With Refractory or Relapsing Metastatic Colorectal Cancer. J Clin Oncol 35, 3338–3346. [DOI] [PMC free article] [PubMed] [Google Scholar]
- Farago AF, Yeap BY, Stanzione M, Hung YP, Heist RS, Marcoux JP, Zhong J, Rangachari D, Barbie DA, Phat S, et al. (2019). Combination Olaparib and Temozolomide in Relapsed Small Cell Lung Cancer. Cancer Discov [DOI] [PMC free article] [PubMed] [Google Scholar]
- Gay CM DL, Stewart CA, Xi Y, Cardnell RJ, Swisher SG, Roth JA, Glisson BS, Wang J, Heymach JV & Byers LA (2019). ASCL1, NEUROD1, and POU2F3 drive distinct subtypes of small cell lung cancer with unique therapeutic vulnerabilities. Paper presented at: Interational Association for the Study of Lung Cancer World Conference on Lung Cancer (Barcelona, Spain) [Google Scholar]
- Gay CM, Tong P, Cardnell RJ, Sen T, Su X, Ma J, Bara RO, Johnson FM, Wakefield C, Heymach JV, et al. (2019). Differential Sensitivity Analysis for Resistant Malignancies (DISARM) Identifies Common Candidate Therapies across Platinum-Resistant Cancers. Clin Cancer Res 25, 346–357. [DOI] [PMC free article] [PubMed] [Google Scholar]
- Gazdar AF, Carney DN, Nau MM, and Minna JD (1985). Characterization of variant subclasses of cell lines derived from small cell lung cancer having distinctive biochemical, morphological, and growth properties. Cancer Res 45, 2924–2930. [PubMed] [Google Scholar]
- George J, Lim JS, Jang SJ, Cun Y, Ozretic L, Kong G, Leenders F, Lu X, Fernandez-Cuesta L, Bosco G, et al. (2015). Comprehensive genomic profiles of small cell lung cancer. Nature 524, 47–53. [DOI] [PMC free article] [PubMed] [Google Scholar]
- Hamilton G, and Rath B (2019). Immunotherapy for small cell lung cancer: mechanisms of resistance. Expert Opin Biol Ther 19, 423–432. [DOI] [PubMed] [Google Scholar]
- Hellmann MD, Callahan MK, Awad MM, Calvo E, Ascierto PA, Atmaca A, Rizvi NA, Hirsch FR, Selvaggi G, Szustakowski JD, et al. (2018). Tumor Mutational Burden and Efficacy of Nivolumab Monotherapy and in Combination with Ipilimumab in Small-Cell Lung Cancer. Cancer Cell 33, 853–861 e854. [DOI] [PMC free article] [PubMed] [Google Scholar]
- Hodgkinson CL, Morrow CJ, Li Y, Metcalf RL, Rothwell DG, Trapani F, Polanski R, Burt DJ, Simpson KL, Morris K, et al. (2014). Tumorigenicity and genetic profiling of circulating tumor cells in small-cell lung cancer. Nat Med 20, 897–903. [DOI] [PubMed] [Google Scholar]
- Horn L, Mansfield AS, Szczesna A, Havel L, Krzakowski M, Hochmair MJ, Huemer F, Losonczy G, Johnson ML, Nishio M, et al. (2018). First-Line Atezolizumab plus Chemotherapy in Extensive-Stage Small-Cell Lung Cancer. N Engl J Med 379, 2220–2229. [DOI] [PubMed] [Google Scholar]
- Huang YH, Klingbeil O, He XY, Wu XS, Arun G, Lu B, Somerville TDD, Milazzo JP, Wilkinson JE, Demerdash OE, et al. (2018). POU2F3 is a master regulator of a tuft cell-like variant of small cell lung cancer. Genes Dev 32, 915–928. [DOI] [PMC free article] [PubMed] [Google Scholar]
- Ireland AS, Micinski AM, Kastner DW, Guo B, Wait SJ, Spainhower KB, Conley CC, Chen OS, Guthrie MR, Soltero D, et al. (2020). MYC Drives Temporal Evolution of Small Cell Lung Cancer Subtypes by Reprogramming Neuroendocrine Fate. Cancer Cell [DOI] [PMC free article] [PubMed] [Google Scholar]
- Kitajima S, Ivanova E, Guo S, Yoshida R, Campisi M, Sundararaman SK, Tange S, Mitsuishi Y, Thai TC, Masuda S, et al. (2019). Suppression of STING Associated with LKB1 Loss in KRAS-Driven Lung Cancer. Cancer Discov 9, 34–45. [DOI] [PMC free article] [PubMed] [Google Scholar]
- Krohn A, Ahrens T, Yalcin A, Plones T, Wehrle J, Taromi S, Wollner S, Follo M, Brabletz T, Mani SA, et al. (2014). Tumor cell heterogeneity in Small Cell Lung Cancer (SCLC): phenotypical and functional differences associated with Epithelial-Mesenchymal Transition (EMT) and DNA methylation changes. PLoS One 9, e100249. [DOI] [PMC free article] [PubMed] [Google Scholar]
- La Manno G, Soldatov R, Zeisel A, Braun E, Hochgerner H, Petukhov V, Lidschreiber K, Kastriti ME, Lonnerberg P, Furlan A, et al. (2018). RNA velocity of single cells. Nature 560, 494–498. [DOI] [PMC free article] [PubMed] [Google Scholar]
- Lim JS, Ibaseta A, Fischer MM, Cancilla B, O’Young G, Cristea S, Luca VC, Yang D, Jahchan NS, Hamard C, et al. (2017). Intratumoural heterogeneity generated by Notch signalling promotes small-cell lung cancer. Nature 545, 360–364. [DOI] [PMC free article] [PubMed] [Google Scholar]
- Lochmann TL, Floros KV, Naseri M, Powell KM, Cook W, March RJ, Stein GT, Greninger P, Maves YK, Saunders LR, et al. (2018). Venetoclax Is Effective in Small-Cell Lung Cancers with High BCL-2 Expression. Clin Cancer Res 24, 360–369. [DOI] [PMC free article] [PubMed] [Google Scholar]
- Lok BH, Gardner EE, Schneeberger VE, Ni A, Desmeules P, Rekhtman N, de Stanchina E, Teicher BA, Riaz N, Powell SN, et al. (2017). PARP Inhibitor Activity Correlates with SLFN11 Expression and Demonstrates Synergy with Temozolomide in Small Cell Lung Cancer. Clin Cancer Res 23, 523–535. [DOI] [PMC free article] [PubMed] [Google Scholar]
- Mak MP, Tong P, Diao L, Cardnell RJ, Gibbons DL, William WN, Skoulidis F, Parra ER, Rodriguez-Canales J, Wistuba II, et al. (2016). A Patient-Derived, Pan-Cancer EMT Signature Identifies Global Molecular Alterations and Immune Target Enrichment Following Epithelial-to-Mesenchymal Transition. Clin Cancer Res 22, 609–620. [DOI] [PMC free article] [PubMed] [Google Scholar]
- Mollaoglu G, Guthrie MR, Bohm S, Bragelmann J, Can I, Ballieu PM, Marx A, George J, Heinen C, Chalishazar MD, et al. (2017). MYC Drives Progression of Small Cell Lung Cancer to a Variant Neuroendocrine Subtype with Vulnerability to Aurora Kinase Inhibition. Cancer Cell 31, 270–285. [DOI] [PMC free article] [PubMed] [Google Scholar]
- Murai J, Feng Y, Yu GK, Ru Y, Tang SW, Shen Y, and Pommier Y (2016). Resistance to PARP inhibitors by SLFN11 inactivation can be overcome by ATR inhibition. Oncotarget 7, 76534–76550. [DOI] [PMC free article] [PubMed] [Google Scholar]
- Newman AM, Liu CL, Green MR, Gentles AJ, Feng W, Xu Y, Hoang CD, Diehn M, and Alizadeh AA (2015). Robust enumeration of cell subsets from tissue expression profiles. Nat Methods 12, 453–457. [DOI] [PMC free article] [PubMed] [Google Scholar]
- Newman AM, Steen CB, Liu CL, Gentles AJ, Chaudhuri AA, Scherer F, Khodadoust MS, Esfahani MS, Luca BA, Steiner D, et al. (2019). Determining cell type abundance and expression from bulk tissues with digital cytometry. Nat Biotechnol 37, 773–782. [DOI] [PMC free article] [PubMed] [Google Scholar]
- Ott PA, Bang YJ, Piha-Paul SA, Razak ARA, Bennouna J, Soria JC, Rugo HS, Cohen RB, O’Neil BH, Mehnert JM, et al. (2019). T-Cell-Inflamed Gene-Expression Profile, Programmed Death Ligand 1 Expression, and Tumor Mutational Burden Predict Efficacy in Patients Treated With Pembrolizumab Across 20 Cancers: KEYNOTE-028. J Clin Oncol 37, 318–327. [DOI] [PubMed] [Google Scholar]
- Owonikoko TK, Niu H, Nackaerts K, Csoszi T, Ostoros G, Mark Z, Baik C, Joy AA, Chouaid C, Jaime JC, et al. (2020). Randomized Phase II Study of Paclitaxel plus Alisertib versus Paclitaxel plus Placebo as Second-Line Therapy for SCLC: Primary and Correlative Biomarker Analyses. J Thorac Oncol 15, 274–287. [DOI] [PubMed] [Google Scholar]
- Paik PK, Rudin CM, Pietanza MC, Brown A, Rizvi NA, Takebe N, Travis W, James L, Ginsberg MS, Juergens R, et al. (2011). A phase II study of obatoclax mesylate, a Bcl-2 antagonist, plus topotecan in relapsed small cell lung cancer. Lung Cancer 74, 481–485. [DOI] [PMC free article] [PubMed] [Google Scholar]
- Pantelidou C, Sonzogni O, De Oliveria Taveira M, Mehta AK, Kothari A, Wang D, Visal T, Li MK, Pinto J, Castrillon JA, et al. (2019). PARP Inhibitor Efficacy Depends on CD8(+) T-cell Recruitment via Intratumoral STING Pathway Activation in BRCA-Deficient Models of Triple-Negative Breast Cancer. Cancer Discov 9, 722–737. [DOI] [PMC free article] [PubMed] [Google Scholar]
- Parkes EE, Walker SM, Taggart LE, McCabe N, Knight LA, Wilkinson R, McCloskey KD, Buckley NE, Savage KI, Salto-Tellez M, et al. (2017). Activation of STING-Dependent Innate Immune Signaling By S-Phase-Specific DNA Damage in Breast Cancer. J Natl Cancer Inst 109. [DOI] [PMC free article] [PubMed] [Google Scholar]
- Paz-Ares L, Dvorkin M, Chen Y, Reinmuth N, Hotta K, Trukhin D, Statsenko G, Hochmair MJ, Ozguroglu M, Ji JH, et al. (2019). Durvalumab plus platinum-etoposide versus platinum-etoposide in first-line treatment of extensive-stage small-cell lung cancer (CASPIAN): a randomised, controlled, open-label, phase 3 trial. Lancet 394, 1929–1939. [DOI] [PubMed] [Google Scholar]
- Pietanza MC, Waqar SN, Krug LM, Dowlati A, Hann CL, Chiappori A, Owonikoko TK, Woo KM, Cardnell RJ, Fujimoto J, et al. (2018). Randomized, Double-Blind, Phase II Study of Temozolomide in Combination With Either Veliparib or Placebo in Patients With Relapsed-Sensitive or Refractory Small-Cell Lung Cancer. J Clin Oncol 36, 2386–2394. [DOI] [PMC free article] [PubMed] [Google Scholar]
- Polley E, Kunkel M, Evans D, Silvers T, Delosh R, Laudeman J, Ogle C, Reinhart R, Selby M, Connelly J, et al. (2016). Small Cell Lung Cancer Screen of Oncology Drugs, Investigational Agents, and Gene and microRNA Expression. J Natl Cancer Inst 108. [DOI] [PMC free article] [PubMed] [Google Scholar]
- Rooney MS, Shukla SA, Wu CJ, Getz G, and Hacohen N (2015). Molecular and genetic properties of tumors associated with local immune cytolytic activity. Cell 160, 48–61. [DOI] [PMC free article] [PubMed] [Google Scholar]
- Rudin CM, Hann CL, Garon EB, Ribeiro de Oliveira M, Bonomi PD, Camidge DR, Chu Q, Giaccone G, Khaira D, Ramalingam SS, et al. (2012). Phase II study of single-agent navitoclax (ABT-263) and biomarker correlates in patients with relapsed small cell lung cancer. Clin Cancer Res 18, 3163–3169. [DOI] [PMC free article] [PubMed] [Google Scholar]
- Rudin CM, Poirier JT, Byers LA, Dive C, Dowlati A, George J, Heymach JV, Johnson JE, Lehman JM, MacPherson D, et al. (2019). Molecular subtypes of small cell lung cancer: a synthesis of human and mouse model data. Nat Rev Cancer 19, 289–297. [DOI] [PMC free article] [PubMed] [Google Scholar]
- Sato T, Kaneda A, Tsuji S, Isagawa T, Yamamoto S, Fujita T, Yamanaka R, Tanaka Y, Nukiwa T, Marquez VE, et al. (2013). PRC2 overexpression and PRC2-target gene repression relating to poorer prognosis in small cell lung cancer. Sci Rep 3, 1911. [DOI] [PMC free article] [PubMed] [Google Scholar]
- Sen T, Rodriguez BL, Chen L, Corte CMD, Morikawa N, Fujimoto J, Cristea S, Nguyen T, Diao L, Li L, et al. (2019). Targeting DNA Damage Response Promotes Antitumor Immunity through STING-Mediated T-cell Activation in Small Cell Lung Cancer. Cancer Discov 9, 646–661. [DOI] [PMC free article] [PubMed] [Google Scholar]
- Sharkey RM, Govindan SV, Cardillo TM, Donnell J, Xia J, Rossi EA, Chang CH, and Goldenberg DM (2018). Selective and Concentrated Accretion of SN-38 with a CEACAM5-Targeting Antibody-Drug Conjugate (ADC), Labetuzumab Govitecan (IMMU-130). Mol Cancer Ther 17, 196–203. [DOI] [PubMed] [Google Scholar]
- Simpson KL, Stoney R, Frese KK, Simms N, Rowe W, Pearce SP, Humphrey S, Booth L, Morgan D, Dynowski M, et al. (2020). A biobank of small cell lung cancer CDX models elucidates inter- and intratumoral phenotypic heterogeneity. Nature Cancer 1, 437–451. [DOI] [PubMed] [Google Scholar]
- Skoulidis F, Byers LA, Diao L, Papadimitrakopoulou VA, Tong P, Izzo J, Behrens C, Kadara H, Parra ER, Canales JR, et al. (2015). Co-occurring genomic alterations define major subsets of KRAS-mutant lung adenocarcinoma with distinct biology, immune profiles, and therapeutic vulnerabilities. Cancer Discov 5, 860–877. [DOI] [PMC free article] [PubMed] [Google Scholar]
- Stewart CA, Gay CM, Ramkumar K, Cargill KR, Cardnell RJ, Nilsson MB, Heeke S, Park EM, Kundu ST, Diao L, et al. (2020a). SARS-CoV-2 infection induces EMT-like molecular changes, including ZEB1-mediated repression of the viral receptor ACE2, in lung cancer models. bioRxiv, 2020.2005.2028.122291. [Google Scholar]
- Stewart CA, Gay CM, Xi Y, Sivajothi S, Sivakamasundari V, Fujimoto J, Bolisetty M, Hartsfield PM, Balasubramaniyan V, Chalishazar MD, et al. (2020b). Single-cell analyses reveal increased intratumoral heterogeneity after the onset of therapy resistance in small-cell lung cancer. Nature Cancer 1, 423–436. [DOI] [PMC free article] [PubMed] [Google Scholar]
- Thistlethwaite FC, Gilham DE, Guest RD, Rothwell DG, Pillai M, Burt DJ, Byatte AJ, Kirillova N, Valle JW, Sharma SK, et al. (2017). The clinical efficacy of first-generation carcinoembryonic antigen (CEACAM5)-specific CAR T cells is limited by poor persistence and transient pre-conditioning-dependent respiratory toxicity. Cancer Immunol Immunother 66, 1425–1436. [DOI] [PMC free article] [PubMed] [Google Scholar]
- Whalen KA, White BH, Quinn JM, Kriksciukaite K, Alargova R, Au Yeung TP, Bazinet P, Brockman A, DuPont MM, Oller H, et al. (2019). Targeting the Somatostatin Receptor 2 with the Miniaturized Drug Conjugate, PEN-221: A Potent and Novel Therapeutic for the Treatment of Small Cell Lung Cancer. Mol Cancer Ther 18, 1926–1936. [DOI] [PubMed] [Google Scholar]
- White BH, Whalen K, Kriksciukaite K, Alargova R, Au Yeung T, Bazinet P, Brockman A, DuPont M, Oller H, Lemelin CA, et al. (2019). Discovery of an SSTR2-Targeting Maytansinoid Conjugate (PEN-221) with Potent Activity in Vitro and in Vivo. J Med Chem 62, 2708–2719. [DOI] [PubMed] [Google Scholar]
- Wolf FA, Hamey FK, Plass M, Solana J, Dahlin JS, Gottgens B, Rajewsky N, Simon L, and Theis FJ (2019). PAGA: graph abstraction reconciles clustering with trajectory inference through a topology preserving map of single cells. Genome Biol 20, 59. [DOI] [PMC free article] [PubMed] [Google Scholar]
- Zhang W, Girard L, Zhang YA, Haruki T, Papari-Zareei M, Stastny V, Ghayee HK, Pacak K, Oliver TG, Minna JD, and Gazdar AF (2018). Small cell lung cancer tumors and preclinical models display heterogeneity of neuroendocrine phenotypes. Transl Lung Cancer Res 7, 32–49. [DOI] [PMC free article] [PubMed] [Google Scholar]
- Zimmermann S, Peters S, Owinokoko T, and Gadgeel SM (2018). Immune Checkpoint Inhibitors in the Management of Lung Cancer. Am Soc Clin Oncol Educ Book 38, 682–695. [DOI] [PubMed] [Google Scholar]
Associated Data
This section collects any data citations, data availability statements, or supplementary materials included in this article.
Supplementary Materials
Supplementary Table 1, related to Figure 1: NMF-derived gene list and mean expression by subtypes in George et al.
See associated Excel file for Supplementary Table 1.
Data Availability Statement
The code generated during this study is available at GitHub (https://github.com/MD-Anderson-Bioinformatics/SCLC-Cancer-Cell-Manuscript). Previously unpublished datasets used and/or generated during this study are available as follows: SCLC cell line RNAseq via GEO Database (GSE151904), SCLC CDX single-cell RNAseq via GEO Database (GSE138474), and transcriptomic data from n=1302 genes for IMpower133 patients (EGAS00001004888).