Abstract
Aim
To evaluate the potential of radiomics-based ultra-widefield fluorescein angiography (UWFA)-derived imaging biomarkers in retinal vascular disease for predicting therapeutic durability of intravitreal aflibercept injection (IAI).
Methods
The Peripheral and Macular Retinal Vascular Perfusion and Leakage Dynamics in Diabetic Macular Edema and Retinal Venous Occlusions During Intravitreal Aflibercept Injection (IAI) Treatment for Retinal Edema (PERMEATE) study prospectively evaluated quantitative UWFA dynamics in diabetic macular oedema or macular oedema secondary to retinal vascular occlusion. 27 treatment-naïve eyes were treated with 2 mg IAI q4 weeks for the first 6 months, and then administered q8 weeks. Morphological and graph-based attributes were used to model the spatial distribution of leakage areas, while tortuosity measures were used to model the vessel network disorder. Eyes were grouped based on functional tolerance of the first 8-week treatment interval challenge. ‘Non-rebounders’ (N=15) maintained/improved best-corrected visual acuity (BCVA) following the 8-week challenge. ‘Rebounders’ (N=12) exhibited worsened BVCA. The image biomarkers were used with a machine learning classifier to preliminarily evaluate their ability to predict BCVA stability.
Results
Two new UWFA image-derived biomarkers were identified and extracted. The cross-validated area under the receiver operating characteristic curve (AUC) was 0.77±0.14 using baseline leakage distribution features and 0.73±0.10 for the UWFA baseline tortuosity measures. Additionally, the change in vascular tortuosity between month 4 and baseline yielded an AUC of 0.73±0.08. Three baseline clinical features of letter score, macular volume and central subfield thickness yielded a corresponding AUC of 0.42±0.09.
Conclusions
Two computer-extracted UWFA radiomics-based descriptors were identified as potential biomarkers for predicting treatment durability and tolerance of longer treatment intervals. Conventional treatment parameters were not significantly different between these same groups.
INTRODUCTION
Diabetes and diabetes-related complications, including diabetic macular oedema (DME), are now becoming an epidemic on a national and global scale, with rates increasing almost every year.1 Retinal vein occlusion (RVO), much like DME, occurs as a retinal vascular complication often associated with predisposing factor including diabetes, hypertension and glaucoma.2 Though these conditions are unique, it is known that they are complex multifactorial diseases with vascular endothelial growth factor (VFGF) playing a significant in the manifestation of both diseases. Ongoing effects within the retina trigger the activation of VEGF, which in turn stimulates the breakdown of the blood–retinal barrier by altering its permeability. Intravitreal injections of VEGF inhibitors, including aflibercept, are now first-line treatments for both of these disorders.3–7
Image-guided characterisation and diagnosis of these retinal vascular disorders has become the gold standard approach to clinical management. Spectral-domain optical coherence tomography (OCT) has become the key diagnostic modality for the identification of macular oedema. The use of ultra-widefield fluorescein angiography (UWFA) provides near pan-retinal assessment of disease burden including vascular leakage and non-perfusion.8 Developing methods for image phenotyping for precision assessment of disease characteristics and predictive power for therapeutic response would provide a much-needed evaluation of disease behaviour and opportunities for individualised care.
Limited data are available regarding the role of quantitative imaging features from UWFA and their association with treatment response. The PERMEATE study was performed to provide a foundation for the impact of anti-VEGF therapy on quantitative UWFA features in either RVO and DME.9 Although these conditions are distinct, both present with significant angiographic parameters that change following anti-VEGF therapy and predicting therapeutic durability is currently not possible. In this study, the potential impact of subvisual feature assessment through quantitative feature interrogation of baseline UWFA in these two retinal vascular diseases is explored as a proof of concept of image biomarker discovery and potential utility.
In this study, we present two novel UWFA-derived radiomics-based imaging biomarkers quantifying the spatial arrangement of leakage foci and disorder in vessel network, which in a machine learning framework are able to accurately assess which eyes tolerate extended interval dosing with aflibercept.
MATERIALS AND METHODS
Data set description
PERMEATE is a Cleveland Clinic IRB-approved prospective consecutive case series aimed to evaluate quantitative ultra-widefield angiographic features and the longitudinal impact of intravitreal aflibercept therapy on those features for treatment-naïve eyes (ie, no previous pharmacotherapy or laser therapy) with foveal-involving oedema secondary to DME or RVO treated with aflibercept with baseline best-corrected visual acuity (BCVA) of 20/25 or worse, as previously described.9 All subjects provided written informed consent to participate in the PERMEATE study. Thirty-one eyes were enrolled. Eyes diagnosed with branch retinal vein occlusion (BRVO) or central retinal vein occlusion (CRVO) were grouped together as RVO. Of these, 27 eyes completed all required timepoints and had images of sufficient quality of analysis. Eyes were treated with 2 mg intravitreal aflibercept injection q4 weeks for the first 6 months, and then administered q8 weeks at month 8, 10 and 12. UWFA scans were collected quarterly over the same time frame. In order to assess the functional durability of treatment, eyes were divided into two groups based on functional response (eg, change in BVCA) to the first 8-week therapeutic interval challenge. ‘Responders’ or ‘non-rebounders’ (N=15) were eyes that maintained/improved BCVA following the first 8-week challenge. ‘Non-responders’ or ‘rebounders’ (N = 12) were eyes that exhibited at least one letter worsening in BVCA following the first 8-week challenge.
Image analysis
Blood vessel and leakage segmentation
UWFA scans were evaluated using a previously validated automated vessel and leakage segmentation platform.10–12 This software system generates multiple masks for additional analysis including a panretinal vascular skeletonised map and leakage localisation masks. eXPert Reader–verified segmentation masks of each parameter (eg, areas of leakage, retinal vascular skeleton) were exported for further computational analysis, which involved assessment of the following UWFA extracted metrics:
Quantitative measures of leakage shape and spatial distribution.
Quantitative measures of vessel tortuosity.
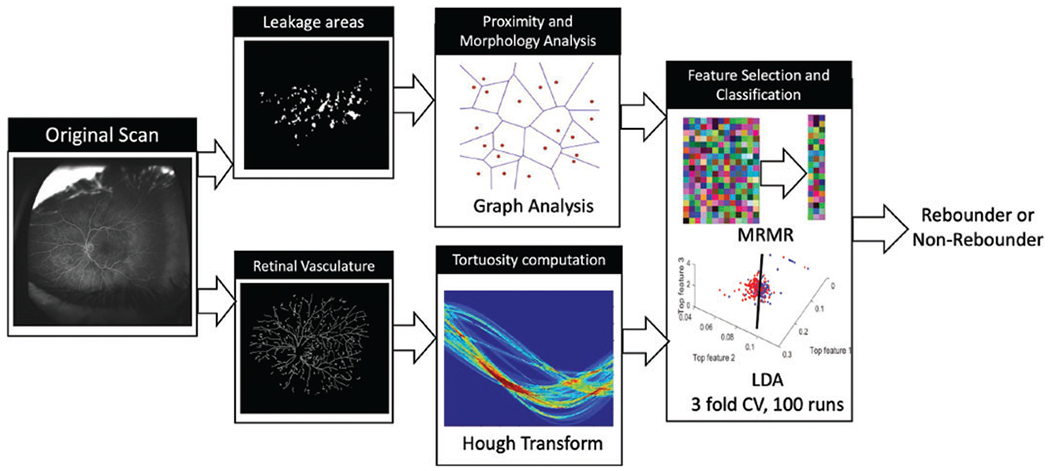
The computational workflow is summarised in figure 1.
Figure 1.

Workflow for computational assessment of response to aflibercept using baseline UWFA scans. UWFA, ultra-widefield fluorescein angiography.
Graph network and morphological feature computation
In order to characterise the spatial arrangement of the leakage areas, proximity metrics were computed using graph analysis (details in online supplemental section I). In addition to quantifying the spatial arrangement patterns of leakage areas using graph network analysis, morphological features quantifying the shape, size and density attributes are also computed from these leakage areas. In particular, the morphological features include area, objects/area distance to N nearest neighbours, disorder of distance to N neighbours, etc. Online supplemental table I provides a summary of the different graph network and morphological features.
Vessel tortuosity computation
Hough transforms were leveraged to characterise the vessel network and capture disorder in the plane of image acquisition.13,14 The local tortuosity of the segmented vasculature was computed and the features summarised across regions in order to capture the magnitude of the angiogenic influence (details in online supplemental section II).
Statistical analysis
A total of 151 graph and morphological features, and 5 tortuosity features were extracted from the baseline fluorescein angiography (FA) scans. To reduce the risk of overfitting, only the top three performing features were used for further analysis in each experiment. Details regarding feature selection and classification have been provided in online supplemental section III.
RESULTS
Clinical characteristics of non-rebounders and rebounders
The study included 13 eyes with DME and 14 eyes with RVO in total. The distribution of underlying diagnosis (RVO vs DME) was similar in both the non-rebounder and rebounder groups. In the non-rebounder group there were seven subjects with DME and eight subjects with RVO, including three BRVOs and five CRVOs. In the rebounder group, there were six patients with DME and six patients with RVO, including one BRVO and five CRVOs. There was no significant difference in mean baseline central subfield thickness (CST) between the two groups: 495 ±274 μm in non-rebounders and 555±275 μm in rebounders (p = 0.6). In the rebounder group, 5/12 eyes lost five letters or more following the first 8-week therapeutic interval challenge. Anatomic recurrence of oedema closely mirrored this group with the rebounder group exhibiting significant worsening CST during the first 8-week challenge. Only one eye in the non-rebounder group demonstrated a >20 μm increase in CST during the first 8-week challenge but demonstrated no change in visual acuity.
Baseline graph features discriminate non-rebounders from rebounders
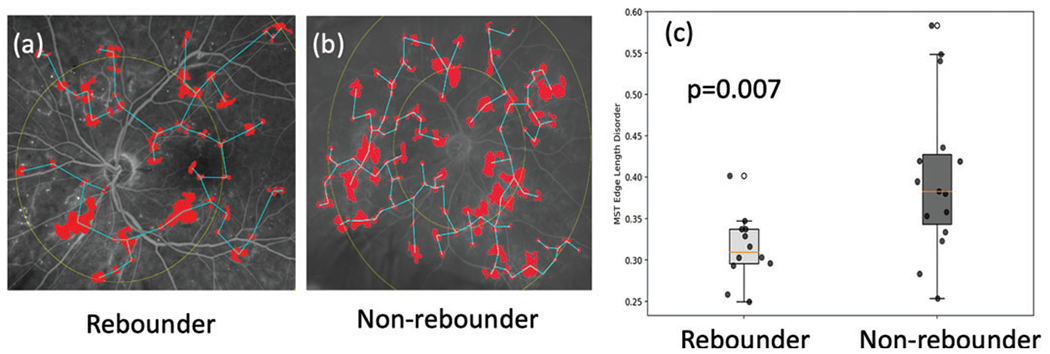
In evaluating the baseline UWFA leakage node distribution, there were significant differences between rebounders and non-rebounders. Edge length disorder related to the spatial arrangement of the leakage nodes, a feature quantifying the variance of edge lengths, of the minimum spanning tree (MST) emerged as the top-performing feature in this category. The cross-validated area under the receiver operating characteristic curve (AUC) for the machine learning classifier was calculated to be 0.77±0.14 across 100 runs. MST edge length disorder showed a significant difference (p = 0.007) between the rebounder and non-rebounder groups (figure 2).
Figure 2.

Leakage feature extraction. (A) and (B) are example baseline FA images of a non-rebounder and a rebounder, respectively. Their corresponding leakage patches are highlighted in red, and the minimum spanning tree edges in blue. Centroids of leakage patches are used as nodes and vectors connecting them are edges. Weights are the length of the edges. (C) Box and whisker plot on the left corresponds to the MST edge length disorder values from the rebounders, and the one on the right corresponds to the MST edge length disorder from the non-rebounders. FA, fluorescein angiography; MST, minimum spanning tree.
Baseline vessel tortuosity discriminates non-rebounders from rebounders
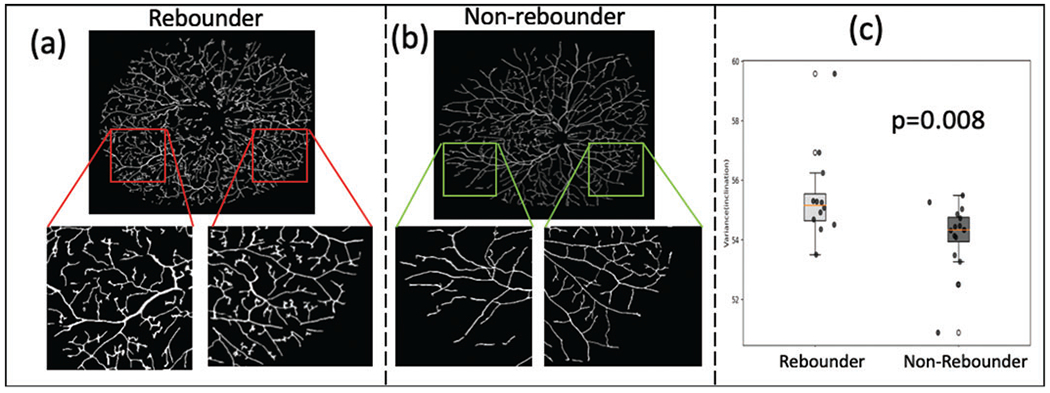
Baseline assessment of pan-retinal vessel tortuosity measures identified significant differences on UWFA between the rebounders and non-rebounder groups. The top-performing vascular tortuosity feature was the variance of inclination, θ, which quantifies the spread of the inclination in region of interest. Higher variance in θ signifies greater disorder and vice versa (figure 3A, B). The cross-validated AUC for the linear discriminant analysis classifier was calculated to be 0.73±0.10. The variance of inclination of vascular tortuosity was significantly different between the rebounder (red) and the non-rebounder (green) groups (p=0.008), as shown in figure 3C.
Figure 3.

Tortuosity assessment. (A) and (B) show the vessel network on example baseline FA images of a rebounder and a non-rebounder, respectively. Insets show a zoomed representation of the regional vasculature. The images represent the extracted vascular network using computerised segmentation (rather than the entire vascular system on the UWFA). As may be observed, the vessels are more tortuous in the rebounder as compared with the non-rebounder. This is quantitatively reflected in the box and whisker plot in (C). The box plot in red corresponds to the variance of vessel inclination values from the rebounders, and the one in green corresponds to the variance of inclination values from the non-rebounders. FA, fluorescein angiography; UWFA, ultra-widefield fluorescein angiography.
Early longitudinal changes in vessel tortuosity predicts early response to anti-VEGF
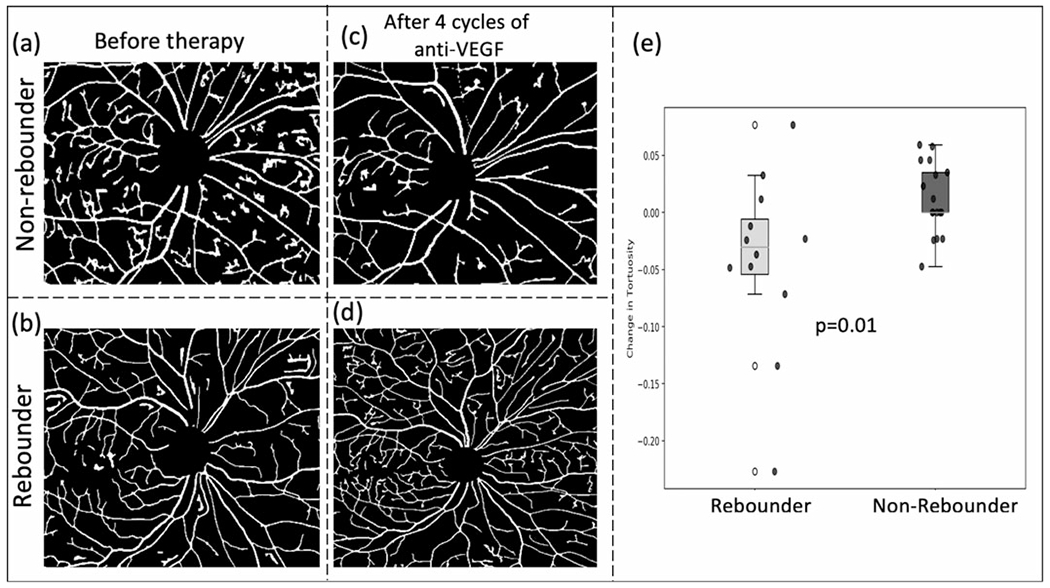
Longitudinal assessment of vascular alterations was also evaluated using quantitative tortuosity metrics. Changes in tortuosity measures were computed between the visits 1 and 4 (the first two time points where FA scans were obtained). The results identify that the change in tortuosity is significantly higher in the non-rebounder group (figures 4A, C), as compared with the patients in the rebounder group (figures 4B, D; p = 0.01). The top three features yielded an AUC of 0.73±0.08, accuracy of 0.77±0.07, specificity of 0.81±0.09 and sensitivity of 0.74±0.10. Results of unsupervised hierarchical clustering and t-distributed stochastic neighbour embedding analysis are presented in the supplementary document (online supplemental figures I and II).
Figure 4.

Vascular tortuosity change following therapy. (A) and (B) show the vasculature around the macula before initiation of anti-VEGF for a subsequent non-rebounder and a rebounder, respectively. After four cycles of therapy, the vasculature in the same region is shown in (C) and (D). Box and whisker plots of the best performing two delta tortuosity features (M4-M1) are shown in (E). VEGF, vascular endothelial growth factor.
Comparative assessment with clinical parameters for predicting interval tolerance
When evaluating the role of baseline clinical and more traditional imaging metrics, there were no significant differences in baseline features that were associated with rebound behaviour, including BCVA, CST or underlying diagnosis. when assessing the BCVA and baseline OCT parameters, an AUC of 0.42±0.09 and an accuracy of 0.51±0.05 were obtained. A similar analysis was performed on other clinical measurements taken at baseline, including vessel area, vessel length, total leakage area and total number of leakage spots that yielded an AUC of 0.59±0.07 and an accuracy of 0.66±0.03.
DISCUSSION
In this study, a preliminary evaluation is presented of two new promising computer-extracted radiomics-based imaging biomarkers derived from UWFA for prediction of extended interval tolerance to intravitreal anti-VEGF aflibercept treatment for macular oedema secondary to retinal vascular disease. Current clinical features, such as letter score and CST, which are used as current primary clinical measurements are limited in their quantitative analysis and their ability to accurately predict tolerance of treatment interval.15
The first imaging biomarker identified suggests that there may be differences in the spatial arrangement of leakage patterns between eyes more likely to tolerate extended interval dosing compared with those that do not tolerate extension. Patterns of leakage have previously been associated with different treatment responses as diffuse leakage was shown to respond more effectively to anti-VEGF treatment as compared with focal leakage.16 Due to the significant heterogeneity of leakage patterns across patients, an imaging biomarker focused on characterising leakage patterns could possibly result in more optimal treatment planning and more individualised feature assessment of the disease severity.
The second imaging biomarker discovered was related to the complexity of the vascular tortuosity patterns on UWFA. Greater disorder and more complex tortuosity patterns were observed in eyes that did not tolerate treatment extension retinal vasculature. The appearance of vessel network has been previously examined linking changes in the vessel network to the onset of DME, which manifested in the form of a statistically significant dilation and elongation of retinal arterioles, venules and their macular branches.17 Similarly in RVO, inherent differences within the retinal vasculature that manifested in the form of decreased vessel calibre and nerve fibre layer infarcts were noted.18 The findings from the work contained within this report support the notion that there may be subtle differences in localised vessel orientations that may impact treatment response/durability. In addition to baseline tortuosity features, early changes in tortuosity were also identified as a significant differentiating feature between these groups, suggesting the potential importance of incorporating temporal data into the response assessment framework. These findings illustrate the ability of tortuosity as a quantitative metric for vascular function.19–21
Interestingly, conventional clinical/imaging parameters, such as BCVA and CST, did not demonstrate any significant differences between the two groups at baseline. Although OCT-based findings drive treatment decision-making, such as worsening CST, this study did not demonstrate a role for CST in predicting interval tolerance. Individual variability in underlying susceptibility factors may be related to this variable impact of traditional clinical factors. Possible variables that may impact interval tolerance and are also being explored include underlying VEGF burden, disease chronicity and combined angiographic/anatomic features.
While these proof-of-concept results are promising, there are several limitations in this study that should be acknowledged and will be addressed in future work. One major limitation is the small sample size (N=27), which is also related to the paucity of clinical trial data that includes UWFA imaging. This small sample size may have also impacted the results of the findings related to traditional clinical parameters or change in clinical parameters in predicting these responses. This larger-scale assessment is currently underway with additional clinical trial data sets, including ongoing prospective trials. An additional important weakness is the inclusion of both RVO and DME. Both of these conditions have significantly different underlying pathophysiology and potential clinical courses. Although these diseases may have significantly different imaging signatures, there are many similarities in angiographic response to anti-VEGF therapy. Importantly, these disorders were well balanced in both the responder and nonresponder groups, and this did not appear to skew the results. Another limitation is the focus on functional treatment tolerance and the lack of anatomic assessment; however, both functional and anatomic worsening appeared to be closely paralleled in this analysis.
In conclusion, this report provides critical proof-of-concept of radiomics-based characterisation of imaging biomarkers (ie, leakage node distribution, vascular tortuosity) that may have important relevance to treatment response in eyes with macular oedema from retinal vascular disease. This study serves as a foundational assessment that UWFA features can be extracted and characterised that may identify and potentially stratify patients who may need more frequent treatment. Additional research is needed to validate these findings and to concretely establish the role of these biomarkers in predicting therapeutic response and durability.
Supplementary Material
Acknowledgements
Research was supported in part by Regeneron (VGFTe-DME-1431, K23-EY022947-01A1, 1U24CA199374-01, R01CA202752-01A1, R01CA208236-01A1, R01CA216579-01A1, R01CA220581-01A1 and 1U01 CA239055-01), National Center for Research Resources under award number 1 C06 RR12463-01 VA Merit Review Award IBX004121A from the United States Department of Veterans Affairs Biomedical Laboratory Research and Development Service, the DOD Prostate Cancer Idea Development Award (W81XWH-15-1-0558), the DOD Lung Cancer Investigator-Initiated Translational Research Award (W81XWH-18-1-0440), and the DOD Peer Reviewed Cancer Research Program (W81XWH-16-1-0329). The content is solely the responsibility of the authors and does not necessarily represent the official views of the National Institutes of Health, the U.S. Department of Veterans Affairs, the Department of Defense or the United States Government.
Funding
PP, VB, NF, CL, DDS, NB, MA, AM: none. SS: consultant: Eyepoint; research funding: Roche. SKS: consultant: Bausch + Lomb, Novartis, Carl Zeiss Meditec; research funding: Allergan and Bausch + Lomb; AM: research funding: Astrazeneca, Bristol Myers-Squibb, Philips. Equity: Inspirata, Elucid Bioimaging, consultant: Aiforia. JPE: consultant: Alcon, Allergan, Leica, Santen, Thrombogenics, Genentech, Novartis, Aerpio, Allegro, Regeneron, Roche and Zeiss; has intellectual property licensed to Leica; research funding: Alcon, Genentech, Regeneron, Boehringer-Ingelheim, Novartis, Aerpio and Thrombogenics.
Footnotes
Competing interests None declared.
Ethics approval The PERMEATE study is a Cleveland Clinic IRB-approved study (15-442) that involved human subjects. All participant provided written informed consent to participate.
Provenance and peer review Not commissioned; externally peer reviewed.
Data availability statement All data relevant to the study are included in the article or uploaded as supplementary information.
Supplemental material This content has been supplied by the author(s). It has not been vetted by BMJ Publishing Group Limited (BMJ) and may not have been peer-reviewed. Any opinions or recommendations discussed are solely those of the author(s) and are not endorsed by BMJ. BMJ disclaims all liability and responsibility arising from any reliance placed on the content. Where the content includes any translated material, BMJ does not warrant the accuracy and reliability of the translations (including but not limited to local regulations, clinical guidelines, terminology, drug names and drug dosages), and is not responsible for any error and/or omissions arising from translation and adaptation or otherwise.
Supplemental material is published online only. To view please visit the journal online (http://dx.doi.org/10.1136/bjophthalmol-2020-317182).
REFERENCES
- 1.Wild S, Roglic G, Green A, et al. Global prevalence of diabetes: estimates for the year 2000 and projections for 2030. Diabetes Care 2004;27:1047–53. [DOI] [PubMed] [Google Scholar]
- 2.Musat O, Cernat C, Labib M, et al. Diabetic macular edema. Romanian J Ophthalmol 2015;59(3):133–6. [PMC free article] [PubMed] [Google Scholar]
- 3.Mitchell P, Bandello F, Schmidt-Erfurth U, et al. The RESTORE study: ranibizumab monotherapy or combined with laser versus laser monotherapy for diabetic macular edema. Ophthalmology 2011;118:615–25. [DOI] [PubMed] [Google Scholar]
- 4.Nguyen QD, Brown DM, Marcus DM, et al. Ranibizumab for diabetic macular edema: results from 2 phase III randomized trials: RISE and RIDE. Ophthalmology 2012;119:789–801. [DOI] [PubMed] [Google Scholar]
- 5.Elman MJ, Aiello LP, Beck RW, et al. Randomized trial evaluating ranibizumab plus prompt or deferred laser or triamcinolone plus prompt laser for diabetic macular edema. Ophthalmology 2010;117:1064–1077.e35. [DOI] [PMC free article] [PubMed] [Google Scholar]
- 6.Campa C, Alivernini G, Bolletta E, et al. Anti-VEGF therapy for retinal vein occlusions. Curr Drug Targets 2016;17:328–36. [DOI] [PubMed] [Google Scholar]
- 7.Ciombor KK, Berlin J. Aflibercept: a decoy VEGF receptor. Curr Oncol Rep 2014;16:368. [DOI] [PMC free article] [PubMed] [Google Scholar]
- 8.Querques L, Parravano M, Sacconi R, et al. Ischemic index changes in diabetic retinopathy after intravitreal dexamethasone implant using ultra-widefield fluorescein angiography: a pilot study. Acta Diabetol 2017;54:769–73. [DOI] [PubMed] [Google Scholar]
- 9.Figueiredo N, Srivastava SK, Singh RP, et al. Longitudinal panretinal leakage and ischemic indices in retinal vascular disease after aflibercept therapy: the PERMEATE study. Ophthalmol Retina 2020;4:154–63. [DOI] [PMC free article] [PubMed] [Google Scholar]
- 10.Ehlers JP, Wang K, Vasanji A, et al. Automated quantitative characterisation of retinal vascular leakage and microaneurysms in ultra-widefield fluorescein angiography. Br J Ophthalmol 2017;101:696–9. [DOI] [PMC free article] [PubMed] [Google Scholar]
- 11.Ehlers JP, Jiang AC, Boss JD, et al. Quantitative ultra-widefield angiography and diabetic retinopathy severity: an assessment of panretinal leakage index, ischemic index and microaneurysm count. Ophthalmology 2019;126:1527–32. [DOI] [PMC free article] [PubMed] [Google Scholar]
- 12.Jiang A, Srivastava S, Figueiredo N, et al. Repeatability of automated leakage quantification and microaneurysm identification utilising an analysis platform for ultra-widefield fluorescein angiography. Br J Ophthalmol 2020;104:500–3. [DOI] [PubMed] [Google Scholar]
- 13.Duda ROH, Hart PE. Use of the Hough transformation to detect lines and curves in pictures. ACM 1972;15:11–15. [Google Scholar]
- 14.Braman N, Prasanna P, Alilou M, et al. 2018. Vascular network organization via Hough transform (VaNgOGH): a novel radiomic biomarker for diagnosis and treatment response. In: Frangi AF, Schnabel JA, Davatzikos C, et al. , (eds). Medical image computing and computer assisted intervention: MICCAI 2018. Lecture notes in computer science. Springer International Publishing: 803–11. [Google Scholar]
- 15.Browning DJ, Glassman AR, et al.Diabetic Retinopathy Clinical Research Network Relationship between optical coherence tomography-measured central retinal thickness and visual acuity in diabetic macular edema. Ophthalmology 2007;114:525–36. [DOI] [PMC free article] [PubMed] [Google Scholar]
- 16.Allingham MJ, Mukherjee D, Lally E, et al. A quantitative approach to predict differential effects of anti-VEGF treatment on diffuse and focal leakage in patients with diabetic macular edema. Invest Ophthalmol Vis Sci 2016;57: 2076–2076. [DOI] [PMC free article] [PubMed] [Google Scholar]
- 17.Kristinsson JK, Gottfredsdottir MS, Stefansson E. Retinal vessel dilatation and elongation precedes diabetic macular oedema. Br J Ophthalmol 1997;81:274–8. [DOI] [PMC free article] [PubMed] [Google Scholar]
- 18.Vance SK, Chang LK, Imamura Y, et al. Effects of intravitreal anti-vascular endothelial growth factor treatment on retinal vasculature in retinal vein occlusion as determined by ultra wide-field fluorescein angiography. Retin Cases Brief Rep 2011;5:343–7. [DOI] [PubMed] [Google Scholar]
- 19.Gill A, Cole ED, Novais EA, et al. Visualization of changes in the foveal avascular zone in both observed and treated diabetic macular edema using optical coherence tomography angiography. Int J Retin Vitr 2017;3:19. [DOI] [PMC free article] [PubMed] [Google Scholar]
- 20.Hayreh SS, Servais GE, Virdi PS. Retinal arteriolar changes in malignant arterial hypertension. Ophthalmologica 1989;198:178–96. [DOI] [PubMed] [Google Scholar]
- 21.Gekeler F, Shinoda K, Jünger M, et al. Familial Retinal Arterial Tortuosity Associated With Tortuosity in Nail Bed Capillaries. Arch Ophthalmol. 2006;124 (10):14921494. [DOI] [PubMed] [Google Scholar]
Associated Data
This section collects any data citations, data availability statements, or supplementary materials included in this article.


