Abstract
Objective
To develop a precise semi-automated segmentation of the fascia lata (FL) of the thigh to quantify IMAT volume in T1w MR images and fat fraction (FF) in Dixon MR images.
Materials and methods
A multi-step segmentation approach was developed to identify fibrous structures of the FL and combining them into a closed 3D surface. 23 healthy young men with low and 50 elderly sarcopenic men with moderate levels of IMAT were measured by T1w and 6pt Dixon MRI at 3T. 20 datasets were used to determine reanalysis precision errors. IMAT volume was compared using the new FL segmentation versus an easier to segment but less accurate, tightly fitting envelope of the thigh muscle ensemble.
Results
The segmentation was successfully applied to all 73 datasets and took about 7 min per 28 slices. In particular, in elderly subjects, it includes a large amount of adipose tissue below the FL typically not accounted for in other segmentation approaches. Inter- and intra-operator RMS-CVs were 0.33% and 0.14%, respectively, for IMAT volume and 0.04% and 0.02%, respectively, for FFMT.
Discussion
The FL segmentation is an important step to quantify IMAT with high precision and may be useful to investigate effects of aging and treatment on changes of IMAT and FF. ClinicalTrials.gov identifier NCT2857660, August 5, 2016.
Trial registration
ClinicalTrials.gov identifier NCT2857660, August 5, 2016.
Keywords: MRI, Fascia lata, Adipose tissue
Introduction
Quantification of muscle properties such as volume and fat infiltration as well as the amount and distribution of adipose tissue (AT), is of increasing interest in diseases or conditions such as obesity, osteoporosis, rheumatoid arthritis and sarcopenia [1]. In particular, visceral and subcutaneous adipose tissue (SAT) of the abdomen and intermuscular adipose tissue (IMAT) of the thigh and tibia have been investigated [2, 3]. In addition to muscle volume, newer imaging methods provide quantification of muscle density (CT) [4] and fat fraction, i.e. multiecho chemical-shift-encoded MRI [5]. In this study, 6-point Dixon MRI was used [6].
However, it remains unclear, which parameter is most relevant. IMAT has been widely used as a semi-quantitative measure by physicians for diagnosis and treatment monitoring in neuromuscular diseases such as muscular dystrophy [7–9]. Based on visual inspection of IMAT within the deep fascia, also known as the fascia lata (FL) in CT or standard T1 weighted MR images they assign scores for fat accumulation and distribution [10]. However, a more quantitative analysis requires a stricter definition of the parameters and the specific anatomical location. Usually, the differentiation between tissues requires an accurate segmentation of the fascia lata of the thigh. Especially in CT with relatively low soft tissue contrast, this can be a challenging task [11, 12].
This study focusses on MR imaging of the mid-thigh. The FL separates SAT from muscles surrounded by perimuscular adipose tissue. About 80% of adipose tissue consists of lipids [13] stored in adipocytes, which can also be found among muscle fibres [14]. In T1 weighted images, larger agglomerations of adipocytes within muscles appear hypointens contrasting the darker muscle tissue. According to the traditional definition, these agglomerations together with the perimuscular AT forms IMAT [2, 15]. Other contributions of intramuscular adipose tissue—smaller agglomerations of adipocytes as well as intracellular lipids—cannot be detected on T1 weighted images, but contribute to fat fraction (FF) that can be quantified by Dixon MRI [16].
Whether the quantification of IMAT volume and its distribution or the measurement of intramuscular FF is more relevant is still an unanswered question. One reason is the rather difficult segmentation of the FL, a thin layer of fibrous tissue often difficult to identify on single MR images and due to lower soft tissue contrast even more difficult to identify on CT images [17]. Thus, instead of segmenting the FL, several authors have simply used a tight envelope of the muscle ensemble of the thigh defining the VOI for the quantification of IMAT [18–20]. However, this is problematic in elderly subjects, which typically show increased amounts of perimuscular adipose tissue between the FL and the muscle surfaces [21, 22].
Thus the primary aim of this study was the development of a novel semi-automated 3D segmentation method of the FL of the thigh to separate SAT from IMAT and to determine the reproducibility of parameters such as IMAT and muscle FF in various compartments of the thigh depending on the FL segmentation. Further, the effect of using the FL instead of a tight muscle envelope to quantify IMAT was evaluated in young healthy and elderly sarcopenic subjects in a retrospective analysis of a study reported earlier [23].
Materials and methods
Subjects and MRI scans
Two groups that had been recruited for an earlier study [23] were examined. Group 1 (G1) included 23 healthy young men (31 ± 6 years (mean value ± standard deviation), 23–46 years, BMI 23.2 ± 2.0 kg/m2). Group 2 (G2) included 50 elderly men with sarcopenia (77 ± 5 years, 70–86 years, BMI 26.2 ± 2.4 kg/m2). G1 and G2 combined, cover a wide range of muscle fat content [24].
MRI acquisition was performed using a 3T scanner (MAGNETOM Skyrafit, Siemens Healthineers AG, Erlangen, Germany) and an 18-channel body receive array coil. The flexible coil was wrapped around the left mid-thigh. The protocol included a clinically common T1 weighted (T1w) Turbo Spin Echo and a 6-point (6pt) Gradient Echo Volumetric Interpolated Breath-hold Examination (VIBE) Dixon sequence for chemical shift encoding-based quantification of fat and water as proton density FF. The following acquisition parameters were used: T1w sequence—voxel size: 0.5 × 0.5 × 3.0 mm3, 34 slices, matrix size: 512 × 512, TR: 844 ms, echo time (TE): 14 ms, bandwidth: 488 Hz/px, acquisition time: 2:54 min; 6pt Dixon sequence—voxel size: 0.8 × 0.8 × 3.0 mm3, 36 slices, matrix size: 320 × 320, TR: 14.00 ms, TEs: 1.90, 3.73, 5.56, 7.39, 9.22, and 11.05 ms, bandwidth: 710 Hz/px, flip angle: 6°, acquisition time: 1:17 min; detailed information can be found in [25]. Dixon MRI delivered proton density FF maps, which assign a percentage of fat to every voxel. Intensities in the FF maps generated by the software of the Scanner are in a range of 0–1000 corresponding to a FF of 0.0–100.0%.
To measure comparable regions of the thigh, the length of the femur and the knee joint gap was taken as a reference parameters to determine the mid-point of the femur, where the scanning volume was placed.
Segmentation outline
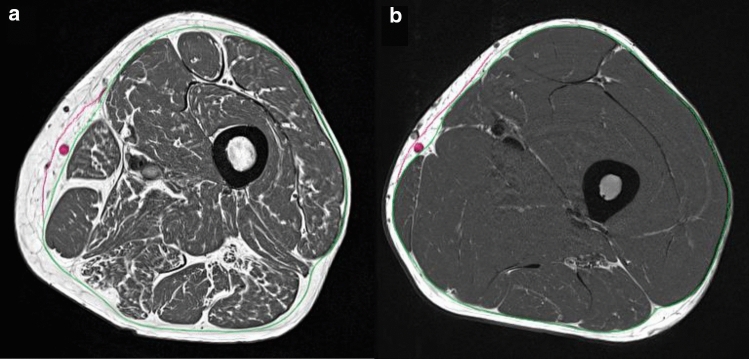
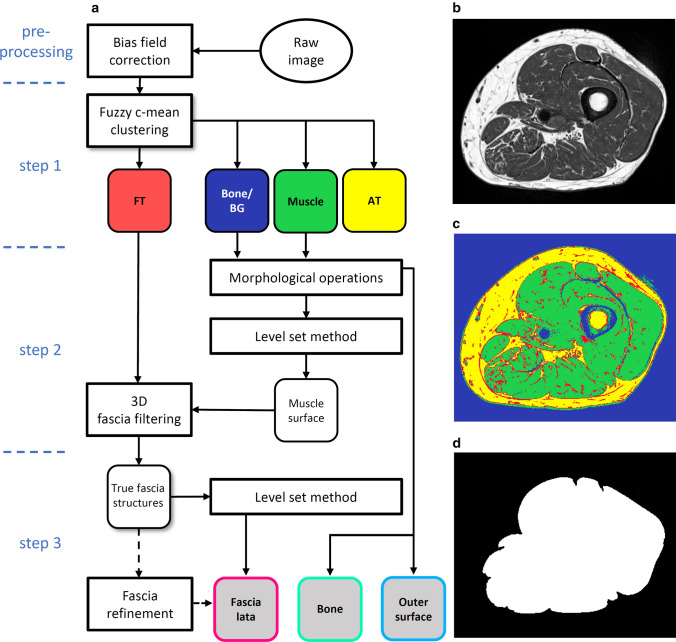
The FL segmentation was performed in the T1w datasets, which had high spatial resolution and good image contrast. This allowed a distinction between the FL and the saphenous fascia around the vena saphena magna [26] (Fig. 1). A flowchart of the segmentation process integrated in MIAF (Medical Image Analysis Framework, University of Erlangen) package is shown in Fig. 2a. In a pre-processing step, the N4ITK algorithm [27] was used to compensate for the bias field caused by field inhomogeneities of the scanner (Fig. 2b).
Fig. 1.
Examples of bias field corrected T1w images of the two subject groups. Elderly sarcopenic subject of group G2 (a); a healthy young subject of group G1 (b). The green contour indicates the position of the fascia lata (FL), the red contour indicates the fascia of the vena saphena magna (also marked in red). These two fasciae are usually highly visible but have to be distinguished
Fig. 2.
a Flowchart of the segmentation process. b Bias field corrected T1w image, which is the input for the fuzzy c-means clustering. c Result of step 1: fibrous tissue (FT, red), bone and background (BG, blue), muscle (green) and adipose tissue (AT, yellow) clusters. Sometimes veins and thicker connective tissue can also lie within the bone and BG cluster. d Result of step 2: tightly fitting muscle envelope
The FL segmentation process started (step 1) with a fuzzy c-means clustering that based on image intensity separated all voxels into four different clusters: muscle, AT, bone/background and fibrous tissue located at interfaces or inside the SAT (Fig. 2c). The surface of the thigh was determined from the bone and background cluster using morphological operations and a threshold filtering to remove the skin. The femur was also segmented using morphological operations.
In step 2, the level set method as described by Caselles et al. [28] was applied to the muscle cluster to find a tightly fitting envelope of the muscle ensemble of the thigh (ME: muscle envelope) (Fig. 2d). This step also excluded veins and other structures in SAT, which were included in the muscle cluster in step 1. To obtain the FL surface, a filtering process described in detail below was applied to the fibrous tissue cluster to identify FL structures in the SAT.
In step 3, a second level set process detailed in the section below combined these structures with ME obtained in step 2 to complete the segmentation of the FL. If the result of the automatic segmentation was not satisfactory, a manual refinement process could be applied.
3D fascia filtering
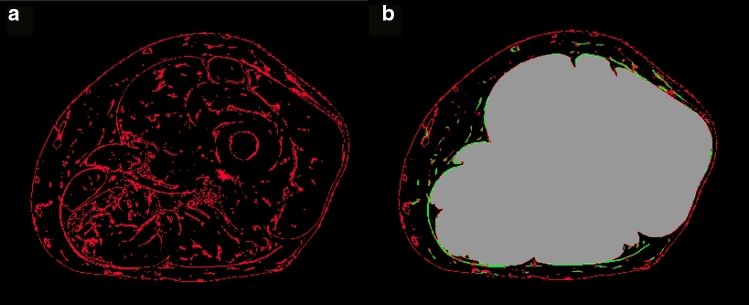
The fibrous tissue cluster resulting from the fuzzy c-means clustering contained several fibrous structures that were not part of the FL (Fig. 3a). These structures were typically not present in all slices of the image stack, whereas the FL is a connected 3D surface.
Fig. 3.
Schematic presentation of the filtering process to obtain relevant FL structures. Fibrous tissue cluster obtained from fuzzy clustering (left). Result after filtering all fibrous structures outside the muscle envelope (right). Green: 3D plate-like structures, probably part of the FL; red: structures unlikely part of the FL; for visualization only two colors, green and red are used. In reality, all voxels containing fibrous structures were continuously scaled between 0 and 1 (see text). Grey: region defined by tight muscle envelope
The undesired fibrous structures were filtered out by Frangi’s filter detection principle using the orthonormal eigenvalue decomposition of the Hessian matrix [29]. The filter distinguished between tube-like, sphere-like and plate-like shapes, the latter being of major interest for the FL segmentation. The filter computed the probability of a given fibrous structure being plate like and, therefore, considered as part of the fascia. The filter assigned a weight between 0 (did not belong to FL) and 1 (was part of FL) to all fibrous structures outside ME (Fig. 3b). A second level set segmentation starting outside ME incorporated these weighted voxels to determine the final surface defining the FL.
Fascia refinement
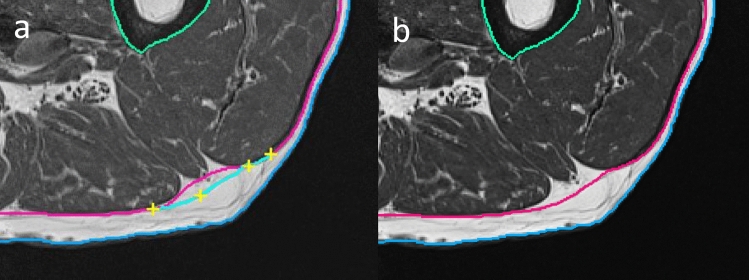
If the automated final FL detection failed or if artifacts interfered, a manual refinement was necessary. This was realized by a livewire approach based on the A* algorithm, a heuristic to the Dijkstra algorithm used by Mortensen’s Intelligent Scissors tool [30, 31]. Based on a lowest cost criterion, the tool found the shortest path between seed points. The cost functional considered the most distinctive edges determined from the gradient of the T1w images. The integration of these edges and the 3D filtered FL structures resulted in excellent performance of the manual editing tool (Fig. 4).
Fig. 4.
Incorrect FL segmentation in red (a). Application of an intelligent scissors tool using manually set seed points (yellow crosses); corrected fascia segmentation (b)
Once seed points were manually set in one slice, they were propagated to the next ten slices and adjusted automatically. This process favored the most probable FL location and facilitated the simultaneous correction of several slices, which significantly reduced the time required to edit the complete dataset. Basic morphological operations for additional local editing could be applied if necessary.
IMAT and FF quantification
IMAT volume was determined in the T1w images by summing up all voxels of the AT cluster located in the intra-fascia (IF) VOI, i.e. the VOI enclosed by FL after excluding the femur.
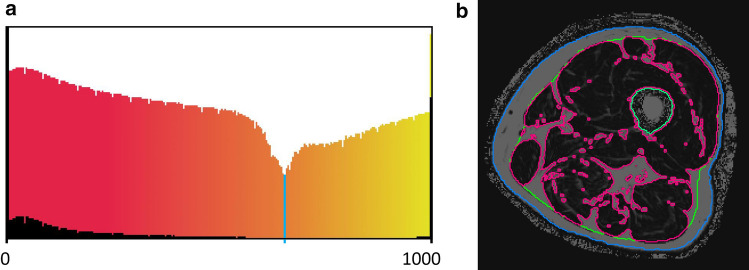
T1w and Dixon FF images were matched by intensity-based rigid registration of the segmented thigh VOIs. The resulting transformation matrix was then used to transform the FL segmented in the T1w images to the FF image stack. FF was determined in muscle tissue (MT) which was segmented using the logarithmically scaled histogram of the greyvalues within the IF VOI (Fig. 5a). The minimum of this histogram was used as threshold to separate MT form IMAT (Fig. 5b).
Fig. 5.
Separation of adipose and muscle tissue within the intra-fascia VOI uisng Dixon 6pt images. a The histograms show the grey value distribution (FF values ranging from 0 to 1000) of the whole intra-fascia VOI; the normal histogram (black) and the logarithmically scaled histogram (color gradient). The color gradient indicates muscle tissue (red) and adipose tissue (yellow). The minimum of this distribution (blue line) was used as a threshold to segment muscle tissue. b Segmented Dixon images; red: borders of muscle tissue (black); green: fascia lata; blue: outer surface of the thigh; the grey voxels within the FL denote IMAT
Statistical analysis
To examine the effect of using the FL versus a tight muscle envelope on the quantification of IMAT, the parameters ‘IMAT within the FL’ (IMATFL) and ‘within ME’ (IMATME) were determined. Both parameters were compared via correlation analysis. All statistical analysis was carried out in R [32].
5 datasets randomly selected from the group of young subjects and 15 datasets randomly selected from the group of elderly subjects were used for precision analysis. Specifically, reanalysis precision was determined for volume of the IF VOI, volume of IMAT in the T1w scans and FF of MT (FFMT) in the Dixon datasets. The precision error was determined as inter-operator variability of 3 operators who each analyzed the 20 data sets once and as intra-operator variability, where 1 operator analyzed the same 20 data sets 3 times. All operators were trained by a professional physician. The first and last three slices of each dataset were omitted from the analysis due to segmentation difficulties caused by poor bias field correction. Reanalysis precision errors were calculated as the root mean square average of standard deviation (RMS-SD) in units of the measured variable and as root mean square average of the coefficient of variation (RMS-CV) in percent [33].
Results
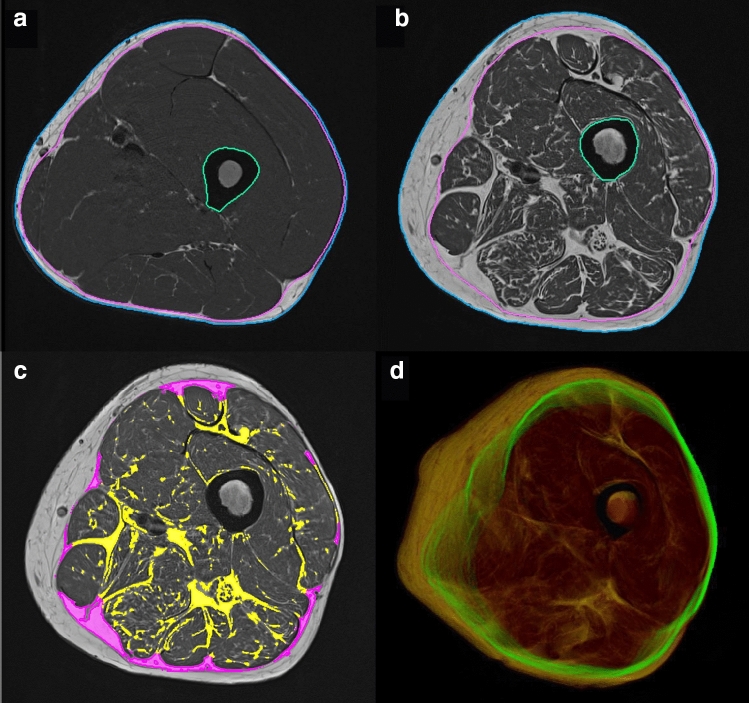
All 73 datasets were successfully segmented and registered to the Dixon scans. Manual editing was required in the majority of datasets, but was mostly limited to fully excluding the vena saphena magna and refining the FL. In 40% of the datasets, manual corrections with the refinement tool were applied to less than ten slices and in 10% of the datasets to ten slices or more. With the livewire refinement tool, editing was applied to ten slices simultaneously; thus in practice, a very experienced operator only edited a few slices per dataset. Typical processing times including minor corrections were 1–5 min per dataset. This time increased to 8–10 min per dataset in case of major corrections. Examples are shown in Fig. 7a, b.
Fig. 7.
Segmentation of the T1w images of a healthy young (a) and an elderly (b) subject. Image (c) shows the difference in IMAT (magenta) using the segmentation of the FL versus a tight fitting envelope. d A 3D projection of the FL segmentation in green, with muscle in red and AT in yellow
The registration between T1w and Dixon sequences was checked visually. Manual corrections were not required. Figure 7c shows an example of IMAT quantification in T1w data.
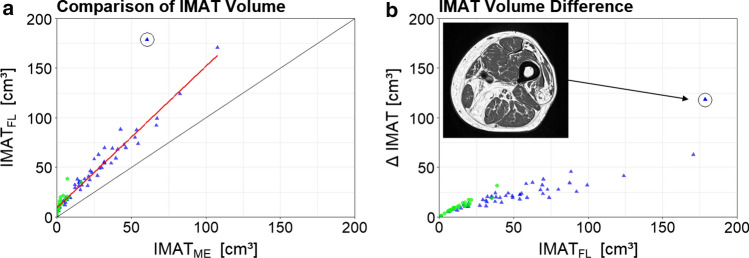
The Pearson correlation coefficient between IMATFL and IMATME, was r = 0.98. There was one outlier among the elderly subjects, which was excluded from the correlation analysis, as it showed unusually high amounts of IMAT. Figure 6 shows the correlation analysis and the outlier subject. When plotting the difference ∆IMAT (IMATFL–IMATME) against IMATFE, ∆IMAT showed an increase in variance with increasing values of IMATFE (Fig. 6b).
Fig. 6.
Comparison of IMAT results. a Correlation of IMAT volume determined by the FL (IMATFL) versus the narrow muscle envelope segmentation (IMATME). b Absolute IMATFL values plotted against the difference of IMATFL and IMATME. Green dots represent young and blue triangles elderly subjects. One outlier is marked by a black circle. An image of this subject is shown as inset
Inter- and intra-operator reanalysis precision errors for the IF VOI are summarized in Table 1. As the segmentation is easier for young than for elderly subjects, results are also shown separately for each group.
Table 1.
Inter- and intra-operator reanalysis precision errors of G1 (n = 5) and G2 (n = 15)
| Precision errors | Inter | Intra | |||||
|---|---|---|---|---|---|---|---|
| Mean | RMS-SD | RMS-CV | Mean | RMS-SD | RMS-CV | ||
| All | FFMT [%] | 7.29 | 0.02 | 0.04 | 7.30 | 0.01 | 0.02 |
| Volumetotal [cm3] | 1148 | 2.22 | 0.03 | 1149 | 0.87 | 0.01 | |
| VolumeIMAT [cm3] | 54.6 | 1.20 | 0.33 | 54.6 | 0.52 | 0.14 | |
| G1 | FFMT [%] | 3.94 | 0.01 | 0.35 | 3.96 | 0.01 | 0.07 |
| Volumetotal [cm3] | 1347 | 2.81 | 0.13 | 1348 | 0.55 | 0.02 | |
| VolumeIMAT [cm3] | 18.1 | 1.75 | 5.80 | 18.0 | 0.25 | 0.82 | |
| G2 | FFMT [%] | 8.41 | 0.02 | 0.04 | 8.42 | 0.01 | 0.03 |
| Volumetotal [cm3] | 1082 | 1.99 | 0.04 | 1083 | 0.95 | 0.02 | |
| VolumeIMAT [cm3] | 66.8 | 0.96 | 0.29 | 66.7 | 0.58 | 0.17 | |
All G1 and G2 combined; all parameters are measured within the IF VOI, i.e. intra-fascia region, excluding the femur, FFMT fat fraction of muscle tissue derived in Dixon 6pt scans by thresholding muscle and adipose tissue inside the fascia lata, Volumetotal volume of IF derived in T1w data, VolumeIMAT intermuscular adipose tissue volume derived in T1w data, RMS-SD root mean square of the standard deviation in units of the measured variable, RMS-CV root mean square coefficient of variation in %
Discussion
We presented a robust and precise semi-automatic method for segmenting the FL of the thigh muscles by combining clustering, level sets and 3D filtering of FL structures. FFMT was quantified by thresholding the 6pt Dixon scans after 3D registration with the T1w scans. The method was applied to young healthy and elderly sarcopenic subjects.
The segmentation of the FL is difficult. Even in high-quality T1w MRI datasets such as those available in the current study, the FL is not always unequivocally discernible from other SAT structures. To our knowledge, no other publication has addressed this problem in depth, indeed many methods struggled with an accurate FL localization or an anatomically accurate FL definition without using manually pre-labeled images. Some disregarded the FL altogether by limiting the segmentation to individual muscles or muscle groups or even limited the segmentation to muscle tissue only. Some studies used machine learning methods to segment degenerated muscles within their epimysium [34]. However, for an accurate quantification of IMAT and SAT, the FL segmentation is a prerequisite, which in particular in elderly subjects extends beyond the tightly fitting muscle envelope of the thigh.
The FL segmentation procedure developed in this study was based on the physiological FL characteristics of forming a closed 3D surface. Hence, filtering of plate-like structures was very efficient to locate the FL components. A similar segmentation approach was reported by Kovacs et al. [35] who used a thin line filter in the SAT to find the FL, but did not exploit its closed surface property.
Despite necessary manual adjustments to fine tune the FL, the precision of the new segmentation approach was excellent. As expected, the intra-operator errors were lower than the inter-operator precision errors. Scan–rescan precision errors of a subset of the cohort of the current study has been reported earlier [25]. RMS-CV FF precision errors of the scanning process were: 2.1% for the young healthy and 1.6% for the elderly subjects, which is about ten times higher than the analysis error. Unfortunately, precision of IMAT and of FFMT had not been reported in this earlier study.
The correlation analysis showed a highly linear relation between IMATFL and IMATME across a wide range of values. The slope differed from one, resulting in an accuracy error of IMAT when using the tight muscle envelope. Thus for certain cross-sectional studies, an accurate FL segmentation may not always be necessary. However, in longitudinal studies, or even when investigating age related differences cross-sectionally it remains unclear, whether a change in IMAT can adequately be quantified, if the more peripheral parts close to the FL are neglected or whether changes in IMATME adequately reflect changes in IMATFL.
In the study cohort, there was one outlier that showed an unusually high IMAT volume. When IMAT volume in such subjects should be quantified and compared with others, an accurate FL segmentation is unavoidable. It is important to note that the discrepancies between both segmentations increased with the amount of IMAT within the subjects.
Limitations
The quality of the segmentation approach developed in this study depends on image quality. A fundamental requirement is the detectability of fibrous tissue at the interfaces of muscles and SAT. A visual inspection of Fig. 1a shows that the voxel size of the T1w images of 0.5 × 0.5 × 3.0 mm3 fulfilled this requirement but a decrease of spatial resolution will impair the detectability of fibrous tissue and, therefore, the accuracy of the FL segmentation. The segmentation method was developed and tested on axial scans with 3 mm slice thickness. It is difficult to estimate how a larger displacement between the slices or a different orientation would affect the results. Obviously the same is true for IMAT. A decrease in spatial resolution of the T1w images will increase partial volume artefacts and thus decrease the precision of IMAT volume measurements.
Outlook
A segmentation approach based on shape priors together with a statistical formulation of the level set algorithm could further automate the FL segmentation [36]. Ideally the segmentation should be fully automated, for example, using deep learning approaches [37]. However, this will require adequate training data that can easily be generated using the method developed in this study.
IMAT is the traditional parameter for the assessment of adipose tissue in T1w images. With the segmentation of the FL, IMAT can now be quantified. In FF Dixon images, the FL segmentation is more difficult because image contrast and often also the spatial resolution is lower compared to T1w images. In consequence, fibrous structures have much lower contrast in FF images. Therefore, the FL was registered to the Dixon images to determine muscle tissue FF. Theoretically, the registration step can be omitted if opposed phase Dixon images are used for the FL segmentation. In this case, probably the 3D filtering of the FL has to be improved by increasing the resolution of the Dixon images, because visual inspection also showed a better image contrast in T1w compared to opposed phase Dixon images. Based on the results of this study, the question whether for a given clinical or research setting FF of muscle tissue or IMAT volume is more relevant can now be adequately addressed.
Conclusion
A highly precise semi-automatic segmentation method of the FL of the thigh was developed. The multi-step procedure included fuzzy c-means clustering to identify fibrous structures, Frangi’s filter detection principle to determine whether these structures were part of the FL and level set methods to determine the final FL. The combined (G1 and G2) reanalysis precision error of IMAT volume was below 0.5%. The combined reanalysis precision error of FFMT was below 0.4%. The FL differs from a simple envelop of the muscle ensemble of the thigh because of additional adipose tissue between muscles and FL, in particular in elderly subjects. When quantifying IMAT in subjects with high AT infiltration, a FL segmentation is required. An approximation of the FL by a tight muscle envelope may deliver useful results in cross-sectional studies. These are important results for quantitative investigations of effects of adipose tissue due to aging, treatment and across various diseases.
Acknowledgements
Open Access funding provided by Projekt DEAL. The present work was performed in partial fulfilment of the requirements for obtaining the PhD degree Dr. rer. biol. hum. at the University of Erlangen-Nuremberg.
Author contributions
Study conception and design: KE and WK. Acquisition of data: AG and MU. Analysis and interpretation of data: OC and KE. Drafting of manuscript: OC and KE. Critical revision: all.
Funding
This work was supported by Bayerische Forschungsstiftung, Grant number 1044-12.
Compliance with ethical standards
Conflict of interest
The authors declare that they have no conflict of interest.
Ethics approval
The study complied with the Declaration of Helsinki’s “Ethical Principles for Medical Research Involving Human Subjects” and was approved by the local university ethics committee.
Informed consent
After detailed information, all study participants gave their written informed consent.
Footnotes
Publisher's Note
Springer Nature remains neutral with regard to jurisdictional claims in published maps and institutional affiliations.
References
- 1.Cohen S, Nathan JA, Goldberg AL. Muscle wasting in disease: molecular mechanisms and promising therapies. Nat Rev Drug Discov. 2015;14(1):58–74. doi: 10.1038/nrd4467. [DOI] [PubMed] [Google Scholar]
- 2.Addison O, Marcus RL, Lastayo PC, Ryan AS. Intermuscular fat: a review of the consequences and causes. Int J Endocrinol. 2014;2014:309570. doi: 10.1155/2014/309570. [DOI] [PMC free article] [PubMed] [Google Scholar]
- 3.McGregor RA, Cameron-Smith D, Poppitt SD. It is not just muscle mass: a review of muscle quality, composition and metabolism during ageing as determinants of muscle function and mobility in later life. Longev Healthspan. 2014;3(1):9. doi: 10.1186/2046-2395-3-9. [DOI] [PMC free article] [PubMed] [Google Scholar]
- 4.Engelke K, Museyko O, Wang L, Laredo JD. Quantitative analysis of skeletal muscle by computed tomography imaging-State of the art. J Orthop Translat. 2018;15:91–103. doi: 10.1016/j.jot.2018.10.004. [DOI] [PMC free article] [PubMed] [Google Scholar]
- 5.Eggers H, Bornert P. Chemical shift encoding-based water-fat separation methods. J Magn Reson Imaging. 2014;40(2):251–268. doi: 10.1002/jmri.24568. [DOI] [PubMed] [Google Scholar]
- 6.Damon BM, Li K, Bryant ND. Magnetic resonance imaging of skeletal muscle disease. Handb Clin Neurol. 2016;136:827–842. doi: 10.1016/B978-0-444-53486-6.00041-7. [DOI] [PubMed] [Google Scholar]
- 7.Burakiewicz J, Sinclair CDJ, Fischer D, Walter GA, Kan HE, Hollingsworth KG. Quantifying fat replacement of muscle by quantitative MRI in muscular dystrophy. J Neurol. 2017;264(10):2053–2067. doi: 10.1007/s00415-017-8547-3. [DOI] [PMC free article] [PubMed] [Google Scholar]
- 8.Ten Dam L, van der Kooi AJ, Verhamme C, Wattjes MP, de Visser M. Muscle imaging in inherited and acquired muscle diseases. Eur J Neurol. 2016;23(4):688–703. doi: 10.1111/ene.12984. [DOI] [PubMed] [Google Scholar]
- 9.Strijkers GJ, Araujo ECA, Azzabou N, Bendahan D, Blamire A, Burakiewicz J, Carlier PG, Damon B, Deligianni X, Froeling M, Heerschap A, Hollingsworth KG, Hooijmans MT, Karampinos DC, Loudos G, Madelin G, Marty B, Nagel AM, Nederveen AJ, Nelissen JL, Santini F, Scheidegger O, Schick F, Sinclair C, Sinkus R, de Sousa PL, Straub V, Walter G, Kan HE. Exploration of new contrasts, targets, and mr imaging and spectroscopy techniques for neuromuscular disease—a workshop report of working group 3 of the biomedicine and molecular biosciences COST action BM1304 MYO-MRI. J Neuromuscul Dis. 2019;6(1):1–30. doi: 10.3233/JND-180333. [DOI] [PMC free article] [PubMed] [Google Scholar]
- 10.Mercuri E, Talim B, Moghadaszadeh B, Petit N, Brockington M, Counsell S, Guicheney P, Muntoni F, Merlini L. Clinical and imaging findings in six cases of congenital muscular dystrophy with rigid spine syndrome linked to chromosome 1p (RSMD1) Neuromuscul Disord. 2002;12(7–8):631–638. doi: 10.1016/S0960-8966(02)00023-8. [DOI] [PubMed] [Google Scholar]
- 11.de Carvalho Felinto J, Poloni KM, de Lima Freire PG, Aily JB, de Almeida AC, Pedroso MG, Mattiello SM, Ferrari RJ. Computational Science and Its Applications—ICCSA 2018. Cham: Springer International Publishing; 2018. Automatic segmentation and quantification of thigh tissues in CT images; pp. 261–276. [Google Scholar]
- 12.Muhlberg A, Museyko O, Laredo JD, Engelke K. A reproducible semi-automatic method to quantify the muscle-lipid distribution in clinical 3D CT images of the thigh. PLoS One. 2017;12(4):e0175174. doi: 10.1371/journal.pone.0175174. [DOI] [PMC free article] [PubMed] [Google Scholar]
- 13.Snyder WS, Cook MJ, Nasset ES, Karhausen LR, Howells GP, Tipton IH. Report of the task group on reference man. Oxford, UK: Pergamon Press; 1975. [Google Scholar]
- 14.Wronska A, Kmiec Z. Structural and biochemical characteristics of various white adipose tissue depots. Acta Physiol (Oxf) 2012;205(2):194–208. doi: 10.1111/j.1748-1716.2012.02409.x. [DOI] [PubMed] [Google Scholar]
- 15.Karampinos DC, Baum T, Nardo L, Alizai H, Yu H, Carballido-Gamio J, Yap SP, Shimakawa A, Link TM, Majumdar S. Characterization of the regional distribution of skeletal muscle adipose tissue in type 2 diabetes using chemical shift-based water/fat separation. J Magn Reson Imaging. 2012;35(4):899–907. doi: 10.1002/jmri.23512. [DOI] [PMC free article] [PubMed] [Google Scholar]
- 16.Grimm A, Meyer H, Nickel MD, Nittka M, Raithel E, Chaudry O, Friedberger A, Uder M, Kemmler W, Engelke K, Quick HH. A comparison between 6-point dixon MRI and MR spectroscopy to quantify muscle fat in the thigh of subjects with sarcopenia. J Frailty Aging. 2019;8(1):21–26. doi: 10.14283/jfa.2018.16. [DOI] [PubMed] [Google Scholar]
- 17.Graffy PM, Liu J, Pickhardt PJ, Burns JE, Yao J, Summers RM. Deep learning-based muscle segmentation and quantification at abdominal CT: application to a longitudinal adult screening cohort for sarcopenia assessment. Br J Radiol. 2019;92(1100):20190327. doi: 10.1259/bjr.20190327. [DOI] [PMC free article] [PubMed] [Google Scholar]
- 18.Positano V, Christiansen T, Santarelli MF, Ringgaard S, Landini L, Gastaldelli A. Accurate segmentation of subcutaneous and intermuscular adipose tissue from MR images of the thigh. J Magn Reson Imaging. 2009;29(3):677–684. doi: 10.1002/jmri.21699. [DOI] [PubMed] [Google Scholar]
- 19.Orgiu S, Lafortuna CL, Rastelli F, Cadioli M, Falini A, Rizzo G. Automatic muscle and fat segmentation in the thigh from T1-Weighted MRI. J Magn Reson Imaging. 2016;43(3):601–610. doi: 10.1002/jmri.25031. [DOI] [PubMed] [Google Scholar]
- 20.Lareau-Trudel E, Le Troter A, Ghattas B, Pouget J, Attarian S, Bendahan D, Salort-Campana E. Muscle quantitative MR imaging and clustering analysis in patients with facioscapulohumeral muscular dystrophy type 1. PLoS One. 2015;10(7):e0132717. doi: 10.1371/journal.pone.0132717. [DOI] [PMC free article] [PubMed] [Google Scholar]
- 21.Visser M, Goodpaster BH, Kritchevsky SB, Newman AB, Nevitt M, Rubin SM, Simonsick EM, Harris TB. Muscle mass, muscle strength, and muscle fat infiltration as predictors of incident mobility limitations in well-functioning older persons. J Gerontol A Biol Sci Med Sci. 2005;60(3):324–333. doi: 10.1093/gerona/60.3.324. [DOI] [PubMed] [Google Scholar]
- 22.Marcus RL, Addison O, Kidde JP, Dibble LE, Lastayo PC. Skeletal muscle fat infiltration: impact of age, inactivity, and exercise. J Nutr Health Aging. 2010;14(5):362–366. doi: 10.1007/s12603-010-0081-2. [DOI] [PMC free article] [PubMed] [Google Scholar]
- 23.Kemmler W, Weissenfels A, Teschler M, Willert S, Bebenek M, Shojaa M, Kohl M, Freiberger E, Sieber C, Sv Stengel. Whole-body electromyostimulation and protein supplementation favorably affect sarcopenic obesity in community-dwelling older men at risk: the randomized controlled FranSO study. Clin Interv Aging. 2017;12:1503–1513. doi: 10.2147/CIA.S137987. [DOI] [PMC free article] [PubMed] [Google Scholar]
- 24.Grimm A, Nickel MD, Chaudry O, Uder M, Jakob F, Kemmler W, Quick HH, Engelke K. Feasibility of Dixon magnetic resonance imaging to quantify effects of physical training on muscle composition—a pilot study in young and healthy men. Eur J Radiol. 2019;114:160–166. doi: 10.1016/j.ejrad.2019.03.019. [DOI] [PubMed] [Google Scholar]
- 25.Grimm A, Meyer H, Nickel MD, Nittka M, Raithel E, Chaudry O, Friedberger A, Uder M, Kemmler W, Engelke K, Quick HH. Repeatability of Dixon magnetic resonance imaging and magnetic resonance spectroscopy for quantitative muscle fat assessments in the thigh. J Cachexia Sarcopenia Muscle. 2018;9(6):1093–1100. doi: 10.1002/jcsm.12343. [DOI] [PMC free article] [PubMed] [Google Scholar]
- 26.Caggiati A. Fascial relationships of the long saphenous vein. Circulation. 1999;100(25):2547–2549. doi: 10.1161/01.CIR.100.25.2547. [DOI] [PubMed] [Google Scholar]
- 27.Tustison NJ, Avants BB, Cook PA, Zheng Y, Egan A, Yushkevich PA, Gee JC. N4ITK: improved N3 bias correction. IEEE Trans Med Imaging. 2010;29(6):1310–1320. doi: 10.1109/TMI.2010.2046908. [DOI] [PMC free article] [PubMed] [Google Scholar]
- 28.Caselles V, Kimmel R, Sapiro G. Geodesic active contours. Int J Comput Vision. 1997;22(1):61–79. doi: 10.1023/A:1007979827043. [DOI] [Google Scholar]
- 29.Frangi AF, Niessen WJ, Vincken KL, Viergever MA. Medical image computing and computer-assisted intervention—MICCAI’98. Berlin: Springer; 1998. Multiscale vessel enhancement filtering; pp. 130–137. [Google Scholar]
- 30.Mortensen EN, Barrett WA (1995) Intelligent scissors for image composition. Paper presented at the Proceedings of the 22nd annual conference on Computer graphics and interactive techniques
- 31.Hart P, Nilsson N, Raphael B. A formal basis for the heuristic determination of minimum cost paths. IEEE Trans Syst Sci Cybern. 1968;4(2):100–107. doi: 10.1109/TSSC.1968.300136. [DOI] [Google Scholar]
- 32.R Core Team (2019) R: a language and environment for statistical computing. 3.6.2 edn. R Foundation for Statistical Computing
- 33.Glüer C-C, Blake G, Lu Y, Blunt BA, Jergas M, Genant HK. Accurate assessment of precision errors: how to measure the reproducibility of bone densitometry techniques. Osteoporos Int. 1995;5(4):262–270. doi: 10.1007/BF01774016. [DOI] [PubMed] [Google Scholar]
- 34.Gadermayr M, Li K, Muller M, Truhn D, Kramer N, Merhof D, Gess B. Domain-specific data augmentation for segmenting MR images of fatty infiltrated human thighs with neural networks. J Magn Reson Imaging. 2019;49(6):1676–1683. doi: 10.1002/jmri.26544. [DOI] [PubMed] [Google Scholar]
- 35.Kovacs W, Liu C-Y, Summers R, Yao J. Identification of muscle and subcutaneous and intermuscular adipose tissue on thigh MRI of muscular dystrophy. 2016 doi: 10.1109/isbi.2016.7493238:176-179. [DOI] [Google Scholar]
- 36.Gadermayr M, Disch C, Muller M, Merhof D, Gess B. A comprehensive study on automated muscle segmentation for assessing fat infiltration in neuromuscular diseases. Magn Reson Imaging. 2018;48:20–26. doi: 10.1016/j.mri.2017.12.014. [DOI] [PubMed] [Google Scholar]
- 37.Ronneberger O, Fischer P, Brox T. Medical image computing and computer-assisted intervention—MICCAI 2015. Cham: Springer; 2015. U-Net: convolutional networks for biomedical image segmentation; pp. 234–241. [Google Scholar]


