Abstract
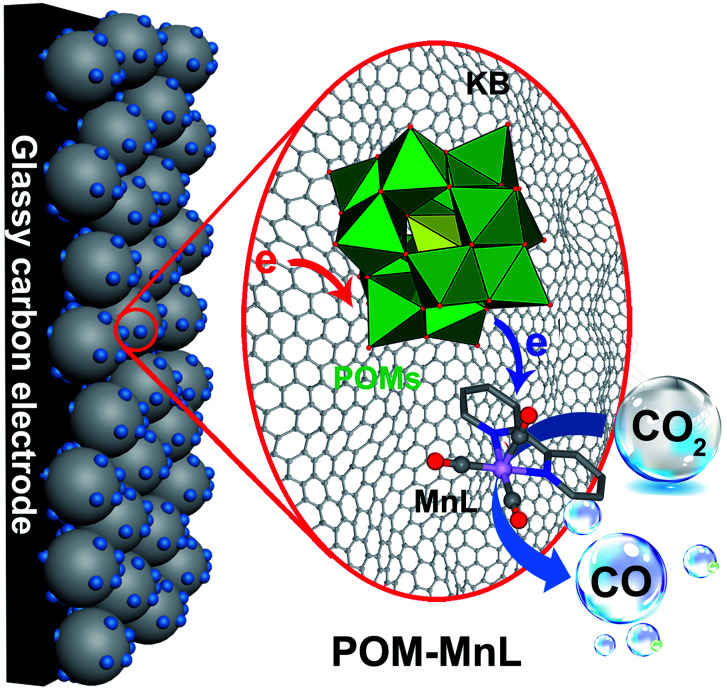
The electrocatalytic carbon dioxide (CO2) reduction reaction (CO2RR) involves a variety of electron transfer pathways, resulting in poor reaction selectivity, limiting its use to meet future energy requirements. Polyoxometalates (POMs) can both store and release multiple electrons in the electrochemical process, and this is expected to be an ideal “electron switch” to match with catalytically active species, realize electron transfer modulation and promote the activity and selectivity of the electrocatalytic CO2RR. Herein, we report a series of new POM-based manganese-carbonyl (MnL) composite CO2 reduction electrocatalysts, whereby SiW12–MnL exhibits the most remarkable activity and selectivity for CO2RR to CO, resulting in an increase in the faradaic efficiency (FE) from 65% (MnL) to a record-value of 95% in aqueous electrolyte. A series of control electrochemical experiments, photoluminescence spectroscopy (PL), transient photovoltage (TPV) experiments, and density functional theory (DFT) calculations revealed that POMs act as electronic regulators to control the electron transfer process from POM to MnL units during the electrochemical reaction, enhancing the selectivity of the CO2RR to CO and depressing the competitive hydrogen evolution reaction (HER). This work demonstrates the significance of electron transfer modulation in the CO2RR and suggests a new idea for the design of efficient electrocatalysts towards CO2RR.
Polyoxometalates as electron regulators to promote the carbonyl manganese (MnL) electrocatalyst for highly efficient CO2 reduction in aqueous electrolyte.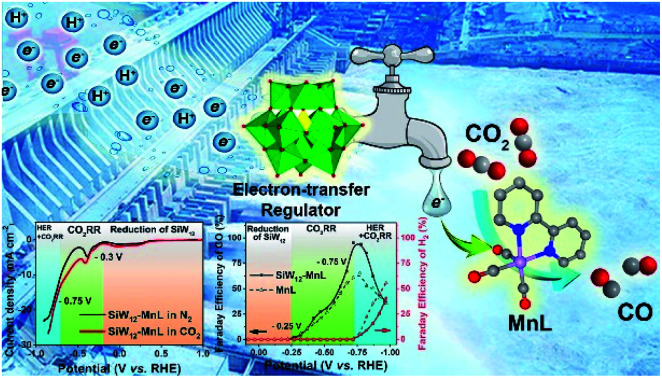
1. Introduction
The electrocatalytic CO2 reduction reaction (CO2RR) that enables the conversion of CO2 into fuels or value-added organic compounds, along with the storage of intermittent electrical energy, and mitigates the environmental problem, has been regarded as a promising approach to meet future energy demands.1–4 However, the uncontrolled multiple coupling processes of electron/protons in CO2RR lead to various reaction pathways, which always generate a number of different products, causing low faradaic efficiency (FE) and selectivity.5–7 In addition, from the perspective of reaction thermodynamics, the equilibrium potentials for most CO2RR half-reactions (e.g. CO2 + 2H+ + 2e = CO + H2O, Eө = −0.11 V vs. RHE, pH = 7) are close to those of the hydrogen evolution reaction (HER) in aqueous electrolyte (Eө = −0.095 V vs. RHE pH = 7), generating an additional competing reaction.8,9 Nowadays, the regulation of the proton transfer process that occurs in electrocatalytic reactions is considered as an effective means to optimize the reaction pathways, thereby enhancing the product selectivity and faradaic efficiency.10–13 For example, our previous work demonstrated a design concept for a composite Co3O4–CDOts–C3N4 electrocatalyst for efficient CO2 reduction to syngas, where the introduction of CDots with a strong adsorption capacity for H species successfully dominated the proton transfer process and achieved modulation of the reaction pathways of HER and CO2RR.14 As another important factor, the electron transfer process has vital influences on the thermodynamics, kinetics and various reaction pathways of the electrocatalytic reaction.15,16 For instance, the number of transfer electrons can greatly determine the products of the electrocatalytic reaction (e.g. CO, 2e; CH4, 8e). The potential and orientation of electron transfer could also change the reaction pathways. Therefore, quantitative, oriented and controllable electron transfer is expected to be another important strategy in designing efficient electrocatalysts for CO2 reduction. However, research into this is still a challenging task since the electron transfers occurring in the catalysts are often complex, fast and undirected, and this makes them difficult to control.
Polyoxometalates (POMs), as a class of well-defined metal-oxo clusters with reversible redox activity, are widely used in electrocatalysis,15,17–21 photocatalysis,22–26 and in electrochromism.27 During these processes, POMs can both accept and release multiple electrons whilst maintaining their structural stability.17,28 Such a special property can be utilized as a potential “electron switch” to complement the catalytically active species, realize the modulation of the electron transfer pathway in electrochemical reactions, and promote the activity and selectivity of electrocatalytic reactions. In this regard, a manganese carbonyl complex [MnI(bipyridyl)(CO)3Br] (MnL) could be an available catalytic species to compete with POMs. As a well-known electrocatalyst for CO2RR, MnL possesses a clear reaction pathway and can specifically reduce CO2 to CO in organic solvent.29–32 However, HER becomes an unavoidable competitive reaction when MnL is used in aqueous electrolyte, due to the rebellious electron transfer process.33–35 Thus, if POMs can combine with MnL, a new efficient catalyst system may be achieved to modify the electron transfer process and promote the activity and selectivity of the CO2RR to CO.
Based on the above consideration, we prepared new POM–manganese carbonyl (POM–MnL) composite compounds [MnI(bipy)(CO)3(CH3CN)]4(SiW12O40)·5CH3CN (SiW12–MnL), [MnI(bipy)(CO)3(CH3CN)]3(PW12O40)·2CH3CN (PW12–MnL), and [MnI(bipy)(CO)3(CH3CN)]3(PMo12O40)·2CH3CN (PMo12–MnL) as electrocatalysts to investigate the electrocatalytic CO2RR. Among these POM–MnL composite catalysts, SiW12–MnL exhibited the most remarkable activity for the CO2RR to CO with particularly high selectivity, and promotion of the faradaic efficiency (FE) from 65% (MnL) to more than 95% at an overpotential of 0.61 V, which is nearly double that of the parent MnL electrocatalysts in an aqueous electrolyte. A series of electrochemical cyclic voltammetry (CV) tests, photoluminescence spectroscopy (PL) measurements, transient photovoltage (TPV) experiments, and density functional theory (DFT) calculations revealed that the electron transfer process between the POM and MnL units played a key role in modifying the CO2RR to CO and depressing the competitive HER. Changing the POM species in the composite POM–MnL catalyst system can realize modulation of electron transfer and achieve different improvements on the FE of the CO2RR.
2. Experimental
2.1. Synthesis of [MnI(bipy)(CO)3(CH3CN)]4(SiW12O40)·5CH3CN (abbreviated as SiW12–MnL)
H4[α-SiW12O40]·nH2O (0.72 g, ca. 0.25 mmol) was dissolved in 14 mL of water, and 15 mL of acetonitrile (CH3CN) solution containing Mn(bipy)(CO)3Br (0.19 g, ca. 0.5 mmol) was added dropwise under vigorous stirring. Then, the yellow precipitate appeared immediately. The resulting mixture was stirred for 30 min at room temperature in the dark and was then filtered. The resulting precipitate was collected and dissolved in hot CH3CN (50 mL), and the orange block crystals were isolated by slow evaporation at 4 °C in the dark after 2–3 days. Yield: 40.4%, based on Mn(bipy)(CO)3Br. Calcd for C70H61Mn4N17O52SiW12 (SiW12–Mn, %): H, 1.43; C, 16.74; N, 5.53; Si, 0.65; Mn, 5.10; W, 51.23. Found (%): H, 1.21; C, 16.85; N, 5.24; Si, 0.72; Mn, 5.32; W, 51.12. FT IR: 2035 (m), 1922 (s) cm−1 (CO), 1016 (m), 978 (m), 916 (w), 734 (s) cm−1 (SiW12).
2.2. Synthesis of [MnI(bipy)(CO)3(CH3CN)]3(PW12O40)·2CH3CN (abbreviated as PW12–MnL)
The synthesis was the same as the aforementioned method, except that H3[α-PW12O40]·nH2O (0.78 g, ca. 0.25 mmol) was used to replace H4[α-SiW12O40]·nH2O. The final orange block crystals of PW12–MnL possessed a final yield of 0.4 g (ca. 60.5%) yield, based on Mn(bipy)(CO)3Br. Calcd for C49H39Mn3N11O49PW12 (PW12–MnL, %): H, 0.99; C, 14.83; N, 3.88; P, 0.78; Mn, 4.15; W, 55.60. Found (%): H, 1.03; C, 14.96; N, 4.05; P, 0.74; Mn, 4.32; W, 56.05. FT-IR: 2038 (m), 1947 (s) cm−1 (CO), 1074 (m), 983 (m), 901 (w), 810 (s) cm−1 (PW12).
2.3. Synthesis of [MnI(bipy)(CO)3(CH3CN)]3(PW12O40)·2CH3CN (abbreviated as PMo12–MnL)
The synthesis was the same as the aforementioned method, except that H3[α-PMo12O40]·nH2O (0.46 g, ca. 0.25 mmol) was used to replace H4[α-SiW12O40]·nH2O. The final orange block crystals of PMo12–MnL had a yield of 65.1%, based on Mn(bipy)(CO)3Br. Calcd for C49H39Mn3Mo12N11O49P (PMo12–MnL, %): H, 1.35; C, 20.20; N, 5.29; P, 1.06; Mn, 5.66; Mo, 39.52. Found (%): H, 1.40; C, 20.35; N, 5.12; P, 1.21; Mn, 5.31; Mo, 39.42. FT IR: 2038 (m), 1934 (s) cm−1 (CO), 1053 (m), 949 (m), 873 (w), 776 (s) cm−1 (PMo12).
2.4. Preparation of the POM–MnL/KB composite electrocatalyst
In order to promote the conductivity of the crystalline POM–MnL composite compounds, Ketjenblack Black (KB) carbon was used as a catalyst carrier to combine with the POM–MnL compounds. Herein, the SiW12–MnL compound was selected as a representative sample to describe the preparation method of POM–MnL/KB. An aliquot of 20 mg KB was added into 20 mL of CH3CN solution containing 100 mg SiW12–MnL. After sonication for 30 min, the resulting mixture was rotary evaporated to dry and the black powder electrocatalysts (SiW12–MnL loaded on KB) were obtained. The PW12–MnL/KB, PMo12–MnL/KB and parent MnL/KB were prepared in the same way.
2.5. Preparation of CsPOM/KB
The preparation process of CsPOM/KB was as follows. Taking CsSiW12 as an example, 0.08 g Cs4[α-SiW12O40]·nH2O and 20 mg KB were mixed in 10 mL of aqueous solution uniformly by ultrasound for 1 hour. Then, the suspension was separated by centrifugation, washed with water three times, and dried in air. The obtained powder was denoted as CsSiW12/KB. CsPW12/KB and CsPMo12/KB were prepared in the same way.
2.6. Preparation of the working electrode
The catalyst suspension was prepared by dispersing 50 mg of POM–MnL/KB or the as-prepared control catalysts (MnL/KB or CsPOM/KB) in 0.5 mL of solution containing 450 μL of absolute ethyl alcohol and 50 μL of 5 wt% Nafion solution, followed by ultrasonication for 1 hour until a homogeneous ink was formed. Then, a 6 μL portion of the as-prepared ink was dropped on the surface of the glassy carbon electrode (0.07065 cm2), yielding a working electrode after it was dried in air.
2.7. Transient photovoltage measurements
The transient photovoltage (TPV) values were measured on a home-made system, similar to that reported in the literature.36 The TPV was excited with a nanosecond laser radiation pulse (wavelength of 355 nm and the repetition rate was 5 Hz) from a third harmonic Nd:YAG laser (Beamtech Optronics Co., Ltd.). The TPV signals were amplified by an amplifier and were recorded by an oscilloscope. All measurements were performed at room temperature and under ambient pressure.
3. Results and discussion
3.1. Preparation and characterization of the POM–MnL composite catalysts
All the POM–MnL compounds were synthesized by simple solution self-assembly and crystallization methods. Taking SiW12–MnL as an example, the single crystal of SiW12–MnL was isolated by slow evaporation of the CH3CN/H2O solution containing parent H4SiW12O40 and MnL (Scheme S1‡). Single-crystal X-ray diffractions demonstrated that these POM–MnL compounds are composed of a Keggin-type polyoxoanion unit, [Mn(bipy)(CO)3(CH3CN)3]+ moieties and acetonitrile molecules (Fig. S1 and Tables S1–S4‡). The POM unit and MnL species interact with each other by electrostatic (Fig. S2‡) and hydrogen-bonding interactions (Fig. S3, Tables S5–S7‡). The powder X-ray diffraction patterns (PXRD, Fig. S4‡) and thermogravimetric (TG, Fig. S5‡) curves also certified the structural integrity and the composition of the crystalline POM–MnL catalysts. Moreover, these POM–MnL complexes were soluble in acetonitrile but were insoluble in water and exhibited excellent stabilities in 0.5 M CO2-saturated KHCO3 solution (Fig. S6 and S7‡), implying their potential application in the heterogeneous CO2RR in aqueous electrolytes.
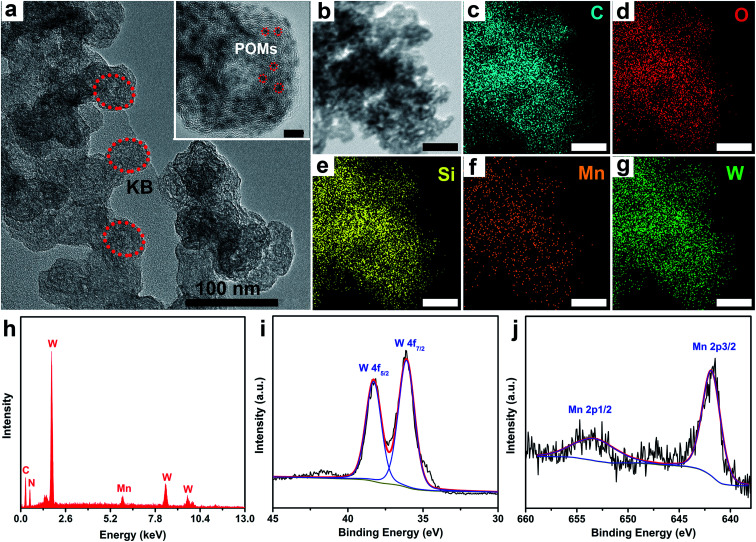
To promote the electroconductivity of crystalline POM–MnL catalysts for succeeding in the electrocatalytic investigations, Ketjenblack (KB) carbon was introduced into the CH3CN solution of POM–MnL. After evaporating the solution to dryness, POM–MnL loaded on KB (POM–MnL/KB) heterogeneous composites were achieved (Scheme S1‡). The composition and morphological features of such composite materials were characterized by transmission electro-microscopy (TEM). As shown in Fig. 1a and S8a, S9a,‡ POM–MnL compounds are uniformly distributed on ca. 30 nm KB nanospheres, and no obvious aggregation was observed. High-resolution TEM images (the inset of Fig. 1a and S8a, S9a‡) reveal that the average size of a POM–MnL nano-crystal is about 1.5 nm. Furthermore, elemental mapping images of POM–MnL/KB in Fig. 1b–g, S8b–g and S9b–g‡ display the homogeneous distribution of C, O, Mn, Si/P and W/Mo in the whole composites. Energy dispersive X-ray absorption (EDX) analyses (Fig. 1h and S10‡) also confirm the composition of POM–MnL/KB, and the contents of SiW12–MnL, PW12–MnL, and PMo12–MnL in POM–MnL/KB are about 81.85%, 85.64% and 86.61%, respectively. Moreover, X-ray photoelectron spectroscopy (XPS) of the POM–MnL/KB composites was also carried out to elucidate their valence states and compositions. As observed in Fig. 1i, j and S11,‡ the XPS spectra of POM–MnL/KB indicated the presence of C, N, O, Si/P and W/Mo in the catalysts. In SiW12–MnL/KB, the high-resolution W 4f spectrum features two characteristic peaks at 36.1 and 38.69 eV, which can be assigned to WVI 4f7/2 and 4f5/2 in the SiW12 species,37 and this coincides with the BVS calculation results (Table S8‡).38 The Mn 2p XPS exhibits two peaks at 641.8 and 653.0 eV, which can be ascribed to MnI 2p3/2 and 2p1/2, respectively.39 For PW12–MnL/KB and PMo12–MnL/KB, the XPS spectra of W and Mo also demonstrated congruent results with BVS calculations (Fig. S12 and Table S9‡).40,41 In addition, Fourier transform infrared (FT-IR) spectra of POM–MnL/KB displayed the characteristic vibrations of POM and MnL, further certifying the composition of the POM–MnL/KB materials (Fig. S13‡). Furthermore, the Brunauer–Emmett–Teller (BET) surface areas of SiW12–MnL/KB, PW12–MnL/KB and PMo12–MnL/KB, calculated by the N2 isotherms, were 143.7, 105.4 and 153.3 m2 g−1 (Fig. S14‡), respectively. The high surface area can efficiently facilitate charge transfer and expose more active sites. Moreover, the H+ adsorption experiments revealed that the amount of adsorbed H+ was 133.53 mg mol−1 for SiW12–MnL and 14.73 mg mol−1 for MnL, signifying that the introduction of POMs can provide a sufficient source of H+ for the reduction of CO2 in the center of MnL.14 All the above results demonstrate that the POM–MnL/KB composite catalyst systems are successfully synthesized for the electrocatalytic CO2RR investigation.
Fig. 1. (a) TEM images of SiW12–MnL/KB (inset: HR-TEM images of SiW12–MnL/KB, scale bar: 5 nm). (b–g) Corresponding elemental mapping of C, O, Si, Mn and W of SiW12–MnL/KB, scale bar: 100 nm. (h) The EDX spectra of SiW12–MnL/KB. (i and j) The XPS spectra of SiW12–MnL/KB: (i) W, (j) Mn.
3.2. The electrocatalytic CO2RR performance of POM–MnL
Before the electrocatalytic CO2RR investigation, the electrochemical properties of free POMs as well as MnL in solution, the cesium salt of POMs loaded on KB (CsPOM/KB) and POM–MnL/KB were studied by cyclic voltammetry (CV) experiments. The CVs of the free POM species (H4SiW12O40, H3PW12O40 and H3PMo12O40) were measured in H2SO4 electrolyte, and free MnL was measured in KHCO3 electrolyte. As shown in Fig. S15,‡ three Keggin-type POMs exhibit similar three pairs of characteristic redox peaks that are assigned to the four-electron redox behavior of WVI/WV or MoVI/MoV in POMs.42,43 The CV of MnL in KHCO3 solution shows two obvious reduction peaks at 0.27 V and −0.46 V vs. RHE (Fig. S15d‡). The peak at 0.27 V can be ascribed as reduction of the ligand in MnL to generate the [Mn(L−)(CO)3Br]− species, and the peak at −0.46 V can be attributed to the departure of Br− in MnL to generate a catalytically active species, [Mn(L)(CO)3]−.32,34 It is noteworthy that the redox peak potentials of these three POMs display clear deviations, which may endow the POMs with different electron storage and transfer properties.
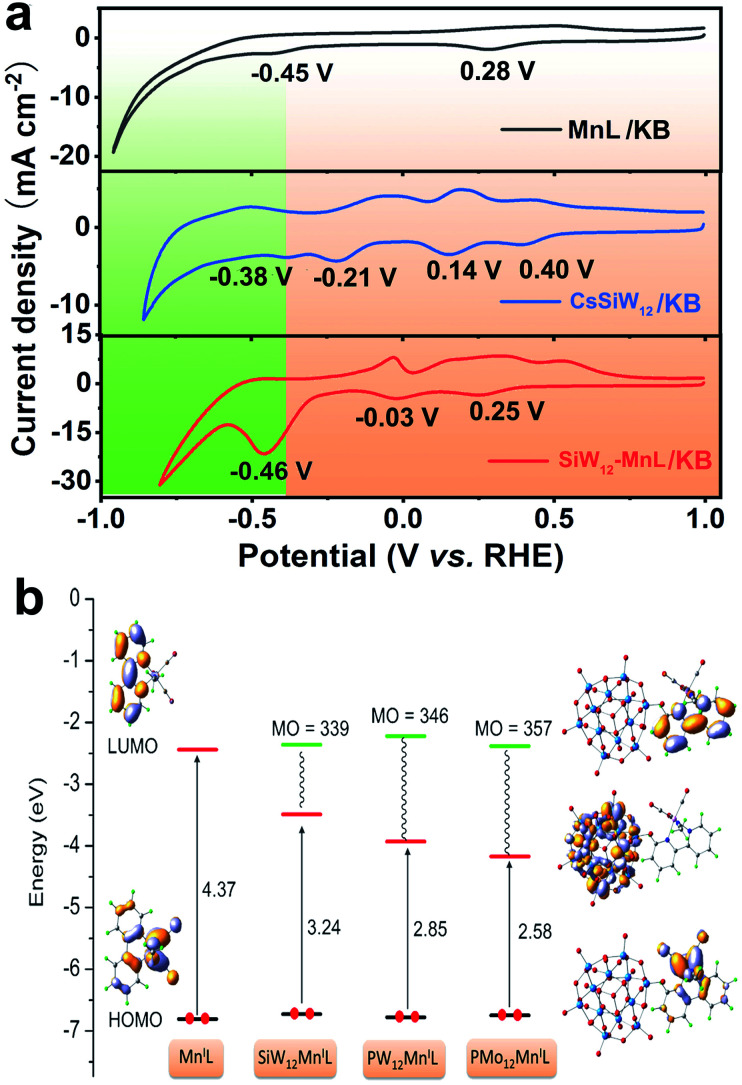
After POMs and MnL were loaded on KB, the electrochemical properties did not show much change (Fig. 2a and S16‡). MnL/KB showed two reduction peaks at 0.28 V and −0.45 V vs. RHE, which is consistent with the reduction potential of free MnL in solution. Three CsPOMs/KB composites also exhibited electrochemical redox signals similar to free POMs in solution. The reduction peaks of CsSiW12/KB were located at 0.40, 0.14, −0.21 and −0.38 V vs. RHE, the reduction peaks of CsPW12/KB were located at 0.46 and −0.42 V vs. RHE and the reduction peaks of CsPMo12/KB were located at 0.30 and −0.51 V vs. RHE. In comparison with the CVs of free POM in solution, it can be observed that the reduction peak potentials of the CsPOMs/KB composites are slightly offset compared with those of free POM in solution, and this may be due to the increase in pH in solution.44 The reversibility of the electrochemical redox peak becomes worse, and this may be due to the changes of the microenvironments of the surface after POM immobilization on KB.45,46 It is worth noting that the reduction peaks of CsPOM/KB are clearly more positive than those of MnL (−0.45 V), indicating that the polyoxoanions preferentially obtain electrons.
Fig. 2. (a) The CVs for MnL/KB, CsSiW12/KB and SiW12–MnL/KB in 0.5 mol L−1 N2-saturated KHCO3 at a 0.05 V s−1 scan rate. (b) Computed frontier orbitals (compositions and energies) for MnL, SiW12–MnL, PW12–MnL, and PMo12–MnL (the green lines represent the unoccupied molecular orbitals (MO) contributed by MnL in POM–MnL).
Meanwhile, for POM–MnL/KB, the reduction peaks at 0.25 and −0.03 V for SiW12–MnL/KB, 0.12 V for PW12–MnL/KB and 0.24 V for PMo12–MnL/KB result from the electron storage of POM (Fig. 2a and S16‡). These reduction peaks move towards a negative potential compared to those of CsPOM/KB, and this may be related to the difference in their cations.47 The reduction peaks at ca. −0.46 V for SiW12–MnL/KB, −0.42 V for PW12–MnL/KB and −0.65 V for PMo12–MnL/KB become strong and broad, and this may be due to the overlap of the last reduction peak of POMs and MnL. This endows electron transfer to occur between POMs and MnL. Furthermore, the CVs of POM–MnL/KB at different scan rates from 25 to 125 mV s−1 have also been carried out. The last pair of redox peak currents are plotted in Fig. S17–S19‡vs. the square root of the scan rates (v1/2), indicating that the electrochemical process is a diffusion-controlled process.48,49
To affirm the CV results, a series of density functional theory (DFT) calculations were conducted using the standard B3LYP functional to explore the electron store and transfer behaviour in the electrochemical process of the POM–MnL composite. In Fig. 2b the orbital energies and composition of POM–MnL are compared with the free MnL species. It is worth noting that the involvement of POMs induces a clearly different lowest unoccupied molecular orbital (LUMO), which has complete participation of the W(4d) and O(2p) orbitals from POM, whereas the main contributions are from bipy in pure MnL. This implies that the electrons will preferentially be localized on the POM units in the electrochemical reduction process. Only when the LUMO orbit of the POM is filled with electrons can the electrons on the SiW12 be transferred to the MnL component, and at this point the MnL component begins to be reduced. Such a calculation indicates that the POM is reduced first and then transfers electrons to MnL during the electrochemical process.
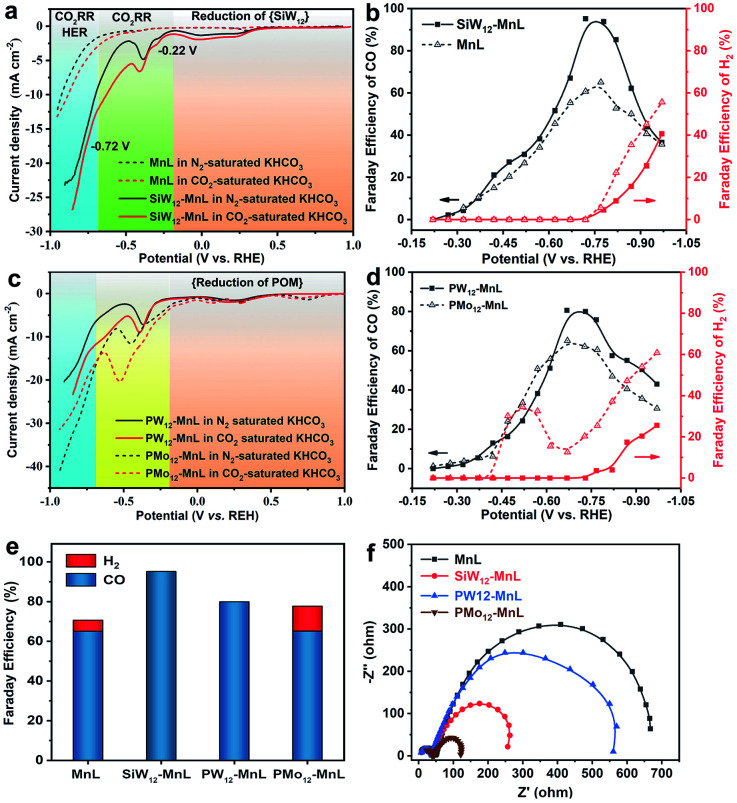
Subsequently, the electrocatalytic CO2RR performance of POM–MnL/KB was investigated (Fig. 3 and S20‡). As shown in Fig. 3a, the polarization curves of SiW12–MnL/KB in CO2-saturated 0.5 M KHCO3 can be divided into three parts. Firstly, the reduction peaks in the potential range of 1.0 to −0.22 V vs. RHE can be attributed to the reduction of the SiW12 polyoxoanion. In this range, no H2 or CO can be detected (Fig. 3b). Secondly, a broad cathodic wave within the scope of −0.22 to −0.46 V vs. RHE may be caused by the mixed process of the electron storage and transfer from POM to MnL, generating the CO2RR active species. Within this potential range, only CO was detected, and its Faraday efficiency slowly increased with the negative potential scans. In the range of −0.46 to −0.72 V vs. RHE, a sharp increase in the reduction current density was observed, and this is caused by the CO2RR. The corresponding FE of CO increases with the increase in applied potential and reaches a maximum of ∼95% at −0.72 V vs. RHE. Thirdly, as the potential continues to negatively sweep beyond −0.72 V vs. RHE, the current density displays a continuous increase with a higher slope, implying that the electrochemical reaction pathways have been changed and some competing reaction may occur. Compared with MnL/KB (Fig. 3a and b), SiW12–MnL/KB remarkably enhances the Faraday efficiency of CO (from 65% to a record 95% at −0.72 V vs. RHE), and reduces the Faraday efficiency of H2 (from 59% to 39% at −1.0 V vs. RHE) in CO2-saturated KHCO3 electrolyte. This result indicates that the electron store and transfer behavior between the POM and MnL units could promote the reaction pathway of the CO2RR into CO, and inhibit the HER reaction pathway, thus enhancing the FE and selectivity for CO.
Fig. 3. (a) The LSV curves of SiW12–MnL/KB and MnL/KB in 0.5 M N2-(black curve) or CO2-(red curve) saturated KHCO3 electrolyte. (b) The FE of CO at different potentials for MnL/KB and SiW12–MnL/KB (the line is drawn only to guide the eye). (c) The LSV curves of PW12–MnL/KB and Pmo12–MnL/KB in 0.5 M N2-(black curve) or CO2-(red curve) saturated KHCO3 electrolyte. (d) The FE of CO at different potentials for PW12–MnL/KB and PMo12–MnL/KB (the line is drawn only to guide the eye). (e) The FE values of CO and H2 at the overpotential of the highest FE of CO for MnL/KB and POM–MnL/KB. (f) Nyquist plots of electrochemical impedance spectra (EIS) of MnL/KB and POM–MnL/KB in CO2-saturated 0.5 M KHCO3 aqueous solution.
To deeply understand the significant role of POMs, the electrochemical CO2RR performances of PW12–MnL/KB and PMo12–MnL/KB were also investigated. As depicted in Fig. 3c, both PW12–MnL/KB and PMo12–MnL/KB exhibit similar electron storage, electron transfer, CO2RR and HER electrochemical processes as SiW12–MnL/KB. However, since different POM species exhibit different redox activities, the PW12 and PMo12 polyoxoanions in POM–MnL have different electron transfer capacities, resulting in different FEs of H2 and CO. Definitvely, PW12–MnL/KB can specifically catalyze the reduction of CO2 into CO until the applied potential reaches −0.72 V vs. RHE, then the maximum CO FE of 80% is achieved. After −0.72 V vs. RHE, the CO2RR process is accompanied by the generation of H2 (Fig. 3d). This phenomenon is similar to that of SiW12–MnL/KB, implying that similar electron storage and transfer behaviors occur between PW12 and the MnL unit. As for PMo12–MnL/KB, the H2 generation and CO2RR processes occurred simultaneously (Fig. 3d), revealing that the PMo12 and MnL units work synchronously as HER and CO2RR active centers. Notably, when the applied potential reaches −0.52 V vs. RHE, the FE of H2 shows an apparent downwards trend while the FE of CO still increases. The maximum CO FE of 65% could be achieved at −0.64 V vs. RHE, accompanied by a 12% FE of the by-product H2. In the electrochemical process catalyzed by PMo12–MnL/KB, two reaction pathways (CO2RR and HER) occur simultaneously, and this is remarkably distinct to the processes of SiW12–MnL/KB and PW12–MnL/KB (Fig. 3e). This result is possibly due to the difficult electron transfer from the PMo12 unit to MnL, resulting in the electrons being stored on PMo12 for the competitive HER. Overall, the above results suggest that the combination of SiW12 and PW12 with the MnL species facilitates electron transfer from POM to the MnL center, and that this accelerates the generation of active Mn sites, promotes the CO2RR pathway, and inhibits the HER pathway, further ensuring the high efficiency and selectivity of the CO2RR. Meanwhile, due to the difficult electron transfer from PMo12 to the MnL center, the stored-electrons on the PMo12 unit in turn facilitate the evolution of H2, which is unfavorable to the CO2 process, leading to the low efficiency and selectivity of the CO2RR. Therefore, the reaction pathway, Faraday efficiency (FE) and selectivity of the electrocatalytic reaction could be regulated by modulating the electron transfer behavior between the POMs and MnL.
The geometric-corrected current density and partial current density for CO (jCO) of the POM–MnL composites were investigated (Fig. S21‡). As shown in Fig. S21,‡ the induction of POM significantly enhanced the current density and the jCO value of MnL. The jCO values of SiW12–MnL/KB at −0.72 V vs. RHE are almost more than twice those of MnL/KB. Moreover, we further measured the electrochemical real surface areas (ECSA) of POM–MnL/KB and MnL/KB. Fig. S22‡ shows that POM–MnL/KB and MnL/KB have similar double-layer capacitance values (9.25 mF cm−2 for SiW12–MnL/KB, 6.92 mF cm−2 for PW12–MnL/KB, 7.10 mF cm−2 for PMo12–MnL/KB, and 7.20 mF cm−2 for MnL/KB), suggesting that these catalysts possess considerable surface areas. Then, we normalized the current density and jCO at −0.72 V vs. RHE for the POM–MnL/KB and MnL/KB catalysts by the electrochemical active surface area (ECSA), to provide more convincing certification for the intrinsic activity and exclude the effect of surface area on the activity (Fig. S23‡). Fig. S23‡ demonstrates the ECSA-corrected current density and jCO at −0.72 V vs. RHE of the SiW12–MnL/KB catalysts, which show an almost 1.9 times increment compared to those of the MnL/KB catalyst, thus directly demonstrating the higher intrinsic CO2RR activity of POM–MnL without including the effects of the surface area. In addition, because the active center for the catalytic CO2 reduction is on the MnL component, the MnL surface concentration of POM–MnL/KB can be calculated by ICP and EDX results. The surface content of MnL was 1.36 mg cm−2 in MnL/KB, 0.61 mg cm−2 in SiW12–MnL/KB, 0.51 mg cm−2 in PW12–MnL/KB and 0.70 mg cm−2 in PMo12–MnL/KB, and the mass activities of POM–MnL/KB and MnL/KB were also evaluated by normalizing the current density and jCO at −0.72 V vs. RHE with the amount of active center MnL (Fig. S24‡). The SiW12 species boosted the mass activity of MnL by almost 5 times. Overall, the selectivity and activity of the POM–MnL catalysts in an aqueous electrolyte were quite enhanced after regulation of the electron transfer by POMs.
Moreover, the electron transfer process in the CO2RR reaction was also confirmed by electrochemical impedance spectroscopy (EIS). Fig. 3f presents the EIS spectra of MnL/KB, PW12–MnL/KB, SiW12–MnL/KB and PMo12–MnL/KB. The equivalent circuit model50 shown in Fig. S25‡ was selected to simulate the electrochemical impedance data and the simulated values of the equivalent circuit components are shown in Table S10.‡ Since the electrochemical impedance experiments were performed in the same electrolyte, and all of them used highly conductive KB, POM–MnL/KB and MnL/KB exhibited similar electrolyte resistance and electronic resistance. It was found that after introducing PW12 and SiW12 polyoxoanions into MnL, the mass transfer impedance values clearly decreased, and this may arise from the improvement of the electrocatalytic activity of MnL after the introduction of POMs. Compared to SiW12–MnL and PW12–MnL, the introduction of the PMo12 polyoxoanion induced two kinds of reaction pathways (the reduction of CO2 into CO and HER) during the CO2RR, endowing PMo12–MnL/KB with the smallest mass transfer impedance among these POM–MnL composites. Such results further suggest that the electron transfer behaviors between POMs and MnL could significantly affect the electrochemical reactions.51 These results further demonstrate the significant role (electron-transfer-modulator) of POM species in the enhancement of the CO2RR performance of MnL.
In addition, SiW12–MnL/KB exhibits satisfactory long-term stability for sustained CO2RR electrocatalysis. Its chronoamperometric (i–t) curve response at −0.72 V vs. RHE (η = 0.61) was continuously monitored for 12 h. The negligible activity decay was observed (Fig. S26‡). Furthermore, the IR spectrum and TEM images of SiW12–MnL/KB after the 12 h electrolysis further confirmed the good stability of SiW12–MnL/KB in terms of the negligible structural and morphological differences (Fig. S27 and S28‡).
3.3. Mechanism of POM–MnL catalyzed CO2 reduction
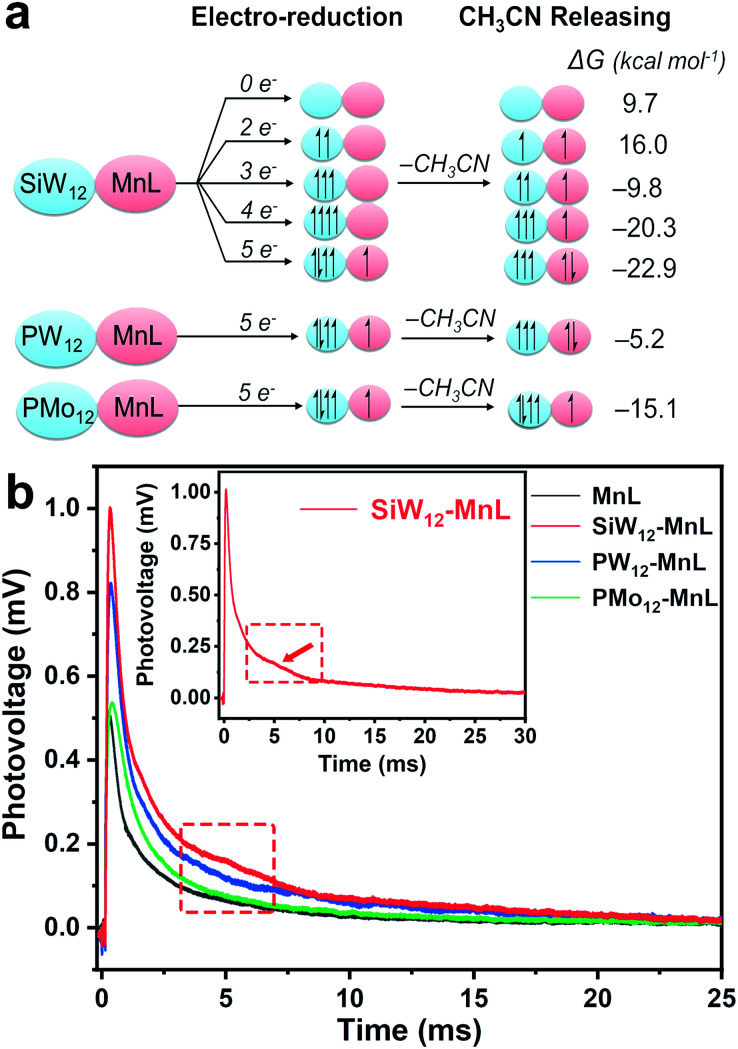
The aforementioned experimental results showed that the FE and selectivity of CO2 reduction could be controlled by the electron storage and transfer capacities of different POMs. However, the electron transfer behavior is usually quick and difficult to characterize during electrocatalysis, therefore DFT calculations were used to illustrate the possible electron transfer process of the POM–MnL catalyst in electrocatalysis. The 2e, 3e, 4e, and 5e electronic reduction processes for SiW12–MnL and the electronic configurations were simulated and are provided in Fig. 4a. This reveals that the SiW12 polyoxoanion could accept up to four electrons in the electrochemical process to achieve the highly reduced state SiW12–MnL. Once POM–MnL undergoes electrochemical reduction of three electrons and above (four or five electrons, Fig. 4a), CH3CN on the MnL unit could be released spontaneously, and one- or two-electron transfer from POM to MnL occurred. At this point, the MnL component begins to form the active species center ([Mn(bpy)(CO)3]+) of the CO2 reduction. Specifically, the SiW12 unit is the easiest to transfer two electrons to the MnL component to form 2e-reduced active centers (−22.9 kcal mol−1 for CH3CN releasing), whereas only one electron is transferred in the presence of PMo12 based on the 5e-reduction state, indicating that PMo12 is the most difficult to transfer electrons to MnL. Such results indicate that the POM species are easier to acquire electrons than MnL during the electrochemical reduction and deliver electrons to the MnL unit for further catalytic CO2RR, exerting a significant effect on the modulation of electron transfer (Scheme 1). To verify the computational results, solid-state fluorescence spectroscopy and transient photovoltage (TPV) measurements were carried out to explore the electron transfer behaviour in POM–MnL. As shown in Fig. S29,‡ a distinct fluorescence quenching was observed after introducing POMs into MnL, further confirming the existence of an electron transfer interaction between the POMs and MnL.52 Next, the transient photovoltage (TPV) technique was applied to investigate the electron transfer behavior of POMs in the composite electrocatalysts.
Fig. 4. (a) The electronic configurations for the different reduction degree states of SiW12–MnL, SiW12–MnL, PW12–MnL, and PMo12–MnL. (b) The transient photovoltage curves of powder POM–MnL and MnL.
Scheme 1. Schematic diagram of the reaction mechanism induced by POM–MnL.
As depicted in Fig. 4b, the POM–MnL composite catalysts exhibited longer photovoltage decay times than that of MnL. Such a prolonged photovoltage decay lifetime was caused by the electron transfer process from the electron-stored POMs to MnL, and this is consistent with the electrochemical CV and DFT calculation results. A broad shoulder peak (at 5 ms) appears in the photovoltage decay curve of POM–MnL, which is caused by the storage of electrons by POMs. Notably, different POM species in the POM–MnL composite catalysts also lead to different degrees of photovoltage decay lifetime prolongation, further indicating that these POMs have different electron-storage capacities and electron-transfer modulation capabilities. Therefore, SiW12–MnL displays the longest photovoltage decay lifetime, indicating the electron transfer between SiW12 and MnL unit is more favorable. Meanwhile, PMo12–MnL showed the shortest photovoltage decay lifetime, suggesting that the PMo12 unit is the least susceptible to electron transfer with MnL. The TPV curves of POM–MnL and MnL loaded on KB in the N2-saturated KHCO3 aqueous solution were also studied. As shown in Fig. S30‡, the behavior of the photovoltage decay of these catalysts in solution is similar to that of the solid samples, indicating that the electron-storage and electron-transfer modulation by POM also exist in the solution system. The above results indicate that the FE and selectivity of electrocatalytic CO2 reduction can be promoted when POMs facilitate electron transfer to MnL.
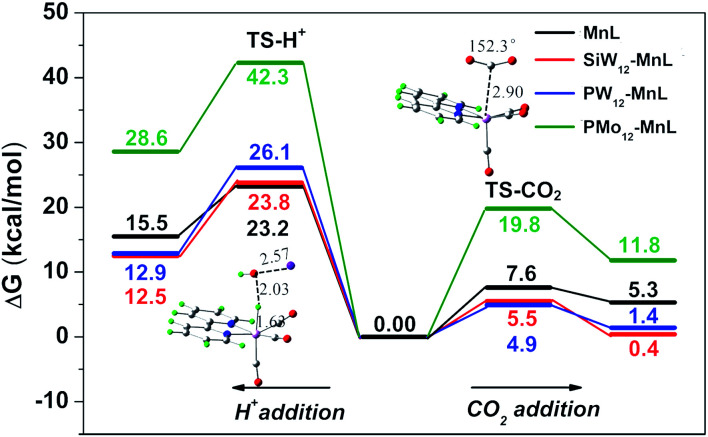
From the energy aspect, H+ binding and CO2 activation on the active MnL and SiW12–MnL catalysts, respectively, were also considered. As illustrated in Fig. 5, the energy barriers for protonation of SiW12–MnL and MnL were calculated to 18.3 and 16.6 kcal mol−1, which are higher than those for CO2 activation. It can be seen that the pure MnL itself represents a certain selectivity for CO2 reduction; the combination with the SiW12 polyoxoanion further increases the energy differences between proton affinity and CO2 activation. We have addressed two main contributions to the differences: the slightly increased protonation barrier (23.2 vs. 23.8 kcal mol−1) and the clearly decreased CO2 activation barrier (7.6 vs. 5.5 kcal mol−1). Consequently, less competition between CO2 reduction and H2 evolution is achieved computationally for the POM-involved system, and this coincides well with the experimental results. The catalytic selectivity is also dependent on the composition of the POMs. Similar trends have been obtained in the PW12–MnL case as in SiW12–MnL. However, the CO2 adduct is calculated to 1 kcal mol−1 less stable in PW12–MnL than in SiW12–MnL, which may slightly decrease its selectivity for CO2 reduction as shown in the experiments. Surprisingly, the addition of CO2 on PMo12–MnL, as well as the activated barrier, is much higher than the others, significantly limiting its activity. Therefore, the electron transfer from the POM unit to the MnL center may also affect the adsorption process of the reaction substrate in the MnL center, changing the FE and selectivity of the CO2RR.
Fig. 5. Potential energy surfaces for H+ and CO2 addition to the respective active CO2 and H adducts.
4. Conclusion
In summary, we fabricated a series of POM–MnL composite electrocatalysts and demonstrated an electron-transfer-modulation strategy for obtaining highly efficient electrocatalysts towards the CO2RR. Electrochemical, photoluminescence spectroscopy, transient photovoltage experiments and DFT calculations demonstrated that the electron transfer from POM to MnL could be used to prompt the electrocatalytic activity, FE and selectivity of CO2 reduction. Among them, SiW12–MnL exhibited excellent electron-transfer regulation behaviour, and superior CO2RR activity with particularly high selectivity, more than 95% FE at an overpotential of 0.61 V vs. RHE, and prominent stability of 12 h. This work reveals the role of POMs in optimizing the electron transfer pathway during electrocatalytic reactions, and provides a new perspective to designing highly efficient and selective catalysts for crucial electrocatalytic reactions.
Conflicts of interest
There are no conflicts to declare.
Supplementary Material
Acknowledgments
This work is supported by the National MCF Energy R&D Program (2018YFE0306105), Innovative Research Group Project of the National Natural Science Foundation of China (51821002), Natural Science Foundation of Jiangsu Province (BK20190041, BK20190828), Key-Area Research and Development Program of GuangDong Province (2019B010933001), the Collaborative Innovation Center of Suzhou Nano Science & Technology, the Priority Academic Program Development of Jiangsu Higher Education Institutions (PAPD), the 111 Project, National Natural Science Foundation of China (21771033, 21671036, 51422207, 51972216, 51725204, 21771132, 51572179, 51132006, 21901060, and 21901035), the Fundamental Research Funds for the Central Universities (2412018BJ001, 2412018ZD007 and 2412018QD005), the Scientific Development Project of Jilin Province (20190201206JC), the Foundation of Jilin Educational Committee (JJKH20190268KJ), the Specialized Research Fund for the Doctoral Program of Higher Education (20123201110018) and the Opening Project of Key Laboratory of Polyoxometalate Science of Ministry of Education. The computational work was carried out at the LvLiang Cloud Computing Center of China, and the calculations were performed on TianHe-2.
This article is dedicated to the memory of our most beloved supervisor Professor En-Bo Wang.
Electronic supplementary information (ESI) available: CCDC 1893118–1893120. For ESI and crystallographic data in CIF or other electronic format see DOI: 10.1039/c9sc05392a
References
- Burdyny T. Smith W. A. Energy Environ. Sci. 2019;12:1442. doi: 10.1039/C8EE03134G. [DOI] [Google Scholar]
- Liu S. Lu X. F. Xiao J. Wang X. Lou X. W. Angew. Chem., Int. Ed. 2019;58:13828. doi: 10.1002/anie.201907674. [DOI] [PubMed] [Google Scholar]
- Han N. Wang Y. Ma L. Wen J. Li J. Zheng H. Nie K. Wang X. Zhao F. Li Y. Fan J. Zhong J. Wu T. Miller D. J. Lu J. Lee S.-T. Li Y. Chem. 2017;3:652. [Google Scholar]
- Li C. Tong X. Yu P. Du W. Wu J. Rao H. Wang Z. M. J. Mater. Chem. A. 2019;7:16622. doi: 10.1039/C9TA03892B. [DOI] [Google Scholar]
- Voiry D. Shin H. S. Loh K. P. Chhowalla M. Nat. Rev. Chem. 2018;2:0105. doi: 10.1038/s41570-017-0105. [DOI] [Google Scholar]
- Liu S. Xiao J. Lu X. F. Wang J. Wang X. Lou X. W. Angew. Chem., Int. Ed. 2019;58:8499. doi: 10.1002/anie.201903613. [DOI] [PubMed] [Google Scholar]
- Hussain J. Jonsson H. Skulason E. ACS Catal. 2018;8:5240. doi: 10.1021/acscatal.7b03308. [DOI] [Google Scholar]
- Zhu D. D. Liu J. L. Qiao S. Z. Adv. Mater. 2016;28:3423. doi: 10.1002/adma.201504766. [DOI] [PubMed] [Google Scholar]
- Quan F. Zhan G. Shang H. Huang Y. Jia F. Zhang L. Ai Z. Green Chem. 2019;21:3256. doi: 10.1039/C9GC01099H. [DOI] [Google Scholar]
- Zheng X. Ji Y. Tang J. Wang J. Liu B. Steinrück H.-G. Lim K. Li Y. Toney M. F. Chan K. Cui Y. Nat. Catal. 2018;2:55. doi: 10.1038/s41929-018-0200-8. [DOI] [Google Scholar]
- Yan B. Bisbey R. P. Alabugin A. Surendranath Y. J. Am. Chem. Soc. 2019;141:11115. doi: 10.1021/jacs.9b03327. [DOI] [PubMed] [Google Scholar]
- Ma Y. Y. Lang Z. L. Yan L. K. Wang Y. H. Tan H. Q. Feng K. Xia Y. J. Zhong J. Liu Y. Kang Z. H. Li Y. G. Energy Environ. Sci. 2018;11:2114. doi: 10.1039/C8EE01129J. [DOI] [Google Scholar]
- Huang T. Rountree E. S. Traywick A. P. Bayoumi M. Dempsey J. L. J. Am. Chem. Soc. 2018;140:14655. doi: 10.1021/jacs.8b07102. [DOI] [PubMed] [Google Scholar]
- Guo S. Zhao S. Wu X. Li H. Zhou Y. Zhu C. Yang N. Jiang X. Gao J. Bai L. Liu Y. Lifshitz Y. Lee S. T. Kang Z. Nat. Commun. 2017;8:1828. doi: 10.1038/s41467-017-01893-7. [DOI] [PMC free article] [PubMed] [Google Scholar]
- Wang Y. R. Huang Q. He C. T. Chen Y. Liu J. Shen F. C. Lan Y. Q. Nat. Commun. 2018;9:4466. doi: 10.1038/s41467-018-06938-z. [DOI] [PMC free article] [PubMed] [Google Scholar]
- Dutta A. Kuzume A. Kaliginedi V. Rahaman M. Sinev I. Ahmadi M. Roldán Cuenya B. Vesztergom S. Broekmann P. Nano Energy. 2018;53:828. doi: 10.1016/j.nanoen.2018.09.033. [DOI] [Google Scholar]
- Rausch B. Symes M. D. Chisholm G. Cronin L. Science. 2014;345:1326. doi: 10.1126/science.1257443. [DOI] [PubMed] [Google Scholar]
- Liu R. Zhang G. Cao H. Zhang S. Xie Y. Haider A. Kortz U. Chen B. Dalal N. S. Zhao Y. Zhi L. Wu C.-X. Yan L.-K. Su Z. Keita B. Energy Environ. Sci. 2016;9:1012. doi: 10.1039/C5EE03503A. [DOI] [Google Scholar]
- Liu R. Cao K. Clark A. H. Lu P. Anjass M. Biskupek J. Kaiser U. Zhang G. Streb C. Chem. Sci. 2020;11:1043. doi: 10.1039/C9SC05469C. [DOI] [PMC free article] [PubMed] [Google Scholar]
- Folkman S. J. Soriano-Lopez J. Galan-Mascaros J. R. Finke R. G. J. Am. Chem. Soc. 2018;140:12040. doi: 10.1021/jacs.8b06303. [DOI] [PubMed] [Google Scholar]
- Wu H. B. Xia B. Y. Yu L. Yu X. Y. Lou X. W. Nat. Commun. 2015;6:6512. doi: 10.1038/ncomms7512. [DOI] [PMC free article] [PubMed] [Google Scholar]
- Han X. B. Li Y. G. Zhang Z. M. Tan H. Q. Lu Y. Wang E. B. J. Am. Chem. Soc. 2015;137:5486. doi: 10.1021/jacs.5b01329. [DOI] [PubMed] [Google Scholar]
- Ettedgui J. Diskin-Posner Y. Weiner L. Neumann R. J. Am. Chem. Soc. 2011;133:188. doi: 10.1021/ja1078199. [DOI] [PubMed] [Google Scholar]
- Khenkin A. M. Efremenko I. Weiner L. Martin J. M. L. Neumann R. Chem.–Eur. J. 2010;16:1356. doi: 10.1002/chem.200901673. [DOI] [PubMed] [Google Scholar]
- Lauinger S. M. Sumliner J. M. Yin Q. Xu Z. Liang G. Glass E. N. Lian T. Hill C. L. Chem. Mater. 2015;27:5886. doi: 10.1021/acs.chemmater.5b01248. [DOI] [Google Scholar]
- Sullivan K. P. Wieliczko M. Kim M. Yin Q. Collins-Wildman D. L. Mehta A. K. Bacsa J. Lu X. Geletii Y. V. Hill C. L. ACS Catal. 2018;8:11952. doi: 10.1021/acscatal.7b01030. [DOI] [Google Scholar]
- Zhang B. Guan W. Zhang S. Li B. Wu L. Chem. Commun. 2016;52:5308. doi: 10.1039/C5CC10033J. [DOI] [PubMed] [Google Scholar]
- MacDonald L. McGlynn J. C. Irvine N. Alshibane I. Bloor L. G. Rausch B. Hargreaves J. S. J. Cronin L. Sustainable Energy Fuels. 2017;1:1782. doi: 10.1039/C7SE00334J. [DOI] [Google Scholar]
- Neri G. Walsh J. J. Teobaldi G. Donaldson P. M. Cowan A. J. Nat. Catal. 2018;1:952. doi: 10.1038/s41929-018-0169-3. [DOI] [Google Scholar]
- Keith J. A. Grice K. A. Kubiak C. P. Carter E. A. J. Am. Chem. Soc. 2013;135:15823. doi: 10.1021/ja406456g. [DOI] [PubMed] [Google Scholar]
- Sung S. Kumar D. Gil-Sepulcre M. Nippe M. J. Am. Chem. Soc. 2017;139:13993. doi: 10.1021/jacs.7b07709. [DOI] [PubMed] [Google Scholar]
- Bourrez M. Molton F. Chardon-Noblat S. Deronzier A. Angew. Chem., Int. Ed. 2011;50:9903. doi: 10.1002/anie.201103616. [DOI] [PubMed] [Google Scholar]
- Sinopoli A. La Porte N. T. Martinez J. F. Wasielewski M. R. Sohail M. Coord. Chem. Rev. 2018;365:60. doi: 10.1016/j.ccr.2018.03.011. [DOI] [Google Scholar]
- Walsh J. J. Smith C. L. Neri G. Whitehead G. F. Robertson C. M. Cowan A. J. Faraday Discuss. 2015;183:147. doi: 10.1039/C5FD00071H. [DOI] [PubMed] [Google Scholar]
- Walsh J. J. Neri G. Smith C. L. Cowan A. J. Chem. Commun. 2014;50:12698. doi: 10.1039/C4CC06404F. [DOI] [PubMed] [Google Scholar]
- Zhang Q. Wang D. Wei X. Xie T. Li Z. Lin Y. Yang M. Thin Solid Films. 2005;491:242. doi: 10.1016/j.tsf.2005.06.017. [DOI] [Google Scholar]
- Li J. P. Chen W. L. Chen L. Zheng X. T. Zhu G. S. Wang E. B. Adv. Opt. Mater. 2018;6:1800225. doi: 10.1002/adom.201800225. [DOI] [Google Scholar]
- Brown I. D. Altermatt D. Acta Crystallogr., Sect. B: Struct. Sci. 1985;41:244. doi: 10.1107/S0108768185002063. [DOI] [Google Scholar]
- Zhao J. Wang J. Zhao J. Ma P. Wang J. Niu J. Dalton Trans. 2012;41:5832. doi: 10.1039/C2DT12130A. [DOI] [PubMed] [Google Scholar]
- Liu S. M. Zhang Z. Li X. H. Jia H. J. Ren M. W. Liu S. X. Adv. Mater. Interfaces. 2018;5:1801062. doi: 10.1002/admi.201801062. [DOI] [Google Scholar]
- Shi H. Yu Y. Zhang Y. Feng X. Zhao X. Tan H. Khan S. U. Li Y. Wang E. Appl. Catal., B. 2018;221:280. doi: 10.1016/j.apcatb.2017.09.027. [DOI] [Google Scholar]
- Friedl J. Holland-Cunz M. V. Cording F. Pfanschilling F. L. Wills C. McFarlane W. Schricker B. Fleck R. Wolfschmidt H. Stimming U. Energy Environ. Sci. 2018;11:3010. doi: 10.1039/C8EE00422F. [DOI] [Google Scholar]
- Xie J. Yang P. Wang Y. Qi T. Lei Y. Li C. M. J. Power Sources. 2018;401:213. doi: 10.1016/j.jpowsour.2018.08.090. [DOI] [Google Scholar]
- Xu B. Xu L. Gao G. Yang Y. Guo W. Liu S. Sun Z. Electrochim. Acta. 2009;54:2246. doi: 10.1016/j.electacta.2008.10.030. [DOI] [Google Scholar]
- Akter T. Hu K. Lian K. Electrochim. Acta. 2011;56:4966. doi: 10.1016/j.electacta.2011.03.127. [DOI] [Google Scholar]
- Fernandes D. M. Araújo M. P. Haider A. Mougharbel A. S. Fernandes A. J. S. Kortz U. Freire C. Chemelectrochem. 2018;5:273. doi: 10.1002/celc.201701210. [DOI] [Google Scholar]
- Grigoriev V. A. Hill C. L. Weinstock I. A. J. Am. Chem. Soc. 2000;122:3544. doi: 10.1021/ja993862c. [DOI] [PubMed] [Google Scholar]
- Jia J. Zhang Y. Zhang P. Ma P. Zhang D. Wang J. Niu J. RSC Adv. 2016;6:108335. doi: 10.1039/C6RA23547F. [DOI] [Google Scholar]
- Tang A. Wang X. Xu G. Zhou Z. Nie H. Mater. Lett. 2009;63:1439. doi: 10.1016/j.matlet.2009.03.035. [DOI] [Google Scholar]
- Yuan J. Zheng L. Hao C. RSC Adv. 2014;4:39435. doi: 10.1039/C4RA06250G. [DOI] [Google Scholar]
- Jang Y. J. Jang J. W. Lee J. Kim J. H. Kumagai H. Lee J. Minegishi T. Kubota J. Domen K. Lee J. S. Energy Environ. Sci. 2015;8:3597. doi: 10.1039/C5EE01445J. [DOI] [Google Scholar]
- Jin L. Fang Y. Hu P. Zhai Y. Wang E. Dong S. Chem. Commun. 2012;48:2101. doi: 10.1039/C2CC16523F. [DOI] [PubMed] [Google Scholar]
Associated Data
This section collects any data citations, data availability statements, or supplementary materials included in this article.


