

Abstract
In the current study, we investigated the protective role of citalopram against cognitive decline, impaired mitochondrial dynamics, defective mitochondrial biogenesis, defective autophagy, mitophagy and synaptic dysfunction in APP transgenic mouse model of Alzheimer’s disease (ad). We treated 12-month-old wild-type (WT) and age-matched transgenic APP mice with citalopram for 2 months. Using Morris Water Maze and rotarod tests, quantitative RT-PCR, immunoblotting, biochemical methods and transmission electron microscopy methods, we assessed cognitive behavior, RNA and protein levels of mitochondrial dynamics, biogenesis, autophagy, mitophagy, synaptic, ad-related and neurogenesis genes in wild-type and APP mice treated and untreated with citalopram. Citalopram-treated APP mice relative to citalopram-untreated APP mice exhibited improved cognitive behavior. Increased levels of mRNA associated with mitochondrial fission and ad-related genes; decreased levels of fusion, biogenesis, autophagy, mitophagy, synaptic and neurogenesis genes were found in APP mice relative to WT mice. However, APP mice treated with citalopram compared to citalopram-untreated APP mice revealed reduced levels of the mitochondrial fission and ad-related genes and increased fusion, biogenesis, autophagy, mitophagy, synaptic and neurogenesis genes. Our protein data agree with the mRNA levels. Transmission electron microscopy revealed significantly increased mitochondrial numbers and reduced mitochondrial length in APP mice; these were reversed in citalopram-treated APP mice. Further, Golgi-cox staining analysis revealed reduced dendritic spines in APP mice relative to WT mice. However, citalopram-treated APP mice showed significantly increased dendritic spines, indicating that citalopram enhances spine density, synaptic activity and improved cognitive function in APP mice. These findings suggest that citalopram reduces cognitive decline, Aβ levels and mitochondrial and synaptic toxicities and may have a strong protective role against mutant APP and Aβ-induced injuries in patients with depression, anxiety and ad.
Introduction
Alzheimer’s disease (ad) is a progressive mental illness characterized by memory loss and multiple cognitive impairments (1). According to the 2020 Alzheimer’s Disease Facts and Figures report, approximately 5.8 million Americans aged 65 and older are currently living with ad dementia and this number is estimated to increase to 7.1 million by the year 2025. In 2020, the direct costs to American society of caring for those with Alzheimer’s and other dementias is $305 billion, and the cost is expected to increase to more than $1 trillion as the population ages (2).
Diseases such as Alzheimer’s often begin to develop over 20 years earlier than clinical symptoms such as dementia are first seen (3). As the brain gradually changes with disease progression, noticeable symptoms such as memory loss, confusion and communication issues begin to appear (3,4). Patients exhibit typical signs of ad as they are unable to complete daily tasks without assistance such as tying their shoes, forgetting recent events, having difficulty in naming close family relatives, asking repeated questions, often getting lost and often misplacing common household items such as car keys (3).
ad occurs in two forms—early-onset familial and late-onset sporadic. Early-onset ad is an extremely uncommon form seen in 1–2% of total ad cases. Mutations in amyloid beta precursor protein (APP), presenilin 1 (PS1) and presenilin 2 (PS2) loci cause early-onset familial ad (5). Mutations in these genes induce the overproduction of amyloid beta (Aβ) 40 or 42 peptides, leading to early-onset familial ad (6). Late-onset sporadic ad is the more common form of the disease and presents mostly after the age of 65 and APOE4 genotype is a major contributor (4). Several risk factors are involved in late-onset ad, including traumatic brain injury, type 2 diabetes/obesity and other lifestyle factors such as unhealthy diet, lack of physical exercise, alcohol, smoking and exposure to environmental toxins (3,7). Furthermore, vascular diseases, depression, stroke and hypertension are other contributing factors (8).
Gender and depression are largely implicated in the development and progression of both early-onset familial and late-onset sporadic ad (9–13). In ad, the comorbidity of depression and impaired cognition due to brain metabolic dysfunction doubles in 5-year intervals after individuals reach 70 years of age and a huge increase in aged individuals is a major challenge for researchers and clinicians investigating depression in ad (2,13). For the last 20 years, our lab has been involved in gender-based depression comorbidity in models of non-human primates and mental health in humans, particularly focusing on women (11,14–16). Our long-term studies revealed increased levels of depression and low levels of neurotransmitter, serotonin, were found in ad, particularly in women. However, the molecular link between low levels of serotonin and mitochondrial abnormalities in ad neurons is not completely understood.
Serotonin (5HT) is a key neurotransmitter that plays an important role in synaptic functions of neurons affected by ad (17–19). Serotonin regulates sleep, appetite, mood, cognition and other peripheral physiology (20–24). Serotonin neurons projecting into the hypothalamus and hippocampus originate from different serotonergic nuclei in the raphe (25). Recent studies have shown that older adults feel satisfied with their lives, despite having more illnesses or physical problems (26). However, despite this satisfaction, depression is common. About one in six people in the USA are affected by depression at some point during their lives (27). Older adults who are depressed appear to feel tired, have trouble sleeping, or seem grumpy and irritable (28,29). Molecular basis of depression in older adults is not completely understood.
People with a lifelong history of major depression have been found to have increased deposits of Aβ in the brain, and people with ad, who had a history of major depression, were found to have even a greater number of Aβ plaques and neurofibrillary tangles (NFTs) in the hippocampal region than people with ad who had no such history of depression (30–33). Furthermore, in people without ad but who were considered to be at an increased risk of clinically relevant depressive symptoms, researchers found high levels of Aβ in their plasma, and those with the highest Aβ levels developed ad (34,35).
Increasing evidence suggests that mitochondrial abnormalities, including age-dependent somatic mitochondrial DNA changes (36–38), altered mitochondrial gene expressions (39,40), impaired mitochondrial dynamics (increased fission and reduced fusion) (41–49), altered mitochondrial morphology with increased number and reduced length (41,46,47,49–52), altered mitochondrial enzymatic activities, are largely involved in aging, diabetes, obesity, anxiety, depression and ad. Further, defective mitophagy and increased mitochondrial dysfunction are early cellular changes in ad (39–42,45–47,49,53–56). These changes are directly linked to low serotonin levels and synaptic damage in ad (49).
Several lines of evidence suggest that accumulation of mutant APP and C-terminal fragments of APP in the mitochondria triggers defective mitochondrial structure, function, biogenesis, mitophagy and defective axonal transport of mitochondria in ad cell lines, ad mouse models and human postmortem ad brains (43,44,47,49,52,53,57–59). However, increasing evidence suggests that selective serotonin reuptake inhibitor(s) treatments reduce cognitive decline and low serotonin-induced mitochondrial abnormalities in ad (60–65). However, precise molecular links between SSRIs and serotonin-induced mitochondrial abnormalities are not completely understood.
Our lab has been investigating molecular links between low serotonin levels and mitochondrial and synaptic damage, particularly in the midbrain and hippocampal regions of postmortem ad brains, mouse and cell models of ad. Another goal of our laboratory is to increase serotonin levels in ad neurons, ad mice and ad patients using SSRIs, such as citalopram (58,59).
In a recent cell culture study of mAPP-HT22 cells, we assessed the protective role of citalopram against impaired mitochondrial dynamics, defective mitochondrial biogenesis, defective mitophagy and synaptic dysfunction in immortalized mouse primary hippocampal cells (HT22) expressing mutant APP (SWI/IND) mutations (49). We found increased levels of mRNA associated with mitochondrial fission genes, and decreased levels of mitochondrial fusion, mitochondrial biogenesis, autophagy, mitophagy and synaptic genes in mAPP-HT22 cells relative to WT-HT22 cells. However, mAPP-HT22 cells treated with citalopram compared to the untreated mAPP-HT22 cells revealed reduced levels of the mitochondrial fission genes, and increased levels of mitochondrial fusion, mitochondrial biogenesis, autophagy, mitophagy and synaptic genes (49). Transmission electron microscopy revealed significantly increased mitochondrial numbers and reduced mitochondrial length in mAPP-HT22 cells and these effects were reversed in citalopram-treated mAPP-HT22 cells. Cell survival rates were increased in citalopram-treated mAPP-HT22 relative to the citalopram-untreated mAPP-HT22. Further, mAPP and C-terminal fragments were also reduced upon citalopram treatment in the mAPP-HT22 cells (49). These findings suggest that citalopram reduces Aβ levels and mitochondrial toxicities and it may have a protective role against mutant APP and Aβ-induced injuries in patients with depression, anxiety and ad.
In the current study, using APP transgenic mouse model, we sought to determine the protective actions of antidepressant citalopram against mutant APP and Aβ induced (1) cognitive decline, (2) impaired mitochondrial dynamics, (3) defective biogenesis, (4) defective autophagy, (5) defective mitophagy, (6) synaptic damage, (7) Aβ levels, (8) altered dendritic spines and (9) defective mitochondrial morphology in citalopram untreated and treated APP mice.
Results
Cognitive behavior
Rotarod test
In 12-month-old citalopram-untreated or -treated WT and APP mice, we tested motor learning and coordination in order to assess whether citalopram enhances motor coordination and motor skill acquisition, using rotarod.
On accelerating rotarod test, we found WT mice stayed significantly a longer period of time that APP mice (P = 0.002), indicating that APP mice had motor coordination defects (Fig. 1A). We also found that citalopram-treated APP mice stayed a longer period of time on rotarod relative to citalopram-untreated APP mice (P = 0.0001) (Fig. 1A), suggesting that citalopram has reduced motor coordination defects in APP mice.
Figure 1 .

Cognitive behavior of 12-month-old APP and WT mice untreated and treated with 20 mg/kg body weight citalopram. (A) On accelerating rotarod test, we found WT mice stayed significantly a longer period of time that APP mice (P = 0.002), indicating that APP mice had motor coordination defects. We also found that citalopram-treated APP mice stayed a longer period of time on rotarod relative to citalopram-untreated APP mice (P = 0.0001). (B) Morris Water Maze test to evaluate the hippocampal-dependent learning and memory in citalopram-untreated and -treated 12-month-old WT and APP mice. APP mice showed increased escape latency to find the platform compared to WT mice (P = 0.04). Interestingly, citalopram-treated APP mice (20 mg/kg body weight) showed a decrease in escape latency for finding the platform compared to citalopram-untreated APP mice (P = 0.049), indicating that citalopram enhances hippocampal-dependent learning and memory functions. However, citalopram-treated WT mice did not show significantly decreased escape latency to find a platform.
Morris water maze test—Latency to found the platform
We conducted a Morris Water Maze test (MWM) to evaluate the hippocampal-dependent learning and memory in citalopram-untreated and -treated 12-month-old WT and APP mice. APP mice showed increased escape latency to find the platform compared to WT mice (P = 0.04) (Fig. 1B). Interestingly, citalopram-treated APP mice (20 mg/kg body weight) showed a decrease in escape latency for finding the platform compared to citalopram-untreated APP mice (P = 0.049), indicating that citalopram enhances hippocampal-dependent learning and memory functions (Fig. 1B). However, citalopram-treated WT mice did not show significantly decreased escape latency to find a platform (Fig. 1B).
Citalopram reduces the levels of Aβ42
We assessed Aβ 40 and 42 levels using sandwich ELISA assay in citalopram-untreated and -treated 12-month-old WT and APP mice. As shown in Figure 2, APP mice treated with citalopram showed significantly reduced levels of Aβ42 (P = 0.04) relative to citalopram-untreated APP mice. We did not find any change in Aβ40 levels in the citalopram-treated APP mice relative to the citalopram-untreated APP mice. These observations suggest that citalopram affects APP processing and reduces Aβ levels.
Figure 2 .
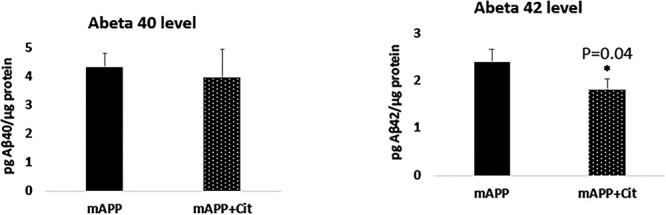
Aβ levels of protein lysates obtained from post-mortem brains of 12-month-old APP-untreated and -treated mice with 20 mg/kg/body weight citalopram. (A) Aβ-40 did not change much between the untreated and treated animals. On the contrary a significant reduction in the Aβ42 levels was seen upon citalopram treatment (P = 0.04).
mRNA levels of mitochondrial dynamics, biogenesis, autophagy, mitophagy, synaptic, serotonin-related, ad-related and neurogenesis genes
To determine the protective effects of citalopram against age- and mutant APP/Amyloid beta-induced mitochondrial and synaptic toxicities, we isolated total RNA from all four groups of mice—1. WT mice, 2. WT mice + citalopram treated, 3. APP mice and 4. APP mice + citalopram treated. mRNA levels of mitochondrial dynamics genes (fission Drp1 & Fis1 and fusion Mfn1, Mfn2 and Opa1), mitochondrial biogenesis genes (PGC1α, NRF1, NRF2 and TFAM), autophagy (LC3A, LC3B, ATG5, Beclin1), mitophagy (PINK1, TERT, BCL2 and BNIP3L), synaptic genes (PSD95 and synaptophysin), serotonin-related genes (SERT1, TPH2, 5HTR1A, 5HTR1B, 5HTR1F, 5HTR4 and 5HTR6), ad-related genes (MAPT, APP, BACE1 and ADAM10) and neurogenesis genes (BDNF, DCX, NeuN1 and CLBN) in WT and APP mice, untreated or treated with citalopram, were measured by using Sybr-Green chemistry-based quantitative real time RT-PCR.
Mitochondrial dynamics genes
As shown in Table 1, in APP mice, mRNA levels of mitochondrial fission genes were significantly increased (Drp1 by 4.0-fold, P = 0.005 and Fis1 by 6.5-fold, P = 0.05) compared to the WT mice. In contrast, mRNA expression levels of mitochondrial fusion genes were significantly decreased (Mfn1 by 6.3-fold, P = 0.05, Mfn2 by 5.1-fold, P = 0.05 and Opa1 by 4.3, P = 0.05) in APP mice relative to WT mice. This indicates the presence of abnormal mitochondrial dynamics in APP mice. However, citalopram-treated APP mice showed reduced Drp1 (7.0-fold decrease, P = 0.005) and Fis1 (7.1-fold, P = 0.005) and fusion genes were increased in citalopram-treated APP mice relative to the citalopram-untreated APP mice (Table 1). These observations indicate that citalopram reduced fission activity and enhanced fusion machinery in APP mice.
Table 1.
mRNA Fold changes of mitochondrial structural, synaptic, biogenesis, autophagy, mitophagy and neurogenesis genes in APP and WT mice. Data were compared between APP and Wild type mice, and also citalopram treated APP mice with citalopram untreated APP mice
| Biological pathways | Genes | mRNA fold change APP/WT | mRNA fold change APPCIT/APP |
|---|---|---|---|
| Mitochondrial structure | Drp1 | 4.0 | −7.0 |
| Fis1 | 6.5 | −7.1 | |
| Mfn1 | −6.3 | 3.7 | |
| Mfn2 | −5.1 | 2.1 | |
| Opa1 | −4.3 | 5.1 | |
| Biogenesis | NRF1 | −5.1 | 4.6 |
| NRF2 | −3.1 | 2.9 | |
| TFAM | −4.9 | 2.6 | |
| PGC1α | −5.5 | 3.4 | |
| Autophagy and Mitophagy | LC3A | −5.2 | 2.9 |
| LC3B | −3.1 | 4.1 | |
| ATG5 | −3.1 | 3.9 | |
| PINK1 | −3.7 | 3.2 | |
| TERT | −4.6 | 2.4 | |
| BCL1 | −4.1 | 3.4 | |
| BNIP3L | −3.1 | 1.7 | |
| Beclin1 | −2.8 | 3.7 | |
| Synaptic | Synaptophysin | −4.5 | 2.7 |
| PSD95 | −2.9 | 3.6 | |
| Serotonin Pathways | SERT | −8.1 | 3.0 |
| TPH2 | −3.1 | 6.6 | |
| 5HTR1A | −9.1 | 3.4 | |
| 5HTR1B | −3.3 | 2.8 | |
| 5HTR1F | −2.3 | 3.1 | |
| 5HTR4 | −4.0 | 2.5 | |
| 5HTR6 | 5.4 | −4.3 | |
| AD Pathology | MAPT | −4.4 | 2.9 |
| APP | 1.8 | −3.4 | |
| BACE1 | 4.8 | −2.3 | |
| ADAM10 | −5.1 | 4.3 | |
| Neurogenesis | BDNF | −3.1 | 2.4 |
| DCX | −3.9 | 5.2 | |
| NeuN1 | −2.1 | 1.8 | |
| CLBN | −3.3 | 2.8 |
Mitochondrial biogenesis genes
mRNA levels of mitochondrial biogenesis genes were significantly reduced (PGC1α by 5.5-fold, P = 0.005; NRF1 by 5.1-fold, P = 0.05; NRF2 by 3.1-fold, P = 0.05, and TFAM by 4.9, P = 0.005) in APP mice relative to WT mice (Table 1). However, in citalopram-treated APP mice, mRNA levels of mitochondrial biogenesis were increased (PGC1α by 3.4-fold, P = 0.005; NRF1 by 4.6-fold, P = 0.05; NRF2 by 2.9-fold and TFAM by 2.6, P = 0.005). These observations strongly suggest that citalopram increases mitochondrial biogenesis activity in the presence of mutant APP and amyloid beta in APP mice.
Autophagy genes
In APP mice relative to WT mice, mRNA levels of autophagy genes were significantly reduced (LC3A by 5.2-fold, P = 0.05; LC3B by 3.1-fold, P = 0.05; ATG5 by 3.1-fold, P = 0.05 and Beclin1 by 3.7-fold, P = 0.05) (Table 1). On the contrary, in citalopram-treated APP mice relative to citalopram-untreated APP mice, mRNA levels of autophagy genes were increased (LC3A by 2.9-fold, P = 0.05; LC3B by 4.1-fold, P = 0.05; ATG5 by 3.9-fold, P = 0.05 and Beclin1 by 3.2-fold, P = 0.005) (Table 1). These observations suggest that citalopram increases autophagy activity in APP mice.
Mitophagy genes
As shown in Table 1 in APP mice, mRNA levels of mitophagy genes were significantly reduced (PINK1 by 4.6-fold, P = 0.005; TERT by 4.1-fold, P = 0.005, BCL2 by 3.1-fold, P = 0.05 and BNIP3L 2.8-fold, P = 0.05) relative to WT mice, indicating that mutant APP and Aβ reduces mitophagy activities. However, citalopram-treated APP mice showed opposite effects, that is mitophagy genes were increased in citalopram-treated APP mice (PINK1 by 2.4-fold; TERT 3.4-fold, P = 0.005, BCL2 by 1.7-fold, P = 0.05 and BNIP3L 3.7-fold, P = 0.0.5) relative to citalopram-untreated APP mice (Table 1). These observations indicate that citalopram enhanced mitophagy activity in APP mice.
Synaptic genes
As shown in Table 1, mRNA levels of synaptic genes were significantly reduced (synaptophysin by 4.5-fold, P = 0.05 and PSD95 by 2.9-fold, P = 0.05) in APP mice relative to WT mice. However, in citalopram-treated APP mice relative to citalopram-untreated APP mice, mRNA levels of synaptic genes were increased (synaptophysin by 2.7-fold, P = 0.005 and PSD95 by 3.6-fold, P = 0.05). These observations indicate that citalopram increases synaptic activity in APP mice.
Serotonin-related genes
mRNA levels of serotonin-related genes were significantly reduced (SERT1 by 8.1-fold, P = 0.05; TPH2 by 3.1-fold, P = 0.005; 5HTR1A by 9.1-fold, P = 0.05; 5HTR1B by 3.3-fold; 5HTR4 by 4.0-fold, P = 0.05) in APP mice relative to WT mice (Table 1). On the contrary, in citalopram-treated APP mice relative to citalopram-untreated APP mice, mRNA levels of serotonin-related genes were significantly increased (SERT by 3.0-fold, P = 0.005; TPH2 by 6.6-fold, P = 0.05; 5HTR1A by 3.4-fold, P = 0.05; 5HTR1B by 2.8-fold; 5HTR4 by 2.5-fold, P = 0.05). mRNA levels of 5HTR6 were increased in APP mice relative to WT mice, however in citalopram-treated APP mice relative to citalopram-untreated APP mice, mRNA levels of 5HTR6 were reduced. Overall, these observations suggest that citalopram enhances serotonin levels in disease state.
ad-related genes
As shown in Table 1, ad-related genes were upregulated (MAPT by 4.4-fold, P = 0.05; APP by 1.8-fold; BACE1 by 4.8-fold) in APP mice relative to WT mice (Table 1). However, mRNA levels were significantly reduced (MAPT by 2.9-fold, P = 0.05; APP by 3.4-fold, P = 0.05; BACE1 by 2.3-fold, P = 0.05) in APP mice treated with citalopram relative to citalopram-untreated APP mice. These observations indicate that citalopram reduces the toxicities of ad-related genes.
As expected, ADAM10 that represents α-secretase was reduced in APP mice (ADAM10 by 5.1-fold, P = 0.05) relative to WT mice and was significantly increased in citalopram-treated APP mice (ADAM10 by 4.3-fold, P = 0.05) relative to APP mice.
Neurogenesis genes
As shown Table 1, neurogenesis genes were downregulated (BDNF by 3.1-fold, P = 0.05; DCX by 3.9-fold; NeuN1 by 2.1-fold and CLBN by 3.3-fold) in APP mice relative to WT mice. However, mRNA levels were significantly increased (BDNF by 2.4-fold, P = 0.05; DCX by 5.2-fold; NeuN1 by 1.8-fold and CLBN by 2.8-fold) in APP mice treated with citalopram relative to citalopram-untreated APP mice. These observations indicate that citalopram enhances neurogenesis in APP mice.
Immunoblotting analysis
To understand the protective effects of citalopram in APP and WT mice at protein level, immunoblotting analysis of mitochondrial dynamics, mitochondrial biogenesis, autophagy, mitophagy and synaptic proteins was performed. Protein lysates from cortical tissues of transgenic APP and non-transgenic WT mice were used.
Mitochondrial dynamics proteins
As shown in Figure 3A and 3B levels of fission proteins Drp1 and Fis1 were found to be significantly increased in the APP mice compared to the WT mice (P = 0.02 and P = 0.005, respectively). After citalopram treatment, Drp1 (P = 0.02) and Fis1 (P = 0.007) levels were reduced significantly in the APP mice. On the contrary, mitochondrial fusion proteins were significantly decreased (Fig. 3A and 3C) in the transgenic APP mice (Mfn1, P = 0.02; Mfn2, P = 0.02; and Opa1, P = 0.01. However, citalopram reversed this effect, as it significantly increased Mfn1 (P = 0.03), Mfn2 (P = 0.02) and Opa1 (P = 0.01) levels in APP mice.
Figure 3 .
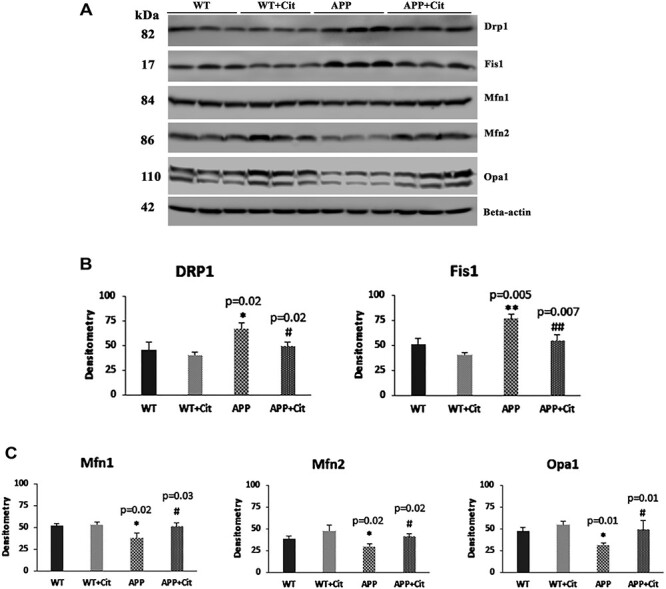
Immunoblotting analysis of mitochondrial dynamics proteins in protein lysates obtained from post-mortem brains of 12-month-old WT and APP mice untreated and treated with citalopram (for each of the 4 groups, n = 3). (A) Representative immunoblots for untreated and treated WT and APP mice. (B) Quantitative densitometry analysis for mitochondrial fission proteins Drp1 and Fis1, which were significantly increased in the APP mice compared to the WT (Drp1 P = 0.02; Fis1 P = 0.005), but the Drp1 and Fis1 levels in the APP mice significantly reduced after citalopram treatment (Drp1 P = 0.02; Fis1 P = 0.007). (C) Quantitative densitometry analysis for mitochondrial fusion proteins Mfn1, Mfn2 and Opa1, which were significantly reduced in the APP mice compared to the WT (Mfn1 P = 0.02; Mfn2 P = 0.02; Opa1 P = 0.01), but the Mfn1, Mfn2 and Opa1 levels in the APP mice significantly increased after citalopram treatment (Mfn1 P = 0.03; Mfn2 P = 0.02; Opa1 P = 0.01).
Mitochondrial biogenesis proteins
Reduced mitochondrial biogenesis which is a typical feature of ad was seen in the APP mice. As shown in Figure 4A and 4B, PGC1α (P = 0.04), NRF1 (P = 0.02) and NRF2 (P = 0.005) were significantly reduced in the APP mice compared to the WT mice. Citalopram treatment enhanced the biogenesis proteins in the APP mice (PGC1α, P = 0.01; NRF1, P = 0.007; NRF2, P = 0.04; and TFAM, P = 0.03), as well as in wild type mice (NRF1, P = 0.02; and TFAM, P = 0.04).
Figure 4 .
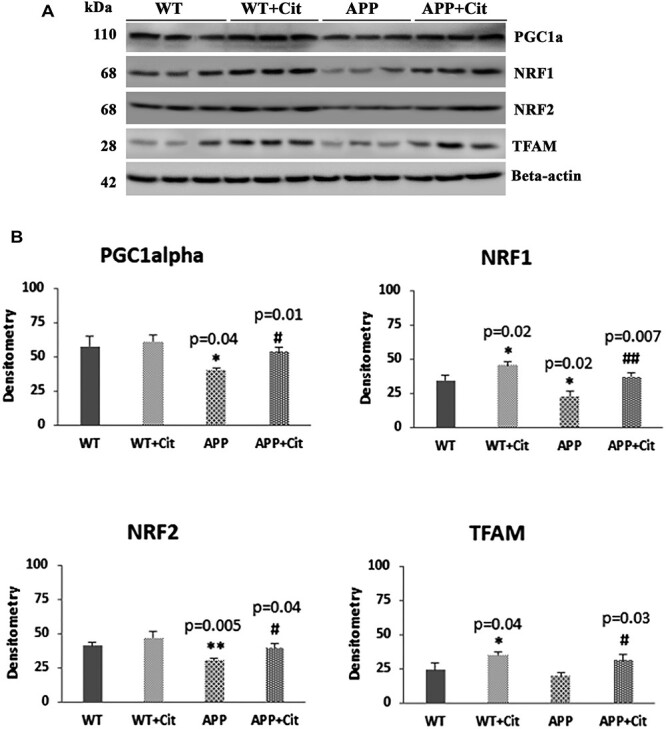
Immunoblotting analysis of mitochondrial biogenesis proteins in protein lysates obtained from the brains of 12-month-old WT and APP mice untreated and treated with citalopram (for each of the 4 groups, n = 3). (A) Representative immunoblots for untreated and treated WT and APP mice. (B) Quantitative densitometry analysis of mitochondrial biogenesis proteins PGC1α, NRF1, NRF2 and TFAM. PGC1α, NRF1 and NRF2 were significantly reduced in the APP mice compared to the WT mice (PGC1α P = 0.04; NRF1 P = 0.02; NRF2 P = 0.005). Upon citalopram treatment the APP mice showed significant increase in the PGC1α, NRF1, NRF2 and TFAM levels compared to untreated APP (PGC1α P = 0.01; NRF1 P = 0.007; NRF2 P = 0.04; TFAM P = 0.03). Also, NRF1 and TFAM showed significant increase in the WT treated group compared to the WT untreated (NRF1 P = 0.02; TFAM P = 0.04).
Autophagy and mitophagy proteins
As shown in Figure 5A and 5B, autophagy and mitophagy proteins were reduced in the APP mice (PINK1, P = 0.02; ATG5, P = 0.04; ATG7, P = 0.009; p62, P = 0.001; LC3BI, P = 0.001; LC3BII, P = 0.005 and TERT, P = 0.01) relative to the WT mice. However, in citalopram-treated APP mice, autophagy and mitophagy proteins were significantly increased, PINK1 (P = 0.02), ATG5 (P = 0.01), ATG7 (P = 0.01), p62 (P = 0.004), LC3BI (P = 0.001), LC3BII (P = 0.004) and TERT (P = 0.01).
Figure 5 .
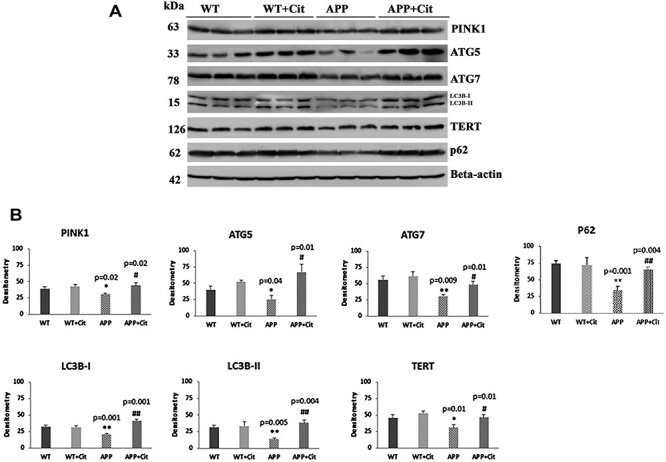
Immunoblotting analysis of mitophagy and autophagy proteins in protein lysates obtained from brains of 12-month-old WT and APP mice untreated and treated with citalopram (for each of the four groups, n = 3). (A) Representative immunoblots for untreated and treated WT and APP mice. (B) Quantitative densitometry analysis for mitophagy and autophagy proteins PINK1, ATG5, ATG7, TERT, LC3B-I, LC3B-II and p62 showed they were significantly reduced in the APP mice compared to the WT (PINK1 P = 0.02; ATG5 P = 0.04; ATG7 P = 0.009; p62 P = 0.01; LC3B-I P = 0.001, LC3B-II P = 0.005; TERT P = 0.01). Upon citalopram treatment the APP mice showed significant increase in all of these compared to the untreated APP mice (PINK1 P = 0.02; ATG5 P = 0.01; ATG7 P = 0.01; p62 P = 0.004; LC3B-I P =P = 0.001, LC3B-II P = 0.004; TERT P = 0.01).
Synaptic proteins
It is well documented that levels of synaptic proteins are lowered in ad individuals. Consistent with this, we found reduced levels of synaptic proteins synaptophysin (P = 0.02), PSD95 (P = 0.002) as well as dendritic protein MAP2 (P = 0.02) (Fig. 6A and 6B) in APP mice relative to WT mice. Citalopram-treated APP mice showed increased synaptic proteins, synaptophysin (P = 0.02), PSD95 (P = 0.04) and MAP2 (P = 0.03) relative to citalopram-untreated APP mice. In citalopram-treated WT mice, PSD95 (P = 0.04) levels were significantly increased relative to citalopram-untreated WT mice. These observations suggest that citalopram enhances synaptic activity in both APP and WT mice.
Figure 6 .
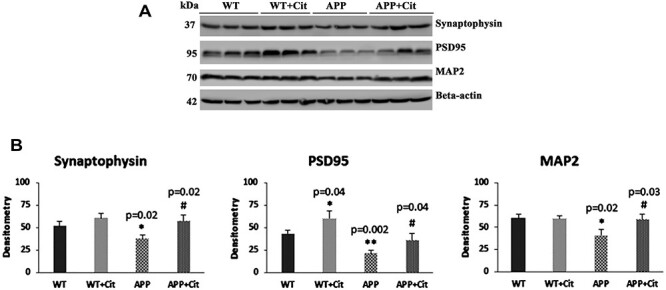
Immunoblotting analysis of synaptic proteins and dendritic protein MAP2 in protein lysates obtained from the brains of 12-month-old WT mice and APP mice untreated and treated with citalopram (for each of the four groups, n = 3). (A) Representative immunoblots for untreated and treated WT mice and APP mice. (B) Quantitative densitometry analysis of synaptophysin, PSD95 and MAP2 which show significant reduction in the APP mice compared to the WT mice (Synaptophysin P = 0.02; PSD95 P = 0.002; MAP2 P = 0.02). Upon citalopram treatment the APP mice showed significant increase in all of these compared to the untreated APP mice (Synaptophysin P = 0.02; PSD95 P = 0.04; MAP2 P = 0.03). PSD95 also showed a significant increase in the WT mice treated group with citalopram compared to the WT mice untreated (PSD95 P = 0.002).
Immunofluorescence analysis
Using immunofluorescence analysis, we assessed the levels of mitochondrial dynamics proteins—Drp1 and Fis1, mitochondrial biogenesis proteins—PGC1α and TFAM, mitophagy protein—PINK1, synaptic proteins—synaptophysin and PSD95 and serotonin-associated proteins—TPH2 and serotonin transporter (SERT). Hippocampal sections from 12-month-old transgenic APP mice and age-matched non-transgenic WT mice, untreated and treated with 20 mg/kg/body weight citalopram, were stained for florescence analysis.
Mitochondrial dynamics proteins
As shown in Figure 7A the immunoreactivity of Drp1 was increased in the APP mice and citalopram treatment significantly brought down this in the APP mice (P = 0.0418). Decreased levels of Drp1 immunoreactivity were noted in the WT mice too but the change was not significant. Consistent with the immunoblot findings, the immunoreactivity levels of Fis1 were significantly increased in the APP mice (P = 0.0229) and citalopram treatment significantly reduced immunoreactivity of the Fis1 (P = 0.0229) as can be seen in Figure 7B. In WT mice the change was not significant.
Figure 7 .
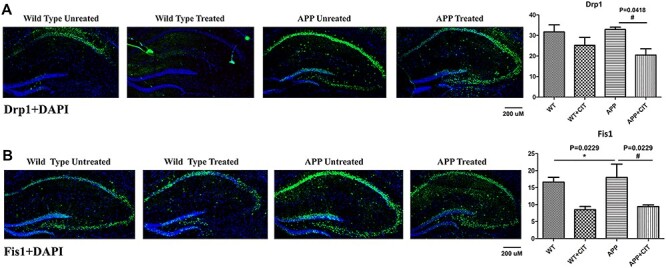
Immunofluorescence analysis of hippocampal mitochondrial fission and mitochondrial biogenesis proteins in 12-month-old WT and APP mice, untreated and treated with citalopram. (A) Immunofluorescense staining and quantitative immunofluorescence analysis of WT and APP mice untreated and treated with citalopram for Drp1. Citalopram significantly reduced the elevated Drp1 levels in the APP mice (P = 0.0418). (B) Immunofluorescense staining and quantitative immunofluorescence analysis of WT and APP mice untreated and treated with citalopram for Fis1. Fis1 levels were significantly elevated (P = 0.0229) in the APP mice but they were significantly reduced upon citalopram treatment (P = 0.0229).
Mitochondrial biogenesis proteins
Figure 8A indicates significantly reduced PGC1α levels in APP mice compared to WT (P = 0.0025). Citalopram plays a protective role by significantly increasing the immunreactivity of PGC1α as it is the master player of mitochondrial biogenesis (P = 0.0029). TFAM which is another important mitochondrial biogenesis protein was significantly reduced in the trangenic APP mice compared to the WT (Fig. 8B) (P = 0.0192). Citalopram treatment increased the TFAM levels in APP mice but the change was insignificant.
Figure 8 .
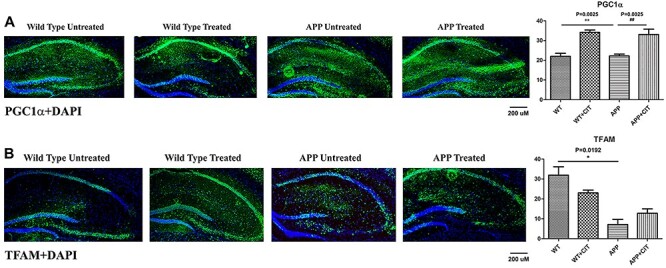
Immunofluorescence analysis of hippocampal mitochondrial biogenesis proteins in 12-month-old WT and APP mice, untreated and treated with citalopram. (A) Immunofluorescense staining and quantitative immunofluorescence analysis of WT and APP mice untreated and treated with citalopram for PGC1α. PGC1α levels were significantly reduced in the APP mice compared to the WT ones (P = 0.0025), but citalopram treatment significantly increased PGC1α (P = 0.0029). (B) Immunofluorescense staining and quantitative immunofluorescence analysis of WT and APP mice untreated and treated with citalopram for TFAM. TFAM was significantly reduced in the APP mice compared to the WT mice (P = 0.0192).
Mitophagy and synaptic proteins
Figure 9A indicates significantly reduced levels of mitophagy protein PINK1 in the APP mice compared to the WT ones (P = 0.0356). Citalopram treatment reverted this effect by very significantly increasing the PINK1 levels (P = 0.0064). Citalopram increased PINK1 levels in wild-type mouse hippocampi as well, although insignificantly. Synaptophysin immunoreactivity was very significantly reduced in the APP mice when compared to its WT counterparts as shown in Figure 9B (P = 0.0001). Citalopram treatment increased synaptophysin immunoreactivity in both WT and APP mice. But the change was significant only in the WT mice (P = 0.0017) and not in the APP mice. PSD95 immunoreactivity levels were reduced in the APP mice compared to the wild-type (Fig. 9C). But consistent with immunoblotting analysis, PSD95 immunoreactivity levels were significantly unregulated in both APP and WT genotypes (P = 0.0098 and P = 0.0018), indicating citalopram’s neuroprotective action.
Figure 9 .
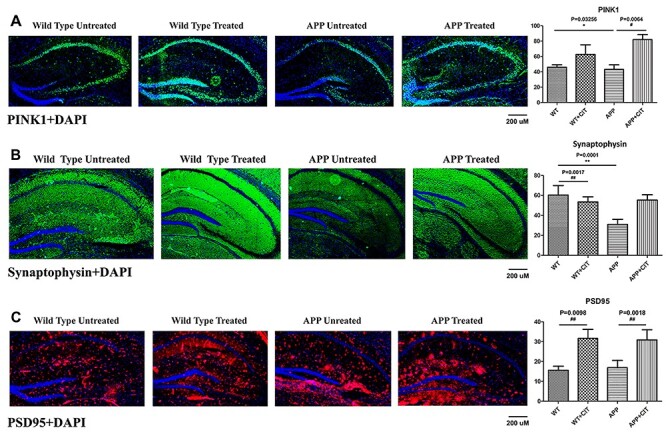
Immunofluorescence analysis of hippocampal mitophagy protein PINK1 and synaptic proteins synaptophysin and PSD95 in 12-month-old WT and APP mice, either untreated or treated with citalopram. (A) Immunofluorescense staining and quantitative immunofluorescence analysis of WT and APP mice untreated and treated with citalopram for PINK1. PINK1 levels were significantly reduced (P = 0.0356) in the APP mice but these levels were significantly upregulated upon citalopram treatment (P = 0.0064). (B) Immunofluorescense staining and quantitative immunofluorescence analysis of WT and APP mice untreated and treated with citalopram for synaptophysin. Synaptophysin was very significantly reduced (P = 0.0001) in the APP mice compared to WT. Citalopram increased synaptophysin levels significantly in WT mice (P = 0.0017). (C) Immunofluorescense staining and quantitative immunofluorescence analysis of WT and APP mice untreated and treated with citalopram for PSD95. PSD95 levels increased significantly upon citalopram treatment in both WT (P = 0.0098) and APP (P = 0.0018) mice.
Serotonin and APP
It is known that APP mice exhibit elevated APP levels in their brain, particularly in the hippocampus. Therefore as expected, we observed the transgenic APP mice show very significantly high levels of APP in the hippocampal area (P = 0.0002) (Fig. 10A). Citalopram treatment managed to significantly reduce the amyloid levels (P = 0.0302) proving its therapeutic potential in ad. Figure 10B indicates treatment with SSRI citalopram very significantly increases the TPH2 levels in both mouse genotypes. The change was more significant in the WT-treated group (P = 0.0002) compared to the APP-treated group (P = 0.0465). We also observed TPH2 immunoreactivity levels were significantly reduced in the APP mice compare to the WT mice (P = 0.009). Reduced TPH2 in APP mice indicates reduced serotonin production as TPH2 is the chief serotonin synthesizing enzyme and upregulation should upregulate serotonin synthesis as well. Citalopram increased TPH2 levels in both WT as well as APP mice (P = 0.0002 and P = 0.0465), thus indicating SSRI treatment may be therapeutic in ad. Another important player in the serotonin pathway is the serotonin transporter SERT. Figure 10C indicates reduced SERT levels in the APP mice (P = 0.0027) compared to WT mice. Citalopram increased the immunoreactivity of SERT levels in WT mice (P = 0.0506), but the upregulation was not significant in the APP group.
Figure 10 .
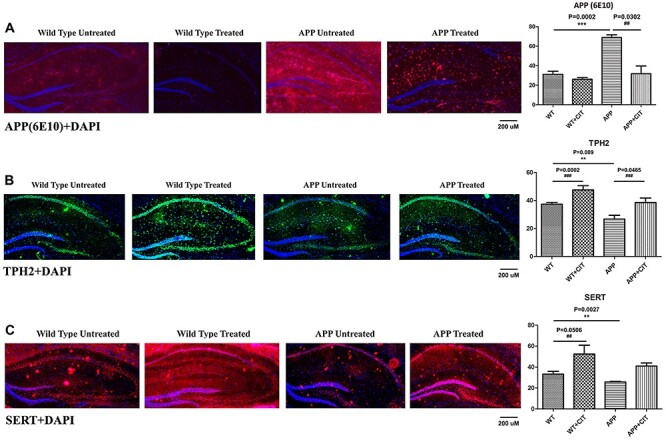
Immunofluorescence analysis of hippocampal APP (6E10) and serotonin-related proteins TPH2 and SERT in 12-month-old WT and APP mice, either untreated or treated with citalopram. (A) Immunofluorescense staining and quantitative immunofluorescence analysis of WT and APP mice untreated and treated with citalopram for APP. APP levels were significantly increased in the transgenic APP mice compared to the WT (P = 0.0002). Citalopram signifiantly reduced the APP levels in the APP mice (P = 0.0302). (B) Immunofluorescense staining and quantitative immunofluorescence analysis of WT and APP mice untreated and treated with citalopram for TPH2. TPH2 levels were significantly reduced in the APP mice compared to the WT (P = 0.009). Citalopram signifiantly increased the TPH2 levels in the WT as well as APP mice (P = 0.0002 and P = 0.0465). (C) Immunofluorescense staining and quantitative immunofluorescence analysis of WT and APP mice untreated and treated with citalopram for SERT. SERT levels were significantly reduced in the APP mice compared to the WT (P = 0.0027). Citalopram signifiantly increased the SERT levels in the WT mice (P = 0.0406).
Citalopram reduces mitochondrial number and increases mitochondrial length
Transmission electron microscopy showed increased number of mitochondria in the hippocampal tissues of APP mice (P = 0.03) relative to WT mice, suggesting that Aβ fragments hippocampal mitochondria (Fig. 11). On the other hand, mitochondrial length was decreased in APP mice (P = 0.01) relative to WT mice (Fig. 11). Upon citalopram treatment the mitochondrial number was reduced in both WT (P = 0.05) and APP (P = 0.05) mice and mitochondrial length was increased in citalopram-treated mutant APP mice (P = 0.03) (Fig. 11).
Figure 11 .
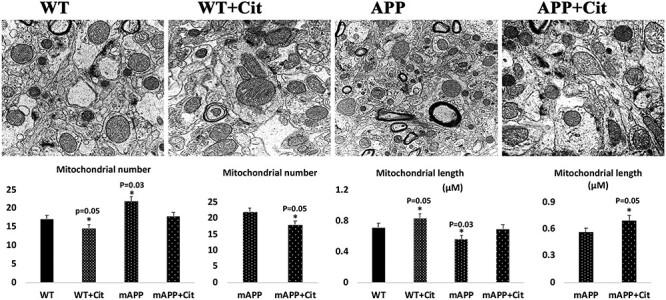
Hippocampal mitochondrial number and length in 12-month-old non-transgenic WT and APP mice untreated and treated with citalopram. (A) Representative transmission electron microscopy images of mitochondrial number and length in hippocampi of WT and APP mice untreated and treated with citalopram. (B) Quantitative analysis of mitochondrial number in WT and APP mice untreated and treated with citalopram. Significantly increased number of mitochondria were found in the APP mice relative to the WT mice (P = 0.03). Upon citalopram treatment the mitochondrial number was reduced in both WT (P = 0.05) and APP (P = 0.05) mice. (C) Quantitative analysis of mitochondrial length in WT and APP mice untreated and treated with citalopram. Significantly reduced mitochondria length was found in the APP mice relative to the WT mice (P = 0.03). Upon citalopram treatment the mitochondrial length was increased in both WT (P = 0.05) and APP (P = 0.05) mice.
Citalopram increases the dendritic spines
We quantified the number of dendritic spines using Golgi-Cox staining in the hippocampus of citalopram-untreated and -treated WT and APP mice to assess the effects of citalopram on dendritic spines. As shown in Figure 12A and 12B, we observed significantly decreased dendritic spines in APP mice relative to control WT mice (P = 0.001). Compared with APP mice, citalopram-treated APP mice showed a significantly increased number of dendritic spines (P = 0.0001) (Fig. 12A and 12B). These observations indicate that citalopram treatment enhances dendritic spines in APP mice.
Figure 12 .
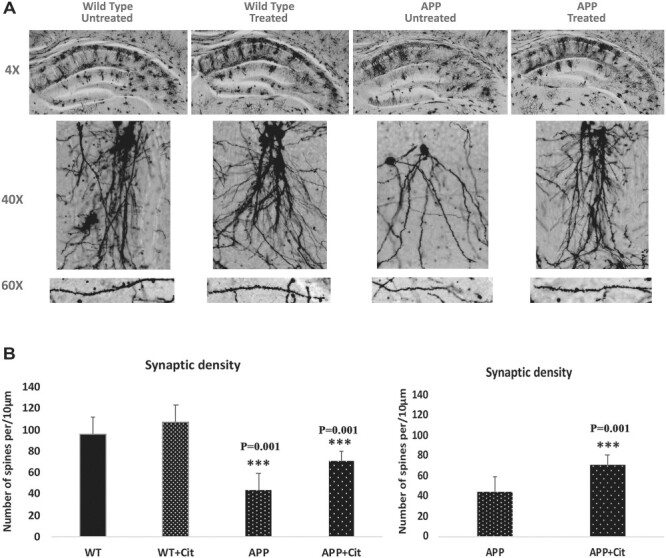
Golgi-cox staining representing hippocampal dendritic spine density in the brains of 12-month-old WT and APP untreated and treated with citalopram. (A) Represents Golgi-cox staining at 4X, 10X and high magnification at 60X. (B) Represents quantification of spine density in the APP and WT mice untreated and treated with citalopram. Significantly reduced dendritic spines were found in APP mice relative to WT mice (P = 0.001), and citalopram significantly increased the spine density in the APP mice (P = 0.001).
Discussion
The objective of our study was to assess the protective effects of SSRI, citalopram, against the toxic effects of mutant APP/Aβ-induced mitochondrial and synaptic abnormalities in APP mice, and also the enhancement of serotonin and neurogenesis levels. Twelve-month-old symptomatic transgenic APP mice and age-matched non-transgenic WT mice were treated with 20 mg/kg body weight citalopram (recently optimized in our laboratory) for 2 months. Using Morris Water Maze and rotarod cognitive tests, quantitative RT-PCR, immunoblotting, immunofluorescence, biochemical methods and transmission electron microscopy methods, we assessed cognitive behavior, Aβ levels and mRNA and protein levels of mitochondrial dynamics, biogenesis, autophagy, mitophagy, synaptic, ad-related, serotonin-related and neurogenesis genes in 12-month-old wild-type and APP mice untreated and treated with citalopram.
Citalopram-treated APP mice relative to citalopram-untreated APP mice exhibited improved cognitive behavior. Increased levels of mRNA associated with mitochondrial fission and ad-related genes and decreased levels of fusion biogenesis, autophagy, mitophagy, serotonin, synaptic and neurogenesis genes were found in APP mice relative to WT mice. However, APP mice treated with citalopram compared to citalopram-untreated APP mice revealed reduced levels of the mitochondrial fission and ad-related genes and increased mitochondrial fusion, biogenesis, autophagy, mitophagy, serotonin-related, synaptic and neurogenesis genes. Our protein data agree with the mRNA levels. Transmission electron microscopy revealed significantly increased mitochondrial numbers and reduced mitochondrial length in APP mice; these were reversed in citalopram-treated APP mice. Further, Golgi-cox staining analysis revealed reduced dendritic spines in APP mice relative to WT mice. However, citalopram-treated APP mice showed significantly increased dendritic spines, indicating that citalopram enhances spine density and synaptic activity in APP mice. These findings suggest that citalopram reduces cognitive decline, Aβ levels and mitochondrial and synaptic toxicities and may have a protective role on mutant APP and Aβ-induced injuries in patients with depression, anxiety and ad.
Citalopram reduces C-terminal fragments and Aβ levels in Alzheimer’s disease
Our extensive sandwich ELISA analysis of Aβ levels in citalopram-treated APP mice relative to citalopram-untreated APP mice revealed significantly reduced Aβ42, but not Aβ40 (Fig. 2). This strongly indicates citalopram affects abnormal APP processing, α and γ-secretases in citalopram-treated APP mice. Our previous study of mutant APP-hippocampal neurons showed a significant reduction of mutant full-length APP and C-terminal fragments in citalopram-treated mAPP-HT22 cells, which strongly suggests that citalopram impacts amyloid cascade events in disease progression and development, such as cellular homeostasis, mitochondrial biogenesis and synaptic activities in ad cells (49). Overall, current study findings together with our cell culture study indicate that citalopram reduces mutant APP and Aβ levels. Further research is still needed to understand the precise mechanism of citalopram involvement in abnormal APP processing.
Citalopram reversed the impaired mitochondrial dynamics in Alzheimer’s disease
Impaired mitochondrial dynamics (increased fission and reduced fusion) and mitochondrial dysfunction are extensively reported in aging and neurodegenerative diseases, including Alzheimer’s, Huntington’s, Parkinson’s, diabetes, obesity and ALS (44,53,58,66–70). In addition, impaired mitochondrial dynamics and mitochondrial dysfunction are also observed in hyperglycemia, depression, bipolar and anxiety conditions (49,71). Increased mitochondrial fragmentation is the result of enhanced Drp1-GTPase enzymatic activity primarily due to increased Fis1 and Drp1 levels. Excessive mitochondrial fragmentation occurs due to abnormal interaction between Drp1 and Aβ as well as Drp1 and phosphorylated tau in neurons, ultimately leading to defective mitophagy, particularly at synapses, and synaptic and cognitive damage in ad (4,44,72,73). Therefore, reduced Drp1-GTPase enzymatic activity is predicted as therapeutic strategy to reduce excessive mitochondrial fragmentation, defective mitophagy and enhanced synaptic and cognitive functions in ad.
Citalopram enhanced mitochondrial biogenesis in Alzheimer’s disease
mRNA and protein levels of mitochondrial biogenesis genes were reduced in mAPP-HT22 cells (49,58) and in APP mice (52 and current study). As discussed earlier, reduced mitochondrial biogenesis is an early feature of ad (49). Elevated mitochondrial biogenesis is a suggested/recommended therapeutic approach in ad (4). Cells (49) and APP mice (current study) treated with citalopram enhanced mitochondrial biogenesis, indicating that citalopram has a direct impact on mitochondrial biogenesis in the presence of mutant APP and Aβ.
Citalopram activated autophagy and mitophagy in Alzheimer’s disease
In our cell culture studies (49,58) and current APP mice study, we found reduced mRNA and protein levels of autophagy (ATG5, LC3BI and LC3BII), and mitophagy proteins (PINK1 and TERT) in ad neurons that express mutant APP and Aβ. We also found that mRNA and protein levels of autophagy and mitophagy genes were increased in the mAPP-HT22 cells (49) and APP mice (current study) with citalopram treatment, indicating that citalopram reversed APP and Aβ-induced defective autophagy and mitophagy activities in ad.
Citalopram enhanced serotonin reduced mitochondrial abnormalities
Neurotransmitter serotonin is low in ad-affected neurons, marked by reduced levels of serotonin-related genes SERT, TPH2, 5HTR1A, 5HTR1B and 5HTR1F in mAPP-HT22 cells (17–19,49) and APP transgenic mice (Table 1 of our current study), as indicated by our study. However, citalopram treatment increases serotonin in hippocampal neurons (49) and APP mice (current study), which results in improved synaptic proteins, increased synaptic density and overall synaptic activity in ad.
Increasing evidence suggests that serotonin levels are low in individuals with depression, anxiety, ad and ADRD, and other neurological conditions, indicating that reduced serotonin levels trigger clinical symptoms of depression and anxiety in ad and psychosis conditions. As observed in our previous cell culture study (49) and current APP mice study, citalopram treatment increased serotonin levels.
Our previous study of mAPP-HT22 cells and current APP mice study revealed that abnormal mitochondrial dynamics, defective mitochondrial biogenesis and defective mitophagy in ad neurons (49 and current study observations). Interestingly, reduced serotonin genes and defective mitochondrial biogenesis, impaired mitochondrial dynamics and defective mitophagy are directly linked in ad. The reasons for these molecular links are: 1. mRNA and protein levels of mitochondrial fission genes were increased, and 2. fusion genes were reduced, indicating the presence of impaired mitochondrial dynamics in ad. On the other hand, when we treated mAPP-HT22 cells and APP transgenic mice with citalopram, reduced levels of fission proteins and increased fusion proteins were found in the mAPP-HT22 cells (49) and APP mice (current study), suggesting that citalopram maintained mitochondrial dynamics in ad.
It is interesting to observe defective mitochondrial biogenesis in mAPP-HT22 cells and APP mice; in other words, reduced mRNA and proteins levels of mitochondrial biogenesis genes PGC1a, Nrf1, Nrf2 and TFAM were found, and also increased number of fragmented and defective mitochondria and reduced mitochondrial length, indicating that mutant APP and amyloid beta cause defective mitochondrial biogenesis. On the other hand, in mAPP-HT22 cells and APP mice treated with citalopram, increased mitochondrial biogenesis proteins and reduced number of defective mitochondria and increased size of mitochondrial length were observed. These observations indicate that citalopram increased healthy mitochondrial biogenesis in mAPP-HT22 cells and APP mice.
Overall, citalopram treatment, enhanced serotonin levels and maintained serotonin-modulated mitochondrial dynamics enhanced biogenesis and mitophagy in ad neurons. Therefore, we cautiously propose that SSRI citalopram is a potential drug to treat patients/subjects with ad, depression, diabetes and anxiety disorders.
Citalopram enhances synaptic activity
Serotonin levels are low in hippocampal neurons from ad patients and ad mouse models, indicating that reduced serotonin levels affect synaptic function in ad (17–19). Increasing evidence also suggests that spine density is critical for synaptic and cognitive functions in ad patients and ad mice and reduced levels of synaptic and dendritic proteins are undoubtedly responsible for synaptic damage and cognitive functions in ad (52,59). Our previous cell culture studies (49,58) and APP mice studies (47,52) showed reduced levels of synaptic and dendritic proteins, synaptophysin, PSD95 and MAP2 in ad neurons. Our current findings of reduced synaptic and dendritic proteins concur with our earlier studies. These observations indicate that APP and Aβ affect synaptic and dendritic proteins. Our extensive immunofluorescence analysis, which revealed reduced cortical and hippocampal immune-reactivities of synaptic proteins, further supports our mRNA and protein data. However, citalopram treatment reversed the reduced synaptic and dendritic proteins in APP and WT mice, strongly indicating that citalopram has a potential to increase synaptic and dendritic proteins.
Citalopram enhanced dendritic spines
Dendritic spines directly correlate with synaptic activity and cognitive function in ad (52,59). Reduced spine density can lead to impaired memory, difficulty in coordinating activities and lower signal transmission (4). Increasing evidence also suggests that synaptic loss is an early event in the disease process that occurs due to soluble amyloid beta, phosphorylated tau accumulation and increased production of mitochondrially generated free radicals at synapses (52–54,59). Therefore, reduced synaptic accumulation of amyloid beta, phosphorylated tau and mitochondrial free radicals may reduce synaptic loss and enhance cognitive functions in ad patients (4). In the current study, we quantified number of dendritic spines using Golgi-Cox staining in the hippocampus of citalopram-treated and -untreated WT and APP mice. We observed significantly decreased dendritic spines in APP mice relative to control WT mice (P = 0.001). Compared with APP mice, citalopram-treated APP mice showed a significantly increased number of dendritic spines (P = 0.001). These observations indicate that citalopram treatment enhances dendritic spines in APP mice.
Mechanistic impact of citalopram in Alzheimer’s disease
In ad, amyloid beta formation, age-dependent accumulation and reduced clearance are important cellular and pathological changes. Although amyloid beta cascade is highly debated, Aβ peptides are still toxic to the cells. As extensively reported, Aβ formation occurs due to abnormal APP processing. APP processing occurs by two pathways: Aβ secretase-based amyloidogenic and α-secretase-based non-amyloidogenic pathway. In the non-amyloidogenic pathway, cleavage occurs by α-secretase within the Aβ domain and generates the large soluble N-terminal fragment and a non-amyloidogenic C-terminal fragment of 83 amino acid residues (C83). In the amyloidogenic pathway, cleavage occurs by β-secretase at the beginning of the Aβ domain and generates a soluble N-terminus fragment and amyloidogenic C-terminal fragment of 99 residues (C99). This C-terminal fragment is further cleaved by γ-secretase and generates Aβ40 and Aβ42 fragments. Amyloid β can accumulate in cellular compartments, such as mitochondria and lysosomes, and impair cellular functions.
In the current study of APP mice, increased Aβ42 levels were found and these observations agreed with our cell culture study of mAPP-HT22. However, in mAPP-HT22 and APP mice treated with citalopram, toxic Aβ42 levels were reduced, indicating citalopram treatment affects abnormal APP processing in a positive way. Our qRT-PCR analysis of APP and WT mice revealed that mRNA levels of ADAM10 (that represents□α-secretase) decreased by 5.4-fold in APP mice relative to WT mice, indicating reduced α-secretase activity in APP mice. However, APP mice treated with citalopram showed increased mRNA levels of ADAM10, strongly suggesting that citalopram enhances α-secretase and reduces Aβ42 levels. However, it is unclear how α-secretase levels affect selectively Aβ42 levels. Further research is still needed to understand whether citalopram affects γ and ε secretase levels. Overall, citalopram affects abnormal APP processing and subsequent c-terminal fragments in ad.
Regarding translational implications of SSR1 citalopram, based on our recent cell culture study and current APP mice work, we cautiously say citalopram is a protective molecule which overall enhances mitochondrial, synaptic and cognitive functions in individuals with mitochondrial and synaptic defects of anxiety, depression and early ad. In terms of human clinical trials success using citalopram and other SSRIs, we cautiously say that success depends on dose, frequency and stage of disease severity in patients, and also DNA polymorphisms in the genomes of patients. Gender plays a large role with serotonin levels at the time of treatment. Based on our observations of SSRI citalopram in APP mice, we expect all SSRIs are protective against mutant APP and amyloid beta, with some degree of differences.
In summary, mutant APP and Aβ increased mitochondrial fragmentation, reduced mitochondrial fusion, increased defective mitochondrial biogenesis, reduced synaptic activity and increased defective mitophagy and autophagy in APP mice. However, citalopram treatment reduced mutant APP and Aβ-induced mitochondrial deficits, synaptic damage and increased autophagy/mitophagy activities and enhanced dendritic spines as well as synaptic and cognitive functions in APP mice. Further studies are still needed to understand the beneficial effects of citalopram in subcortical regions such as raphe, cerebellum and hypothalamus.
Materials and Methods
APP transgenic mice
Amyloid beta precursor protein mice (Tg2576 mice or APP) were generated with the mutant human APP gene 695 amino acid isoform and a double mutation (Swedish mutation) (74). These mice are characterized by high levels of APP and amyloid plaques starting to appear as early as 6 months of age and increase in size and number thereon with progressing age (75). The plaques are mostly limited to the cerebral cortex and hippocampus as is seen in ad patients. Cognitive impairment appears starting at 9 months of age (74). To confirm the presence of the human APP transgene, genotyping was performed using mouse tail clippings as described by Manczak et al. (76). Twelve-month-old WT and APP mice were injected intraperitoneally with 20 mg/kg body weight citalopram three times per week for 2 months. Citalopram hydrobromide was obtained from Milipore Sigma (Milipore Sigma, Burlington, MA) and was dissolved in sterile saline. Each of the 4 groups wild-type untreated (n=10, 5 males and 5 females), wild-type treated (n = 10, 5 males and 5 females), APP untreated (n = 10, 5 males and 5 females), and APP treated (n = 10, 5 males and 5 females). Animals were euthanized after behavioral tests and used for molecular studies, including sandwich ELISA, immunoblotting, immunofluorescence, qRT-PCR, Golgi-Cox staining and transmission electron microscopy.
Optimization of citalopram
We optimized citalopram dose using 12-month-old WT mice for 1 month. We tested five different concentrations—10 mg/kg body weight to 20, 30, 40 and 50 mg/body weight, and found 20 mg/kg body weight treated WT mice exhibited strong cognitive behavioral results. Our dose is higher than other studies by Sheline et al. (65) and Zhang et al. (61) (10 mg/kg body weight both in APP/PS1 mice).
Measurement of soluble Aβ levels
Soluble Aβ levels were measured in protein lysates prepared from APP mice and APP mice treated with citalopram using sandwich ELISA as described in Reddy et al. (47). Briefly, protein lysates were from cortical tissues in a Tris-buffered saline (pH 8.0) containing protease inhibitors (20 mg/ml pepstatin A, aprotinin, phophsoramidon, and leupeptin; 0.5 mMphenylmethanesulfonyl fluoride and 1 mM ethylene glycol-bis (flaminoethyl ether)-NN tetraacetic acid). Samples were sonicated briefly and centrifuged at 10 000 g for 20 min at 4°C. The soluble fraction was used to determine the soluble Aβ by ELISA. For each sample, Aβ1–40 and Aβ1–42 levels were measured with commercial colorimetric ELISA kits (BioSource International, Camarillo, CA) specific for the human proteins. A 96-well plate was used, following the manufacturer’s instructions. Each sample was run in duplicate (four for each group). Protein concentrations of the homogenates were determined following the BSA method, and Aβ was expressed as pg Aβ/mg protein.
Cognitive behavior methods
Two methods were utilized to analyze the cognitive behavior in mice—the Morris Water Maze and the rotarod (77). Our study included 20 12-month-old mice divided into four groups WT and APP untreated and treated with citalopram.
Rotarod test
A rotarod test was first used to assess the sensorimotor output of the mice. To test differences in balance and motor coordination, the untreated and treated WT and APP mice were placed on the mouse rotarod (Med Associates Inc., St. Albans, VT) unit. The rod was set at 2 rpm on the apparatus, and mice were put, four at a time, each in an assigned position on the rod. Over a 5-min session, the rod was allowed to gradually accelerate up to 40 rpm. An IR beam is interrupted when the animal falls, halting the motor and the timer. It reported the time spent on the rod without falling down, with a maximum of 5 min. Mice were subsequently removed and allowed to rest for 30 min before they returned to the remaining two test sessions, generating a total of three trials per day over three consecutive days. Evaluation was done before the mouse fell down by tracking latency to fall and maximum rotation rate. As a precautionary measure against physical harm from falls, a soft pad was put under the equipment (59).
Morris Water Maze test
The Morris Water Maze (MWM) test is utilized for the measurement of hippocampal spatial long-term memory and cognitive learning functions in mice. The test monitors spatial memory deficits in diseased mice by using a tank filled with murky water that hides an escape platform just below the water’s surface (59). If the mouse reaches the platform before the allotted 60 s the test is ended. The MWM test was conducted in a galvanized tank 120 cm in diameter, which was filled with opaque water stained with tempera paint (Utrecht Art Supplies, Cranbury, NJ) and surrounded by a set of spatial cues. The pool temperature was maintained at 25 ± 0.5°C by the addition of warm water. The tank was imaginarily divided into four quadrants (compass locations: NE, NW, SW and SE). All groups WT and APP untreated and treated swam three times a day for three consecutive days. The mice were monitored using a camera and ANY-Maze software (Stoelting Co., Wood Dale, IL) which measured latency to find platform. A platform with a 9 cm diameter was submerged 1 cm underwater surface in a quadrant. The swimming animal was captured and recorded. The platform was placed in the NW quadrant and remained at the same position during the whole experiment. Briefly, every group of animals was trained for 4 days in MWM, with four trials per day, with 15 min interatrial interval, so that one group of the animals was tested within 4 days/week. Each trial was conducted for 1 min, but a trial ended once the animal was positioned on the platform for 3 s. If the animal did not find the platform within 1 min, they were placed on the platform using the net for 3 s. After every trial animal was dried with a towel and placed into a holding cage. Distance traveled, average speed and time to find the platform were determined from the retrieved videotapes (76).
qRT-PCR analysis
Quantification of mRNA expression of mitochondrial dynamics, mitochondrial biogenesis, autophagy, mitophagy, synaptic, serotonin-related, ad-related and neurogenesis genes was done using real-time RT-PCR. Using the reagent TriZol (Invitrogen, Carlsbad, CA), total RNA was isolated from cerebral cortex of mouse brains from all four groups—WT and APP untreated and treated with citalopram. Using primer Express Software (Applied Biosystems, Foster City, CA), we designed the oligonucleotide primers for the housekeeping genes β-actin; GAPDH; mitochondrial dynamics genes (Drp1, Fis1, Mfn1, Mfn2 and Opa1) mitochondrial biogenesis genes (PGC1α, NRF1, NRF2 and TFAM), autophagy genes (LC3A, LC3B, ATG5 and Beclin1), mitophagy genes (PINK1, TERT, BCL1 and BNIPBL), synaptic genes (synaptophysin and PSD95), serotonin-related genes (SERT, TPH2, 5HTR1A, 5HTR1B, 5HTR1F, 5HTR4 and 5HTR6), ad-related genes (MAPT, APP, BACE1 and ADAM10) and neurogenesis genes (BDNF, DCX, NeuN1 and CLBN). The primer sequences and amplicon sizes are given in Table 2. We used Sybr-Green-based quantitative real-time RT-PCR (Thermofisher Scientific, Waltham, MA). Briefly, 5 μg of DNAse-treated total RNA was used as starting material, to which we added 1 μl of oligo (dT), 1 μl of 10 mM dNTPs, 4 μl of 5× first strand buffer, 2 μl of 0.1 M DTT and 1 μl RNAseout. The reagents, RNA, Oligo dT and dNTPs were mixed first, then heated to denature RNA at 65°C for 5 min, and briefly chilled on ice until the remaining components were added. The samples were incubated at 42°C for 2 min, and then 1 μl of Superscript III (40 U/μl) was added. The samples were incubated at 42°C for 50 min and the reaction was inactivated by heating at 70°C for 15 min. Based on reverse transcriptase efficiency 100%, the cDNA diluted and used 100 ng/20ul reaction in triplicate assays using QuantStudio3 (Applied Biosystems, Foster City, CA). The PCR conditions were: 50°C for 2 min and 95°C for 10 min, followed by 40 cycles of 95°C for 15 s and 60°C for 1 min. The fluorescent spectra were recorded during the elongation phase of each PCR cycle. A dissociation curve was generated to distinguish non-specific amplicons. The CT-values were calculated with Quant studio, and design and a specific setting on the baseline; the amplification plots and CT-values were exported from the exponential PCR phase directly into a Microsoft Excel worksheet for further analysis.
Table 2.
Summary of qRT-PCR oligonucleotide primers used in measuring mRNA expressions in mitochondrial dynamics and mitochondrial biogenesis, synaptic, autophagy and mitophagy genes in citalopram-treated and -untreated mutant APP HT22 cells
| Gene | DNA Sequence (5′-3′) | PCR Product Size |
|---|---|---|
| Mitochondrial Dynamics Genes | ||
| Drp1 | Forward Primer ATGCCAGCAAGTCCACAGAA | 86 |
| Reverse Primer TGTTCTCGGGCAGACAGTTT | ||
| Fis1 | Forward Primer CAAAGAGGAACAGCGGGACT | 95 |
| Reverse Primer ACAGCCCTCGCACATACTTT | ||
| Mfn1 | Forward Primer GCAGACAGCACATGGAGAGA | 83 |
| Reverse Primer GATCCGATTCCGAGCTTCCG | ||
| Mfn2 | Forward Primer TGCACCGCCATATAGAGGAAG | 78 |
| Reverse Primer TCTGCAGTGAACTGGCAATG | ||
| Opa1 | Forward Primer ACCTTGCCAGTTTAGCTCCC | 82 |
| Reverse Primer TTGGGACCTGCAGTGAAGAA | ||
| Mitochondrial Biogenesis genes | ||
| PGC1α | Forward Primer GCAGTCGCAACATGCTCAAG | 83 |
| Reverse Primer GGGAACCCTTGGGGTCATTT | ||
| NRF1 | Forward Primer AGAAACGGAAACGGCCTCAT | 96 |
| Reverse Primer CATCCAACGTGGCTCTGAGT | ||
| NRF2 | Forward Primer ATGGAGCAAGTTTGGCAGGA | 96 |
| Reverse Primer GCTGGGAACAGCGGTAGTAT | ||
| TFAM | Forward Primer TCCACAGAACAGCTACCCAA | 84 |
| Reverse Primer CCACAGGGCTGCAATTTTCC | ||
| Reverse Primer AGACGGTTGTTGATTAGGCGT | ||
| Autophagy genes | ||
| LC3A | Forward Primer CCCATCGCTGACATCTATGAAC | 77 |
| Reverse Primer AAGGTTTCTTGGGAGGCGTA | ||
| LC3B | Forward Primer TCCACTCCCATCTCCGAAGT | 94 |
| Reverse Primer TTGCTGTCCCGAATGTCTCC | ||
| ATG5 | Forward Primer TCCATCCAAGGATGCGGTTG | 95 |
| Reverse Primer TCTGCATTTCGTTGATCACTTGAC | ||
| Beclin1 | Forward Primer ACCAGCGGGAGTATAGTGAGT | 98 |
| Reverse Primer CAGCTGGATCTGGGCGTAG | ||
| Mitophagy genes | ||
| Pink1 | Forward Primer CCATCGGGATCTCAAGTCCG | 70 |
| Reverse Primer GATCACTAGCCAGGGACAGC | ||
| TERT | Forward Primer GCAAGGTGGTGTCTGCTAGT | 100 |
| Reverse Primer AGCTTGCCGTATTTCCCCAA | ||
| BCL2 | Forward Primer TCCTTCCAGCCTGAGAGCAA | 73 |
| Reverse Primer GCCTGAGAGGAGACGTCCTG | ||
| BNIP3L | Forward Primer GCACGTTCCTTCCTCGTCT | 82 |
| Reverse Primer GCTCTGTCCCGACTCATGC | ||
| Synaptic genes | ||
| Synaptophysin | Forward Primer CTGCGTTAAAGGGGGCACTA | 81 |
| Reverse Primer ACAGCCACGGTGACAAAGAA | ||
| PSD95 | Forward Primer CTTCATCCTTGCTGGGGGTC | 90 |
| Reverse Primer TTGCGGAGGTCAACACCATT | ||
| Serotonin-related genes | ||
| SERT | Forward Primer CAAAACGTCTGGCAAGGTGG | 155 |
| Reverse Primer ACACCCCTGTCTCCAAGAGT | ||
| TPH2 | Forward Primer GATTCAGCGGTGCCAGAAGA | 132 |
| Reverse Primer GGAGAACACAACCGCAGTCT | ||
| 5HTR1A | Forward Primer ACCAGCTTCGGAACATCGTC | 132 |
| Reverse Primer CTGTCTCACCGCCCCATTAG | ||
| 5HTR1B | Forward Primer TACACGGTCTACTCCACGGT | 121 |
| Reverse Primer CGGTCTTGTTGGGTGTCTGT | ||
| 5HTR1F | Forward Primer ACAAGAGACAAGCGAGTCGG | 134 |
| Reverse Primer GTCCGTTGATGGATCGGACA | ||
| 5HTR5 | Forward Primer CTCCACGTGGTGTGTCTTCA | 130 |
| Reverse Primer GGCATGCTCCTTAGCAGTGA | ||
| 5HTR6 | Forward Primer GCATAGCTCAGGCCGTATGT | 115 |
| Reverse Primer TCCCGCATGAAGAGGGGATA | ||
| AD-related genes | ||
| MAPT | Forward Primer TGCCCATGCCAGACCTAAAG | 147 |
| Reverse Primer TGTTCCCTAACGAGCCACAC | ||
| APP | Forward Primer TTCGCTGACGGAAACCAAGA | 140 |
| Reverse Primer CGTCAACAGGCTCGACTTCA | ||
| BACE1 | Forward Primer GGAACCCATCTCGGCATCC | 145 |
| Reverse Primer CCCTCAGGTTGTCCACCATC | ||
| ADAM10 | Forward Primer ATGGTGTTGCCGACAGTGTT | 150 |
| Reverse Primer TTTGGCACGCTGGTGTTTTT | ||
| Neurogenesis Genes | ||
| BDNF | Forward Primer CCGGTATCCAAAGGCCAACT | 143 |
| Reverse Primer AGGGCCCGAACATACGATTG | ||
| DCX | Forward primer TAAAAGCCCAGGCCCAATGC | 180 |
| Reverse primer AATGACAGCGGCAGGTACAG | ||
| NeuN1 | Forward primer AGCTAAATCCAGTGGTCGGC | 236 |
| Reverse primer GGCTGCGTAGCCTCCATAAA | ||
| CLBN1 | Forward primer TTGTAGAGTTGGCTCACGTCTT | 218 |
| Reverse primer TGTGTACTCTGCTAGTTTTGTATCA | ||
| Housekeeping genes | ||
| B-actin | Forward Primer AGAAGCTGTGCTATGTTGCTCTA | 91 |
| Reverse Primer TCAGGCAGCTCATAGCTCTTC | ||
| GAPDH | Forward Primer TTCCCGTTCAGCTCTGGG | 59 |
| Reverse Primer CCCTGCATCCACTGGTGC | ||
The mRNA transcript level was normalized against β-actin and the GAPDH at each dilution. A comparison of β-actin, GAPDH and genes of interest shown; relative quantification is performed according to the CT method (Applied Biosystems, Foster City, CA). Briefly, the comparative CT method involved averaging triplicate samples taken as the CT values for β-actin, GAPDH and genes of interest. β-actin normalization was used in the present study because β-actin CT values were similar for the WT and APP untreated and treated groups. The ΔCT-value obtained by subtracting the average β-actin CT value from the average CT-value for interest genes. The ΔCT of WT untreated mouse was used as the calibrator. The fold change was calculated according to the formula 2−(Δ ΔCT), where ΔΔCT is the difference between ΔCT and the ΔCT calibrator value. Statistical significance was calculated between mRNA expression in between WT and APP mice treated and untreated groups.
Immunoblotting analysis
To determine the effect of citalopram on ad pathology, protein levels of mitochondrial dynamics genes (Drp1, Fis1, Mfn1, Mfn2 and Opa1), mitochondrial biogenesis genes (PGC1α, NRF1, NRF2 and TFAM), autophagy and mitophagy genes (PINK1, ATG5, ATG7, LC3B, TERT and p62), synaptic protein genes (synaptophysin and PSD95) and dendritic protein MAP2 were determined by immunoblotting. Details of antibody dilutions and conditions are given in Table 3. Protein lysates obtained from brains of untreated and treated WT and APP mice were resolved on 4–12% Nu-PAGE gels (Invitrogen, Carlsbad, CA). The resolved proteins were then transferred on PVDF membranes (Biorad, Hercules, CA) and blocked with blocking buffer (5% milk in TBST) for 1 h at room temperature. The membranes were incubated overnight with primary antibodies at 4°C. The following day the membranes were washed with TBST buffer three times and then incubated with secondary antibodies for 1 h at room temperature. After another three TBST washes to remove the unbound secondary antibody and the proteins were detected using chemiluminescence substrate (Thermofisher, Waltham, MA). Band intensity analysis was done using image J software and statistical significance was assessed using one-way analysis of variance (ANOVA).
Table 3.
Summary of antibody dilutions and conditions used in the immunoblotting analysis of mitochondrial dynamics, mitochondrial biogenesis, synaptic, autophagy, mitophagy and serotonin-associated proteins in citalopram untreated and treated wild-type and APP mice
| Marker Primary antibody—species and dilution | Purchased from company, city and state | Secondary antibody, dilution | Purchased from company, city and state |
|---|---|---|---|
| Drp1 Rabbit polyclonal 1:500 | Novus Biological, Littleton, CO | Donkey anti-rabbit HRP 1:10000 | GE Healthcare Amersham, Piscataway, NJ |
| Fis1 Rabbit polyclonal 1:500 | Novus Biological, Littleton, CO | Donkey anti-rabbit HRP 1:10000 | GE Healthcare Amersham, Piscataway, NJ |
| Mfn1 Rabbit polyclonal 1:400 | Abcam, Cambridge, MA | Donkey anti-rabbit HRP 1:10000 | GE Healthcare Amersham, Piscataway, NJ |
| Mfn2 Rabbit polyclonal 1:400 | Abcam, Cambridge, MA | Donkey anti-rabbit HRP 1:10000 | GE Healthcare Amersham, Piscataway, NJ |
| Opa1 Rabbit polyclonal 1:500 | Novus Biological, Littleton, CO | Donkey anti-rabbit HRP 1:10000 | GE Healthcare Amersham, Piscataway, NJ |
| PGC1α Rabbit polyclonal 1:500 | Novus Biological, Littleton, CO | Donkey anti-rabbit HRP 1:10000 | GE Healthcare Amersham, Piscataway, NJ |
| NRF1 Rabbit polyclonal 1:300 | Novus Biological, Littleton, CO | Donkey anti-rabbit HRP 1:10000 | GE Healthcare Amersham, Piscataway, NJ |
| NRF2 Rabbit polyclonal 1:300 | Novus Biological, Littleton, CO | Donkey anti-rabbit HRP 1:10000 | GE Healthcare Amersham, Piscataway, NJ |
| TFAM Rabbit polyclonal 1:300 | Novus Biological, Littleton, CO | Donkey anti-rabbit HRP 1:10000 | GE Healthcare Amersham, Piscataway, NJ |
| LC3B Rabbit polyclonal 1:400 | Novus Biological, Littleton, CO | Donkey anti-rabbit HRP 1:10000 | GE Healthcare Amersham, Piscataway, NJ |
| ATG5 Rabbit polyclonal 1:500 | Novus Biological, Littleton, CO | Donkey anti-rabbit HRP 1:10000 | GE Healthcare Amersham, Piscataway, NJ |
| ATG7 Rabbit polyclonal 1:500 | Novus Biological, Littleton, CO | Donkey anti-rabbit HRP 1:10000 | GE Healthcare Amersham, Piscataway, NJ |
| PINK1 Rabbit polyclonal 1:300 | Novus Biological, Littleton, CO | Donkey anti-rabbit HRP 1:10000 | GE Healthcare Amersham, Piscataway, NJ |
| TERT Mouse monoclonal 1:500 | Novus Biological, Littleton, CO | Donkey anti-mouse HRP 1:10000 | GE Healthcare Amersham, Piscataway, NJ |
| p62 Rabbit polyclonal 1:500 | Novus Biological, Littleton, CO | Donkey anti-rabbit HRP 1:10000 | GE Healthcare Amersham, Piscataway, NJ |
| Synaptophysin Rabbit monoclonal 1:400 | Abcam, Cambridge, MA | Donkey anti-rabbit HRP 1:10000 | GE Healthcare Amersham, Piscataway, NJ |
| PSD95 Rabbit monoclonal 1:300 | Abcam, Cambridge, MA | Donkey anti-rabbit HRP 1:10000 | GE Healthcare Amersham, Piscataway, NJ |
| MAP2 mouse monoclonal 1:500 | Thermofisher Scientific, Waltham, MA | Donkey anti-rabbit HRP 1:10000 | GE Healthcare Amersham, Piscataway, NJ |
| β-Actin Mouse Monoclonal 1:1000 | Milliopore Sigma, Burlington, MA | Donkey anti-mouse HRP 1:10000 | GE Healthcare Amersham, Piscataway, NJ |
Immunofluorescence analysis
Immunofluorescence analysis was performed using midbrain sections showing the hippocampal ridge. Details of antibody dilutions and conditions are given in Table 4. The 10-micron sections where first fixed with 4% paraformaldehyde for 15 min followed by permeabilization with 0.02% Triton-X 100 for another 15 min. After each step the tissue was washed three times with 2% BSA in 1X PBS. The tissues were then blocked with 5% BSA at room temperature for 1 h. All sections were incubated overnight with primary antibodies at 4°C. This was followed by four washes with 2% BSA and incubated with secondary antibody at room temperature for 1 h. Finally, the sections were washed five times with 2% BSA, and mounted using Prolong Diamond anti-fade reagent with DAPI (Thermofisher, Waltham, MA). Imaging was performed using Olympus XI81 fluorescent microscope. To quantify the immunoreactivity, five sections from each mouse and four such mice in each group were analyzed. Image J software was used for final quantification and statistical significance was assessed using one-way ANOVA.
Table 4.
Summary of antibody dilutions and conditions used in the immunofluorescence analysis of mitochondrial dynamics, mitochondrial biogenesis, synaptic, autophagy and mitophagy, serotonin-associated proteins in citalopram-untreated and -treated wild-type and APP mice
| Marker Primary antibody—species and dilution | Purchased from company, city and state | Secondary antibody, dilution | Purchased from company, city and state |
|---|---|---|---|
| Drp1 Rabbit polyclonal 1:200 | Novus Biological, Littleton, CO | Goat anti-mouse Alexa Fluor 488 1:400 | Thermofisher Scientific, Waltham, MA |
| Fis1 Rabbit polyclonal 1:300 | Novus Biological, Littleton, CO | Goat anti-mouse Alexa Fluor 488 1:400 | Thermofisher Scientific, Waltham, MA |
| PGC1α Rabbit polyclonal 1:100 | Novus Biological, Littleton, CO | Goat anti-mouse Alexa Fluor 488 1:400 | Thermofisher Scientific, Waltham, MA |
| TFAM Rabbit polyclonal 1:100 | Novus Biological, Littleton, CO | Goat anti-mouse Alexa Fluor 488 1:400 | Thermofisher Scientific, Waltham, MA |
| PINK1 Rabbit polyclonal 1:100 | Novus Biological, Littleton, CO | Goat anti-mouse Alexa Fluor 488 1:400 | Thermofisher Scientific, Waltham, MA |
| Synaptophysin Rabbit monoclonal 1:400 | Novus Biological, Littleton, CO | Goat anti-mouse Alexa Fluor 488 1:700 | Thermofisher Scientific, Waltham, MA |
| PSD95 Rabbit monoclonal 1:200 | Cell Signaling Technology, Danvers, MA | Goat anti-mouse Alexa Fluor 594 1:500 | Thermofisher Scientific, Waltham, MA |
| 6E10 (APP) Mouse monoclonal 1:200 | Biolegend, San Diego, CA | Goat anti-mouse Alexa Fluor 594 1:400 | Thermofisher Scientific, Waltham, MA |
| TPH2 Rabbit polyclonal 1:100 | Novus Biological, Littleton, CO | Goat anti-mouse Alexa Fluor 488 1:500 | Thermofisher Scientific, Waltham, MA |
| SERT Goat polyclonal 1:100 | Novus Biological, Littleton, CO | Donkey anti-goat Alexa Fluor 488 1:300 | Thermofisher Scientific, Waltham, MA |
Golgi-cox staining and dendritic spine count
The morphology of neuronal dendrites and dendritic spines was studied in the brains of WT and APP mice untreated and treated with citalopram using Golgi-Cox staining, which was performed using the FD Rapid GolgiStain Kit (FD NeuroTechnologies, Columbia, MD) as described earlier (78). The dried brain sections were processed as per the manufacturer’s instructions and images were taken as described earlier (78,79).
Transmission electron microscopy and mitochondrial number and length
To determine the effects of citalopram on the mitochondrial number and size, we performed transmission electron microscopy in hippocampal sections of 12-month-old WT and APP mice untreated and treated with citalopram. Mitochondrial number and length were calculated as described earlier (78).
Statistical considerations
We performed statistical analyses of the WT and APP mice untreated and treated with citalopram for cognitive behavior, soluble Aβ40 and Aβ42, mitochondrial proteins (Drp1, Fis1, Mfn1, Mfn2, Opa1, NRF1, NRF2, PGC1α and TFAM), autophagy proteins (LC3A, LC3BI, LC3BII, ATG5, ATG7, Beclin1 and p62), mitophagy proteins (PINK1, TERT, Bcl2, BNIP3L), and synaptic and dendritic proteins (synaptophysin, PSD95 and MAP2), serotonin-related proteins (SERT, TPH2, 5HTR1A, 5HTR1B, 5HTR1F, 5HTR4 and 5HTR6), ad-related proteins (MAPT, APP, BACE1 and ADAM10) and neurogenesis proteins (BDNF, DCX, NeuN1 and CLBN), spine density and mitochondrial count and length, using a one-way ANOVA and Student’s t-test statistical analyses.
Conflict of Interest statement. Authors declare that they do not have any conflict of interest.
Funding
This research was also supported by the Alzheimer’s Association New Investigator Research Grant 2016-NIRG-39787, the Center of Excellence for Translational Neuroscience and Therapeutics (PN-CTNT20115-AR), and Alzheimer’s Association through a SAGA grant and NIH grant AG063162 (to APR). The work was also supported by NIH grants: R01AG042178, R01AG47812, R01NS105473, AG069333, AG066347 (to PHR).
References
- 1. Grøntvedt, G.R., Schröder, T.N., Sando, S.B., White, L., Bråthen, G. and Doeller, C.F. (2018) Alzheimer's disease. Curr. Biol., 28, R645–R649. [DOI] [PubMed] [Google Scholar]
- 2. Alzheimer’s Disease Facts and Figures, On the front lines: Primary care physicians and Alzheimer’s care in America. (2020) Alzheimer’s Association, Chicago IL, USA. [Google Scholar]
- 3. Sheladia, S. and Reddy, P.H. (2021) Age related chronic diseases and Alzheimer’s disease in Texas: a Hispanic focused study. Journal of Alzheimer’s Disease Reports, 5, 121–133. [DOI] [PMC free article] [PubMed] [Google Scholar]
- 4. John, A. and Reddy, P.H. (2021) Synaptic basis of Alzheimer's disease: focus on synaptic amyloid beta, P-tau and mitochondria. Ageing Res. Rev., 65, 101208. [DOI] [PMC free article] [PubMed] [Google Scholar]
- 5. Mao, P. and Reddy, P.H. (2011) Aging and amyloid beta-induced oxidative DNA damage and mitochondrial dysfunction in Alzheimer's disease: implications for early intervention and therapeutics. Biochim. Biophys. Acta, 1812, 1359–1370. [DOI] [PMC free article] [PubMed] [Google Scholar]
- 6. Amakiri, N., Kubosumi, A., Tran, J. and Reddy, P.H. (2019) Amyloid beta and microRNAs in Alzheimer's disease. Front. Neurosci., 13, 430. [DOI] [PMC free article] [PubMed] [Google Scholar]
- 7. George, E.K. and Reddy, P.H. (2019) Can healthy diets, regular exercise, and better lifestyle delay the progression of dementia in elderly individuals? J. Alzheimers Dis., 72, S37–S58. [DOI] [PubMed] [Google Scholar]
- 8. Silva, M.V.F., Loures, C.M.G., Alves, L.C.V., de Souza, L.C., Borges, K.B.G. and Carvalho, M.D.G. (2019) Alzheimer's disease: risk factors and potentially protective measures. J. Biomed. Sci., 26, 33. [DOI] [PMC free article] [PubMed] [Google Scholar]
- 9. Riedel, B.C., Thompson, P.M. and Brinton, R.D. (2016) Age, APOE and sex: triad of risk of Alzheimer's disease. J. Steroid Biochem. Mol. Biol., 160, 134–147. [DOI] [PMC free article] [PubMed] [Google Scholar]
- 10. Bekris, L.M., Yu, C.E., Bird, T.D. and Tsuang, D.W. (2010) Genetics of Alzheimer disease. J. Geriatr. Psychiatry Neurol., 23, 213–227. [DOI] [PMC free article] [PubMed] [Google Scholar]
- 11. Bethea, C.L. and Reddy, A.P. (2015) Ovarian steroids regulate gene expression related to DNA repair and neurodegenerative diseases in serotonin neurons of macaques. Mol. Psychiatry, 20, 1565–1578. [DOI] [PMC free article] [PubMed] [Google Scholar]
- 12. Byers, A.L. and Yaffe, K. (2011) Depression and risk of developing dementia. Nat. Rev. Neurol., 7, 323–331. [DOI] [PMC free article] [PubMed] [Google Scholar]
- 13. Vilalta-Franch, J., López-Pousa, S., Llinàs-Reglà, J., Calvó-Perxas, L., Merino-Aguado, J. and Garre-Olmo, J. (2013) Depression subtypes and 5-year risk of dementia and Alzheimer disease in patients aged 70 years. Int. J. Geriatr. Psychiatry, 28, 341–350. [DOI] [PubMed] [Google Scholar]
- 14. Bethea, C.L., Lu, N.Z., Reddy, A.P., Shlaes, T., Streicher, J.M. and Whittemore, S.R. (2003) Characterization of reproductive steroid receptors and response to estrogen in a rat serotonergic cell line. J. Neurosci. Methods, 127, 31–41. [DOI] [PubMed] [Google Scholar]
- 15. Bethea, C.L. and Reddy, A.P. (2010) Effect of ovarian hormones on genes promoting dendritic spines in laser-captured serotonin neurons from macaques. Mol. Psychiatry, 15, 1034–1044. [DOI] [PMC free article] [PubMed] [Google Scholar]
- 16. Bethea, C.L. and Reddy, A.P. (2012) Effect of ovarian steroids on gene expression related to synapse assembly in serotonin neurons of macaques. J. Neurosci. Res., 90, 1324–1334. [DOI] [PMC free article] [PubMed] [Google Scholar]
- 17. Strac, D.S., Muck-Seler, D. and Pivac, N. (2015) Neurotransmitter measures in the cerebrospinal fluid of patients with Alzheimer's disease: a review. Psychiatr. Danub., 27, 14–24. [PubMed] [Google Scholar]
- 18. Trillo, L., Das, D., Hsieh, W., Medina, B., Moghadam, S., Lin, B., Dang, V., Sanchez, M.M., De Miguel, Z., Ashford, J.W. and Salehi, A. (2013) Ascending monoaminergic systems alterations in Alzheimer's disease: translating basic science into clinical care. Neurosci. Biobehav. Rev., 37, 1363–1379. [DOI] [PubMed] [Google Scholar]
- 19. Meltzer, C.C., Smith, G., DeKosky, S.T., Pollock, B.G., Mathis, C.A., Moore, R.Y., Kupfer, D.J. and Reynolds, C.F., 3rd. (1998) Serotonin in aging, late-life depression, and Alzheimer's disease: the emerging role of functional imaging. Neuropsychopharmacology, 18, 407–430. [DOI] [PubMed] [Google Scholar]
- 20. De Deurwaerdère, P. and Di Giovanni, G. (2020) Serotonin in health and disease. Int. J. Mol. Sci., 21, 3500. [DOI] [PMC free article] [PubMed] [Google Scholar]
- 21. Tavares, G.A., Torres, A. and de Souza, J.A. (2020) Early life stress and the onset of obesity: proof of microRNAs' involvement through modulation of serotonin and dopamine systems' homeostasis. Front. Physiol., 11, 925. [DOI] [PMC free article] [PubMed] [Google Scholar]
- 22. Morin, L.P. (1999) Serotonin and the regulation of mammalian circadian rhythmicity. Ann. Med., 31, 12–33. [DOI] [PubMed] [Google Scholar]
- 23. Zakin, E., Abrams, R. and Simpson, D.M. (2019) Diabetic neuropathy. Semin. Neurol., 39, 560–569. [DOI] [PubMed] [Google Scholar]
- 24. Prabhakar, V., Gupta, D., Kanade, P. and Radhakrishnan, M. (2015) Diabetes-associated depression: the serotonergic system as a novel multifunctional target. Indian J. Pharmacol., 47, 4–10. [DOI] [PMC free article] [PubMed] [Google Scholar]
- 25. Puvill, T., Lindenberg, J., de Craen, A.J., Slaets, J.P. and Westendorp, R.G. (2016) Impact of physical and mental health on life satisfaction in old age: a population based observational study. BMC Geriatr., 16, 194. [DOI] [PMC free article] [PubMed] [Google Scholar]
- 26. Charnay, Y. and Léger, L. (2010) Brain serotonergic circuitries. Dialogues Clin. Neurosci., 12, 471–487. [DOI] [PMC free article] [PubMed] [Google Scholar]
- 27. National Institute of Mental Health (February, 2019) (Data from 2017 National Survey on Drug Use and Health ). The National Institute of Mental Health Information Resource Center, Bethesda, MD, Retrieved from https://www.nimh.nih.gov/health/statistics/major-depression.shtml [Google Scholar]
- 28. Komulainen, K., Gluschkoff, K., Velázquez, R.G., Airaksinen, J., Szmulewicz, A. and Jokela, M. (2020) Association of depressive symptoms with health care utilization in older adults: longitudinal evidence from the survey of health, aging, and retirement in Europe. Int. J. Geriatr. Psychiatry, 36, 521–529. [DOI] [PubMed] [Google Scholar]
- 29. Alexopoulos, G.S., Streim, J., Carpenter, D. and Docherty, J.P. (2004) Expert consensus panel for using antipsychotic drugs in older patients. Using antipsychotic agents in older patients. J. Clin. Psychiatry, 65, 99–105. [PubMed] [Google Scholar]
- 30. Rapp, M.A., Schnaider-Beeri, M., Purohit, D.P., Perl, D.P., Haroutunian, V. and Sano, M. (2008) Increased neurofibrillary tangles in patients with Alzheimer disease with comorbid depression. Am. J. Geriatr. Psychiatry, 16, 168–174. [DOI] [PubMed] [Google Scholar]
- 31. Rapp, M.A., Schnaider-Beeri, M., Grossman, H.T., Sano, M., Perl, D.P., Purohit, D.P., Gorman, J.M. and Haroutunian, V. (2006) Increased hippocampal plaques and tangles in patients with Alzheimer disease with a lifetime history of major depression. Arch. Gen. Psychiatry, 63, 161–167. [DOI] [PubMed] [Google Scholar]
- 32. Wu, K.Y., Lin, K.J., Chen, C.H., Chen, C.S., Liu, C.Y., Huang, S.Y., Yen, T.C. and Hsiao, I.T. (2018) Diversity of neurodegenerative pathophysiology in nondemented patients with major depressive disorder: evidence of cerebral amyloidosis and hippocampal atrophy. Brain Behav., 8, e01016. [DOI] [PMC free article] [PubMed] [Google Scholar]
- 33. Li, P., Hsiao, I.T., Liu, C.Y., Chen, C.H., Huang, S.Y., Yen, T.C., Wu, K.Y. and Lin, K.J. (2017) Beta-amyloid deposition in patients with major depressive disorder with differing levels of treatment resistance: a pilot study. EJNMMI Res., 7, 24. [DOI] [PMC free article] [PubMed] [Google Scholar]
- 34. Sun, X., Chiu, C.C., Liebson, E., Crivello, N.A., Wang, L., Claunch, J., Folstein, M., Rosenberg, I., Mwamburi, D.M., Peter, I. and Qiu, W.Q. (2009) Depression and plasma amyloid beta peptides in the elderly with and without the apolipoprotein E4 allele. Alzheimer Dis. Assoc. Disord., 23, 238–244. [DOI] [PMC free article] [PubMed] [Google Scholar]
- 35. Metti, A.L., Cauley, J.A., Newman, A.B., Ayonayon, H.N., Barry, L.C., Kuller, L.M., Satterfield, S., Simonsick, E.M. and Yaffe, K. (2013) Plasma beta amyloid level and depression in older adults. J. Gerontol. A Biol. Sci. Med. Sci., 68, 74–79. [DOI] [PMC free article] [PubMed] [Google Scholar]
- 36. Lin, M.T., Simon, D.K., Ahn, C.H., Kim, L.M. and Beal, M.F. (2002) High aggregate burden of somatic mtDNA point mutations in aging and Alzheimer's disease brain. Hum. Mol. Genet., 11, 133–145. [DOI] [PubMed] [Google Scholar]
- 37. Coskun, P.E., Beal, M.F. and Wallace, D.C. (2004) Alzheimer's brains harbor somatic mtDNA control-region mutations that suppress mitochondrial transcription and replication. Proc. Natl. Acad. Sci. U. S. A., 101, 10726–10731. [DOI] [PMC free article] [PubMed] [Google Scholar]
- 38. Coskun, P., Wyrembak, J., Schriner, S.E., Chen, H.W., Marciniack, C., Laferla, F. and Wallace, D.C. (2012) A mitochondrial etiology of Alzheimer and Parkinson disease. Biochim. Biophys. Acta, 1820, 553–564. [DOI] [PMC free article] [PubMed] [Google Scholar]
- 39. Reddy, P.H., McWeeney, S., Park, B.S., Manczak, M., Gutala, R.V., Partovi, D., Jung, Y., Yau, V., Searles, R., Mori, M. and Quinn, J. (2004) Gene expression profiles of transcripts in amyloid precursor protein transgenic mice: up-regulation of mitochondrial metabolism and apoptotic genes is an early cellular change in Alzheimer's disease. Hum. Mol. Genet., 13, 1225–1240. [DOI] [PubMed] [Google Scholar]
- 40. Manczak, M., Park, B.S., Jung, Y. and Reddy, P.H. (2004) Differential expression of oxidative phosphorylation genes in patients with Alzheimer's disease: implications for early mitochondrial dysfunction and oxidative damage. Neuromolecular Med., 5, 147–162. [DOI] [PubMed] [Google Scholar]
- 41. Wang, X., Su, B., Siedlak, S.L., Moreira, P.I., Fujioka, H., Wang, Y., Casadesus, G. and Zhu, X. (2008) Amyloid-beta overproduction causes abnormal mitochondrial dynamics via differential modulation of mitochondrial fission/fusion proteins. Proc. Natl. Acad. Sci. U. S. A., 105, 19318–19323. [DOI] [PMC free article] [PubMed] [Google Scholar]
- 42. Wang, X., Su, B., Lee, H.G., Li, X., Perry, G., Smith, M.A. and Zhu, X. (2009a) Impaired balance of mitochondrial fission and fusion in Alzheimer's disease. J. Neurosci., 29, 9090–9103. [DOI] [PMC free article] [PubMed] [Google Scholar]
- 43. Manczak, M., Mao, P., Calkins, M.J., Cornea, A., Reddy, A.P., Murphy, M.P., Szeto, H.H., Park, B. and Reddy, P.H. (2010) Mitochondria-targeted antioxidants protect against amyloid-beta toxicity in Alzheimer's disease neurons. J. Alzheimers Dis., 20, S609–S631. [DOI] [PMC free article] [PubMed] [Google Scholar]
- 44. Manczak, M., Calkins, M.J. and Reddy, P.H. (2011) Impaired mitochondrial dynamics and abnormal interaction of amyloid beta with mitochondrial protein Drp1 in neurons from patients with Alzheimer's disease: implications for neuronal damage. Hum. Mol. Genet., 20, 2495–2509. [DOI] [PMC free article] [PubMed] [Google Scholar]
- 45. Silva, D.F., Selfridge, J.E., Lu, J., Lezi, E., Roy, N., Hutfles, L., Burns, J.M., Michaelis, E.K., Yan, S., Cardoso, S.M. and Swerdlow, R.H. (2013) Bioenergetic flux, mitochondrial mass and mitochondrial morphology dynamics in AD and MCI cybrid cell lines. Hum. Mol. Genet., 22, 3931–3946. [DOI] [PMC free article] [PubMed] [Google Scholar]
- 46. Reddy, P.H., Manczak, M., Yin, X., Grady, M.C., Mitchell, A., Kandimalla, R. and Kuruva, C.S. (2016) Protective effects of a natural product, curcumin, against amyloid β induced mitochondrial and synaptic toxicities in Alzheimer's disease. J. Invest. Med., 64, 1220–1234. [DOI] [PMC free article] [PubMed] [Google Scholar]
- 47. Reddy, P.H., Manczak, M. and Yin, X. (2017) Mitochondria-division inhibitor 1 protects against amyloid-β induced mitochondrial fragmentation and synaptic damage in Alzheimer's disease. J. Alzheimers Dis., 58, 147–162. [DOI] [PMC free article] [PubMed] [Google Scholar]
- 48. Swerdlow, N.S. and Wilkins, H.M. (2020) Mitophagy and the brain. Int. J. Mol. Sci., 21, 9661. [DOI] [PMC free article] [PubMed] [Google Scholar]
- 49. Reddy, A.P., Yin, X., Sawant, N. and Reddy, P.H. (2021) Protective effects of anti-depressant citalopram against abnormal APP processing and amyloid beta-induced mitochondrial dynamics, biogenesis, mitophagy and synaptic toxicities in Alzheimer's disease. Hum. Mol. Genet. doi: 10.1093/hmg/ddab054. [DOI] [PMC free article] [PubMed] [Google Scholar]
- 50. Hirai, K., Aliev, G., Nunomura, A., Fujioka, H., Russell, R.L., Atwood, C.S., Johnson, A.B., Kress, Y., Vinters, H.V., Tabaton, M. et al. (2001) Mitochondrial abnormalities in Alzheimer's disease. J. Neurosci., 21, 3017–3023. [DOI] [PMC free article] [PubMed] [Google Scholar]
- 51. Wang, X., Su, B., Zheng, L., Perry, G., Smith, M.A. and Zhu, X. (2009) The role of abnormal mitochondrial dynamics in the pathogenesis of Alzheimer's disease. J. Neurochem., 109, 153–159. [DOI] [PMC free article] [PubMed] [Google Scholar]
- 52. Manczak, M., Kandimalla, R., Yin, X. and Reddy, P.H. (2018) Hippocampal mutant APP and amyloid beta-induced cognitive decline, dendritic spine loss, defective autophagy, mitophagy and mitochondrial abnormalities in a mouse model of Alzheimer's disease. Hum. Mol. Genet., 27, 1332–1342. [DOI] [PMC free article] [PubMed] [Google Scholar]
- 53. Calkins, M.J., Manczak, M., Mao, P., Shirendeb, U. and Reddy, P.H. (2011) Impaired mitochondrial biogenesis, defective axonal transport of mitochondria, abnormal mitochondrial dynamics and synaptic degeneration in a mouse model of Alzheimer's disease. Hum. Mol. Genet., 20, 4515–4529. [DOI] [PMC free article] [PubMed] [Google Scholar]
- 54. Reddy, P.H., Tripathi, R., Troung, Q., Tirumala, K., Reddy, T.P., Anekonda, V., Shirendeb, U.P., Calkins, M.J., Reddy, A.P., Mao, P. and Manczak, M. (2012) Abnormal mitochondrial dynamics and synaptic degeneration as early events in Alzheimer's disease: implications to mitochondria-targeted antioxidant therapeutics. Biochim. Biophys. Acta, 1822, 639–649. [DOI] [PMC free article] [PubMed] [Google Scholar]
- 55. Wang, W., Zhao, F., Ma, X., Perry, G. and Zhu, X. (2020) Mitochondria dysfunction in the pathogenesis of Alzheimer's disease: recent advances. Mol. Neurodegener., 15, 30. [DOI] [PMC free article] [PubMed] [Google Scholar]
- 56. Wang, W., Yin, J., Ma, X., Zhao, F., Siedlak, S.L., Wang, Z., Torres, S., Fujioka, H., Xu, Y., Perry, G. and Zhu, X. (2017) Inhibition of mitochondrial fragmentation protects against Alzheimer's disease in rodent model. Hum. Mol. Genet., 26, 4118–4131. [DOI] [PMC free article] [PubMed] [Google Scholar]
- 57. Calkins, M.J. and Reddy, P.H. (2011) Amyloid beta impairs mitochondrial anterograde transport and degenerates synapses in Alzheimer's disease neurons. Biochim. Biophys. Acta, 1812, 507–513. [DOI] [PMC free article] [PubMed] [Google Scholar]
- 58. Reddy, P.H., Yin, X., Manczak, M., Kumar, S., Pradeepkiran, J.A., Vijayan, M. and Reddy, A.P. (2018) Mutant APP and amyloid beta-induced defective autophagy, mitophagy, mitochondrial structural and functional changes and synaptic damage in hippocampal neurons from Alzheimer's disease. Hum. Mol. Genet., 27, 2502–2516. [DOI] [PMC free article] [PubMed] [Google Scholar]
- 59. Kandimalla, R., Manczak, M., Yin, X., Wang, R. and Reddy, P.H. (2018) Hippocampal phosphorylated tau induced cognitive decline, dendritic spine loss and mitochondrial abnormalities in a mouse model of Alzheimer's disease. Hum. Mol. Genet., 27, 30–40. [DOI] [PMC free article] [PubMed] [Google Scholar]
- 60. Von Linstow, C.U., Severino, M., Metaxas, A., Waider, J., Babcock, A.A., Lesch, K.P., Gramsbergen, J.B. and Finsen, B. (2017) Effect of aging and Alzheimer's disease-like pathology on brain monoamines in mice. Neurochem. Int., 108, 238–245. [DOI] [PubMed] [Google Scholar]
- 61. Zhang, Q., Yang, C., Liu, T., Liu, L., Li, F., Cai, Y., Lv, K., Li, X., Gao, J., Sun, D. et al. (2018) Citalopram restores short-term memory deficit and non-cognitive behaviors in APP/PS1 mice while halting the advance of Alzheimer's disease-like pathology. Neuropharmacology, 131, 475–486. [DOI] [PubMed] [Google Scholar]
- 62. Cirrito, J.R., Wallace, C.E., Yan, P., Davis, T.A., Gardiner, W.D., Doherty, B.M., King, D., Yuede, C.M., Lee, J.M. and Sheline, Y.I. (2020) Effect of escitalopram on Aβ levels and plaque load in an Alzheimer mouse model. Neurology, 95, e2666–e2674. [DOI] [PMC free article] [PubMed] [Google Scholar]
- 63. Volloch, V., Olsen, B. and Rits, S. (2020) Alzheimer's disease prevention and treatment: case for optimism. Ann. Integr. Mol. Med., 2, 115–130. [DOI] [PMC free article] [PubMed] [Google Scholar]
- 64. Xu, H., Wang, Z., Zhu, L., Sui, Z., Bi, W., Liu, R., Bi, K. and Li, Q. (2018) Targeted neurotransmitters profiling identifies metabolic signatures in rat brain by LC-MS/MS: application in insomnia, depression and Alzheimer's disease. Molecules, 23, 2375. [DOI] [PMC free article] [PubMed] [Google Scholar]
- 65. Sheline, Y.I., West, T., Yarasheski, K., Swarm, R., Jasielec, M.S., Fisher, J.R., Ficker, W.D., Yan, P., Xiong, C., Frederiksen, C. et al. (2014) An antidepressant decreases CSF Aβ production in healthy individuals and in transgenic AD mice. Sci. Transl. Med., 6, 236re4. [DOI] [PMC free article] [PubMed] [Google Scholar]
- 66. Shirendeb, U., Reddy, A.P., Manczak, M., Calkins, M.J., Mao, P., Tagle, D.A. and Reddy, P.H. (2011, 2011) Abnormal mitochondrial dynamics, mitochondrial loss and mutant huntingtin oligomers in Huntington's disease: implications for selective neuronal damage. Hum. Mol. Genet., 20, 1438–1455. [DOI] [PMC free article] [PubMed] [Google Scholar]
- 67. Shirendeb, U.P., Calkins, M.J., Manczak, M., Anekonda, V., Dufour, B., McBride, J.L., Mao, P. and Reddy, P.H. (2012) Mutant huntingtin's interaction with mitochondrial protein Drp1 impairs mitochondrial biogenesis and causes defective axonal transport and synaptic degeneration in Huntington's disease. Hum. Mol. Genet., 21, 406–420. [DOI] [PMC free article] [PubMed] [Google Scholar]
- 68. Bhatti, J.S., Thamarai, K., Kandimalla, R., Manczak, M., Yin, X., Kumar, S., Vijayan, M. and Reddy, P.H. (2021) Mitochondria-targeted small peptide, SS31 ameliorates diabetes induced mitochondrial dynamics in male TallyHO/JngJ mice. Mol. Neurobiol., 58, 795–808. [DOI] [PMC free article] [PubMed] [Google Scholar]
- 69. Bhatti, J.S., Tamarai, K., Kandimalla, R., Manczak, M., Yin, X., Ramasubramanian, B., Sawant, N., Pradeepkiran, J.A., Vijayan, M., Kumar, S. and Reddy, P.H. (2021) Protective effects of a mitochondria-targeted small peptide SS31 against hyperglycemia-induced mitochondrial abnormalities in the liver tissues of diabetic mice, Tallyho/JngJ mice. Mitochondrion, 58, 49–58. [DOI] [PubMed] [Google Scholar]
- 70. Joshi, A.U., Minhas, P.S., Liddelow, S.A., Haileselassie, B., Andreasson, K.I., Dorn, G.W., 2nd. and Mochly-Rosen, D. (2019) Fragmented mitochondria released from microglia trigger A1 astrocytic response and propagate inflammatory neurodegeneration. Nat. Neurosci., 22, 1635–1648. [DOI] [PMC free article] [PubMed] [Google Scholar]
- 71. Kuperberg, M., Greenebaum, S.L.A. and Nierenberg, A.A. (2020) Targeting mitochondrial dysfunction for bipolar disorder. Curr. Top. Behav. Neurosci., 48, 61–99. [DOI] [PubMed] [Google Scholar]
- 72. Manczak, M. and Reddy, P.H. (2012) Abnormal interaction between the mitochondrial fission protein Drp1 and hyperphosphorylated tau in Alzheimer's disease neurons: implications for mitochondrial dysfunction and neuronal damage. Hum. Mol. Genet., 21, 2538–2547. [DOI] [PMC free article] [PubMed] [Google Scholar]
- 73. Pradeepkiran, J.A. and Reddy, P.H. (2020) Defective mitophagy in Alzheimer's disease. Ageing Res. Rev., 64, 101191. [DOI] [PMC free article] [PubMed] [Google Scholar]
- 74. Hsiao, K., Chapman, P., Nilsen, S., Eckman, C., Harigaya, Y., Younkin, S., Yang, F. and Cole, G. (1996) Correlative memory deficits, Abeta elevation, and amyloid plaques in transgenic mice. Science, 274, 99–102. [DOI] [PubMed] [Google Scholar]
- 75. Sturchler-Pierrat, C., Abramowski, D., Duke, M., Wiederhold, K.H., Mistl, C., Rothacher, S., Ledermann, B., Bürki, K., Frey, P., Paganetti, P.A. et al. (1997) Two amyloid precursor protein transgenic mouse models with Alzheimer disease-like pathology. Proc. Natl. Acad. Sci. U. S. A., 94, 13287–13292. [DOI] [PMC free article] [PubMed] [Google Scholar]
- 76. Manczak, M., Kandimalla, R., Fry, D., Sesaki, H. and Reddy, P.H. (2016) Protective effects of reduced dynamin-related protein 1 against amyloid beta-induced mitochondrial dysfunction and synaptic damage in Alzheimer's disease. Hum. Mol. Genet., 25, 5148–5166. [DOI] [PMC free article] [PubMed] [Google Scholar]
- 77. Deacon, R.M. (2013) Measuring motor coordination in mice. J. Vis. Exp., 29, e2609. [DOI] [PMC free article] [PubMed] [Google Scholar]
- 78. Vijayan, M., Bose, C. and Reddy, P.H. (2021) Anti-aging effects of small molecule inhibitor DDQ. Mol. Neurobiol. (in press). doi: 10.1007/s12035-021-02360-7. [DOI] [PubMed] [Google Scholar]
- 79. Hegde, V., Vijayan, M., Kumar, S., Akheruzzaman, M., Sawant, N., Dhurandhar, N.V. and Reddy, P.H. (2019) Adenovirus 36 improves glycemic control and markers of Alzheimer's disease pathogenesis. Biochim. Biophys. Acta Mol. basis Dis., 1865, 165531. [DOI] [PubMed] [Google Scholar]