Abstract
Objective
To test the hypothesis that glutamate and GABA are linked to the formation of epilepsy networks and the triggering of spontaneous seizures, we examined seizure initiation/propagation characteristics and neurotransmitter levels during epileptogenesis in a translationally relevant rodent model of mesial temporal lobe epilepsy.
Methods
The glutamine synthetase (GS) inhibitor methionine sulfoximine was infused into one of the hippocampi in laboratory rats to create a seizure focus. Long-term video-intracranial EEG recordings and brain microdialysis combined with mass spectrometry were used to examine seizure initiation, seizure propagation, and extracellular brain levels of glutamate and GABA.
Results
All seizures (n = 78 seizures, n = 3 rats) appeared first in the GS-inhibited hippocampus of all animals, followed by propagation to the contralateral hippocampus. Propagation time decreased significantly from 11.65 seconds early in epileptogenesis (weeks 1–2) to 6.82 seconds late in epileptogenesis (weeks 3–4, paired t test, p = 0.025). Baseline extracellular glutamate levels were 11.6-fold higher in the hippocampus of seizure propagation (7.3 µM) vs the hippocampus of seizure onset (0.63 µM, analysis of variance/Fisher least significant difference, p = 0.01), even though the concentrations of the major glutamate transporter proteins excitatory amino acid transporter subtypes 1 and 2 and xCT were unchanged between the brain regions. Finally, extracellular GABA in the seizure focus decreased significantly from baseline several hours before a spontaneous seizure (paired t test/false discovery rate).
Conclusion
The changes in glutamate and GABA suggest novel and potentially important roles of the amino acids in epilepsy network formation and in the initiation and propagation of spontaneous seizures.
Focal epilepsies are characterized by spontaneous recurrent seizures that originate from discrete brain regions and sometimes propagate throughout the brain via neuronal and possibly glial networks called the epilepsy network.1 Although the anatomic, chemical, and electrophysiologic substrates of the epilepsy network are poorly understood, it likely develops over time in a process we refer to as network plasticity.2-5 It has been argued that network plasticity plays a key role in the progression of epilepsy by changing the seizure phenotype and response to antiseizure drugs, by forming new seizure foci, and by facilitating comorbid conditions.4 A detailed understanding of the mechanisms underlying network plasticity is important because the data obtained could lead to novel interventions.
Here, we used brain microdialysis and intracranial depth electrode EEG to investigate the neurochemical and electrophysiologic characteristics of the developing epilepsy network in a translational model of mesial temporal lobe epilepsy (MTLE). In this model, unilateral hippocampal astroglial glutamine synthetase (GS) inhibition results in the generation of a seizure focus.6-8 The study focused on both hippocampi because they are considered to be 2 important nodes of an emerging epilepsy network.9 We speculated that the seizures would originate from the GS-inhibited hippocampus and propagate to the contralateral hippocampus.10,11 Moreover, because GS is thought to be important for clearance of extracellular glutamate released during excitatory neurotransmission, we hypothesized that the extracellular glutamate levels would be increased at baseline and during spontaneous seizures in the GS-inhibited hippocampus, consistent with prior studies of patients with refractory MTLE.12-14
Methods
GS Inhibition Model of MTLE and Surgery
Male Sprague-Dawley rats (400–500 g, Harlan, Indianapolis, IN) were randomly assigned to 2 groups and implanted with an osmotic pump that delivered either a continuous infusion of the GS inhibitor methionine sulfoximine (MSO) into the right hippocampus (MSO 2.5 mg/mL dissolved in Dulbecco phosphate-buffered saline [PBS]) or PBS, as detailed in prior studies.6-8 The translational relevance of the MSO model lies in the facts that (1) GS is deficient in the seizure onset area, particularly the hippocampus, in patients with MTLE14,15; (2) GS is important for metabolism of the seizure-triggering compounds glutamate and ammonia16; and (3) chemical inhibition or genetic knockout of GS in the hippocampus of rats and mice causes an epileptic syndrome similar to MTLE.6-8,17 There is a variable degree of neuronal loss in this model, with most animals exhibiting minimal neuronal loss in the MSO-infused hippocampus and no significant neuronal loss in the contralateral hippocampus.7,8 In the microdialysis study, all MSO- and PBS-infused rats had 2 epidural stainless steel screw electrodes positioned over the left and right dorsal hippocampus to record the EEG. The microdialysis guide cannula was targeted to the dentate gyrus of both hemispheres in 7 of the MSO-infused and 4 of the PBS-infused rats. For the seizure propagation study, 3 MSO-infused animals were implanted with unipolar stainless steel depth electrodes bilaterally targeted to the dentate gyrus to quantify seizure onset and spread between the 2 structures. The depth electrode animals were not subjected to microdialysis. To avoid tangling with the EEG cables and dialysis tubes, all rats were housed individually in the same temperature- and humidity-controlled room, with free access to food and water. All animals were kept on a strict 12:12-hour cycle with lights on at 7 am and off at 7 pm.
Video-EEG Recordings
Continuous video-EEG recordings began in all implanted animals as soon as they woke up from surgery. Seizures were identified by visual inspection of the EEG record. As detailed in reference 6, seizures seizures were defined by video-EEG characteristics and by the duration of the discharge. Specifically, there were distinct signal changes from background (interictal) activity during seizures. These changes included sustained rhythmic or spiking EEG patterns and a clear evolution of amplitude and frequency characteristics from seizure onset to termination. Subclinical seizures were distinguished from clinical seizures by examination of the video record. The onset and termination of seizures were identified by the following commonly used method. By visual inspection of the EEG, we determined a point that was unequivocally within the seizure. Next, we moved backward in time to determine the seizure start time as the first point where the EEG was different from background activity and forward in time to establish the seizure end time. The video record was examined to stage the seizures, using a modification of the Racine et al.18 criteria, as follows: subclinical, no remarkable behavior; stage 1, immobilization, eye blinking, twitching of vibrissae, and mouth movements; stage 2, head nodding, often accompanied by facial clonus; stage 3, forelimb clonus; stage 4, rearing; and stage 5, rearing, falling and generalized convulsions. For determination of time to seizure propagation to the contralateral hippocampus, 3 reviewers independently determined the time of seizure onset in the 2 hippocampi during the first 4 weeks of epileptogenesis. The mean of the propagation time defined by each of the 3 reviewers for each seizure was considered to be the time taken for seizure propagation from the ipsilateral hippocampus to the contralateral hippocampus for that particular seizure. All of the GS-inhibited rats and none of the PBS-infused control rats exhibited recurrent seizures. This observation is consistent with our accumulated long-term video EEG recordings of >100 GS-inhibited and 100 control rats, in which recurrent seizures occur in >95% in GS-inhibited rats and <2% in control rats.6-8
Microdialysis
Two weeks after surgery, continuous microdialysis was carried out over a period of 7 days or until dialysate flow was lost. EEG was monitored during the dialysis collections. An Eicom AZ-4-3 (London, UK) microdialysis probe (molecular weight cutoff 30 kDa) was introduced into the guide cannula and perfused at a rate of 0.5 µL/min with sterile artificial extracellular fluid. Samples were collected in 1-hour aliquots and stored at −80°C until analysis.
Histology
After the completion of both the microdialysis and seizure propagation studies, rats were anesthetized with isoflurane and perfusion fixed with 4% formaldehyde in 0.1 M phosphate buffer, pH 7.4. The brains were sectioned on a Vibratome, with some sections being stained with cresyl violet to determine the locations of the MSO infusion cannula, microdialysis probe, and depth electrode implants.
Western Blotting
On the 17th day after pump implantation (matching the time of microdialysis measurements), 13 MSO- and 13-PBS infused rats were anesthetized with isoflurane and decapitated. Ipsilateral and contralateral whole hippocampi and frontal cortices were removed, frozen, and homogenized. Protein concentration was determined by the Lowry assay. For gel electrophoresis,19 20 and 12 µg total protein was loaded to each lane for detection of xCT and detection of excitatory amino acid transporter subtypes 1 (EAAT1) and 2 (EAAT2), respectively. Ponceau staining confirmed equal protein loading to each lane. For immunoblotting, highly specific antibodies against EAAT1, EAAT2, and xCT were used to detect the respective transporters.20,21 In total, we compared the ipsilateral and contralateral concentrations of the transporters in the hippocampi and frontal cortices of 4 MSO-infused and 4 PBS-infused animals and further analyzed the hippocampal concentrations of the transporters in 9 more MSO-infused animals (n = 13).
Amino Acid Measurements
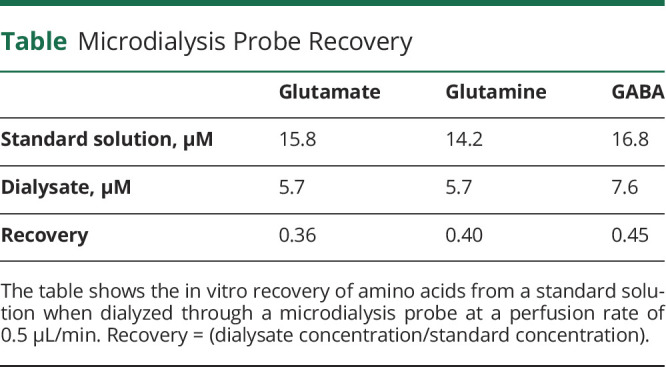
Amino acid levels were determined in samples collected on the third day of microdialysis, and the average concentration from hours 53 to 58 was used for analysis. This time was used to minimize the effects of acute tissue injury and blood-brain barrier disruption on amino acid concentrations. Amino acids were quantified in the microdialysis samples with the AccQ-Tag Ultra Derivatization Kit (Waters, Milford, MA), followed by liquid chromatography–tandem mass spectrometry as described in reference 19. The amino acid concentration measured in the dialysis fluid was converted to an estimated true brain concentration using the following formula: microdialysis concentration/recovery (from the table). All absolute concentrations shown in the Results are estimated true brain concentrations.
Table.
Microdialysis Probe Recovery
Statistical Analysis
A 2-tailed paired t-test was conducted to compare delay in seizure propagation from ipsilateral dentate gyrus to contralateral dentate gyrus in the early and late time periods. A 1-way analysis of variance was first used to compare mean basal levels of neurochemicals (glutamate, glutamine, and GABA) between the MSO and PBS groups, followed by the Fisher least significant difference test. For assessment of seizure-associated changes in glutamate, GABA, and glutamine, we identified 7 seizures that were at least 6 hours away from each other in 3 MSO-infused animals. All other seizures were <6 hours away from each other and were excluded from the analysis to minimize the effects of recent seizures on the preseizure baseline and postseizure adjustment to baseline. We defined the fifth hour before the seizure as the baseline. Using a 2-tailed paired t test, we compared this baseline time point to each subsequent hour for the next 10 hours, including the hour containing the seizure. To correct for multiple comparisons, a false discovery rate of 5% was used. Amino acid concentrations were expressed as a ratio of the sample collected during baseline, with baseline = 1 in all animals. Time-matched samples from the PBS-infused rats were used as controls. The densitometry data from immunoblotting were used to calculate the labeling intensity of a given glutamate transporter antibody in a protein extract from the ipsilateral hippocampus relative to that of the contralateral hippocampus. The mean ipsilateral/contralateral ratio was calculated for each animal. The animals were grouped based on according to MSO or PBS infusion. For each transporter analyzed, the mean ipsilateral/contralateral ratio in each group was calculated, and the difference between the means was evaluated with a paired t test. For all tests, a value of p < 0.05 was regarded as statistically significant.
Blinding
The investigator performing the surgery (R.D.) was aware of the experimental group allocations; however, the other investigators were blinded to the group identity when performing EEG analysis and amino acid analysis.
Standard Protocol Approvals, Registrations, and Patient Consents
All procedures were approved by the Institutional Animal Care and Use Committee at Yale University.
Data Availability
Data not provided in the article will be made available at the request of other investigators for purposes of replicating procedures and results.
Results
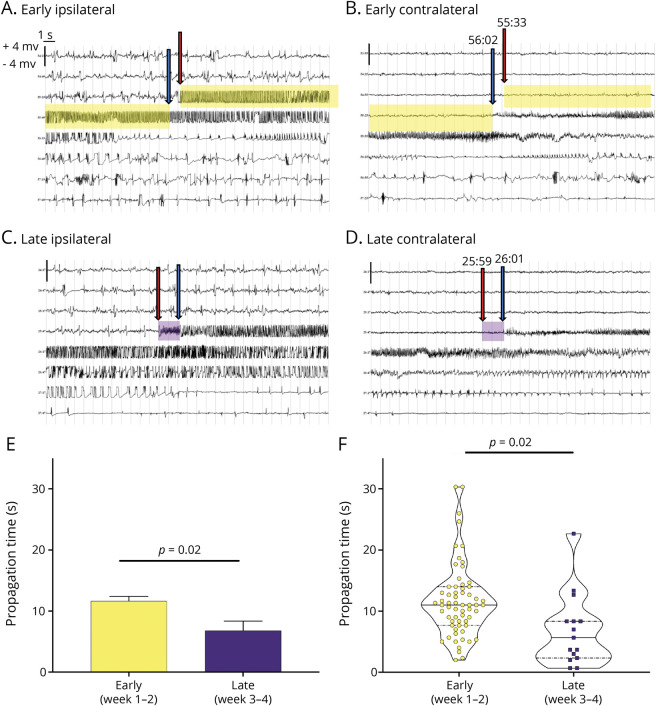
To determine seizure onset and propagation characteristics during epileptogenesis, a total of 98 seizures were captured from 3 epileptic animals for up to 4 weeks of continuous EEG recordings. Of the 98 seizures, 20 were excluded before analysis for technical reasons (e.g., EEG too noisy for accurate determination of the seizure onset). All the analyzed seizures (78 of 78) appeared first in the GS-inhibited hippocampus, followed in all cases by propagation to the contralateral hippocampus after an average delay (time to propagation) of 10.72 ± 6.2 seconds (figure 1). The placements of infusion cannula and unipolar depth electrodes are depicted in figure 2.
Figure 1. Seizure Propagation Time Decreases During Epileptogenesis.
(A–D) Representative EEG traces from individual depth electrodes placed in the methionine sulfoximine (MSO)-infused (i.e., glutamine synthetase [GS]–inhibited, ipsilateral”hippocampus, left panels) and contralateral noninfused hippocampus (right panels) during early (A and B) and late (C and D) epileptogenesis. During early epileptogenesis, the seizure starts first in the ipsilateral hippocampus (red arrow in A) and appears next in the contralateral hippocampus (blue arrow) after a delay (propagation time) of 29 seconds (yellow highlight). Later in epileptogenesis, the seizure also starts in the GS-inhibited hippocampus (red arrow in C) followed by appearance in the contralateral hippocampus (blue arrow in D); however, the propagation time is much shorter (2 seconds, purple highlight). The time of the initiation and end of the propagation time is marked above the blue and red arrows. (E and F) Analysis of a total of 78 spontaneous seizures combined from the MSO-infused rats implanted with depth electrodes (n = 3) shows a statistically significant decrease in propagation time from early (11.65 seconds) to late (6.82 seconds, p = 0.02) epileptogenesis. Each EEG trace shows 240 seconds of continuous (long-string) data. The scale on the y-axis is from −4 to +4 mV, and the light vertical lines demarcate each second of the EEG.
Figure 2. Placements of Unipolar Depth Electrodes.
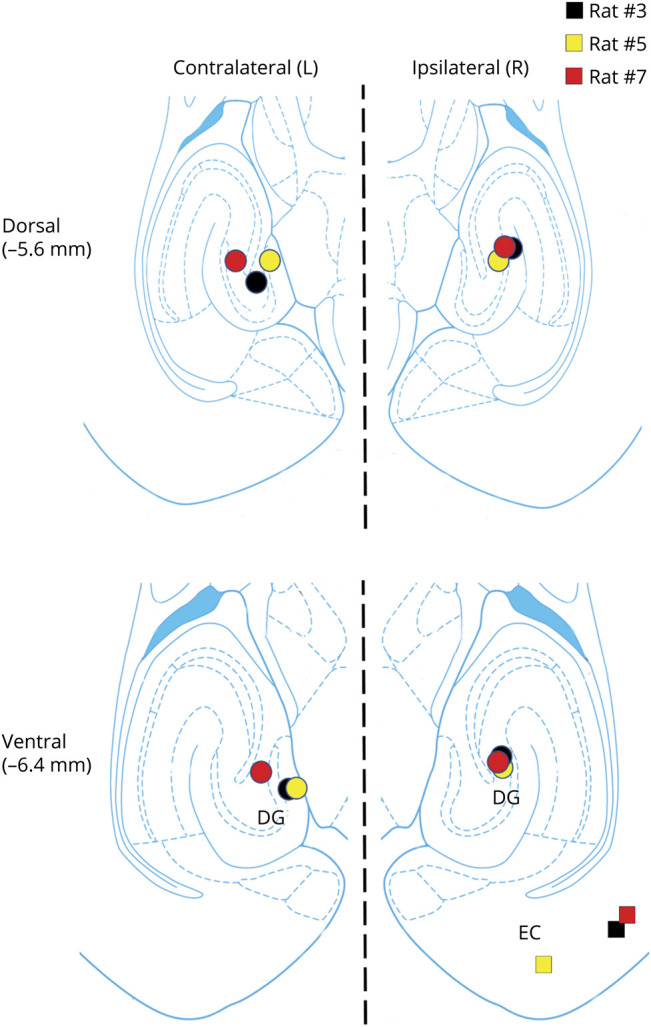
Bottom and top diagrams depict the locations of the methionine sulfoximine (MSO) infusion cannulas (colored squares) and depth electrodes (colored circles) within the rat entorhinal-hippocampal region at 2 different dorsoventral levels (−5.6 and −6.4 mm from the skull). All infusion cannulas were placed in the right (ipsilateral) entorhinal-hippocampal region. Depth electrodes were placed in the right and left (contralateral) hippocampi. DG = dentate gyrus; EC = entorhinal cortex.
To investigate whether the time to propagation changed during epileptogenesis, we compared the early epileptogenic period (i.e., weeks 1 and 2 after surgery) with the late period (i.e., weeks 3 and 4 after surgery). The time to propagation was >40% shorter late in epileptogenesis (11.65 ± 5.96 seconds vs 6.82 ± 5.91 seconds, p = 0.025). Moreover, the shortest time to propagation was approximately 670 milliseconds, which was seen in 2 animals during the late period (figure 1).
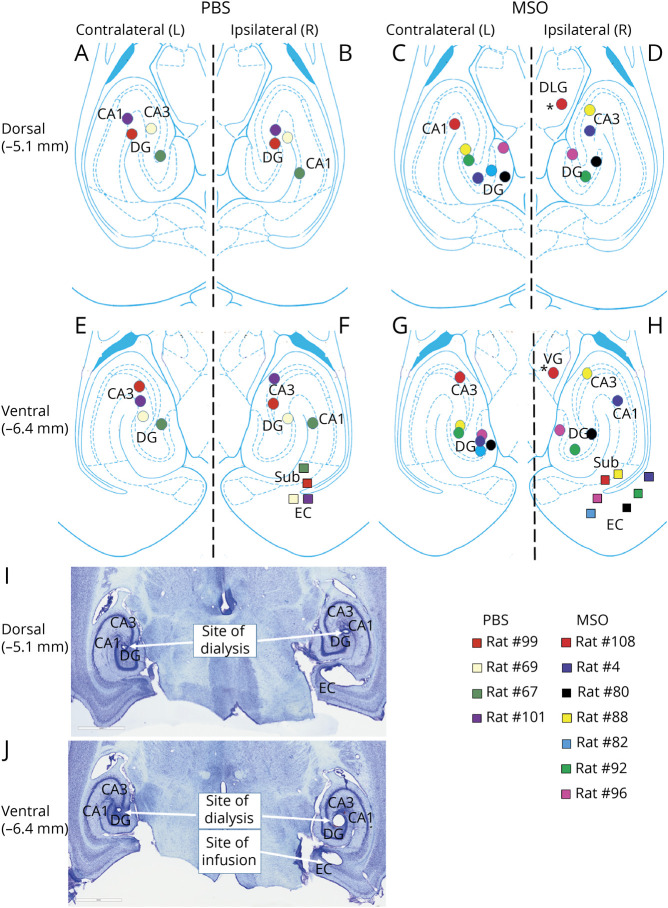
Because of the roles of GS in the homeostasis of glutamate, glutamine, and GABA,16 we next quantified the basal (>6 hours away from a seizure) extracellular levels of each amino acid in both hippocampi from epileptic and control rats during the second week of epileptogenesis. The placements of infusion cannulas and microdialysis probes are depicted in figure 3, and the recovery of amino acids from the dialysis membrane is shown in the table. Because there was no significant difference in amino acid levels between the 2 hippocampi in the control animals (Student t test; p = 0.53 for glutamate, p = 0.66 for glutamine, and p = 0.86 for GABA), all hippocampi in the controls were treated as 1 experimental group (figure 4). One probe not located in the hippocampus was omitted from the analysis. One-way analysis of variance indicated a main effect of group (i.e., ipsilateral control vs contralateral GS inhibition vs bilateral control) for glutamate (F2,5 = 4.74, p = 0.02; figure 4A) and glutamine (F2, 5 = 6.82, p = 0.007; figure 4B) but not for GABA (figure 4C). Glutamate was not significantly increased in the GS-inhibited hippocampus vs the corresponding hippocampus in the controls. Instead, glutamate was 11.6-fold higher in the hippocampus contralateral to GS inhibition (i.e., region of seizure propagation, 7.3 ± 2.6 µM) vs the GS-inhibited hippocampus (i.e., region of seizure onset, 0.63 ± 0.50 µM, p = 0.01). Moreover, glutamate was 3.8-fold higher in the hippocampus of seizure propagation vs the hippocampi of control rats (1.9 ± 0.76 µM, p = 0.02; figure 4A). Glutamine was significantly lower in both the ipsilateral (6.8 ± 1.6 µM) and contralateral (13.9 ± 7.4 µM) hippocampi in the epileptic rats compared to the controls (43.0 ± 8.4 µM, p = 0.004 and p = 0.01, respectively; figure 4B).
Figure 3. Placements of Infusion Cannulas and Microdialysis Probes.
(A–H) Locations of the phosphate-buffered saline (PBS)/methionine sulfoximine (MSO) infusion cannulas (colored squares) and microdialysis probes (colored circles) within the rat entorhinal-hippocampal region at 2 different dorsoventral levels (−5.1 and −6.4 mm from the skull). All infusion cannulas were placed in the right (ipsilateral) entorhinal-hippocampal region. Microdialysis probes were placed in the right and left (contralateral) hippocampi. One probe was outside the hippocampus (asterisks) and was excluded from the analysis. (I and J) Representative Nissl-stained sections of the sites of dialysis and infusion. CA1 and 3 = Cornu Ammonis subfields 1 and 3; DG = dentate gyrus; DLG = dorsolateral geniculate nucleus of the thalamus; Sub = subiculum; VG = ventral geniculate nucleus of the thalamus.
Figure 4. Basal Extracellular Glutamate Level Is Markedly Elevated in the Seizure Propagated Hippocampus.
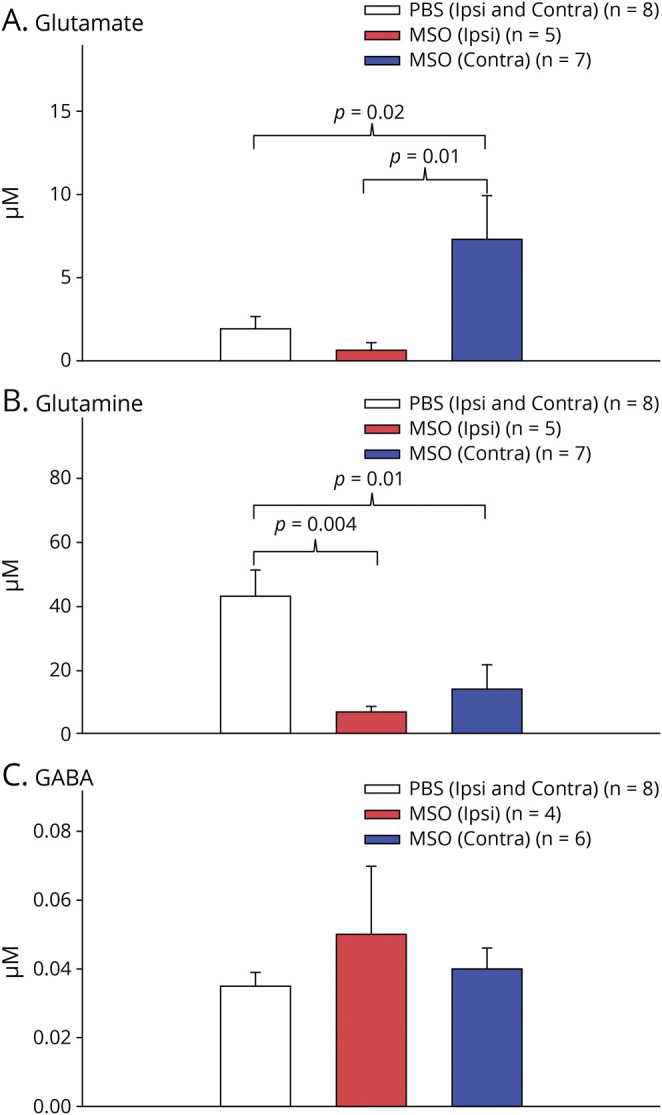
Bar graphs depict the average basal (i.e., >6 hours away from a seizure) hippocampal levels of (A) glutamate, (B) glutamine, and (C) GABA. Levels from both hippocampi in nonepileptic (phosphate-buffered saline [PBS]; n = 4) control rats were combined into 1 group because there was no significant concentration difference between the left and right sides. Levels from both hippocampi in epileptic rats (methionine sulfoximine [MSO]; n = 7) were analyzed separately. Note the dramatic increase in glutamate in the hippocampus of seizure propagation (MSO contralateral [contra], blue bar in A) vs the hippocampus of seizure onset (MSO ipsilateral [ipsi], red bar in A) and the nonepileptic hippocampi (PBS ipsi and contra, white bar in A). Glutamine is significantly decreased in both hippocampi in the epileptic animals (red and blue bars in B) vs the hippocampi in the nonepileptic controls (white bar in B). (C) GABA is not different among the hippocampi.
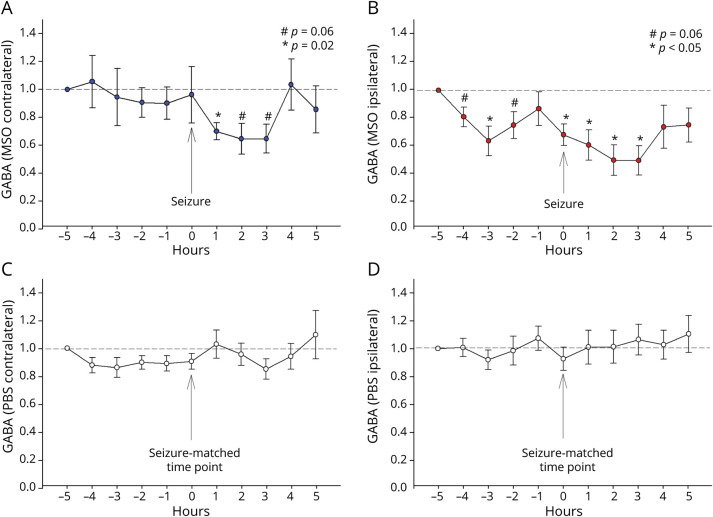
We previously reported that extracellular glutamate increases several-fold above the baseline during and possibly 1 to 2 minutes before a spontaneous seizure in the seizure-onset region of the brain, i.e., the hippocampus in patients with drug-resistant MTLE.13 To investigate whether glutamate and its associated metabolites glutamine and GABA change in relation to spontaneous seizures in our model, we tracked the hippocampal concentrations of the metabolites every hour, starting 5 hours before a spontaneous seizure and ending 5 hours after (figure 5). No significant change was apparent in glutamate or glutamine levels before, during, or after seizures in our model. However, the GABA level in the seizure focus decreased significantly from baseline 3 hours before the seizure (p < 0.05). GABA rose transiently back to baseline 1 hour before the seizure and was followed by a second, continuous decrease starting at the time of the seizure and ending 3 hours after (p < 0.05). GABA returned to baseline in the fourth hour after the seizure (p < 0.05; figure 5B). The GABA level in the hippocampus of seizure propagation decreased significantly from baseline starting 1 hour after the seizure (p < 0.05; figure 5A) and remained below baseline at a level that approached significance for an additional 2 hours (p = 0.06; figure 5A). The GABA level was not significantly different from baseline during any hour in time-matched samples from control rats (figure 5, C and D).
Figure 5. Extracellular GABA Decreases in the Seizure Onset Area Several Hours Before a Spontaneous Seizure.
(A–D) Hourly fluctuations in hippocampal GABA levels with respect to a spontaneous seizures, starting 5 hours before a seizure and ending 5 hours after. Traces from epileptic (methionine sulfoximine [MSO]–infused; n = 3) rats are shown at the top; traces from the same time points in nonseizing (phosphate buffered saline [PBS]–infused; n = 3) rats are shown at the bottom. Seven spontaneous seizures that were >6 hours away from each other were identified, and the GABA level at 5 hours before the seizure was normalized to 1 with the subsequent concentrations expressed as a value relative to this. Compared to the baseline value at 5 hours before the seizure, GABA decreased significantly in the seizure onset area (MSO ipsilateral B) 3 hours before the seizure (p < 0.05), after which the level rose back to baseline. This was followed by a second, continuous decrease starting at the time of the seizure and ending 3 hours after (p < 0.05), with return to baseline 4 hours after seizure. In the seizure-propagated hippocampus (A, MSO contralateral), GABA decreased significantly from baseline starting 1 hour after the seizure (p < 0.05; figure 4A) and remaining below baseline at a level that approached significance for an additional 2 hours (p = 0.06; figure 4A). The GABA level was not significantly different from baseline during any hour in corresponding samples from 7 time-matched samples from nonepileptic rats (figure 4, C and D). Values are expressed as mean ± SEM.
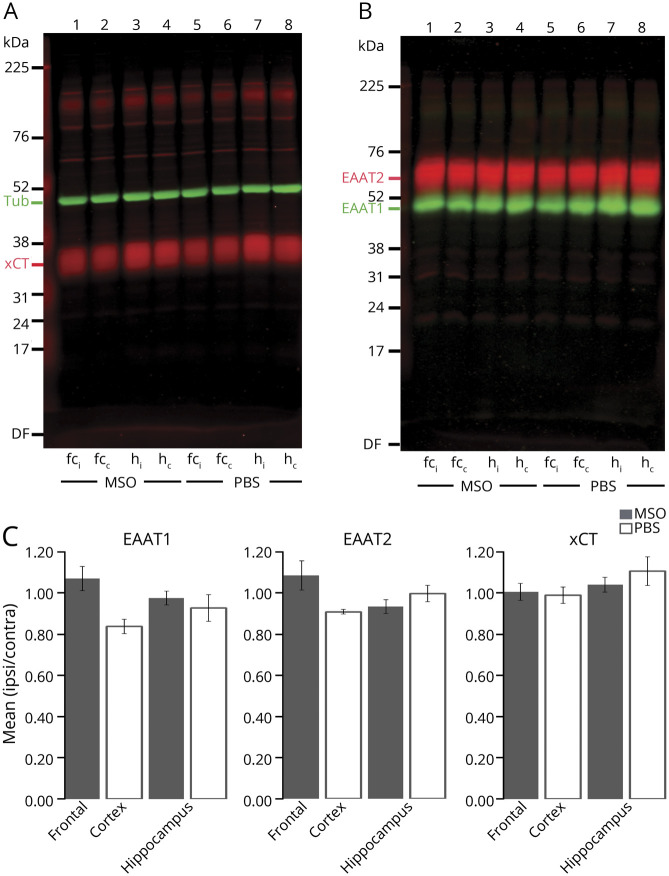
Finally, we speculated whether changes in glutamate transporters could explain the glutamate excess in the hippocampus of seizure propagation. To this end, we quantified the hippocampal protein levels of EAAT1 and EAAT2, which are the 2 major, high-affinity glutamate transporters responsible for glutamate uptake.22 We also quantified the hippocampal protein levels of the cystine-glutamate antiporter xCT, which is located in astrocytes23 and has been postulated to be important for astrocytic glutamate release.24,25 We first analyzed 4 MSO-infused and 4 control animals. For this batch, we also compared the ipsilateral and contralateral concentrations of the transporters in the frontal cortex. The ipsilateral to contralateral hippocampal and frontal ratios for each of the 3 transporter proteins were not different between control and MSO-infused rats (figure 6). To increase the power, we further analyzed the hippocampal concentrations of these transporters in the rest of the MSO-infused animals (n = 9). Similar to the first batch, there was no difference between the ipsilateral and contralateral hippocampus (figure 6C), suggesting that changes in EAAT1, EAAT2, and xCT protein levels cannot explain the propagated glutamate excess.
Figure 6. Concentrations of EAAT1, EAAT2, or xCT Are Not Different Between the 2 Hippocampi in the MSO-Infused Rats.
(A and B) Equal amounts of total protein extracts from the ipsilateral and contralateral total hippocampus from methionine sulfoximine (MSO)–infused rats were loaded into neighboring lanes (lanes 3 and 4). Extracts from the ipsilateral and contralateral frontal cortex of MSO-infused rats were used for comparison (lanes 1 and 2). Extracts from the same respective regions from PBS-infused animals were used as a control (lanes 5–8). The gels were immunoblotted with antibodies to (A) xCT (red, Ab#618, 0.5 µg/mL; RRID:AB_2714118) and tubulin (Tub; green; anti–β-tubulin, 1:1,000), used as loading control, or (B) excitatory amino acid transporter subtype 2 (EAAT2; red; Ab#8; 0.2 µg/mL; RRID: AB_2714090) and subtype 1 (EAAT1; green; Ab#314; 0.1 µg/mL; RRID: AB_2314561). (C) Bar graphs show the protein density in tissue extracts from the ipsilateral brain region (infusion site) expressed as a fraction of the concentration in the contralateral brain region. Fractions were determined for each of the 3 glutamate transporters for the hippocampus (n = 13) and frontal cortex (n = 4) in MSO-infused (gray bars) and PBS-infused (white bars; n = 4) rats. The mean ipsilateral/contralateral protein ratio was close to 1 for all transporters in both groups, suggesting that the transporters are equally expressed in the 2 hippocampi and in the bilateral frontal cortices after both MSO and PBS infusion. Furthermore, there was no statistically significant difference in hippocampal transporter concentration ratios between MSO- and PBS-treated animals. Values are expressed as mean ± SEM. c = contralateral site; fc = frontal cortex; h = hippocampus; I = ipsilateral site.
Discussion
Many patients being evaluated for epilepsy surgery for MTLE present with bitemporal epilepsy, in which both temporal lobes exhibit structural changes on imaging and intracranial EEG reveals independent seizure onset in each of the mesial temporal lobes.11,26,27 Resective surgery is often contraindicated in such epilepsies, making this a particularly challenging disease to treat.1,27,28 While the mechanism underlying the development of bitemporal epilepsy is unknown, it is possible that the seizures originated from one of the temporal lobes at some point during epileptogenesis and that the second seizure focus formed later.29 Another possibility is that MTLE is inherently a bilateral disease that requires the presence of both temporal lobes to generate seizures.29
Until now, the use of animal models to study bitemporal epilepsy has been limited because the seizure onset could not be lateralized or the seizure spread very rapidly to contralateral temporal lobe structures.30,31 In contrast, we found that all the 78 seizures analyzed in our model started in the GS-inhibited hippocampus followed by consistent propagation to the contralateral hippocampus after an average delay of several seconds. Moreover, the time to propagation became significantly shorter later in epileptogenesis, with seizure onset in the 2 hippocampi being separated by 11.65 seconds early in epileptogenesis vs 6.82 seconds later. This suggests a continuously evolving epileptogenic process that modifies the epilepsy network in a manner that facilitates propagation of seizures from the ipsilateral to the contralateral hippocampus. It is tempting to speculate that the delay will continue to decrease as epileptogenesis progresses over time, perhaps leading to simultaneous or near-simultaneous seizure onset from both hippocampi and even independent onset from the contralateral structure.
The progressive nature of the epileptogenic process in our model is also supported by diffusion tensor imaging and c-Fos immunohistochemistry studies. For example, high-resolution diffusion tensor imaging of epileptic rats has revealed significant changes in fractional anisotropy (FA) in numerous brain regions vs nonepileptic rats.32 The changes include decreases and increases in FA in regions such as the entorhinal-hippocampal area, amygdala, corpus callosum, thalamus, striatum, accumbens, and neocortex, and the FA changes evolve over time as animals transition from early to late epileptogenesis.32 Similarly, postictal c-fos staining has demonstrated distinct patterns of seizure-induced neuronal activation during epileptogenesis.33 Early in epileptogenesis, the seizures activate neurons in the entorhinal-hippocampal area, the basolateral amygdala, the piriform cortex, the midline thalamus, and the anterior olfactory area. Late in epileptogenesis, activation extends to involve neurons in the neocortex, the bed nucleus of the stria terminalis, the mediodorsal thalamus, and the central nucleus of the amygdala.33
The underlying mechanisms of the network plasticity in epilepsy remain elusive; however, this study suggests a potentially important role for extracellular glutamate. We found that the interictal glutamate concentration was 6 to 12-fold higher in regions of seizure propagation vs the seizure focus, suggesting that specific regions within the epilepsy network are exposed to excessive glutamate concentrations, possibly for a long period of time. It is increasingly recognized that even mildly elevated extracellular glutamate levels can cause significant pathology, particularly if present over a prolonged period of time.34 For example, a modest 10% increase in hippocampal glutamate over a period of several months has been associated with abnormalities such as decreased long-term potentiation,35 loss of dendrites, dendritic spines, and neuronal cell bodies,35 as well as changes in gene expression related to cellular stress, nerve growth, intracellular transport, and tissue recovery.36 Thus, we postulate that the glutamate excess in the distributed epilepsy network transforms the molecular anatomy and physiology of the network in a way that facilitates the spread of seizures. In a longitudinal study of patients treated surgically for refractory focal epilepsies, Andrews et al37 found that patients with a particularly rapid spread of the seizures had a worse long-term outcome than those with a slower spread, suggesting that the time to seizure spread is a biomarker of a more extensive pathologic process in the brain. Thus, we speculate further that the glutamate excess also leads to the formation of new seizure foci, increasing drug resistance, and manifestation of cognitive and psychiatric comorbid conditions. It is interesting to note that the seizures in our model originate from the hippocampus with the lower extracellular glutamate level. The explanation for this phenomenon is unknown and warrants further investigations.
What is the mechanism behind the propagated glutamate excess? Even though the concentrations of the 3 main glutamate transporters in the hippocampus, EAAT1, EAAT2, and xCT were unchanged, inhibition of the transporter activity cannot be ruled out. For example, studies have shown that intense neuronal activity38 and seizure-induced accumulation of arachidonic acid can inhibit EAAT activity.39 In addition, several metabolites such as l-alpha-aminoadipate, cystathionine, cystine, and l-homocysteate can affect glutamate transport via xCT.40
Because the 2 hippocampi are extensively interconnected in rodents, excessive release of glutamate from axons originating in the seizure onset hippocampus may be another mechanism.41 However, there was no spike in extracellular glutamate during a seizure, which is when synaptic glutamate release would be maximal. Moreover, if the glutamate transporters are unaffected, glutamate released during synaptic transmission would be rapidly cleared from the extracellular space.22
Glutamate can also accumulate due to tissue inflammation. The epileptic brain in humans and animal models often exhibits signs of inflammation with microglial activation and upregulation of proinflammatory cytokines and chemokines, particularly in the seizure focus.42 Notably, cytokines such as tumor necrosis factor-α can induce glutamate release43 and inhibit astroglial glutamate uptake.44 However, in both human patients and this animal model, glutamate was lower in the seizure focus, which has the highest level of tissue inflammation.
There are also changes in the structure and physiology of gap junctions and hemichannels in the epileptic brain, particularly in microglia and astrocytes in regions of inflammation.45 Moreover, activation of ionotropic and metabotropic glutamate receptors on the surface of glial cells can induce release of gliotransmitters such as ATP, glutamate, nicotinamide adenine dinucleotide, and d-serine into the extracellular space via Cxs-based hemichannels, suggesting that this mechanism may contribute to the propagated glutamate excess.45
There is ample evidence that GABAergic neurotransmission is critically important for the initiation and termination of many types of seizures.46 For example, benzodiazepines and barbiturates are powerful anticonvulsants and work by potentiating GABAergic transmission via positive allosteric modulation of the GABA-A receptor complex. The decrease in extracellular GABA as early as 4 hours before a spontaneous seizure is, to the best of our knowledge, the first report of an intracranial neurotransmitter change that occurs several hours before a spontaneous seizure. The change is intriguing because it implies a possible causal relationship between extracellular GABA levels and spontaneous seizures. When GABA is quantified by a highly accurate method such as the liquid chromatography–tandem mass spectrometry approach used here, ≈50% to 70% of it in dialysis fluid has been estimated to originate from neurotransmission, with the remainder coming from nonneuronal sources, particularly astrocytes.47 Thus, the GABA fluctuations reported here likely reflect the sum of changes in synaptic and extrasynaptic GABA, and the physiologic effects of the oscillations will depend on the site of the change (synaptic vs extrasynaptic), the type and cellular location of the GABA receptors involved, and other downstream events such as the effects on local and long-range neuronal networks. While the GABA fluctuations could potentially modulate synaptic transmission and thus the threshold to seizure activity in the local hippocampal network, the effects of GABAergic signaling on hippocampal function and seizures are complex,46 and additional studies are required to elucidate the functional consequences of this finding. For example, miniaturized implantable biosensors for GABA may be used in future studies to differentiate between GABA originating from synaptic vs extrasynaptic sources. Such sensors also are expected to detect chemical changes at a much higher temporal resolution (milliseconds to seconds) than microdialysis (minutes to hours). However, biosensors have their own limitations with respect to stability, longevity, sterilization, and the limited number of neurotransmitters than can be detected by this approach.
Even though glutamate is a metabolic precursor for GABA, we did not observe increased extracellular GABA levels in the contralateral hippocampus with the high glutamate levels. The absence of a concurrent GABA increase may be due to several factors such as decreased uptake of glutamate in glutamic acid decarboxylase–containing neurons, decreased glutamic acid decarboxylase activity, decreased extracellular GABA release, and increased extracellular GABA uptake.
Our study has limitations with respect to the animal model, the microdialysis approach, the assessment of glutamate transporter proteins, and the underlying mechanisms of the glutamate/GABA changes. First, the animal model uses MSO to inhibit GS, and high doses of this chemical are known to reduce tissue glutathione levels and to increase astrocyte glycogen concentrations,48,49 events that could theoretically interfere with the study results. However, the dose of MSO used in our model is quite low and does not affect tissue glutathione levels.7 Second, while our study strongly suggests that a contralateral seizure focus may develop, we do not have definite proof, likely because the EEG recordings were limited to 4 weeks. Third, the dialysis samples were collected every hour; hence, there is insufficient temporal resolution to understand the glutamate/GABA dynamics immediately surrounding individual seizures. Fourth, even though the Western blotting studies did not show changes in transporter proteins between the 2 hippocampi, our study cannot rule out changes in transporter activities or in the cellular distribution of the proteins. Such changes may occur in the epileptic brain.50 Fifth, the mechanisms of the glutamate/GABA changes are unknown. Thus, future studies are needed to address all of these issues, such as investigations of other animal models of MTLE and longer periods of EEG monitoring; the use of rapidly responding chemical sensors, enzyme activity assays, and immunocytochemistry studies; and the use of transgenic approaches and chemical modulators to address possible mechanisms.
Collectively, the changes in extracellular glutamate and GABA reported in this study suggest potentially important roles of the amino acids in epilepsy network plasticity and in the initiation and propagation of spontaneous seizures. Specifically, we postulate that chronic glutamate toxicity progressively transforms the epilepsy network in ways that facilitate the spread of seizures, lead to the formation of new seizure foci, and contribute to the manifestation of comorbid conditions such as cognitive dysfunction, anxiety, and depression. We also speculate that fluctuations in extracellular GABA levels in the seizure focus are causally implicated in the triggering of spontaneous seizures. Finally, we propose that the GS-inhibition model of MTLE may have important value for future mechanistic and interventional studies of bitemporal epilepsy. Additional studies are required to address these issues.
Glossary
- EAAT
excitatory amino acid transporter
- FA
fractional anisotropy
- GS
glutamine synthetase
- MSO
methionine sulfoximine
- MTLE
mesial temporal lobe epilepsy
- PBS
phosphate-buffered saline
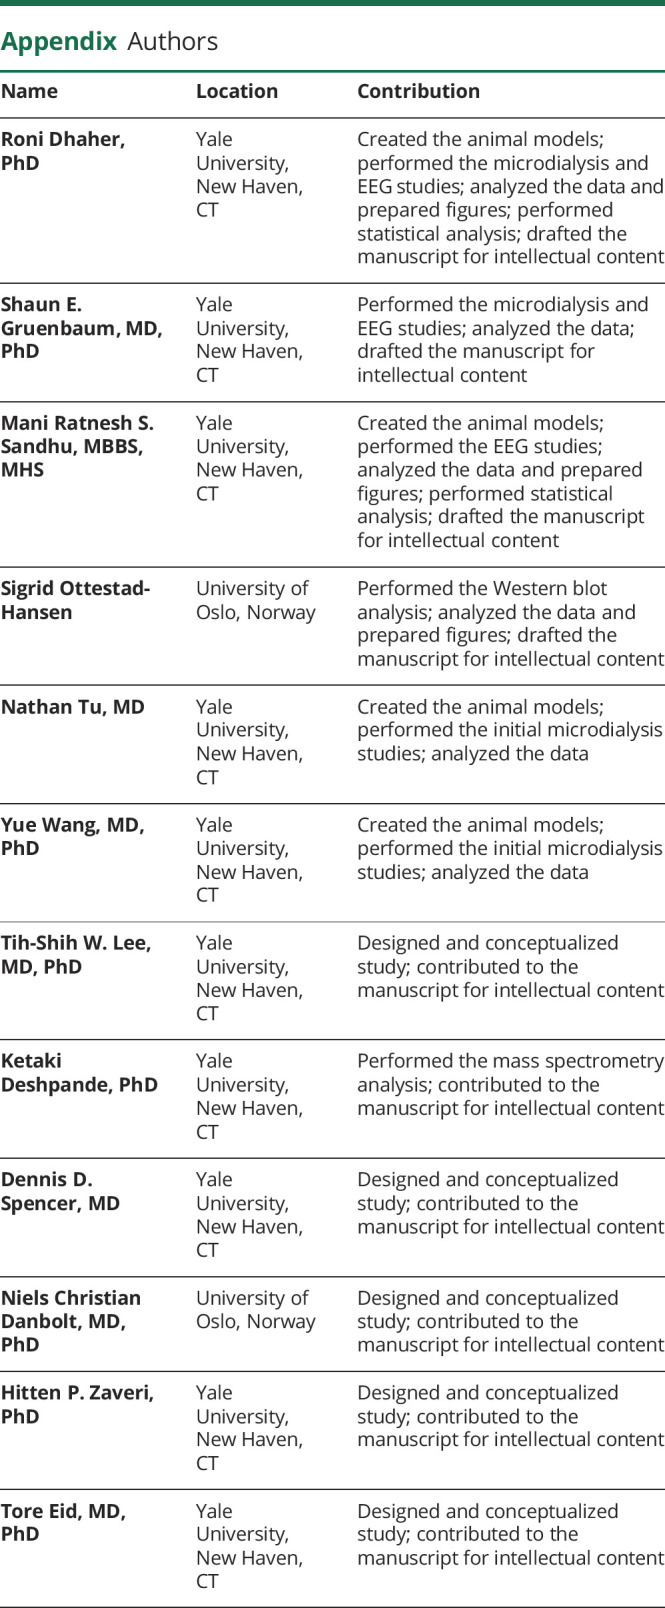
Appendix. Authors
Footnotes
CME Course: NPub.org/cmelist
Study Funding
This work was supported by grants from the Swebilius Family Trust, the NIH (NS058674, NS070824, NS109062, and NS109734), the National Center for Advancing Translational Sciences (NCATS, a component of the NIH; RR024139), Citizens United for Research in Epilepsy, and the University of Oslo (Unifor, Forskerlinjen, and SERTA). The contents of the publication are solely the responsibility of the authors and do not necessarily represent the official view of NCATS or NIH.
Disclosure
The authors report no disclosures relevant to the manuscript. Go to Neurology.org/N for full disclosures.
References
- 1.Spencer DD, Gerrard JL, Zaveri HP. The roles of surgery and technology in understanding focal epilepsy and its comorbidities. Lancet Neurol 2018;17:373–382. [DOI] [PubMed] [Google Scholar]
- 2.Becker AJ. Review: animal models of acquired epilepsy: insights into mechanisms of human epileptogenesis. Neuropathol Appl Neurobiol 2018;44:112–129. [DOI] [PubMed] [Google Scholar]
- 3.Kalitzin S, Petkov G, Suffczynski P, et al. Epilepsy as a manifestation of a multistate network of oscillatory systems. Neurobiol Dis 2019;130:104488. [DOI] [PubMed] [Google Scholar]
- 4.Pitkanen A, Sutula TP. Is epilepsy a progressive disorder? Prospects for new therapeutic approaches in temporal-lobe epilepsy. Lancet Neurol 2002;1:173–181. [DOI] [PubMed] [Google Scholar]
- 5.van Diessen E, Zweiphenning WJ, Jansen FE, Stam CJ, Braun KP, Otte WM. Brain network organization in focal epilepsy: a systematic review and meta-analysis. PLoS One 2014;9:e114606. [DOI] [PMC free article] [PubMed] [Google Scholar]
- 6.Dhaher R, Wang H, Gruenbaum SE, et al. Effects of site-specific infusions of methionine sulfoximine on the temporal progression of seizures in a rat model of mesial temporal lobe epilepsy. Epilepsy Res 2015;115:45–54. [DOI] [PMC free article] [PubMed] [Google Scholar]
- 7.Eid T, Ghosh A, Wang Y, et al. Recurrent seizures and brain pathology after inhibition of glutamine synthetase in the hippocampus in rats. Brain 2008;131:2061–2070. [DOI] [PMC free article] [PubMed] [Google Scholar]
- 8.Wang Y, Zaveri HP, Lee TS, Eid T. The development of recurrent seizures after continuous intrahippocampal infusion of methionine sulfoximine in rats: a video-intracranial electroencephalographic study. Exp Neurol 2009;220:293–302. [DOI] [PMC free article] [PubMed] [Google Scholar]
- 9.Haneef Z, Lenartowicz A, Yeh HJ, Levin HS, Engel J Jr, Stern JM. Functional connectivity of hippocampal networks in temporal lobe epilepsy. Epilepsia 2014;55:137–145. [DOI] [PMC free article] [PubMed] [Google Scholar]
- 10.Spencer SS, Spencer DD. Implications of seizure termination location in temporal lobe epilepsy. Epilepsia 1996;37:455–458. [DOI] [PubMed] [Google Scholar]
- 11.Hirsch LJ, Spencer SS, Williamson PD, Spencer DD, Mattson RH. Comparison of bitemporal and unitemporal epilepsy defined by depth electroencephalography. Ann Neurol 1991;30:340–346. [DOI] [PubMed] [Google Scholar]
- 12.Cavus I, Kasoff WS, Cassaday MP, et al. Extracellular metabolites in the cortex and hippocampus of epileptic patients. Ann Neurol 2005;57:226–235. [DOI] [PubMed] [Google Scholar]
- 13.During MJ, Spencer DD. Extracellular hippocampal glutamate and spontaneous seizure in the conscious human brain. Lancet 1993;341:1607–1610. [DOI] [PubMed] [Google Scholar]
- 14.Eid T, Thomas MJ, Spencer DD, et al. Loss of glutamine synthetase in the human epileptogenic hippocampus: possible mechanism for raised extracellular glutamate in mesial temporal lobe epilepsy. Lancet 2004;363:28–37. [DOI] [PubMed] [Google Scholar]
- 15.van der Hel WS, Notenboom RG, Bos IW, van Rijen PC, van Veelen CW, de Graan PN. Reduced glutamine synthetase in hippocampal areas with neuron loss in temporal lobe epilepsy. Neurology 2005;64:326–333. [DOI] [PubMed] [Google Scholar]
- 16.Eid T, Gruenbaum SE, Dhaher R, Lee TW, Zhou Y, Danbolt NC. The glutamate-glutamine cycle in epilepsy. Adv Neurobiol 2016;13:351–400. [DOI] [PubMed] [Google Scholar]
- 17.Zhou Y, Dhaher R, Parent M, et al. Selective deletion of glutamine synthetase in the mouse cerebral cortex induces glial dysfunction and vascular impairment that precede epilepsy and neurodegeneration. Neurochem Int 2019;123:22–33. [DOI] [PMC free article] [PubMed] [Google Scholar]
- 18.Racine RJ, Burnham WM, Gartner JG, Levitan D. Rates of motor seizure development in rats subjected to electrical brain stimulation: strain and inter-stimulation interval effects. Electroencephalogr Clin Neurophysiol 1973;35:553–556. [DOI] [PubMed] [Google Scholar]
- 19.Zhou Y, Hassel B, Eid T, Danbolt NC. Axon-terminals expressing EAAT2 (GLT-1; Slc1a2) are common in the forebrain and not limited to the hippocampus. Neurochem Int 2019;123:101–113. [DOI] [PubMed] [Google Scholar]
- 20.Li Y, Zhou Y, Danbolt NC. The rates of postmortem proteolysis of glutamate transporters differ dramatically between cells and between transporter subtypes. J Histochem Cytochem 2012;60:811–821. [DOI] [PMC free article] [PubMed] [Google Scholar]
- 21.Van Liefferinge J, Bentea E, Demuyser T, et al. Comparative analysis of antibodies to xCT (Slc7a11): forewarned is forearmed. J Comp Neurol 2016;524:1015–1032. [DOI] [PubMed] [Google Scholar]
- 22.Danbolt NC. Glutamate uptake. Prog Neurobiol 2001;65:1–105. [DOI] [PubMed] [Google Scholar]
- 23.Ottestad-Hansen S, Hu QX, Follin-Arbelet VV, et al. The cystine-glutamate exchanger (xCT, Slc7a11) is expressed in significant concentrations in a subpopulation of astrocytes in the mouse brain. Glia 2018;66:951–970. [DOI] [PubMed] [Google Scholar]
- 24.Baker DA, Xi ZX, Shen H, Swanson CJ, Kalivas PW. The origin and neuronal function of in vivo nonsynaptic glutamate. J Neurosci 2002;22:9134–9141. [DOI] [PMC free article] [PubMed] [Google Scholar]
- 25.De Bundel D, Schallier A, Loyens E, et al. Loss of system x(c)- does not induce oxidative stress but decreases extracellular glutamate in hippocampus and influences spatial working memory and limbic seizure susceptibility. J Neurosci 2011;31:5792–5803. [DOI] [PMC free article] [PubMed] [Google Scholar]
- 26.Aghakhani Y, Liu X, Jette N, Wiebe S. Epilepsy surgery in patients with bilateral temporal lobe seizures: a systematic review. Epilepsia 2014;55:1892–1901. [DOI] [PubMed] [Google Scholar]
- 27.Diehl B, Luders HO. Temporal lobe epilepsy: when are invasive recordings needed?. Epilepsia 2000;41(suppl 3):S61–S74. [DOI] [PubMed] [Google Scholar]
- 28.Englot DJ. A modern epilepsy surgery treatment algorithm: incorporating traditional and emerging technologies. Epilepsy Behav 2018;80:68–74. [DOI] [PMC free article] [PubMed] [Google Scholar]
- 29.Hirsch LJ, Spencer SS, Spencer DD, Williamson PD, Mattson RH. Temporal lobectomy in patients with bitemporal epilepsy defined by depth electroencephalography. Ann Neurol 1991;30:347–356. [DOI] [PubMed] [Google Scholar]
- 30.Toyoda I, Bower MR, Leyva F, Buckmaster PS. Early activation of ventral hippocampus and subiculum during spontaneous seizures in a rat model of temporal lobe epilepsy. J Neurosci 2013;33:11100–11115. [DOI] [PMC free article] [PubMed] [Google Scholar]
- 31.Fernandes de Lima VM, Pijn JP, Nunes Filipe C, Lopes da Silva F. The role of hippocampal commissures in the interhemispheric transfer of epileptiform afterdischarges in the rat: a study using linear and non-linear regression analysis. Electroencephalogr Clin Neurophysiol 1990;76:520–539. [DOI] [PubMed] [Google Scholar]
- 32.Wang H, Huang Y, Coman D, et al. Network evolution in mesial temporal lobe epilepsy revealed by diffusion tensor imaging. Epilepsia 2017;58:824–834. [DOI] [PMC free article] [PubMed] [Google Scholar]
- 33.Albright B, Dhaher R, Wang H, et al. Progressive neuronal activation accompanies epileptogenesis caused by hippocampal glutamine synthetase inhibition. Exp Neurol 2017;288:122–133. [DOI] [PMC free article] [PubMed] [Google Scholar]
- 34.Lewerenz J, Maher P. Chronic glutamate toxicity in neurodegenerative diseases-what is the evidence? Front Neurosci 2015;9:469. [DOI] [PMC free article] [PubMed] [Google Scholar]
- 35.Bao X, Pal R, Hascup KN, et al. Transgenic expression of Glud1 (glutamate dehydrogenase 1) in neurons: in vivo model of enhanced glutamate release, altered synaptic plasticity, and selective neuronal vulnerability. J Neurosci 2009;29:13929–13944. [DOI] [PMC free article] [PubMed] [Google Scholar]
- 36.Wang X, Bao X, Pal R, Agbas A, Michaelis EK. Transcriptomic responses in mouse brain exposed to chronic excess of the neurotransmitter glutamate. BMC Genomics 2010;11:360. [DOI] [PMC free article] [PubMed] [Google Scholar]
- 37.Andrews JP, Gummadavelli A, Farooque P, et al. Association of seizure spread with surgical failure in epilepsy. JAMA Neurol 2019;76:462–469. [DOI] [PMC free article] [PubMed] [Google Scholar]
- 38.Armbruster M, Hanson E, Dulla CG. Glutamate clearance is locally modulated by presynaptic neuronal activity in the cerebral cortex. J Neurosci 2016;36:10404–10415. [DOI] [PMC free article] [PubMed] [Google Scholar]
- 39.Trotti D, Volterra A, Lehre KP, et al. Arachidonic acid inhibits a purified and reconstituted glutamate transporter directly from the water phase and not via the phospholipid membrane. J Biol Chem 1995;270:9890–9895. [DOI] [PubMed] [Google Scholar]
- 40.Kobayashi S, Sato M, Kasakoshi T, et al. Cystathionine is a novel substrate of cystine/glutamate transporter: implications for immune function. J Biol Chem 2015;290:8778–8788. [DOI] [PMC free article] [PubMed] [Google Scholar]
- 41.Blackstad TW. Commissural connections of the hippocampal region in the rat, with special reference to their mode of termination. J Comp Neurol 1956;105:417–537. [DOI] [PubMed] [Google Scholar]
- 42.Vezzani A, Balosso S, Ravizza T. Inflammation and epilepsy. Handb Clin Neurol 2012;107:163–175. [DOI] [PubMed] [Google Scholar]
- 43.Shim HG, Jang SS, Kim SH, et al. TNF-alpha increases the intrinsic excitability of cerebellar Purkinje cells through elevating glutamate release in Bergmann glia. Sci Rep 2018;8:11589. [DOI] [PMC free article] [PubMed] [Google Scholar]
- 44.Pickering M, Cumiskey D, O'Connor JJ. Actions of TNF-alpha on glutamatergic synaptic transmission in the central nervous system. Exp Physiol 2005;90:663–670. [DOI] [PubMed] [Google Scholar]
- 45.Medina-Ceja L, Salazar-Sanchez JC, Ortega-Ibarra J, Morales-Villagran A. Connexins-based hemichannels/channels and their relationship with inflammation, seizures and epilepsy. Int J Mol Sci 2019;20:5976. [DOI] [PMC free article] [PubMed] [Google Scholar]
- 46.Khazipov R. GABAergic synchronization in epilepsy. Cold Spring Harbor Perspect Med 2016;6:a022764. [DOI] [PMC free article] [PubMed] [Google Scholar]
- 47.van der Zeyden M, Oldenziel WH, Rea K, Cremers TI, Westerink BH. Microdialysis of GABA and glutamate: analysis, interpretation and comparison with microsensors. Pharmacol Biochem Behav 2008;90:135–147. [DOI] [PubMed] [Google Scholar]
- 48.Folbergrova J, Passonneau JV, Lowry OH, Schulz DW. Glycogen, ammonia and related metabolites in the brain during seizures evoked by methionine sulphoximine. J Neurochem 1969;16:191–203. [DOI] [PubMed] [Google Scholar]
- 49.Shaw CA, Bains JS. Synergistic versus antagonistic actions of glutamate and glutathione: the role of excitotoxicity and oxidative stress in neuronal disease. Cell Mol Biol (Noisy-le-grand) 2002;48:127–136. [PubMed] [Google Scholar]
- 50.Bjornsen LP, Eid T, Holmseth S, Danbolt NC, Spencer DD, de Lanerolle NC. Changes in glial glutamate transporters in human epileptogenic hippocampus: inadequate explanation for high extracellular glutamate during seizures. Neurobiol Dis 2007;25:319–330. [DOI] [PubMed] [Google Scholar]
Associated Data
This section collects any data citations, data availability statements, or supplementary materials included in this article.
Data Availability Statement
Data not provided in the article will be made available at the request of other investigators for purposes of replicating procedures and results.


