Abstract
Layered manganese-based oxides are promising candidates as cathode materials for sodium-ion batteries (SIBs) due to their low cost and high specific capacity. However, the Jahn–Teller distortion from high-spin Mn3+ induces detrimental lattice strain and severe structural degradation during sodiation and desodiation. Herein, lithium is introduced to partially substitute manganese ions to form distorted P′2-Na0.67Li0.05Mn0.95O2, which leads to restrained anisotropic change of Mn–O bond lengths and reinforced bond strength in the [MnO6] octahedra by mitigation of Jahn–Teller distortion and contraction of MnO2 layers. This ensures the structural stability during charge and discharge of P′2-Na0.67Li0.05Mn0.95O2 and Na+/vacancy disordering for facile Na+ diffusion in the Na layers with a low activation energy barrier of ∼0.53 eV. It exhibits a high specific capacity of 192.2 mA h g−1, good cycling stability (90.3% capacity retention after 100 cycles) and superior rate capability (118.5 mA h g−1 at 1.0 A g−1), as well as smooth charge/discharge profiles. This strategy is effective to tune the crystal structure of layered oxide cathodes for SIBs with high performance.
Li-Substitution in P′2-Na0.67MnO2 mitigates the anisotropic change of Mn–O bonds and Na/vacancy ordering, and hence significantly promotes its cycling stability and rate capability as a cathode material for sodium-ion batteries.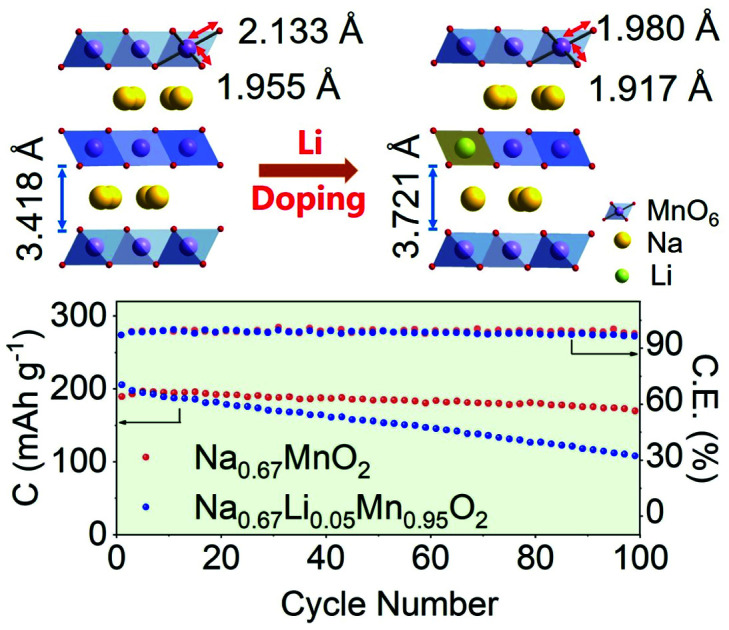
Introduction
Sodium-ion batteries (SIBs) have attracted extensive attention for large-scale electric energy storage due to the abundance and low cost of sodium resources.1–3 However, low energy density and insufficient cycling life limit the practical application of SIBs because of the large radius and heavy mass of Na+.4,5 Cathode materials play a crucial role in the overall performance and cost of SIBs. Cathode materials with high capacity, long cycling stability and fast Na+ diffusion are of great significance.6,7 Among various cathode materials, layered transition metal oxides NaxTMO2 (TM = Mn, Co, Ni, Fe, etc.) exhibit high Na+ storage capacities.8–10 Layered NaxTMO2 can be mainly classified into P2 and O3 phases, based on the atomic environment of Na (prismatic or octahedral) and the oxygen layer stacking patterns along the c-axis (ABBA or ABCABC).11,12 P2-Type oxides have more open frameworks and spacious prismatic paths within TMO2 slabs for direct Na+ diffusion, which favor rate and cycling capability.13,14
P2-NaxMnO2 with a hexagonal structure has tremendous potential as a cathode material for SIBs because of the elemental abundance, eco-friendly nature and considerable specific capacity. Particularly, the distorted P′2-Na0.67MnO2 with an orthorhombic structure caused by the Jahn–Teller (J–T) effect exhibits higher capacity than the undistorted P2-Na0.67MnO2.15–20 However, the J–T distortion, derived from high spin Mn3+ (t2g3–eg1), causes an abnormal bond length change of O–Mn–O in [MnO6] octahedra, large lattice strain and anisotropic volume change during the charge and discharge processes, resulting in Na+/vacancy ordering and rapid degradation of structural and electrochemical properties of P2/P′2-type Na0.67MnO2.15,21–23 Due to the lattice distortion in P′2-Na0.67MnO2, a high specific capacity of ∼200 mA h g−1 can be obtained at the initial cycles, but followed by rapid capacity decay because of the drastic J–T effect during Na+ extraction/insertion. In order to enhance the structural stability of Mn-based layered oxides, electrochemically inactive ion substitution, such as Mg2+, Al3+, and Zn2+, etc., has been attempted to suppress the J–T effect via modulating the electron and bond structure of [MnO6].24–27 When doped with Ti, P′2-Na0.67[(Mn0.78Fe0.22)0.9Ti0.1]O2 delivers a capacity of ∼180 mA h g−1 and exhibits reversible Na+ extraction and insertion for 200 cycles with a retention of 86%.19 With the introduction of Al into P2-Na0.67AlxMn1−xO2, the complex phases of P′2 + P2 are electrochemically converted to the undistorted P2, leading to better capacity retentions. The sample doped with 10 mol% Al yields a specific capacity of 175 mA h g−1 and long cycling stability exceeding 200 cycles with 85% capacity retention.26 Achieving the high performance of P′2-Na0.67MnO2, which is limited by the Na+/vacancy ordering and drastic J–T effect, is still a great challenge for SIBs.
Herein, partial substitution of Li for Mn to form P′2-Na0.67Li0.05Mn0.95O2 is reported. It results in mitigation of J–T distortion and contraction of MnO2 layers, and then restrains the anisotropic Mn–O bond lengths and reinforces the bond strength in the [MnO6] octahedra. These strengthened crystal structures and Na+/vacancy disordering ensure facile Na+ diffusion. The as-synthesized P′2-Na0.67Li0.05Mn0.95O2 exhibits a high specific capacity of 192.2 mA h g−1 within 1.8–4.3 V, good cycling stability and rate capability. This investigation provides insights into the modulation of the chemical environment of redox centers in advanced cathodes for SIBs.
Results and discussion
Structure features
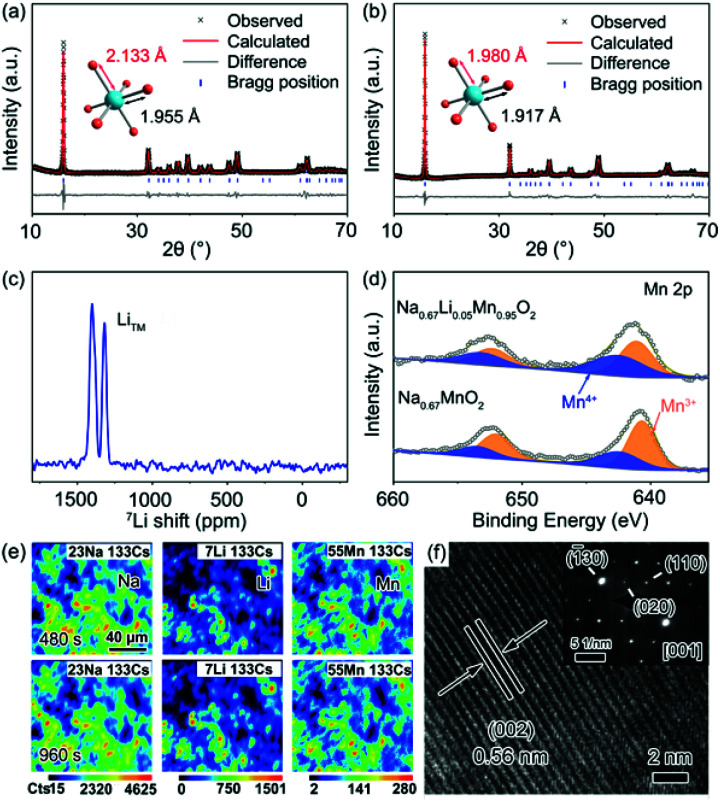
A group of Li-substituted P′2-Na0.67LixMn1−xO2 (x = 0, 0.03, 0.05 and 0.08) layered oxides were synthesized via a facile solid-state reaction at 1000 °C followed by a quenching process. The X-ray diffraction (XRD) patterns and Rietveld refinement of the as-synthesized compounds are presented in Fig. 1a, b, S1 and Tables S1–S4.† All the diffraction peaks of Na0.67LixMn1−xO2 can be indexed to an orthorhombic structure with a space group of Cmcm.16 The J–T distortion in the orthorhombic lattice is accompanied by the elongation along the b axis and shrinkage along the a axis, and the degree of distortion (δ) is determined by using the equation of bortho/aortho = (1 + δ)√3. The evolution of lattice parameters, Na interlayer spacing (d(Na–O–Na)) and δ with the increase of Li content in P′2-Na0.67LixMn1−xO2 is depicted in Fig. S2,† which reveals that a and d(Na–O–Na) increase with decreasing b. Note that P′2-Na0.67Li0.03Mn0.97O2 and P′2-Na0.67Li0.05Mn0.95O2 exhibit similarly decreased degrees of distortion of 6.80% and 6.73% in comparison with 7.68% in P′2-Na0.67MnO2, while P′2-Na0.67Li0.05Mn0.95O2 shows the largest d(Na–O–Na). Though more Li content in P′2-Na0.67Li0.08Mn0.92O2 can lead to smaller δ, the d(Na–O–Na) no longer increases, and redox-active Mn decreases. In the optimal P′2-Na0.67Li0.05Mn0.95O2, obvious shrinkage of bond lengths of Mn–O (d(Mn–O)) along the axial O–Mn–O direction and contraction of MnO2 layers are observed in Fig. S3 and Table S5.† This results in the alleviated anisotropic change of Mn–O bond lengths in the octahedra of [MnO6] and mitigation of J–T distortion. The elemental composition of P′2-Na0.67Li0.05Mn0.95O2 was determined using an inductively coupled plasma-optical emission spectrometer (ICP-OES), and the result in Table S6† is close to the expected stoichiometry. The robust and shortened Mn–O bond in P′2-Na0.67Li0.05Mn0.95O2 associated with contraction of MnO2 layers ensures a stable structure, and the enlarged Na interlayer space favors Na+ diffusion.13
Fig. 1. Rietveld refinement of powder XRD patterns for (a) P′2-Na0.67MnO2 and (b) P′2-Na0.67Li0.05Mn0.95O2. (c) 7Li ss-NMR of P′2-Na0.67Li0.05Mn0.95O2. (d) XPS spectra of the Mn 2p region of Na0.67MnO2 and P′2-Na0.67Li0.05Mn0.95O2. (e) Elemental SIMS mappings and (f) HRTEM and SAED images of P′2-Na0.67Li0.05Mn0.95O2.
To confirm the local environments of Li+, 7Li solid-state nuclear magnetic resonance (ss-NMR) spectroscopy was carried out for P′2-Na0.67Li0.05Mn0.95O2. As shown in Fig. 1c, the chemical shift values of 1401 ppm and 1318 ppm indicate that Li+ occupies the octahedral Mn sites in the TMO2 layer, which is consistent with the chemical shifts of two kinds of Li+ sites in Li2MnO3, namely, in the [MnO2] and Li layers.14,28 This can be interpreted as the comparable ionic radii of Li+ (0.76 Å) and Mn3+ (0.65 Å). The X-ray photoelectron spectroscopy (XPS) spectrum of Mn 2p in Fig. 1d shows the electronic structure of Mn in P′2-Na0.67MnO2 and P′2-Na0.67Li0.05Mn0.95O2. Mn 2p in P′2-Na0.67Li0.05Mn0.95O2 shows a higher binding energy, owing to the partial Mn3+ oxidation to the J–T inactive Mn4+ (t2g3–eg0) via Li+ substitution. The replacement of Mn3+ with Li+ in the octahedral sites increases the average valence of Mn and mitigates the J–T distortion with robust Mn–O bonds, which facilitates the structural stability of P′2-Na0.67Li0.05Mn0.95O2.
The elemental distributions of P′2-Na0.67Li0.05Mn0.95O2 at different depths are recorded by dynamic secondary ion mass spectroscopy (SIMS), as shown in Fig. 1e and S4.† The intensity variation of Na, Li, Mn and O with sputtering time shows the elemental distribution changes at different sputtering depths.29 The intensity of Na and Li increases rapidly in the initial 50 s, which can be attributed to the minor deposition of impurities during preparation and storage, such as Na2CO3 and Li2CO3 on the surface. Starting from ∼300 s, the concentration of Li and Mn remains steady, showing a homogeneous distribution throughout the bulk. The particle size of P′2-Na0.67MnO2 and P′2-Na0.67Li0.05Mn0.95O2 ranges from 2.0 to 5.0 μm, as shown in the scanning electron microscopy (SEM) images in Fig. S5.† The selected-area electron diffraction (SAED) along the [001] zone of Na0.67Li0.05Mn0.95O2 is presented in Fig. 1f, implying a typical P′2 phase. The crystal lattice spacing in the high-resolution transmission electron microscopy (HRTEM) image of Fig. 1f is 0.56 nm, consistent with the (002) planes of P′2-Na0.67Li0.05Mn0.95O2 and the XRD refinement in Fig. S6.†
Structural evolution and reaction mechanism
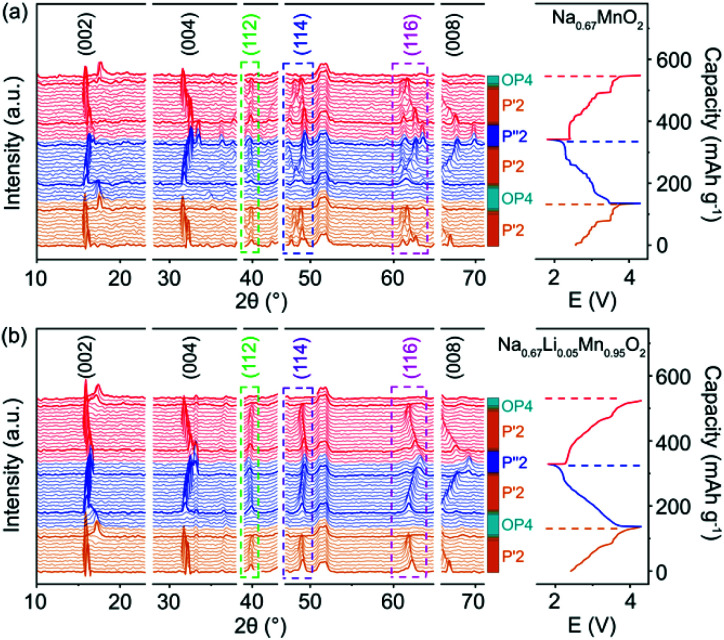
The structural evolution of P′2-Na0.67MnO2 and P′2-Na0.67Li0.05Mn0.95O2 during charge and discharge is monitored by in situ XRD in a voltage window of 1.8–4.3 V. As shown in Fig. 2a and b, during the initial charge of P′2-NaxLi0.05Mn0.95O2, the P′2 phase is maintained with 0.26 < x < 0.79. The c parameter increases along with the (002) and (004) peaks shifting to lower angles due to the repulsive force between the adjacent oxygen layers during Na+ extraction, and the ab plane contracts as the (112) peak shifts to higher angles because of the smaller ion radius of Mn at the valence state of 4+.19,30 The OP4 phase starts to appear upon extraction of ∼0.39 mol Na+ and remains till full charge, as confirmed by the typical OP4 (004) peak at ∼17.5° in Fig. 2 and illustrated in Fig. S7†.31–33 Notably, at the fully charged states, P′2-NaxLi0.05Mn0.95O2 exhibits a slight variation of d(Mn–O) from 1.980 Å to 1.928 Å, while P′2-NaxMnO2 shows an obvious shrinkage from 2.133 to 1.944 Å, based on the Rietveld refinements in Fig. S8 and Table S7.† The robust Mn–O bond enabled by the mitigated J–T distortion due to Li doping ensures structural stability of [MnO6] octahedra in P′2-NaxLi0.05Mn0.95O2 upon Na+ extraction in the charge process.
Fig. 2. In situ XRD patterns collected in the first cycle and second charge of (a) P′2-Na0.67MnO2 and (b) P′2-Na0.67Li0.05Mn0.95O2.
In the following discharge of P′2-NaxLi0.05Mn0.95O2, the OP4 phase reversibly transforms to the P′2 phase, as evidenced by the XRD patterns in Fig. 2b. When ∼0.65 mol Na+ is re-inserted into the structure, a two-phase reaction occurs with the phase transformation of P′2 to P′′2 due to the dominant Mn3+.16 The P′′2 phase of NaxMnO2 exhibits a larger elongation of Mn–O bonds of 2.305 Å in the axial direction than that of NaxLi0.05Mn0.95O2 (2.230 Å), based on the Rietveld refinements at the discharged state in Fig. S9 and Table S8.† In the meantime, the change of the bond length of the axial Mn–O from OP4 to P′′2 in NaxMnO2 is 18.57%, in contrast to 15.66% in NaxLi0.05Mn0.95O2. The degree of distortion of P′′2 decreases from 13.37% in P′2-Na0.67MnO2 to 9.30% in P′2-Na0.67Li0.05Mn0.95O2. Particularly, the volume change is merely 1.30% for NaxLi0.05Mn0.95O2, as compared to 2.61% for P′2-Na0.67MnO2, indicating the alleviated J–T effect. The P′2 phase of NaxLi0.05Mn0.95O2 fully recovers from its P′′2 phase during the second charge. The reversible phase transitions of P′2-NaxLi0.05Mn0.95O2 in the charge and discharge process are also revealed by HRTEM and fast Fourier transform (FFT) images shown in Fig. S10.† Meanwhile, asymmetrical shape changes of (112), (114) and (116) are observed in P′2-NaxMnO2 (0.29 < x < 0.77), corresponding to the multiple stepwise charge/discharge curves in Fig. 2a. This is derived from several phase transitions related to long-range ordering of both Na+/vacancy and Mn charge,15,34 which generally leads to severe polarization and poor rate performance.13,35 However, only peak position shifts are observed in P′2-NaxLi0.05Mn0.95O2 (0.26 < x < 0.79) without asymmetrical diffraction peaks, indicating that the significantly restrained multistep phase transition is related to Na+/vacancy disordering and a solid–solution reaction process during charge and discharge.
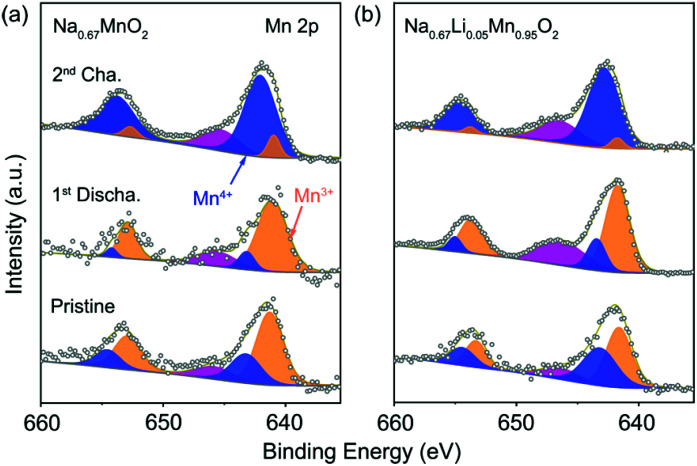
Ex situ XPS was carried out to investigate the charge compensation in P′2-Na0.67MnO2 and P′2-Na0.67Li0.05Mn0.95O2 at different states. Fig. 3a and b show the Mn 2p spectra of the pristine, discharged and charged P′2-Na0.67MnO2 and P′2-Na0.67Li0.05Mn0.95O2, respectively. The two major peaks are deconvoluted into four peaks of Mn 2p3/2 and Mn 2p1/2. The two peaks located at 641.7 and 653.2 eV are assigned to Mn3+ of the pristine P′2-Na0.67Li0.05Mn0.95O2, while the other two peaks at 643.1 and 654.6 eV correspond to Mn4+. An additional peak at 646.6 eV can be identified as the signal from some Mn ions at higher oxidation state in a fluorine environment.36 The fluorine mainly comes from additives of fluoroethylene carbonate (FEC) and poly(vinyl difluoride) (PVDF), which are added during the preparation of electrodes. Mn3+ is oxidized to Mn4+ in the charging process, and a reverse process occurs during discharge, indicating that the Mn3+/Mn4+ redox is responsible for the charge compensation (0.72 e− transfer). As for P′2-Na0.67MnO2, 0.83 e− transfer occurs during charge/discharge. Hence, the redox couple of Mn3+/Mn4+ in both of P′2-Na0.67MnO2 and P′2-Na0.67Li0.05Mn0.95O2 is responsible for the charge and discharge.
Fig. 3. XPS spectra of Mn 2p collected on the pristine, first discharged and second charged electrode of (a) P′2-Na0.67MnO2 and (b) P′2-Na0.67Li0.05Mn0.95O2.
Crystal structure and Na+ kinetics
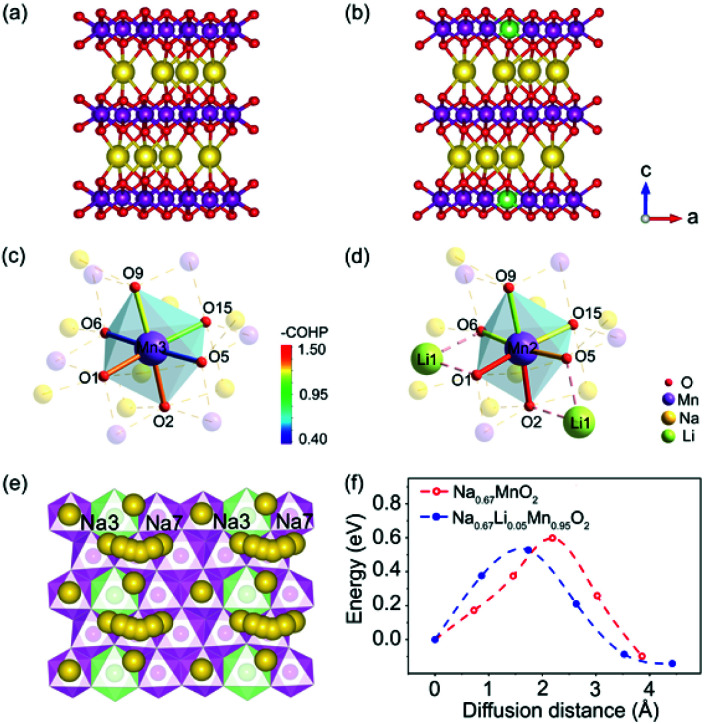
Theoretical calculations based on density functional theory (DFT) and crystal orbital Hamilton population (COHP) analyses were performed to explore the bonding situations and structural change with Li+ doped in P′2-type oxides.37–39 The structures of P′2-Na0.67MnO2 and P′2-Na0.67Li0.05Mn0.95O2 were optimized based on the Rietveld refinement of XRD data. The geometrical optimization of P′2-Na0.67MnO2 was performed within a 3 × 1 × 1 supercell, which consists of 12 Mn, 8 Na and 24 O atoms. As for P′2-Na0.67Li0.05Mn0.95O2, the structure was obtained via replacing one of the Mn atoms by a Li atom in the optimized P′2-Na0.67MnO2. Both of the optimized P′2-Na0.67MnO2 and P′2-Na0.67Li0.05Mn0.95O2 are shown in Fig. 4a and b. The COHP method is efficient to provide the chemical bonding information by indicating “bond-weighted” density of states between the interacting neighbor atoms.40 Positive and negative values of –COHP suggest the bonding and anti-bonding interactions, and zero of –COHP indicates a non-bonding interaction. The integrated –COHP shows a bonding interaction between O 2p and Mn 3d, and the intensity of bonding interaction of adjacent Mn–O is strengthened obviously by Li substitution, as depicted in Fig. 4c and d. The stronger Mn–O bonds in [MnO6] are contributed by the increased hybridization of the O 2p and Mn 3d orbitals, owing to the weak overlap between Li 2s and O 2p orbitals. As shown in Table S9,† the orbital overlap of Mn(11)–O in P′2-Na0.67Li0.05Mn0.95O2 increases by 22.67%. The enhanced [MnO6] slabs result in a robust and stable skeleton to suppress the inferior J–T distortion. Based on the calculated density of states (DOS) of P′2-Na0.67MnO2 and P′2-Na0.67Li0.05Mn0.95O2 in Fig. S11,† the number of electrons in Mn eg orbitals decreases obviously for Li+-doped material, suggesting that some Mn3+ ions are oxidized and the J–T inactive Mn4+ centers increase.
Fig. 4. Optimized structure of (a) P′2-Na0.67MnO2 and (b) P′2-Na0.67Li0.05Mn0.95O2. COHP analysis of the transition metal octahedral sites of (c) P′2-Na0.67MnO2 and (d) P′2-Na0.67Li0.05Mn0.95O2. (e) Na3–Na7 diffusion pathway in P′2-Na0.67Li0.05Mn0.95O2. (f) activation energy barrier for Na+ diffusion in P′2-Na0.67MnO2 and P′2-Na0.67Li0.05Mn0.95O2.
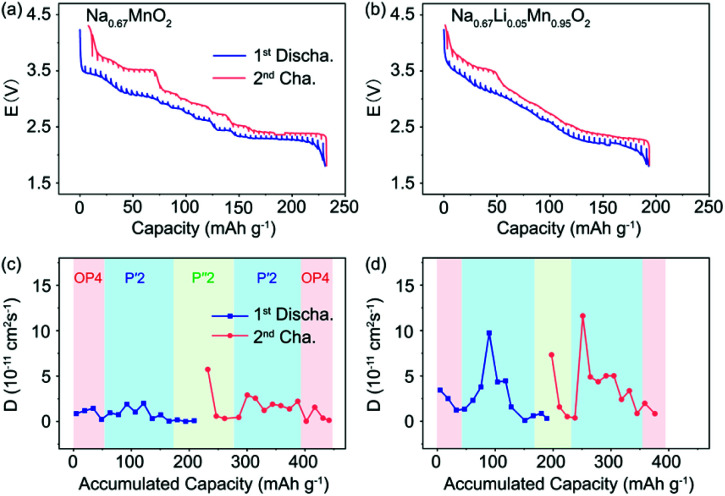
The activation energy barrier of Na+ in P′2-Na0.67MnO2 and P′2-Na0.67Li0.05Mn0.95O2 was calculated using the climbing image nudged elastic band (CINEB) method. As shown in Fig. 4e and f, the activation energy barrier is ∼0.53 eV in P′2-Na0.67Li0.05Mn0.95O2 along the Na3–Na7 pathway in the ab plane, which is 0.07 eV lower than that in P′2-Na0.67MnO2. Furthermore, the Na+ diffusion coefficients were investigated using the galvanostatic intermittent titration technique (GITT). In contrast, P′2-Na0.67Li0.05Mn0.95O2 displays smaller voltage hysteresis and high coulombic efficiency in the GITT curves (Fig. 5a and b). The calculated Na+ diffusion coefficients of P′2-Na0.67Li0.05Mn0.95O2 range from 2.0 × 10⁻¹¹ to 10−10 cm2 s−1 within the scope of the solid–solution reaction, which are an order of magnitude higher than those of P′2-Na0.67MnO2 (Fig. 5c and d). The results are in good agreement with the calculation of activation barriers in Fig. 4f and the smooth charge and discharge curves in Fig. 2. Lower polarization and activation energy barrier, as well as increased Na+ diffusion kinetics, are realized by virtue of the expanded Na+ layer spacing and suppressed Na+/vacancy ordering by Li doping.
Fig. 5. GITT profiles of (a) P′2-Na0.67MnO2 and (b) P′2-Na0.67Li0.05Mn0.95O2 in a charge and discharge cycle. Na+ diffusion coefficients of (c) P′2-Na0.67MnO2 and (d) P′2-Na0.67Li0.05Mn0.95O2 calculated from GITT measurements.
Electrochemical performance
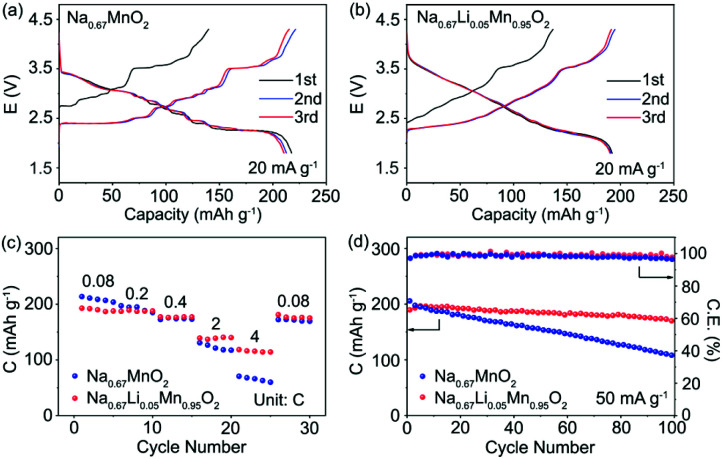
The electrochemical performance of P′2-Na0.67MnO2 and P′2-Na0.67Li0.05Mn0.95O2 was examined in coin cells with Na as the negative electrode. Fig. 6a and b exhibit the galvanostatic charge/discharge curves of P′2-Na0.67MnO2 and P′2-Na0.67Li0.05Mn0.95O2 in the initial three cycles at 20 mA g−1 within 1.8–4.3 V. P′2-Na0.67MnO2 delivers a high initial discharge capacity of 217.6 mA h g−1 (0.83 Na+) but severe capacity and voltage fading during the first three cycles. The multiple stepwise curves observed in P′2-Na0.67MnO2 are assigned to the phase transitions and Na+/vacancy ordering. In contrast, P′2-Na0.67Li0.05Mn0.95O2 displays smooth and highly overlapped charge/discharge profiles with a reversible capacity of 192.2 mA h g−1 (0.72 Na+), which are attributed to the solid–solution reaction process between 2.1 and 3.6 V. The specific capacity decreases with the increased content of Li, because the inactive Li+ dopant does not participate in the electrochemical reaction but can effectively restrain the unfavorable Na+/vacancy ordering.
Fig. 6. Charge and discharge profiles of (a) P′2-Na0.67MnO2 and (b) P′2-Na0.67Li0.05Mn0.95O2 at 20 mA g−1. (c) Rate capability comparison of and P′2-Na0.67MnO2 and P′2-Na0.67Li0.05Mn0.95O2 at different rates. (d) Cycle performance of P′2-Na0.67MnO2 and P′2-Na0.67Li0.05Mn0.95O2 at 50 mA g−1.
The cyclic voltammograms (CV) and dQ/dE curves of P′2-Na0.67MnO2 in Fig. S12 and S13† show two main pairs of peaks at 3.54/3.39 and 2.50/2.19 V and additional multiple redox peaks, which are assigned to the phase transition reaction and Na+/vacancy ordering.15 The multiple redox peaks of Na0.67LixMn1−xO2 (x = 0.03, 0.05 and 0.08) weaken, and disappear when the Li content increases, further indicating that the Na+/vacancy ordering can be suppressed by substitution of Mn3+ with Li+. In addition, based on the equation i = avb, capacitive storage of Na+ in P′2-Na0.67LixMn1−xO2 (x = 0, 0.05 and 0.08) is demonstrated by quantitative electrochemical kinetics calculation, in which the values of b determining the sodiation and desodiation behaviors are exhibited in Fig. S14.† This indicates that the electrochemical process is partially controlled by capacitive behavior. The capacitive contribution of peak 1 of P′2-Na0.67Li0.05Mn0.95O2 ranges from 44.12% to 72.58% at the various scan rates from 0.1 to 1.0 mV s−1. A larger capacitive contribution can be observed with the increase of Li content. Fig. 6c presents the rate capability of P′2-Na0.67MnO2 and P′2-Na0.67Li0.05Mn0.95O2 at various current densities ranging from 0.08 to 4C. (1C = 250 mA g−1). P′2-Na0.67Li0.05Mn0.95O2 delivers high reversible capacities of 187.3, 177.3, 139.2 and 118.5 mA h g−1 at 0.2, 0.4, 2 and 4C, respectively. The superior rate capability of P′2-Na0.67Li0.05Mn0.95O2 is benefited from its expanded spacing of Na+ layers and solid–solution reaction with fast Na+ kinetics.
The long-term cycling stability of prepared P′2-Na0.67MnO2 and P′2-Na0.67Li0.05Mn0.95O2 within 1.8–4.3 V at the current of 50 mA g−1 is shown in Fig. 6d. P′2-Na0.67Li0.05Mn0.95O2 exhibits good capacity retention of 90.3% after 100 cycles, corresponding to a capacity loss of around 0.097% per cycle. The coulombic efficiency of P′2-Na0.67Li0.05Mn0.95O2 remains above 99%. In contrast, the capacity retention of P′2-Na0.67MnO2 is only 48.0% after 100 cycles. This is attributed to the Li incorporation in P′2-Na0.67Li0.05Mn0.95O2, which can effectively suppress the J–T distortion and Na+/vacancy ordering and facilitate the structural stability and facile Na+ transport.
Conclusions
In summary, Li substitution in P′2-Na0.67MnO2 has been demonstrated to be an impactful strategy to suppress the detrimental J–T distortion and Na+/vacancy ordering to enhance its structural stability. The inactive Li+ in the TMO2 layers tends to prevent the anisotropic change of the Mn–O bond and promotes its bond strength, leading to a more stable skeleton and contraction of TMO2 layers. The J–T distortion of [MnO6] octahedra in P′2-Na0.67Li0.05Mn0.95O2 is effectively mitigated during phase transitions, and the volume change in P′2–P′′2 transition is merely 1.30%, which enable good cycling stability (90.3% capacity retention after 100 cycles at 50 mA g−1). The suppressed Na+/vacancy ordering with enlarged Na interlayer spacing and low activation energy barrier (∼0.53 eV) yields superior rate capability (118.5 mA h g−1 at 1.0 A g−1). This investigation sheds light on the design of advanced electrode materials by tuning their chemical environments for high-performance SIBs.
Conflicts of interest
There are no conflicts to declare.
Supplementary Material
Acknowledgments
Financial support from the National Natural Science Foundation of China (grant no. 21835004, 21822506, and 51761165025), the Tianjin Natural Science Foundation (grant no. 19JCJQJC62400), and the 111 project of B12015 is acknowledged.
Electronic supplementary information (ESI) available. See DOI: 10.1039/d0sc05427e
Notes and references
- Wang Q. Mariyappan S. Vergnet J. Abakumov A. M. Rousse G. Rabuel F. Chakir M. Tarascon J.-M. Adv. Energy Mater. 2019;9:1901785. doi: 10.1002/aenm.201901785. [DOI] [Google Scholar]
- Zhao C. Yao Z. Wang Q. Li H. Wang J. Liu M. Ganapathy S. Lu Y. Cabana J. Li B. Bai X. Aspuru-Guzik A. Wagemaker M. Chen L. Hu Y.-S. J. Am. Chem. Soc. 2020;142:5742. doi: 10.1021/jacs.9b13572. [DOI] [PMC free article] [PubMed] [Google Scholar]
- Wang C. Du D. Song M. Wang Y. Li F. Adv. Energy Mater. 2019;9:1900022. doi: 10.1002/aenm.201900022. [DOI] [Google Scholar]
- Zhang X. Guo S. Liu P. Li Q. Xu S. Liu Y. Jiang K. He P. Chen M. Wang P. Zhou H. Adv. Energy Mater. 2019;9:1900189. doi: 10.1002/aenm.201900189. [DOI] [Google Scholar]
- Wang C. Wang L. Li F. Cheng F. Chen J. Adv. Mater. 2017;29:1702212. doi: 10.1002/adma.201702212. [DOI] [PubMed] [Google Scholar]
- Jiang K. Xu S. Guo S. Zhang X. Zhang X. Qiao Y. Fang T. Wang P. He P. Zhou H. Nano Energy. 2018;52:88. doi: 10.1016/j.nanoen.2018.07.042. [DOI] [Google Scholar]
- Cao B. Liu Z. Xu C. Huang J. Fang H. Chen Y. J. Power Sources. 2019;414:233. doi: 10.1016/j.jpowsour.2019.01.001. [DOI] [Google Scholar]
- Wang P.-F. Weng M. Xiao Y. Hu Z. Li Q. Li M. Wang Y.-D. Chen X. Yang X. Wen Y. Yin Y.-X. Yu X. Xiao Y. Zheng J. Wan L.-J. Pan F. Guo Y.-G. Adv. Mater. 2019;31:1903483. doi: 10.1002/adma.201903483. [DOI] [PubMed] [Google Scholar]
- Xiao Y. Abbasi N. M. Zhu Y.-F. Li S. Tan S.-J. Ling W. Peng L. Yang T. Wang L. Guo X.-D. Yin Y.-X. Zhang H. Guo Y.-G. Adv. Funct. Mater. 2020;30:2001334. doi: 10.1002/adfm.202001334. [DOI] [Google Scholar]
- Rong X. Hu E. Lu Y. Meng F. Zhao C. Wang X. Zhang Q. Yu X. Gu L. Hu Y.-S. Li H. Huang X. Yang X.-Q. Delmas C. Chen L. Joule. 2019;3:1. doi: 10.1016/j.joule.2018.10.022. [DOI] [Google Scholar]
- Mu L. Feng X. Kou R. Zhang Y. Guo H. Tian C. Sun C.-J. Du X.-W. Nordlund D. Xin H. L. Lin F. Adv. Energy Mater. 2018;8:1801975. doi: 10.1002/aenm.201801975. [DOI] [Google Scholar]
- Ma C. Alvarado J. Xu J. Clément R. J. Kodur M. Tong W. Grey C. P. Meng Y. S. J. Am. Chem. Soc. 2017;139:4835. doi: 10.1021/jacs.7b00164. [DOI] [PubMed] [Google Scholar]
- Wang P.-F. Yao H.-R. Liu X.-Y. Yin Y.-X. Zhang J.-N. Wen Y. Yu X. Gu L. Guo Y.-G. Sci. Adv. 2018;4:eaar6018. doi: 10.1126/sciadv.aar6018. [DOI] [PMC free article] [PubMed] [Google Scholar]
- Xu J. Lee D. H. Clément R. J. Yu X. Leskes M. Pell A. J. Pintacuda G. Yang X.-D. Grey C. P. Meng Y. S. Chem. Mater. 2014;26:1260. doi: 10.1021/cm403855t. [DOI] [Google Scholar]
- Kumakura S. Tahara Y. Kubota K. Chihara K. Komaba S. Angew. Chem., Int. Ed. 2016;55:12760. doi: 10.1002/anie.201606415. [DOI] [PubMed] [Google Scholar]
- Kumakura S. Tahara Y. Sato S. Kubota K. Komaba S. Chem. Mater. 2017;29:8958. doi: 10.1021/acs.chemmater.7b02772. [DOI] [Google Scholar]
- Stoyanova R. Carlier D. Sendova-Vassilev M. Yoncheva M. Zhecheva E. Nihtianova D. Delmas C. J. Solid State Chem. 2010;183:1372. doi: 10.1016/j.jssc.2010.04.024. [DOI] [Google Scholar]
- Choi J. U. Yoon C. S. Zhang Q. Kaghazchi P. Jung Y. H. Lee K.-S. Ahn D.-C. Sun Y.-K. Myung S.-T. J. Mater. Chem. A. 2019;7:202. doi: 10.1039/C8TA08796B. [DOI] [Google Scholar]
- Park Y. J. Choi J. U. Jo J. H. Jo C.-H. Kim J. Myung S.-T. Adv. Funct. Mater. 2019;29:1901912. doi: 10.1002/adfm.201901912. [DOI] [Google Scholar]
- Choi J. U. Park Y. J. Jo J. H. Kuo L.-Y. Kaghazchi P. Myung S.-T. ACS Appl. Mater. Interfaces. 2018;10:40978. doi: 10.1021/acsami.8b16522. [DOI] [PubMed] [Google Scholar]
- Mullaliu A. Gaboardi M. Plaisier J. R. Passerini S. Giorgetti M. ACS Appl. Energy Mater. 2020;3:5728. doi: 10.1021/acsaem.0c00669. [DOI] [Google Scholar]
- Li X. Ma X. Su D. Liu L. Chisnell R. Ong S. P. Chen H. Toumar A. Idrobo J.-C. Lei Y. Bai J. Wang F. Lynn J. W. Lee Y. S. Ceder G. Nat. Mater. 2014;13:586. doi: 10.1038/nmat3964. [DOI] [PubMed] [Google Scholar]
- Lei K. Zhu Z. Yin Z. Yan P. Li F. Chen J. Chem. 2019;5:3220. [Google Scholar]
- Clément R. J. Billaud J. Armstrong A. R. Singh G. Rojo T. Bruce P. G. Grey C. P. Energy Environ. Sci. 2016;9:3240. doi: 10.1039/C6EE01750A. [DOI] [Google Scholar]
- Billaud J. Singh G. Armstrong A. R. Gonzalo E. Roddatis V. Armand M. Rojo T. Bruce P. G. Energy Environ. Sci. 2014;7:1387. doi: 10.1039/C4EE00465E. [DOI] [Google Scholar]
- Liu X. Zuo W. Zheng B. Xiang Y. Zhou K. Xiao Z. Shan P. Shi J. Li Q. Zhong G. Fu R. Yang Y. Angew. Chem., Int. Ed. 2019;58:18086. doi: 10.1002/anie.201911698. [DOI] [PubMed] [Google Scholar]
- Zhang K. Kin D. Hu Z. Park M. Noh G. Yang Y. Zhang J. Lau V. W.-H. Chou S.-L. Cho M. Choi S.-Y. Kang Y.-M. Nat. Commun. 2019;10:1. doi: 10.1038/s41467-018-07882-8. [DOI] [PMC free article] [PubMed] [Google Scholar]
- Grey C. P. Dupré N. Chem. Rev. 2004;104:4493–4512. doi: 10.1021/cr020734p. [DOI] [PubMed] [Google Scholar]
- Yan Z. Tang L. Huang Y. Hua W. Liu R. Gu Q. Indris S. Chou S.-L. Huang Y. Wu M. Dou S.-X. Angew. Chem., Int. Ed. 2019;131:1426. doi: 10.1002/ange.201811882. [DOI] [PubMed] [Google Scholar]
- Wang Q.-C. Meng J.-K. Yue X.-Y. Qiu Q.-Q. Song Y. Wu X.-J. Fu Z.-W. Xia Y.-Y. Shadike Z. Wu J. Yang X.-Q. Zhou Y.-N. J. Am. Chem. Soc. 2018;141:840. doi: 10.1021/jacs.8b08638. [DOI] [PubMed] [Google Scholar]
- Hwang J.-Y. Kim J. Yu T.-Y. Sun Y.-K. Adv. Energy Mater. 2019;9:1803346. doi: 10.1002/aenm.201803346. [DOI] [Google Scholar]
- Yabuuchi N. Kajiyama M. Iwatate J. Nishikawa H. Hitomi S. Okuyama R. Usui R. Yamada Y. Komaba S. Nat. Mater. 2012;11:512. doi: 10.1038/nmat3309. [DOI] [PubMed] [Google Scholar]
- Pang W. K. Kalluri S. Peterson V. K. Sharma N. Kimpton J. Johannessen B. Liu H. K. Dou S. X. Guo Z. Chem. Mater. 2015;27:3150. doi: 10.1021/acs.chemmater.5b00943. [DOI] [Google Scholar]
- Wang Y. Xiao R. Hu Y.-S. Avdeev M. Chen L. Nat. Commun. 2015;6:1. doi: 10.1038/ncomms7954. [DOI] [PMC free article] [PubMed] [Google Scholar]
- Kang S. M. Park J.-H. Jin A. Jung Y. H. Jung Y. H. Mun J. Sung Y.-E. ACS Appl. Mater. Interfaces. 2018;10:3562–3570. doi: 10.1021/acsami.7b16077. [DOI] [PubMed] [Google Scholar]
- Li W. Lucht B. L. J. Power Sources. 2007;168:258. doi: 10.1016/j.jpowsour.2007.02.055. [DOI] [Google Scholar]
- Steinberg S. Dronskowski R. Crystals. 2018;8:225. doi: 10.3390/cryst8050225. [DOI] [Google Scholar]
- Dronskowski R. Bloechl P. E. J. Phys. Chem. 1993;97:8617. doi: 10.1021/j100135a014. [DOI] [Google Scholar]
- Maintz S. Deringer V. L. Tchougréeff A. L. Dronskowski R. J. Comput. Chem. 2016;37:1030. doi: 10.1002/jcc.24300. [DOI] [PMC free article] [PubMed] [Google Scholar]
- Kresse G. Hafner J. Phys. Rev. B: Condens. Matter Mater. Phys. 1993;47:558–561. doi: 10.1103/PhysRevB.47.558. [DOI] [PubMed] [Google Scholar]
Associated Data
This section collects any data citations, data availability statements, or supplementary materials included in this article.


