



SUMMARY
The activities of RNA polymerase and the spliceosome are responsible for the heterogeneity in the abundance and isoform composition of mRNA in human cells. However, the dynamics of these megadalton enzymatic complexes working in concert on endogenous genes have not been described. Here, we establish a quasi-genome-scale platform for observing synthesis and processing kinetics of single nascent RNA molecules in real time. We find that all observed genes show transcriptional bursting. We also observe large kinetic variation in intron removal for single introns in single cells, which is inconsistent with deterministic splice site selection. Transcriptome-wide footprinting of the U2AF complex, nascent RNA profiling, long-read sequencing, and lariat sequencing further reveal widespread stochastic recursive splicing within introns. We propose and validate a unified theoretical model to explain the general features of transcription and pervasive stochastic splice site selection.
Graphical abstract

In brief
Most introns are removed from human pre-mRNAs in chunks rather than spliced as whole units, which has implications for understanding mechanisms and patterns of alternative splicing.
INTRODUCTION
Gene expression programs vary among cells through programmed and random processes, and a challenge of single-cell analysis is to distinguish between functional variation and time-dependent fluctuations, which may not be associated with a stable phenotype (Raj and van Oudenaarden, 2008). At the heart of this heterogeneity is the dynamic nature of transcription and splicing. Megadalton complexes such as the transcription pre-initiation complex turn over on chromatin on the timescale of seconds (Zhang et al., 2016). Likewise, the spliceosome dynamically assembles and disassembles on nascent pre-mRNA during RNA synthesis to carry out intron removal and exon ligation (Wahl et al., 2009). There is extensive co-regulation between splicing and transcription (Drexler et al., 2020; Herzel et al., 2017; Zhang et al., 2021), indicating these processes work in concert in the intricate milieu of the nucleus. For some human genes, the contribution of stochastic RNA synthesis (transcriptional ‘‘bursting’’) to expression heterogeneity is substantial (Rodriguez et al., 2019). Similarly, splicing, which is coupled with transcription, is also likely to exhibit randomness. However, the question of how the stochastic nature of transcription might influence splice site selection and spliceosome assembly has not been addressed, and this coupling has never been directly observed for human genes in living cells.
The prevailing view of the spliceosome is that of a high-fidelity, deterministic enzyme. It assembles through a stepwise pathway consisting of a pre-spliceosome, catalytic activated spliceosome, and post-spliceosomal complex (Will and Lührmann, 2011). The spliceosome is able to correctly identify the landmark sequence elements defining the intron, splice donors, acceptors, and branchpoints against a background of degenerate splice sites (Lim and Burge, 2001). In higher eukaryotes, these sequence elements are frequently separated by tens or hundreds of kb, yet the spliceosome is able to accurately and efficiently recognize them to allow rapid splicing, sometimes shortly after the nascent pre-mRNA emerges from RNA polymerase II (RNAPII) (Oesterreich et al., 2016).
Yet, emerging evidence suggests a complementary view of splicing. Heterogeneity in assembly pathways has now been observed in vitro using single-molecule methods (Shcherbakova et al., 2013). Splicing can occur co- or post-transcriptionally (Ameur et al., 2011; Coulon et al., 2014; Girard et al., 2012; Vargas et al., 2011). Competing pathways for intron removal, such as recursive splicing (RS; an intron being spliced in multiple steps instead of one), have been documented in Drosophila (Burnette et al., 2005; Hatton et al., 1998) and humans (Duff et al., 2015; Sibley et al., 2015). Spliceosome profiling and nascent RNA sequencing have identified splicing intermediates, although the frequency and functionality of these intermediates are difficult to assess (Burke et al., 2018; Gazzoli et al., 2016; Joseph et al., 2018; Kelly et al., 2015; Pai et al., 2017; Zhang et al., 2018b). These studies suggest that the transient nature of pre-mRNA splicing may provide an enormous hurdle for capturing the true diversity of intermediates by RNA sequencing. Thus, the ability to directly observe transcription and splicing of single nascent transcripts in living cells with second time resolution on a genome-wide scale would engender a broader understanding of the dynamic nature of expression variability and elucidate the workings of RNA polymerase and the spliceosome.
Here, we develop a single-cell, single-molecule system to quantify the coupled kinetics of splicing and transcriptional bursting on endogenous human genes. We find that all observed genes show transcriptional bursting and that burst sizes are highly similar across genes. Yet, we also observed an unanticipated degree of kinetic variation in splicing for single introns, which can be removed in minutes or persist for >1 h, even for pre-mRNA synthesized from the same locus in the same cell. These data are inconsistent with the prevailing model of deterministic spliceosome activity and suggest an undescribed mechanism for splicing. Combined with the following observations based on multiple genome-wide ensemble assays, we propose the following model of ‘‘stochastic splice site selection’’: (1) photoactivatable ribonucleoside enhanced crosslinking and immunoprecipitation (PAR-CLIP) showed pervasive binding of the U2AF heterodimer, indicating potential spliceosome assembly throughout introns; (2) pulse-chase and long-read nascent RNA sequencing revealed the usage of these unannotated intronic splice sites; and (3) an improved lariat sequencing method further identified byproducts of the splicing reaction throughout introns. Moreover, we achieved direct visualization of stochastic splice site selection through a dual-color labeling scheme in the intron of an endogenous human gene. The view that emerges is that in human cells, splicing may occur far more often than previously thought. We propose that the spliceosome relies on progressive intron removal rather than a single deterministic enzymatic step as an explanation for the kinetics we observe in single cells. In summary, our results provide fundamental kinetic insight into the operation of the spliceosome.
RESULTS
High-throughput single-molecule imaging of nascent RNA reveals transcription principles and single-intron splicing dynamics
To achieve quasi-genomic scale detection of transcription and splicing dynamics, we designed a high-throughput system by integrating RNA stem loops into introns of endogenous genes through the gene-trap (GT) strategy, single-cell cloning, and deep sequencing (Figures 1A and S1A; STAR Methods). We constructed a GT cassette containing a splicing acceptor, a promoterless dual-selection reporter, and a poly(A) signal. This GT cassette was flanked by two flippase recognition target (FRT) sites and followed either by 24X MS2 or PP7 stem loops. After lentiviral integration, a cell needed to satisfy three selection criteria to survive antibiotic selection: (1) the GT vector inserted into an intron, (2) the dual-selection reporters were correctly spliced to form a fusion transcript with an endogenous gene, and (3) the selection reporters were in the correct reading frame for translation. The GT cassette was removed with recombinase after selection, leaving only the stem loops in introns (Figures S1B–S1D). To identify the integration sites of the stem loops, we performed ligation-mediated PCR sequencing (Wu et al., 2003) using the lentiviral 3′ long terminal repeat (LTR) sequence. We identified 940 and 8,178 unique integration sites with MS2 or PP7 stem loops, respectively. Consistent with our design, over 70% of these insertion sites resided in annotated introns (Table S1; Figures S1E–S1H).
Figure 1. Single-molecule imaging of nascent RNA reveals general principles of transcriptional bursting.

(A) Design of gene-trap (GT) vector to integrated stem loops genome-wide at endogenous loci. SA, splicing acceptor; pA, poly(A); 2A, self-cleaving peptides.
(B) A pipeline illustration for high-throughput imaging and analysis of nascent RNA dynamics.
(C) Representative live-cell traces from three different genes showing fluorescence intensity of TS (black) and hidden Markov model (HMM) fitting (red).
(D) Live-cell traces (n = 1,225) from single-cell clones and the polyclonal population. Hierarchical clustering is based on the distance matrix calculated through integrated periodogram.
(E) Cumulative frequency for ON time and OFF time distributions of three clusters (cluster 1, chocolate; cluster 2, cyan; cluster 3, lavender).
We measured the transcription and splicing dynamics in real time using high-throughput imaging and analysis. The fluorescent intensity at transcription site (TS) was tracked in single cells over 12 h with 100-s intervals (Figure 1B; Video S1). The genes showed discrete ON and OFF periods directly visualized by fluorescence, which are characteristic of transcriptional bursting (Figure 1C). The duration of the ON period is dominated by the chromatin-associated nascent RNA dwell time, including elongation, splicing, and/or termination and release. Meanwhile, the ON time also reflects the permissive period of the promoter when transcripts can initiate during a transcriptional burst. The OFF time corresponds to the complete absence of visible nascent RNA.
The single-cell time-lapse traces from a cohort of polyclonal cells representing 772 unique intronic insertion sites for 442 genes revealed surprisingly consistent kinetic behavior for human transcription. We analyzed >1,200 time-series traces. To assay the diversity of kinetic behavior, we calculated the integrated periodogram distance between individual traces, which is a function to analyze the frequency-domain coherence between signals. With the periodogram distance matrix, we identified three major clusters (1, 2, and 3) based on these human gene transcription kinetics (Figure 1D). We used hidden Markov modeling to segment the ON and OFF periods and generate cumulative distribution functions (CDFs) of bursting dynamics (Figures 1C and 1E). Empirical CDFs for ON and OFF periods from each cluster revealed strong similarity in the ON periods, but the OFF CDFs vary between clusters. Specifically, the scaled variability in ON times within traces (coefficient of variation [CV] = 0.8) is greater than the variation in the mean between traces (CV = 0.6), which is not observed for OFF times (CV = 0.9 for both inter- and intra-trace variation). In other words, any single trace from any single cell for any single intron captures most of the diversity of RNA dwell times, but OFF times are gene specific. Thus, the striking features of this dynamic analysis are that (1) all genes we observed in human cells showed bursting behavior, (2) bursting frequencies are distinct between genes, and (3) the nascent RNA dwell time is similar across virtually all measured genes.
We selected 10 unique genes for further investigation of transcription and splicing dynamics. These genes were dispersed among different dynamic clusters and chromosomes (Figures 2A, S1I, and S1J). The size of the intron containing the MS2 cassette varied from 532 bp in SEC16A to 69,000 bp in RAB7A. Through single-molecule fluorescence in situ hybridization (smFISH) analysis on all 10 selected cell lines, we confirmed no significant change in the abundance of mature mRNA/cell, number of TSs per nucleus, the frequency of TSs, or the intensity of TSs (Figure S2), indicating our system faithfully reflects the endogenous transcription and splicing behavior. Analysis of the time-lapse data for each clone (Figure 2B) revealed that the ON time distribution showed less variability across all 10 genes than within each gene. In contrast, we observed distinct and widely varying OFF times among different genes (Figure 2C; Table S2). As a result, the heterogeneity in cellular RNA levels by smFISH is primarily determined by variability in OFF periods, which can last many hours (Figure 2D).
Figure 2. The kinetic features of human transcription.

(A) Ideogram of genes selected for clonal analysis.
(B) Heatmap of intensity traces from six genes. Each row represents a single cell recorded for 12 h with 100-s intervals. Traces are sorted according to the duration of the first OFF period.
(C) Cumulative frequency of ON time and OFF time distribution for genes in (A).
(D) The heterogeneity of mRNA in single cells correlate with transcription OFF time. Correlation between OFF time (τoff) and the coefficient of variation (CV) in single-cell mRNA distribution. R2 = 0.54. mRNA distribution for TFF1 is from our previous work (Rodriguez et al., 2019).
The intronic stem-loop labeling enabled us to record the splicing kinetics for single introns. According to the deterministic model of splicing, the ON time is the elongation time to the 3′ splice site (3′ SS) plus the splicing time. Surprisingly, despite ~100-fold variation in intron size, we observe only 3-fold variation in median nascent RNA dwell times (Figures 3A and 3B). Moreover, the broad ON time distribution (Figure 3A) indicates multiple kinetic populations for single-intron removal; some splicing events occurred after RNAPII would be expected to reach the transcription termination site, which can be explained by slow intron removal and/or retention of unspliced transcripts (Khodor et al., 2012; Pandya-Jones et al., 2013). More remarkably, for genes with long introns (e.g., RAB7A and RHOA), the disappearance of the intron signal mostly occurred before RNAPII would be expected to transcribe the annotated 3′ SS (Figure 3B). Even for shorter introns, we observed a fraction of events occurring before the estimated time to reach the splice acceptor (e.g., SLC2A1; Figure 3A). These data suggest either unexpected splicing activity or elongation speeds far in excess of those previously reported (Danko et al., 2013).
Figure 3. Single-intron imaging reveals stochastic splicing kinetics.

(A) Probability distribution of ON time from dynamic single-cell imaging. Gene structure, intron length, and MS2 insertion sites are shown. Dashed lines indicate estimated time points when RNAPII reaches the 3′ SS and the transcription termination site (TTSs).
(B) Collective ON time distribution of 10 genes (median with 95% confidence interval). (C) Inhibition of splicing resulted in prolonged ON times. Integrated live-cell imaging traces with 100-s intervals for RAB7A with mock or pladienolide B (plad B; 1 µM) treatment.
(D) Cumulative frequency of ON time distribution for RAB7A with mock or plad B (10 nM, 100 nM, and 1 µM) treatment.
(E–G) Rates of in situ transcription and splicing measured in a population of cells. (E) Transcription was synchronized with 100 µM DRB treatment for 3 h. After DRB washout, a transcription wave visualized by live-cell imaging. (F) Schematic representation of ensemble splicing kinetics measurement. (G) Transcription of exon 2 (Ex2-In2) and splicing of intron 1 (Ex1-In2) of RAB7A in WT (left) and RAB7A-MS2 engineered cells (right) are measured by qPCR. The gene structure is shown below each graph with arrows indicating the exon-intron junctions that are analyzed. Green bar indicates the insertion site for MS2 stem loops. Average trace intensity reflecting transcription wave measured through live-cell imaging (gray curves) is shown in the same chart for the MS2-engineered clones. Right y axis indicates the fluorescent intensity (A.U.) from live-cell imaging. Error bars represent SEM.
We first explored whether the disappearance of intronic stem-loop signal reflected the splicing dynamics of nascent RNA. First, we treated the cells with splicing inhibitors, spliceostatin (SSA) and pladienolide B (plad B), both resulting in an increase in the nascent RNA dwell time (Figures 3C, 3D, and S3A–S3D). Second, we adopted a previously established method to measure the splicing kinetics of several of our target pre-mRNA, which relies on qRT-PCR of intron/exon boundaries following synchronization and washout of 5,6-dichlorobenzimidazole 1-β-D-ribofuranoside (DRB) (Singh and Padgett, 2009; Figures 3E–3G, S3E, and S3F; STAR Methods). The shift of the two curves is an ensemble measurement of splicing dynamics. The average ensemble splicing rate was 9.7 ± 5.4 min in wild-type (WT) cells and 9.8 ± 3.5 min in engineered cells. The average RNAPII elongation rate was 1.8 ± 0.5 kb/min and 2.1 ± 0.4 kb/min, respectively. These elongation rates were consistent with previous measures (Jonkers and Lis, 2015). In summary, the frequency of these fast events cannot be explained by the prevailing view of transcription and splicing, which is predicated on a processive polymerase traveling 2–4 kb/min and a spliceosome removing introns through a single splicing step once the 3′ SS is synthesized.
U2AF binding marks sites of active splicing within introns
We hypothesized that the spliceosome might be relying extensively on RS to remove the intron in smaller pieces rather than splicing the entire intron in one step (Burnette et al., 2005; Hatton et al., 1998). To probe this hypothesis, we performed PAR-CLIP for the U2AF heterodimer, which recognizes the 3′ SS (Moore, 2000; Palangat et al., 2019; Ruskin et al., 1988; Figures 4A, S4A, and S4B). We carried out this crosslinking on the nuclear fraction using a modified protocol which keeps the U2AF heterodimer consisting of U2AF1 and U2AF2 intact. Surprisingly, among 335,894 high-confidence U2AF footprints, 210,113 (62.55%) resided in introns at unannotated sites (Figure 4B; Data S1). A sequence logo constructed from U2AF heterodimer footprints showed the expected enrichment of a polypyrimidine track followed by a 3′ SS AG motif. Intronic U2AF footprints often contained a potential RS site consisting of a 3′ SS immediately followed by a 5′ SS (AGGU) and are highly enriched in longer introns (Figures 4C and 4D). For example, the first RAB7A intron contains 22 U2AF peaks (Figure 4E), and the first RHOA intron contains 14 U2AF peaks (Figure S4C). These peaks had comparable signal to footprints localizing to the annotated 3′ SS site, showed the expected T-to-C mutations (which are a signature of direct interaction in PAR-CLIP), and were similar in sequence composition to bona fide splice acceptors. These data indicate the possible assembly of functional spliceosomes ubiquitously throughout introns.
Figure 4. PAR-CLIP of U2AF heterodimer indicates pervasive intronic binding.

(A) Experimental design for PAR-CLIP of the U2AF heterodimer in the nuclear fraction.
(B) Distribution of U2AF-complex footprints across annotation categories.
(C) Sequence logo from U2AF footprints on annotated SSs, within introns and intergenic regions.
(D) Correlation between U2AF footprints abundance and intron length. Each dot corresponds to one intron.
(E and F) U2AF footprints in RAB7A. U2AF footprints are identified within introns (blue vertical hash marks) as well as at the annotated 3′ SS. Read coverage for representative U2AF complex footprints identified in intron are shown (marked by cyan rectangles). T > C transitions in the sequenced reads indicate direct binding and successful crosslinking. Maximum entropy score is labeled for each potential SS.
(G) Validation of the RS events by primer-extension sequencing. Each splice junction is represented by an arc from the beginning to the end of the junction. The arc thickness is proportional to the read coverage. Primer positions are indicated by red vertical hash marks.
(H) An overlay between RS event and U2AF complex footprint identified in RAB7A first intron is shown (region marked by cyan rectangle in G). Junction reads indicating the splicing event are detected through primer-extension sequencing.
Active RS should additionally recruit the U1 small nuclear ribonucleoprotein particle (snRNP) immediately adjacent to U2AF sites. We analyzed previously published CLIP data on U1A and U1C (So et al., 2019) and found that both components of the U1 snRNP were enriched around the intronic U2AF peaks. As control, the RNA-binding protein hnRNPC showed no enrichment (Figures S4D and S4E). Thus, both the cis-acting motif and the trans-acting binding proteins are consistent with extensive RS throughout introns.
To test whether the U2AF intronic binding sites lead to any functional splicing output, we sequenced steady-state nascent RNA isolated through 10-min 4-thiouridine (4sU) incorporation and purification (Figures S4F and S4G). We identified ~18,000 unique unannotated splice junctions (Figure S4H). These novel junctions represent splice site consensus motifs and tend to occur in longer introns (Figures S4I and S4J). However, due to the (potentially) transient nature of stochastic splicing intermediates, only one junction read (out of 159 canonical junction reads) within the first RAB7A intron was detected. We then used targeted primer extension followed by sequencing in the RAB7A intron around putative RS sites detected by PAR-CLIP and motif analysis (Figure 4G). Of the 16 sites we tested, we verified 4 through multiple junction reads ligating the 5′ exon to SSs within the first intron, indicating the active usage of intronic 3′ SSs (Figure 4H). These data further confirmed the usage of unannotated SSs within introns in the human genome. However, the frequency of detection of these RS events by sequencing nascent RNA is far less than we would expect based on our live-cell analysis, raising two questions: (1) how frequently do these events occur for a single intron, and (2) how pervasive is RS across the genome?
Single-molecule live-cell imaging of stochastic splice site selection
We hypothesized that unannotated sites (RS or otherwise) within introns are used frequently but randomly, which would explain both our time-resolved data (i.e., Figure 3A) and the observation that these products elude detection by RNA sequencing. We call this model stochastic splice site selection, and the primary mechanistic prediction is that the spliceosome uses internal RS to progressively remove the intron by executing many enzymatic steps instead of one. We wished to test this prediction by following the fate of a single intron through multiple splicing reactions in steady-state cells not exposed to any inhibitors. To do so, we inserted PP7 stem loops 63 kb downstream of the MS2 stem loops but in the same intron of RAB7A using CRISPR-Cas9 (Figure S5). The orthogonal binding of coat protein enables dynamic dual-color observation of the same intron. A characteristic time trace shows two rounds of transcription and splicing to demonstrate stochastic splice site selection (Figure 5A; Video S2). The 5′ intronic green signal always temporally precedes the 3′ intronic red signal, but in the first round, the 5′ label decreases before the 3′ label, indicating this intron was removed in independent, progressive splicing reactions, while in the second round, both labels disappear together, indicating the intron was removed as a single 69-kb piece.
Figure 5. Direct visualization of stochastic splice site selection in real time.

(A) Schematic of the dual-color labeling in RAB7A first intron (top). MS2 stem loops were integrated ~5 kb downstream of exon1. PP7 stem loops were integrated via CRISPR-Cas9 746 bp upstream of exon 2. The distance between MS2 and PP7 stem loops is ~63 kb. Representative live-cell traces showing the occurrence of RS (1) and canonical splicing (2) in a single cell in real time (bottom) (Video S2).
(B) The fluctuation analysis of dual-color fluorescence traces. Approximated fluorescence profile describing the transcription and splicing in RAB7A. The fluorescence signals rise as ramps when stem loops are transcribed and fall when splicing occurs. Three limiting scenarios are described by cross-correlation functions: (1) no RS makes the MS2 to PP7 cross-correlation (blue curve) start as a plateau at τ = 0; (2) all RS imposes the cross-correlation to have a G(τ)=0 at τ = 0 delay; and (3) the hybrid model, which is the combination of the above two scenarios, indicating the occurrence of both RS and canonical splicing. The change of slope at τ = 0 delay is indicative of the fraction of RS events occurring.
(C) Autocorrelations of MS2 (green) and PP7 (red) signals from experimental traces (n = 19).
(D) Cross-correlation of dual-color time traces (n = 19). Error bars represent SEM (bootstrap). Fraction of RS events are calculated according to the slop change at τ = 0 (inset).
(E–I) Stochastic splice site selection is functionally important for splicing efficiency. (E) Schematic of the targeting sites for antisense oligos (ASOs) and smFISH probes in the RAB7A first intron. Two sets of smFISH probes targeting intronic regions near 5′ SS (red) and 3′ SS (green) are indicated. (F) ASOs targeting RS sites result in the accumulation of intronic intermediates in the nucleus. Plad B (1 µM) treatment served as a positive control. Colocalizing foci indicate an intact RAB7A intron1. (G) Distribution of intronic intermediates in the nucleoplasm with ASO blocking. (H) Frequency of overlap between 3′ and 5′ probes with plad B treatment or ASO transfection. (I) Blocking RS sites with ASO compromises total splicing efficiency. The copy number of unspliced pre-mRNA and total spliced mRNA measured by ddPCR from samples collected 24 h after ASO transfection. Error bars represent SD.
To quantitatively analyze the frequency and extent of stochastic splice site selection over many traces, we used cross-correlation analysis (Coulon et al., 2014). Several possible limiting cases are depicted schematically in Figure 5B. For the prevailing model of transcription and splicing (minimal to no RS), the correlation function has a peak at a delay of 0 s. For introns removed entirely by piecewise splicing (i.e., all RS), the correlation vanishes at a delay of 0 s. A mix of both outcomes shows intermediate behavior. The autocorrelations for MS2 and PP7 signals show a similar y-intercept at τ = 0, indicating the same number of transcripts are observed in both channels, confirming there is no premature termination during the elongation process (Figure 5C). The experimental cross-correlation for the RAB7A intron shows a plateau centered on a delay τ of ~20 min, which is consistent with an elongation rate between the stem-loop cassettes of ~3 kb/min (Figure 5D). Importantly, the peak of this curve is greater than the value at τ = 0, indicating that introns are frequently removed in pieces rather than as a single lariat containing MS2/PP7 stem loops, although the latter does occur. By analyzing the geometry of the cross-correlation function (Coulon et al., 2014), we can provide a quantitative measure of the extent of RS; the RAB7A intron is removed as multiple RNA intermediates 57% of the time (Figure 5D, inset). In summary, single-molecule observation reveals that RS is the dominant pathway for removal of the RAB7A intron in generating a correctly spliced mRNA.
Next, we assessed the functional importance of RS in generating the final mRNA. We blocked potential RS sites in the RAB7A pre-mRNA with antisense oligos (ASOs) (Hua et al., 2010) and analyzed RNA intermediates by dual-color intronic smFISH and digital droplet PCR (ddPCR) (Figure 5E). We observed a striking change in the staining pattern of smFISH in the presence of SS-blocking ASO; the nucleus fills up with intronic RNA, but the 5′ and 3′ regions of the intron are distinct entities, as evidenced by the fact that on average only 24%–48% of the 3′ regions overlap with the 5′ regions. For control, we treated cells with plad B and observed intron signal in the nucleus, but the 3′ and 5′ regions co-localize, indicating the presence of intact introns and/or pre-mRNA when inhibiting splicing. Although the exact biochemical nature of this RNA species is unknown, this effect was observed in nearly every cell in the population, suggesting frequent usage of multiple RS sites within this long intron (Figures 5F–5H).
We tested whether the efficiency of splicing depended upon these internal RS sites. In the model of stochastic splice site selection, there are numerous places where the intron can be recursively spliced, and each one alone likely contributes little to the overall splicing efficiency; blocking one site simply means the spliceosome chooses another. Moreover, because nascent RNAs only account for 0.1%–0.5% of the total mRNAs, we required a method that would be sensitive to small fractional changes in splicing efficiency, so we turned to ddPCR to examine the splicing efficiency at the mRNA level. Specifically, we quantified the pre-mRNA molecules with intron-exon primers and mature mRNA with exon-exon primers. We observed that each ASO targeting a RS site led to a decrease in splicing efficiency compared to either a scrambled ASO or mock transfection ranging from 1.8- to 6.3-fold, depending on which RS was targeted (Figure 5I). Taken together, single-molecule imaging in living and fixed cells coupled with experimental measures of splicing efficiency indicates stochastic splice site selection and piecewise removal of introns is frequent and functional.
A unified model based on stochastic splice site selection describes transcription and splicing dynamics
To synthesize the transcriptome-wide U2AF footprinting and nascent RNA-sequencing data with our single-molecule splicing kinetics, we augmented a previously developed transcription model with stochastic splice site selection (Rodriguez et al., 2019; Methods S1). The model makes reversible stochastic transitions between hidden ‘‘gene states.’’ Transcription initiation is permitted only from one of the gene states whereupon the initiated pre-RNA proceeds irreversibly along a set of RNA steps. The MS2-labeled intron has an opportunity to be ejected from any of the steps. In contrast to exon dynamics, we found that intron dynamics displayed unexpected kinetic complexity, which necessitated the MS2-labeled intron being ejected (spliced) at multiple points in the transcription cycle (Figure 6A; Methods S1). We also explored the possibility that intron disappearance might correspond to premature termination or rapid degradation. Such events would be ‘‘off-pathway’’ processes not leading to mature mRNA. There are three experimental inputs: live-cell dynamics, fixed-cell smFISH, and RNA half-lives. Overall, there are two primary and independent outputs: (1) the ‘‘best fit’’ model, which contains the optimal number of gene (G) states and RNA (R) steps, and whether transcripts are on or off pathway; and (2) the dynamic splicing parameters.
Figure 6. A unified model based on stochastic splice site selection describes transcription and splicing dynamics.

(A) Generalized transcription model with stochastic intron ejection. X, Y, and Z indicate gene states; R indicates RNA steps; S indicates splicing steps; M is the mature transcript; and ∅ denotes RNA degradation.
(B) Occupancy distributions for gene states, actual burst size, visible burst size, and splicing probabilities at each RNA step. Circle area is proportional to state occupancy or probability. P indicates the post-transcriptional splicing. For splicing probabilities, the model could predict whether the splicing occurs within the labeled intron or after the synthesis of the 3′ SS (Table S3).
(C) The WAIC (Bayesian measure of model predictive ability accounting for model complexity) for all 20 models tested (Methods S1).
(D) Splicing kinetics of MYH9 and RAB7A intron 1 explained by the stochastic splice site selection model. Numbers in parentheses indicate co-transcriptional splicing probability at each R step.
(E) Splicing kinetics of MYH9 can be explained by an exponential distribution.
(F) U2AF complex binding profile for MYH9. The MS2 stem-loop insertion site (indicated by an arrowhead) is 4,019 bp upstream of the annotated 3′ SS. No U2AF complex footprint is detected between the MS2 insertion site and the 3′ SS.
(G) Model predicted splicing time distribution.
The combined FISH and live-cell data were explained by no more than three kinetically distinct gene states and five RNA steps (Figures 6B and 6C). R1 is the step when MS2 loops are synthesized, thus making the RNA visible in our experiment. The time intervals between the following R steps can thus be mapped to ‘‘positions’’ along the gene allowing one to further distinguish splicing events that occurred within the intron from those that occurred completely after synthesis of the intron. An example of a simple scenario of splicing is that of MYH9. The MS2 stem loops are integrated ~4 kb from the annotated 3′ SS, and our model predicts splicing occurs predominantly at RNA steps after the synthesis of this annotated splice site (Figure 6D). The raw data can also be simply described as an exponential decay from the peak, resulting in splicing with a time constant of 10.4 ± 0.2 min (Figure 6E). Thus, this gene represents the expected behavior of processive elongation to a nearby 3′ SS followed by splicing catalysis with a rate-limiting step. Moreover, these data are consistent with the absence of U2AF PAR-CLIP peaks downstream of the MS2 integration (Figure 6F). In comparison, the labeled RAB7A intron shows stochastic selection sites were used within the first intron with a probability of ~59%, which is consistent with our dual-color live-cell imaging measurement (Figure 6D). Overall, we find that genes toggle between inactive and permissive gene states, burst sizes are small (<5 RNA), and the median splice time is 8.2 min (Figures 6G and S6).
Critically, our model allows for many competing pathways for intron disappearance. We compared two outcomes with our model simulation: (1) intron ejection is due to RS and leads to a functional (on-pathway) transcript; and (2) intron ejection is caused or due to premature termination, incorrect splicing, or rapid decay of a transcript and results in an off-pathway transcript. Bayesian model selection criteria showed that on-pathway models were favored over off-pathway models in 8 out of the 10 genes (Figure 6B; Table S3), indicating the intron disappearance is primarily due to productive splicing rather than premature death of a transcript. In the genes where the on-pathway model was not favored, the model predicted that RS was negligible. In no gene did the model favor RS leading to nonviable transcripts.
Stochastic splice site selection is prevalent across the human genome
The generalized transcription model with stochastic splice site selection makes two testable predictions: (1) splicing occurs frequently within introns, and (2) these splicing events are intermediates en route to a spliced mRNA. However, an intrinsic difficulty in testing this model is that it predicts splicing intermediates are transient and chosen stochastically. Thus, RNA that results from stochastic splice site selection may be at low abundance in the sample. To enrich for this RNA population across the human transcriptome, we sequenced nascent RNA collected in a pulse-chase experiment designed according to our measured single-molecule splicing kinetics, as depicted schematically in Figure 7A (also see Figure S7A and STAR Methods). A key design feature is that we stop elongation at the end of the pulse with actinomycin D, but other enzymatic processes such as splicing are presumably free to continue. Using this approach, we were able to further enrich for splicing intermediates. We identified 5,828, 14,898, and 7,745 unique unannotated splice junctions at each time point. An example is shown for RAB7A (Figure S7B). The wave of elongating RNAPII is evident from the amount of nascent RNA visible at each time point. For example, at the 20-min time point, there is still little nascent RNA downstream of the first intron. Yet, at this same time point, there is an increase in the number of junction reads within the intron. Similarly, we captured multiple splicing intermediates within the first intron of RHOA (data not shown). To stringently select high-confidence RS junctions across the genome, we applied the following criteria: (1) there are more than four unique reads mapped for each junction, (2) the junction reads are not from Alu elements, (3) less than 25% of the junction sequence are of repetitive sequence, and (4) junction length is larger than 60 nt. With these criteria, we identified 5,468 high-confidence RS junctions across human genome, representing 1,243 genes (Figure 7B; Table S4). Among them, 2,359 are junctions join annotated 5′ SS to intronic sites, 2,657 are junctions join annotated 3′ SS to intronic sites, and 453 are junctions nested in introns. Taking a read cutoff of 0.5 counts per million to obtain the expressed genes in human bronchial epithelial cells (HBECs), it means that ~30% of genes produce transcripts that are recursively spliced. Thus, the extent of RS in human cells is far greater than previously reported (Duff et al., 2015; Sibley et al., 2015).
Figure 7. Stochastic splice site selection is a prevalent mechanism across human genome.
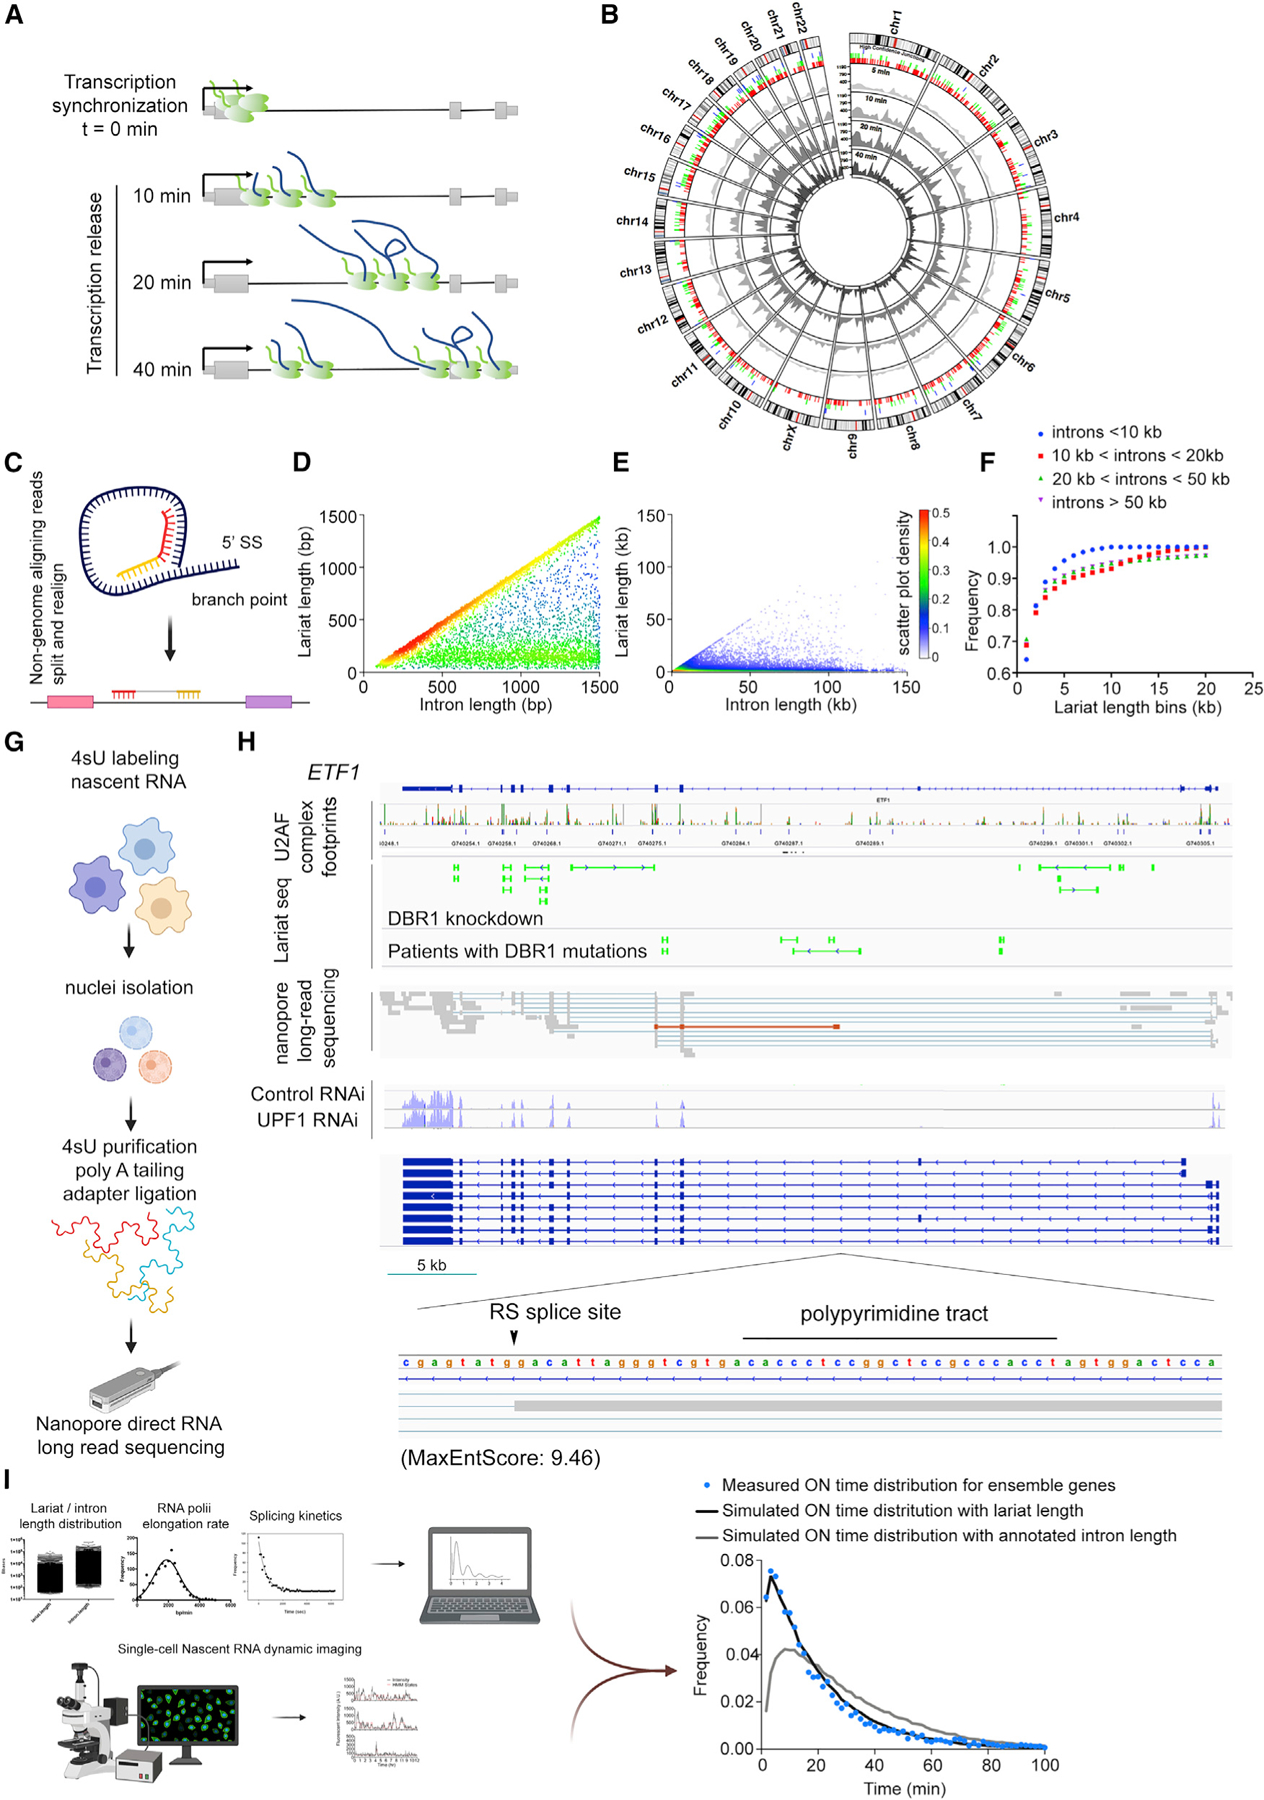
(A) The experimental design for pulse-chase nascent RNA sequencing.
(B) Circos plot overview of pulse-chase nascent RNA-sequencing data. The outer ring is a circular ideogram of the human genome labeled with chromosome number. The inner rings denote all the novel splice junctions detected at each pulse-chase time point. The positions of high-confidence RS sites are indicated by vertical bars between inner and outer rings. Red, splice junctions ligate annotated 5′ SS to a novel site; green, splice junctions ligate annotated 3′ SS to a novel site; blue, nested splice junctions within intron.
(C) Diagram illustration of lariat sequencing alignment strategy.
(D and E) Scatter density plot of lariat length versus intron length. Each dot represents a lariat and the intron it derived from. Intron length <1,500 bp are shown in (D) and <150 kb are shown in (E).
(F) Cumulative distribution of lariat length across binned intron length categories.
(G) Diagram of nascent RNA long-read sequencing with Nanopore direct RNA-sequencing approach.
(H) An overview of the stochastic splice site selection model revealed by multiple ensemble measurements, including U2AF complex footprints, lariat sequencing, and nascent RNA long-read sequencing (also see Figure S7). Lariat sequencing results are shown as split reads representing ligated 5′ SS and branch point (green). Direct nascent RNA long-read sequencing reads are shown in gray, with thick lines indicate mapped reads and thin lines indicated splice junctions. The RS intermediate is highlighted in brown. Annotated gene structures from RefSeq are shown below. UPF1 depletion data showed no accumulation of poison exons after NMD pathway perturbation. The sequence of the RS site is shown in a zoomed-in window.
(I) Simulation of nascent RNA dwell time (ON time) according to the sequencing measured lariat length distribution, our measure of RNAPII velocity (~2 kb/min), and our measure of splicing kinetics (8.2 min). The computed nascent RNA ON time recovered the empirical distribution of intronic dwell times from our live-cell imaging in polyclonal population (blue dots). There are no free fitting parameters. The computed dwell time using annotated intron size is shown as a comparison (gray line).
Our model predicts there should be detectable lariats reflecting stepwise splicing within introns. However, intron lariats are rapidly turned over through multiple pathways, and existing lariat capture techniques do not capture them at saturation (Taggart et al., 2017). To address this challenge, we developed an improved strategy for lariat sequencing based on reverse transcription across the branchpoints together with knockdown of the lariat debranching enzyme DBR1. This method achieved a ~2.5-fold enrichment of unique lariats compared to existing RNase R treatment protocols (Figures 7C and S7C; Table S4; Xiao and Wilusz, 2019) without enriching for short circular RNAs (Figures S7D and S7E). If all introns are spliced with one step, the lariats length distribution should follow a linear relationship with the introns they derived from. Intriguingly, the lariat length did not increase proportionally with intron length (Figures 7D–7F). Rather, full-length lariats for short introns (<1,500 bp) were readily detectable but are largely missing for longer introns (i.e., >25 kb) (Figures 7D and 7E). The average lariat length is 1,218 ± 3,075 bp, which is well below the average human intron size of 6,355 bp.
We next analyzed RNA-sequencing data from individuals with DBR1 mutations (Zhang et al., 2018a). These patients have biallelic germline mutations in DBR1 and are susceptible to brainstem viral infections. Notably, upon viral infection, dramatic lariat accumulation was detected in patient cells. We observed a similar lariat length distribution in the fibroblasts derived from these patients (Figures S7F and S7G).
The second prediction of the stochastic splice site selection model is that RS events (as evidenced by imaging, nascent RNA sequencing, and lariat sequencing) are on-pathway intermediates to generating a mature mRNA. To chase the fate of nascent transcripts with RS, we took advantage of direct RNA long-read nanopore sequencing (Figure 7G; STAR Methods). This technology allows us to see RS events in the context of downstream splicing events, as evidenced by the detection of complicated splicing intermediates in SRSF7 (Lareau et al., 2007; Figure S7I). We detected newly synthesized RNA from 1,004 annotated genes based on either a full or partial splice match, and we identified 162 transcripts with novel splicing donor or acceptor sites. 85% of these novel splicing events (either recursive or otherwise) showed additional downstream splicing events, indicating that transcription and splicing of the transcript continued after RS. For example, ETF1, a 41-kb gene, showed RS in its >20-kb first intron. Similarly, for SEMA4B, we detected one transcript activating the RS site upstream of the annotated 3′ SS (Figure S7J). In summary, usage of RS occurs in the context of processive elongation and downstream RNA processing. These data indicate that intronic SSs are activated and chased to downstream synthesis and processing, as opposed to premature termination or abortive elongation processes (Figures 7H and S7).
Although direct nascent RNA sequencing suggests that RS does not a priori result in abortive elongation or premature termination, this experiment does not address whether these transcripts, once released from chromatin, result in mature mRNA. For example, the absence of full-length lariats from long introns could also be explained by a nuclear decay pathway for aborted or incorrectly spliced pre-mRNA. To address this question, we compared the quantity of mRNA (poly(A)-selected) versus nascent RNA with sequencing data from the same cells, binned by transcript length. This metric allows the estimation of transcript loss due to various misprocessing events. The probability density distribution allowed us to estimate a loss of ~0.1% of mature transcript per kilobase (Figure S7H). While this attrition likely reflects inevitable random exon inclusion downstream of RS events that leads to off-pathway degradation, it is not sufficient to explain our kinetic data. We further compared our potential RS sites with well-characterized poison exons leading to transcript clearance by nonsense-mediated decay (NMD). 7.6% of our RS events could potentially result in poison exon inclusion revealed in UPF1 knockdown datasets (Attig et al., 2016; Tani et al., 2012; Figures S7K and S7L). Intriguingly, 13.4% of the RS events could salvage the transcripts by removing the poison exons (Figure S7M). In total, we conclude that stochastic splice site selection is predominantly an on-pathway process that occurs in virtually all introns but is especially preferred for introns >10 kb.
Finally, we asked whether we could quantitatively reconcile our live-cell imaging observations (Figures 1D and 1E) with genome-wide sequencing data (Figures 7D and 7E). Specifically, the empirical distribution of lariat sizes should be capable of predicting nascent RNA dwell time. The speed of RNAPII extracted from a normal distribution is approximately v = 2 kb/min (Jonkers et al., 2014), consistent with our ensemble qPCR measurement. The exponentially distributed splicing time from our model is s = 8.2 min. Computing the dwell time is then simply l/v + s, where l is the lariat length. We find that this computed dwell time agrees exceptionally well with the ON time distribution of our polyclonal live-cell imaging data. In comparison, the dwell time computed with annotated intron-length distribution captures neither the mean nor the shape of the live-cell distribution (Figure 7I). Thus, the stochastic splice site selection model engendered from dynamic nascent RNA imaging is corroborated by multiple genome-wide sequencing measurements.
DISCUSSION
By establishing a high-throughput system for labeling and imaging intronic RNA, we can directly measure RNAPII and the spliceosome working in concert on endogenous human genes. The striking similarity in nascent RNA dwell time distributions across all measured genes reflects a fundamental constraint on these processes: (1) all genes show transcriptional bursting but with small burst sizes of a few transcripts, and (2) intron removal is a highly variable kinetic process spanning minutes to hours. This latter observation led to our model of stochastic splice site selection, which explains how intron removal kinetics are due to both the process of splice site selection and the intrinsic dynamics of the spliceosome. The view that emerges is that the spliceosome removes introns progressively in pieces rather than through a single deterministic enzymatic step at sites flanking exons.
Empirical evidence for stochastic splice site selection and the functional implications for RNA processing
The model of stochastic splice site selection posits that the spliceosome assembles on many potential splice sites in the human nascent transcriptome, resulting in transient splicing intermediates that are on pathway to generating a final spliced mRNA. We detect these intermediates at low abundance through targeted amplification followed by sequencing, pulse-chase nascent RNA sequencing, and direct long-read RNA sequencing. We detect the byproducts of the splicing reaction through lariat sequencing and even smFISH. Moreover, we also see U2AF assembling on these intronic sites which indeed have a sequence signature of a RS site (AGGU). However, a critical piece of evidence for this mechanism comes through dual-color labeling of the same intron in RAB7A, where we can directly observe stochastic splice site selection in real time. The model of stochastic splice site selection implies the spliceosomes make many cuts to remove an intron instead of a single cut. For the RAB7A intron, our direct visualization of the process indicates ~60% of the introns are removed through a multi-cut/recursive process. Thus, the question of correct splice site choice changes from ‘‘how does the spliceosome know where to cut’’ to ‘‘how does the spliceosome know when to stop’’?
Splicing has never been reconstituted from purified components, and splicing of long human introns has never been reconstituted in any context. How the spliceosome recognizes ‘‘true’’ splice sites against the background of nearly identical sites is still a mystery, but our work identifies nearly 5,500 new high-confidence splice sites and >130,000 sub-intronic lariats, substantially expanding the catalog of known splicing activity. The mean size of these lariats is ~1,200 bp, and this length is roughly similar to the density of RS sites in introns (1,096 ± 1,951 bp), suggesting that the spliceosome frequently uses the first splice site it encounters in an intron. In patients with germline mutations in the lariat debranching enzyme DBR1, we identify many of these same lariats, corroborating our observation in a physiological setting. Moreover, we demonstrate for RAB7A that these RS sites contribute functionally to the efficiency of splicing. Yet, we emphasize that these cis-acting sequences where splicing occurs closely resemble canonical, annotated SSs. The only difference is that while splicing occurs at these sites, the resulting spliced RNA products are an intermediate to a final mRNA. Our data do not explain why the spliceosome ultimately stops, leaving the intact exon-exon junction of the mRNA, or why such progressive splicing might be enzymatically preferred. We speculate that there will indeed be additional sequence features to explain which sites are intermediate RS sites and which result in stable exon-exon junctions. Thus, we predict an expansion of the splicing ‘‘code’’ to encompass the cis-acting motifs corresponding to the experimentally determined intermediates we identify.
Unified theoretical model of transcription and splicing
Our model of splicing activity reframes the question of splicing dynamics, because there are two processes that contribute to the dynamics of splicing, splice site choice and intron removal. In the simplest scenario, the splicing kinetics are dominated by the latter and can be explained by an exponential distribution, reflecting a rate-limiting step. In fact, we see such behavior for the MYH9 intron, where our MS2 cassette integrated close to the annotated SS. However, as the distance between the MS2 cassette and the annotated site increases, we see the emergence of competing kinetic processes, including not only a long time component that corresponds to a polymerase that elongates for as long as 60,000 bp and then splices but also many short events where splicing often occurs soon after synthesis of the cassette. This remarkable behavior occurs in the same intron synthesized from the same locus in the same cell but at different time points. Nevertheless, the median splicing time of ~8 min from imaging is consistent with ensemble measurements in a population of cells in this study and previous ones (Rabani et al., 2014; Singh and Padgett, 2009; Windhager et al., 2012). Yet, our widely distributed splicing kinetics also reinforce observations from single-molecule long-read sequencing (Herzel et al., 2018; Oesterreich et al., 2016), which report splicing occurring sometimes as soon as the nascent RNA emerges from RNAPII. For an exponential process, this behavior is expected; the most likely delay is zero seconds. However, to accurately determine the mean requires one to capture events over the full dynamic range.
Overall, the most definitive test of the model is to ask how well the distribution of lariat size predicts the live-cell imaging data. The empirical lariat distribution is a quantitative measure of the genomic distance between SSs, thus allowing one to uncouple site selection from the enzymatic rate of intron removal. Using the time constant for the later (~8 min) results in exceptional agreement between the predicted distribution of RNA dwell times and the measured distribution from a polyclonal population of cells containing stem-loop insertions in >800 introns. Although each technique has limitations, the live-cell imaging and lariat sequencing jointly agree with a model of pervasive stochastic splice site selection rather than exclusive splicing at annotated sites. The inescapable conclusion is that while annotated splice sites accurately reflect the population of mRNA in the cell, they vastly underestimate the scope of splicing activity in the cell.
Limitations of the study
The ability to visualize nascent RNA synthesis and processing from many endogenous loci presents new opportunities but also new challenges. Primarily, single-molecule imaging enables one to record close to 100% of the events that occur for a single intron across time in single cells but obviously lacks nucleotide resolution. In contrast, sequencing enables transcriptome-wide observation with nucleotide resolution but does not capture all splicing intermediates, some of which may be quite transient. Imaging is saturating but specific, and sequencing is general, but not saturating. Moreover, for the model proposed here, one either requires extraordinary sequencing depth to capture the full distribution of splice site choices or methods to stabilize intermediates, for example through dominant-negative spliceosome components (Burke et al., 2018; Chen et al., 2018).
This study introduced a stochastic view for splicing that has parallels to the prevailing stochastic view of transcription. The difficulty is that measuring variation in mRNA abundance (the output of stochastic transcription) is experimentally more tractable than measuring variation in mRNA isoforms (the output of stochastic splicing). Moreover, there are dedicated pathways for clearing mis-spliced RNA such as NMD, which further mask the variation in splicing activity. Of course, even splicing intermediates visible in nascent RNA and not subject to RNA quality-control pathways show preferred sites, suggesting motifs could be assigned a ‘‘probability’’ for RS. Future efforts will elucidate these cis elements and corresponding trans-acting factors.
STAR★METHODS
RESOURCE AVAILABILITY
Lead contact
Further information and requests for resources and reagents should be directed to and will be fulfilled by the Lead Contact, Daniel R. Larson (dan.larson@nih.gov)
Materials availability
All unique/stable reagents generated in this study are available from the Lead Contact with a completed Materials Transfer Agreement.
Data and code availability
Data and code are publicly available.
Processed and raw data can be downloaded from NCBI GEO GSE134377.
The software for nascent RNA sequencing analysis are available at LarsonLab GitHub: https://github.com/CBIIT/Larson-Lab-CCR-NCI/tree/master
The software for imaging analysis (e.g., Localize, FishAuxiliary, KINME based image analysis pipeline) are available at LarsonLab GitHub: https://github.com/CBIIT/Larson-Lab-CCR-NCI/tree/master
Code for Generalized transcription model is available at Github: https://github.com/nih-niddk-mbs/StochasticGene.
EXPERIMENTAL MODEL AND SUBJECT DETAILS
The Human bronchial epithelial cells (HBEC3-kt) cells used in this study are Homo sapiens, female cells with ATCC Cat# CRL-4051, RRID:CVCL_X491. HBECs were grown in Keratinocyte-SFM medium (GIBCO, 17005-042) with 1% penicillin-streptomycin (ThermoFisher, 15140122). For live cell imaging, we used Airway Epithelia Cell Basal Medium (ATCC, PCS-300-030) supplemented with Bronchial Epithelial Cell Growth Kit (ATCC, PCS-300-040) to minimize the phenol-red interference. The polyclonal and single-cell clone cell lines with MS2 stem-loop intronic labeling were derived from this HBEC3-kt parental cell line. They were cultured in the same conditions.
METHOD DETAILS
Cell culture, gene-trap vector construction, and genomic engineered single-cell clone establishment
Human bronchial epithelial cells (HBECs) were grown in Keratinocyte-SFM medium (GIBCO, 17005-042) with 1% penicillin-streptomycin (ThermoFisher, 15140122). For live cell imaging, we used Airway Epithelia Cell Basal Medium (ATCC, PCS-300-030) supplemented with Bronchial Epithelial Cell Growth Kit (ATCC, PCS-300-040) to minimize the phenol-red interference.
The gene trap vector was constructed as depicted in Figure 1A. Briefly, the MS2 or PP7 stem loop array containing 24 repeats (Coulon et al., 2014) was inserted upstream of the 5′ long terminal repeat (LTR) in the lentiviral backbone. A selection cassette containing the splicing acceptor site, two selection markers (iRFP and blasticidinR) followed by a bovine growth hormone polyadenylation sequence (BGH-PolyA) were introduced upstream of the stem loops. A self-cleaving 2A peptide between iRFP and blasticidin was added to ensure bicistronic expression. This whole selection cassette was flanked by two FRT sites. First, the construct was introduced into the HBECs through lentiviral transduction. Cells were amplified from one well of 12-well plate to a T25 flask after lentiviral transduction, then treated with 2 µg/ml blasticidin (Fisher Scientific, BP2647-50) for 12 days. A Fluorescence Activated Cell Sorting (FACS) assay was performed to confirm the expression of iRFP. Next, MS2 or PP7 bacteriophage-coat proteins fused to the green fluorescent protein (MS2-GFP or PP7-GFP) were stably introduced by a second round of lentivirus transduction. We then used FACS to isolate iRFP and GFP double positive cells. Finally, the selection cassette was excised out after introducing FLPo recombinase by adenoviral transduction.
To establish the single cell clones, we used FACS to select GFP positive and iRFP negative single cells into 96 well plates. Each plate was screened with high-throughput brightfield imaging and wells containing only one single-cell clone were marked and carried on for further investigation. qPCR with iRFP specific primers was used to confirm the successful removal of the selection cassette.
CRISPR/Cas9 mediated dual color labeling in the same intron
Using single cell clones containing 24 X MS2 stem-loops in RAB7A intron as the parental cell line, 24 X PP7 stem-loops were inserted near the 3′ SS region in the same intron through a CRISPR/Cas9 system. Guide RNAs were designed using the website: https://zlab.bio/guide-design-resources and cloned into PX458 (Addgene, Plasmid #48138). The donor plasmid consisted of left and right homology arms each spanning ~1kb, a PGK-Zeocin_polyA selection marker flanked by loxP sites, and 24 X PP7 stem-loops. Cells in 10 cm dish were transfected with equal amounts of the donor construct and the guide RNA/Cas9 construct using Lipofactamine 3000 (Thermo Fisher) according to the manufacturer’s instruction. GFP positive cells were sorted 48 hr after transfection. ~6X 10⁶ cells were selected with zeocin (InvivoGen, Cat # ant-ZN) for 12 days. After selection, codon-improved Cre recombinase with mCherry (Vector Biolabs, 1773) was introduced via adenoviral transduction to delete the zeocin selection cassette flanked by loxP sites. Single cells were sorted onto a 96-well plate for single-cell colony formation, genomic testing and smFISH confirmation. PP7 bacteriophage-coat proteins fused to the mCherry fluorescent protein (PP7-mCherry) were stably introduced by lentiviral transduction.
Pladienolide B, Spliceostation treatment
HBEC cells were treated with 10 nM, 100 nM and 1 µM pladienolide B (Plad B) (Santa Cruz Biotechnology, CAS 445493-23-2) for the indicated time before 4% PFA fixation. HBEC cells were treated with 4.8 nM, 48 nM and 480 nM Spliceostatin (SSA) (Spliceostatin was a generous gift from: Minoru Yoshida
Department of Biotechnology, The University of Tokyo, Japan). Live cell imaging was taken immediately after Plad B or SSA treatment.
Linker-mediated PCR followed by sequencing
Single cell clones were grown on a 96-well plate to confluency. Genomic DNA was isolated from single cell clones using the Quick-DNA 96 Kit (Zymo Research, D3010). ~100 ng DNA from each clone was used for linker-mediated PCR sequencing.
High-throughput image acquisition
Established single cell clones were seeded on a 96-well glass-bottom imaging plate (Brooks Life Science Systems, MGB096-1-2-LG-L) at a density of 4 X 10⁴ cells per well the day before image acquisition. Images were acquired using an automated high-throughput dual spinning disk microscope (Yokogawa Cell Voyager 7000S) in a 37°C, 5% CO2 and 80% humidity environment. We used a 60X water immersion objective (1.2 NA) with a 488 nm excitation laser and a quad-band dichroic mirror (405/488/561/604 nm). For detection, we used one 16-bit Andor Neo 5.5 sCMOS camera with 2 X 2 pixel binning and a 525/50 nm bandpass emission filter. With these imaging conditions, the XY pixel size was 216.6 nm. A Z stack of 16 images with 0.5 mm step size was collected for each field of view (FOV). We performed time-lapse imaging at 100 s intervals for up to 15 hr. Typically, around 12–16 FOV were acquired per experiment. Flat-field correction and maximum intensity projection were performed on-the-fly by the Yokogawa controlling software and a 2D time-lapse (2D-t) image sequence were generated per FOV.
The image acquisition for dual-color labeling cells was performed on a Zeiss LSM780 laser scanning confocal microscope under 37°C, 5% CO2 incubation. Excitation lasers were 488 nm and 594 nm, with pinhole size of 2 µm, and pixel size of 132 nm. 16 steps of Z stacks were acquired with 0.5 mm step size. Images were taken every 50 s for 864 frames.
Live-cell image analysis workflows
Briefly, the image analysis workflow consisted of the following modules: (i) segmentation (Soille, 2013; Vincent and Soille, 1991) and tracking (Jaqaman et al., 2008) of fluorescently labeled nuclei (i.e., GFP-tagged bacteriophage coat protein) in the 2D-t images per FOV; (ii) automatic sub-pixel rigid-body registration of individual tracked nuclei (Thévenaz et al., 1998); (iii) automatic detection (GDSC-SMLM ImageJ Plugin, University of Sussex, https://sites.imagej.net/GDSC-SMLM/) and tracking of active transcription sites in individual living cells (Jaqaman et al., 2008); and (iv) extraction of temporal intensity trajectories of each transcription site. All image processing workflows were implemented using the open-source workflow orchestration and management software, Konstanz Information Mining (KNIME, 64-bit, Version 3.2.1) (Berthold et al., 2008) with KNIME Image Processing nodes (KNIP, Version 1.5.3.201611190650) (Dietz and Berthold, 2016), R (64-bit, Version 3.3.1) and Python (64-bit, Version 2.7.12) scripting KNIME nodes. For the image analysis pipeline of the polyclonal population, we used deep-learning algorithms to improve the segmentation of cell nuclei in fluorescent images as well as for the detection of transcription sites. All transcription-site trajectories were visually verified and manually filtered before the kinetic analysis.
Single molecule RNA FISH
Single molecule RNA FISH (smFISH) was performed as previously described (Rodriguez et al., 2019). Cells grown on 18mm No. 1.5 coverslips in 12 well plates were washed 3 times with HBSS before fixation with 4% PFA in PBS. Fixed samples were washed with 1X PBS, and permeblized in 70% ethanol at 4°C overnight. Permiblized samples were washed three times with 1XPBS and hybridized to probe-sets at 37°C for 4 hr or overnight. Hybridized samples were washed with 1XPBS and mounted in Prolong Gold with DAPI and allowed to dry overnight. Probe-sets were designed and ordered from Biosearch Stellaris using Quasar 570 and 670 dyes. All probe-sets are listed in Table S5.
Image acquisition was performed on a custom-built microscope consisting of an ASI (https://www.asiimaging.com) Rapid Automated Modular Microscope System (RAMM) base, Hamamatsu ORCA-Flash4 V2 CMOS camera (https://www.hamamatsu.com/, C11440), Lumencore SpectraX (https://lumencor.com/), ASI High Speed Filter Wheel (FW-1000), and ASI MS-2000 Small XY stage. The scope was controlled by the Macro-Manager software package (Edelstein et al., 2010). Multiple Z stacks with 0.5 µm step-size spanning the whole cell body (~12 µm) were collected for each sample. smFISH image analysis was performed with open source and customized software: Cell profiler (https://cellprofiler.org), Localize and FishAuxiliary (LarsonLab GitHub).
For spot co-localization analysis, the coordinates of the spots are extracted with Localize, dilated with eight-connected structuring element (each dilated spot contain 3 X 3 pixels). Overlapped spots after coordinate-dilation are considered co-localized.
4sU metabolic labeling and nascent RNA sequencing
The metabolic labeling of newly synthesized RNA with 4-thiouridine (4sU) and genome-wide RNA sequencing was performed as described by Bernd Radle et al. (Rädle et al., 2013). Briefly, for each sample, ~108 HBEC cells were incubated with 500 µM 4sU (Sigma, T4509) for 10 min. RNA was extracted with Trizol (ThermoFisher, 15596026) and 10 µL total RNA was used as input control. Thiol-specific biotinylation was performed with EZ-link HPDP-biotin (ThermoFisher, 21341). Streptavidin-coated magnetic beads (MACS Miltenyi Biotec, µMacs Streptavidin Kit) were used to purify biotinalyted nascent RNA. For genome-wide RNA sequencing, ribosomal RNA depletion (Illumina, Ribo-Zero rRNA removal Kit) was performed for both the 4sU-labeled nascent RNA and total RNA. Libraries were generated with Trueseq Stranded Total RNA Sample preparation kits following the manufacturer’s instructions.
For pulse-chase nascent RNA sequencing, the experiment has the following temporal logic, depicted schematically in Figure 7A. First, transcription pause release is arrested with DRB for three hours, effectively clearing RNAPII and nascent RNA from any gene shorter than ~360,000 bp. Second, the paused RNAPII is released into elongation in the presence of 4sU for 10, 20, 40 minutes. According to our previous measurements, the median splicing time is ~8 min, and the elongation rate is ~2kb/min. Thus, a 10 min pulse is sufficient to allow elongation into the intron (~20 kb) but only long enough to capture the shorter splicing events. A 20 min pulse will allow the wave of elongation to progress further, allow for greater incorporation of 4sU but is still statistically unlikely to allow multiple splicing events of the same RNA. Third, we stop elongation at the end of the pulse with actinomycin D, but other enzymatic processes such as splicing are presumably free to continue. Fourth, we collect the nuclear fraction 20 min after the elongation arrest. This delay is chosen to let a large fraction of the splicing events reach completion while no new nascent RNA is being synthesized. Finally, 4sU-labeled nascent RNA is collected for paired-end Illumina sequencing (Figure S7A) (Rädle et al., 2013).
Here is the experimental procedure: ~108 cells were used for each experimental condition. Cells were treated with 100 µM DRB for 3 hr, washed 3X with PBS, and released in 4sU (500 µM) for 10, 20 or 40 min. 5 µg/ml actinomycin D was added to stop elongation but allow splicing for another 20 min. Cells were trypsinized and washed with PBS. The nuclear fraction was collected using NE-PER nuclear and cytoplasmic extraction reagents (ThermoFisher, 78833). The nuclei pellet was resuspended in Trizol in a 1 µL Dounce tissue grinder to homogenize the nuclei. Nascent RNA was purified as described above. Ribosomal RNAs were depleted from the 4sU-selected nascent RNA samples as described above and libraries were prepared with NEBNext RNA library prep kit for Illumina (NEB, E7770).
Bioinformatic analysis for nascent RNA sequencing
For all four nascent RNA-Seq samples, adapters were trimmed and reads containing low-quality bases were removed using the Trimmomatic software. The Spliced Transcripts Alignment to a Reference (STAR) software (Dobin et al., 2013) was used to align trimmed reads to the human genome (hg19). The splice junction output from STAR was then used for splice junction analysis. For matching the splice junctions to known introns and exons, annotations from GenCode Release 19 (Harrow et al., 2012) were used. Exons were extracted directly from the annotations, while intron locations were computed using scripts provided with the RatchetScan program (Pai et al., 2017). Splice junctions supported by 2 or more uniquely mapping reads were compared against known annotations. Junctions were classified as matching exactly, to the 5′ or 3′ end, or completely within the genomic interval, independently for introns and exons. In the case of one junction overlapping with both intron and exon, it is resolved by choosing the intronic classification; otherwise, the exonic classification was used as a final classification.
For each classified junction, sequence logos were computed by first extracting the genomic sequence around the start and end locations of the junction. Two nucleotides upstream and downstream of these locations were extracted for a total of five bases for each start and end location. A position-weighted matrix (PWM) of observed base frequencies was calculated for each 5-nt window and used to plot the sequence logo. Plotting was done using the R package ‘ggseqlogo’ (version 0.1) (Wagih, 2017) and genomic sequences were accessed using the package ‘BSgenome.Hsapiens.UCSC.hg19’ (The Bioconductor Dev Team, 2014). Classification and counting were done using custom scripts written in Python version 2.7 and the workflow implemented using Snakemake (Köster and Rahmann, 2018). Data summarization and visualization were performed in R version 3.5.1.
Measuring the rates of in situ transcription and splicing in a population of cells
HBECs were cultured in 60-mm plates to 80% confluency and then incubated with 100 µM 5,6-Dichlorobenzimidazole 1-β-D-ribofuranoside (DRB, Sigma-Aldrich, D1916) in culture medium for 3 hr. After incubation, cells were washed three times with PBS to remove the DRB and then incubated them in fresh medium for pre-determined time periods as shown in Figures 3G, S3E, and S3F. RNA samples were collected every 5 min after synchronization. RNA was isolated using the Quick-RNA kit (Zymo Research, R1054), according to manufacturer’s instructions.
We carried out reverse transcription using the protoScript First Strand cDNA synthesis kit (New England Biolabs, E6300) according to manufacturer’s instructions with random hexamers (IDT DNA) and1 µg total RNA per 10 µL reaction. 1 µL cDNA per sample was used for quantitative RT-PCR with iQ-SYBR Green Supermix (Bio-Rad, 170880). The real-time primers were designed spanning exon-intron junctions using the IDT primer-designing software PrimerQuest (Table S5). Cross intron-exon primers were used to quantify the transcription of nascent RNAs (Exon 2-Intron 2) and splicing (Exon 1-Intron2) of specific introns. A primer pair against ACTIN (ACTB) mRNA served as internal control. At least three biological replicates, three technical replicates per primer-set were performed for each time-point per sample. In order to deal with large sample size, we used a liquid handler (Echo550, Labcyte) to assemble qPCR reactions in a 384-well format. CFX384 Touch system (Bio-Rad) was used for Real-time PCR detection and data analysis was performed with CFX manager software.
Antisense oligo design and transfection
Antisense oligos (ASO) with customized chemical modifications were synthesized by IDT. Two modifications were chosen to make ASOs as the nuclease resistant steric blocker at potential cryptic splicing sites: 1) use phosphorothioate instead of phosphodiester in the RNA backbone. 2) 2′-O-methyl modification of each nucleotide. Sequence information of ASOs can be found in Table S5. A transfection mix of either 20 nmol, 50 nmol or 100 nmol of ASOs together with 2.5 µL Lipofactamine RNAiMAX (ThermoFisher, 13778075) was used per well in a 12-well plate.
Digital droplet PCR
Digital droplet PCR (ddPCR) was performed on a QX200 AutoDG Droplet Digital PCR system (Bio-Rad). Total RNAs were purified from cells transfected with ASO and control oligos. We used SuperScript III (ThermoFisher, 18080051) to generate cDNA from 3 µg total RNA for each sample with random hexamers. The reverse transcription products were cleaned with DNA Clean & Concentrator-5 (Zymo Research, D4013). ddPCR was performed with ddPCR Supermix for Probes (Bio-rad, 1863010). A gradient of cDNA concentrations was tested for the optimal ddPCR signal detection. For pre-mRNA detection, 64 ng cDNA were used per sample. For mRNA detection, 1.6 ng and 0.8 ng cDNA were used per sample. Hind III was used for DNA fragmentation. ddPCR primers and ZEN double-quenched probes (IDT) are listed in Table S5.
Targeted sequencing for recursive splicing intermediates
To detect the splicing intermediates, nascent RNA purified through 4sU metabolic labeling were used for reverse transcription with SuperscriptIII (ThermoFisher, 18080051). 28 regions with 115 bp target windows covering the potential recursive splice sites in RAB7A first intron were chosen for reverse-transcription (RT) using primers designed as described in (Xu et al., 2019). 17 RT-primers were designed targeting the intronic region and 1 RT-primer targeting exon 2 served as control. We further tested the reverse transcription ability of the designed RT-primers with ddPCR. Briefly, a testing primer set was designed ~500 bp downstream of the RT-primers. cDNA synthesized from nascent RNA was used as template for individual RT reactions. ddPCR with testing primers was performed with QX200 ddPCR EvaGreen Supermix (Bio-Rad, 1864034). 16 out of 18 RT-primers were confirmed for successful reverse transcription (Table S5).
To enrich the recursive splicing intermediates, we performed targeted reverse transcription followed by PCR amplification. First, ~2 µg nascent RNA metabolically labeled with 4sU for 20 min were purified with biotinylation. cDNA was synthesized with 50 ng nascent RNA as template per RT reaction with 16 RT-primers, individually. Next, we performed PCR amplification with Herculase II Fusion DNA polymerase through a touchdown PCR program (Agilent Technologies, 600675). Primer sequences can be found in Table S5. Lastly, 8 cycles of PCR were used to add Nextera sequencing indexes (Illumina) to the amplified cDNA fragments. The PCR product was purified with AMpure XP beads (Beckman, A63880). The library was sequenced on the Illumina HiSeq 3000 platform. The adaptor sequence from the 5′ and 3′ end was trimmed using cutadapt. Reads were aligned using Tophat 2.1.2.
Photoactivatable ribonucleotide-enhanced crosslinking and immunoprecipitation (PAR-CLIP)
PAR-CLIP was performed as previously described in (Hafner et al., 2010) with a few modifications using stable HEK293 expressing FLAG/HA-tagged U2AF1 (FH-U2AF1) under control of a doxycycline inducible promoter (Palangat et al., 2019). Briefly pFRT/TO/FLAG/HA-U2AF1 was transfected into Flp-In T-REx HEK293 cells (Invitrogen) together with pOG44 plasmid (Invitrogen) using Lipofectamine 2000 transfection reagent (Invitrogen). Cells were grown in DMEM containing 10% fetal bovine serum (GIBCO), 100 U/µl penicillin, 100 µg/ml streptomycin, 10 µg/ml blasticidin (GIBCO) and 100 µg/ml hygromycin B. 20 15cm plates at 70% confluency were induced with doxycycline for 24 hours followed by incubation with 4sU (300 µM) for 2 hr and UV crosslinking at λ = 312 nm with 0.5 mJ/cm2 (Spectronics XL1500 crosslinker). Cells were fractionated into nuclear and cytoplasmic fractions by resuspending in 3 mL mild hypotonic lysis buffer (10 mM TRIS-HCl pH 7.5, 50 mM NaCl, 3 mM MgCl2, 0.1% NP-40 and 10% glycerol) for 2 min followed by 5 min centrifugation at 400 g. The nuclear pellet was washed twice with 10 mL of the same buffer and lyzed with 1 mL of a RIPA buffer (150 mM NaCl, 1% NP-40, 0.15% deoxycholate, 0.1% SDS, 25 mM TRIS-HCl pH 7.5, Protease inhibitors, 1 U/µL RNase T1 and 50 U/mL DNASE) followed by sonication (3 X 10 s; 60% Amplitude on a VCX130 Vibra-Cell Ultrasonic Liquid Processor) and 30 min rotation at 4°C. The lysate was cleared by centrifugation for 10 min at 16,000 g and diluted by addition of 2 volumes of 20 mM TRIS-HCl pH 7.5. The FH-U2AF1/U2AF2 complex was immunoprecipitated using the Anti-FLAG M2 Magnetic Beads (Sigma), treated with 1 U/ml RNase T1 (1/10000 Thermo Scientific RNase T1, EN0541) and washed 3 times with high salt wash buffer (20 mM Tris, pH 7.5, 500 mM NaCl, 2 mM EDTA, 1% (v/v) NP40). To obtain the footprints of the U2AF complex, ligation of a 3′ pre-adenylated adaptor (5′-rAppNNTCTGTGTGGAATTCTCGGGTGCCAAGG-L) was performed on beads using truncated T4 RNA Ligase2 (NEB, M0242). 3′-adaptor ligated footprints from crosslinked U2AF1/U2AF2-ribonucleoproteins were released by proteinase K digestion on beads. The recovered footprints were further size selected to obtain a 19–35 nt long footprints by fractionation on a 15% 8M-urea polyacrylamide gel using ligated 19 and 35 nt oligoribonucleotides ligated to 3′adaptor as markers. The size selected 3′ligated footprints were joined to a chimeric DNA -RNA 5′ adaptor (GTTCAGAGTTCTACAGTCCGrArCrGrArUrCrNrNrNrN) using T4 RNA ligase 1 (NEB) in a standard ligation reaction and reverse transcribed using GCCTTGGCACCCGAGAATTCCA and Superscript IV reverse transcriptase following manufactures instructions (Invitrogen 18090010). The library was PCR amplified using
Forward: AATGATACGGCGACCACCGAGATCTACACGTTCAGAGTTCTACAGTCCGA
Reverse:CAAGCAGAAGACGGCATACGAGATGTAGCCGTGACTGGAGTTCCTTGGCACCCGAGAATTCCA primers and sequenced on the Illumina HiSeq 3000 platform. Sequences were obtained using bcl2fastq and further processed using the PARpipes software package (https://github.com/ohlerlab/PARpipe). Pre-processing in the PARpipe script was modified in the following order: Collapsing the sequences to obtain unique reads, trimming 4 Bases from the 5′ end, and the adaptor sequence from the 3′ end using cutadapt. Bowtie was used for alignment and PARalyzer for U2AF1/2 binding site identification (Corcoran et al., 2011). The aligned.bam file was further filtered to isolate reads containing the characteristic T-to-C mutation to provide IGV snapshots. HOMER (Hypergeometric Optimization of Motif EnRichment) was used to identify enriched motifs form binding sites that are entirely in introns and binding sites that overlap with 3′ splicing site.
Lariat sequencing
To enrich for lariats, poly(A)- and rRNA depleted RNA was prepared as follows. Total RNA was purified from HEK293 cells (10 cm plates) using the Direct-zol RNA Miniprep Kit (Zymo Research) and poly(A)+ RNA was depleted using the NEBNext® Poly(A) mRNA Magnetic Isolation Module (NEB, E7490) following the manufacturer’s instructions with some modifications. Briefly, unbound RNA (supernatant) was further purified using the RNA Clean & Concentrator Kit (Zymo Research). Poly(A)+ RNA depletion was performed twice followed by rRNA depletion using NEBNext® rRNA Depletion Kit (NEB E6310). RNA libraries were constructed using NEBNext® Ultra II Directional RNA Library Prep Kit for Illumina (NEB, E7760) with the following modification. Reverse transcription was performed using Superscript IV (ThermoFisher, 18090010) at 57°C for 30 minutes that showed higher efficiency to reverse transcribe branch points compared to other reverse transcriptases (Figure S7). A similar library construction approach was followed to detect lariats in nascent RNA obtained by 4sU pulse chase. 150 bp paired-end sequencing was performed on the Ilumina NextSeq 500 or HiSeq X platforms.
Lariats where detected using in-house scripts. Briefly reads that failed to align to the genome using Bowtie and to the known transcriptome (Homo_sapiens_UCSC_hg19) using TopHat 2.1.2 were split in pieces of various lengths and aligned again using bowtie. Longest uniquely aligned reads from each end were the 3′ end of the read should aligned upstream of the 5′ within the same intron were kept as bona fide lariats.
Oxford Nanopore direct RNA long-read sequencing of nascent RNA
4 T225 flasks (~108) with HBEC cells were metabolically labeled with 4sU (500 mM) for 20 min. After media removal, cells were trypsinized and washed with PBS and nuclei isolated before nascent RNA purification. Briefly, cells were lysed for 2 min with 400 µL cytoplasmic lysis buffer (0.15% (vol/vol) NP-40 (Thermo Fisher Scientific, 28324), 10 mM Tris-HCl (pH 7.0), and 150 mM NaCl), layered over 1,000 µL of a sucrose cushion (10 mM Tris-HCl (pH 7.0), 150 mM NaCl, 25% (wt/vol) sucrose), and nuclei were collected by centrifugation at 16,000 g for 10 minutes. The nuclei pellet was resuspended in 800 µL wash buffer (0.1% (vol/vol) Triton X-100, 1 mM EDTA, in 1X PBS) and collected by centrifugation at 1,150 g for 1 min. All steps were performed at 4°C and all buffers were prepared with 0.05 U/µl SUPERasein (ThermoFisher Scientific, AM2694) and protease inhibitor mix (Roche, 11873580001). RNA was isolated using Trizol and a 1 mL douncer was used to homogenize the nuclei. 4sU labeled nascent RNA was purified from the nucleus RNA (methods described in session: 4sU metabolic labeling and nascent RNA sequencing). polyA tailing was done with 5 U E. coli polyA polymerase (NEB, M0276S) in 20 µL volume, incubated at 37°C for 30 min. 0.5 µL RNase inhibitor was added to prevent RNA degradation.
Two RNA sequencing libraries were prepared from 500 ng polyadenylated nascent RNA using the Nanopore Direct RNA Sequencing kit (SQK-RNA002, Oxford Nanopore Technologies) according to manufacturer’s instructions. Briefly, the poly(T) adaptor was ligated to the RNA using T4 DNA ligase (New England Biolabs, M0202) in the Quick Ligase reaction buffer (New England Biolabs, B6058) for 10 min at room temperature. SuperScript III Reverse Transcriptase (Thermo Fisher Scientific, 18080044) was used to synthesize the first-strand cDNA. The RNA–cDNA hybrid was then purified using 1.8X Agencourt RNAClean XP magnetic beads (Beckman Coulter, A66514). Finally, the RNA sequencing adaptor was ligated onto the RNA-cDNA hybrid using T4 DNA ligase in the Quick Ligase reaction buffer for 10 min at room temperature, and the final library was purified using 1X Agencourt RNAClean XP magnetic beads. Each library was loaded onto a flow cell (FLO-MIN106, R9.4.1) and sequenced using a MinION sequencer (Oxford Nanopore Technologies) with run lengths of 20 – 23 hour. The raw direct RNA sequencing data were processed using Guppy version 4.0. Sequencing reads were mapped to human reference genome hg19 using minimap2 version 2.17. The aligned read bam files were indexed and visually inspected using IGV.
RNA half-life measurements
Measurement of RNA half-life was done with 4sU metabolic labeling and probe-based qPCR as previously described (Russo et al., 2017) with minor modifications. Briefly, cells were pulsed with 4-thiouridine (4sU, 100 µM) for 12 hr. After 4sU washout, cells were chased in growth media for 0, 1, 2, 3 and 4 hr. Total RNA was extracted with TRIzol reagent (ThermoFisher Scientific 15596026). For each 50 µg total RNA, 50 fmol of a 4sU-labeled synthetic RNA were added as spike-in controls. A 50 µL aliquot of each sample was reserved as ‘total RNA’. Nascent RNA at each time point was biotinylated and then purified as described above (section: 4sU metabolic labeling and nascent RNA sequencing). mRNA abundance for 10 genes was measured with probe-based qPCR. Nascent RNA level normalized by total RNA at each time point was fitted to a first-order exponential decay to obtain mRNA half-life.
U1 cross-linked immunoprecipitation (IP) data analysis
U1C and U1A cross-linked IP data were downloaded from NCBI GEO accession: GSE135140 {So, 2019 #55}. MACS2 (macs2 2.1.0.20140616) was used as the Peak finding algorithm with the following parameters: tag size: determined from input data; p value cutoff: 1.000000e-05; bandwidth: 300; keep duplicates: auto; call broad peaks: off. After comparing the U1 peaks with our U2AF binding sites obtained by PAR-CLIP, 16,853 out of 335,498 U2AF clusters (5%) were overlapping U1 peaks. 18,214 out of 72,308 U1 peaks (25%) were overlapping with U2AF clusters. ~60.3% of the overlapping peaks were in exons and 23.3% are in introns. Deeptools (3.3.2) was used to calculate the U1 distribution near U2AF peaks. First, U2AF clusters bed file was classified as ‘within intron’ (requires the full cluster overlap with intron.bed) or ‘across exon’ (requires at least 1bp overlap with exon.bed). Next, ComputeMatrix command was used to calculate U1 bigwig file coverage centered around U2AF peaks.
QUANTIFICATION AND STATISTICAL ANALYSIS
The n value, definition of replicates, definition of center, and dispersion and precision measures for each experiment can be found in the corresponding figure and figure legend.
Clustering analysis of transcription-site trajectories
The clustering of time series data was performed with TSclust version 1.2.4 (Montero and Vilar, 2014). Briefly, each trajectory was normalized with its median intensity before dissimilarity measurement. The distance matrix was generated through Integrated Periodogram Distance metric. Hierarchical clustering ward.d2 was used to generate sorted heatmap and cluster dendrogram.
Hidden Markov model analysis
We used Hidden Markov Model (HMM) algorithm for extracting idealized ON and OFF time. First, we normalize each live cell trace with a peak height of unity. Second, the normalized data are used as input for the IDL program ‘HMM_V5_4_2_text.sav’ described in (Lee, 2009) and available at https://sites.psu.edu/smbiophysics/hmm-code-and-manual/. The output of this program is a binary trace representing the times when the gene is active and inactive.
The duration of the ON and OFF times are compiled from many trajectories, either as a probability distribution function or a cumulative distribution function as indicated in the figure legend. We emphasize that the HMM fitting routine is only used as a segmentation routine. Subsequent analyses are carried out on the empirically measured active and inactive times from the segmented trajectory, not on any rate parameters returned from the HMM algorithm directly.
Cross-correlation analysis
Cross-correlation analysis was performed as previously described (Coulon et al., 2014). Briefly, correlation functions were computed with a multi-tau algorithm (Wohland et al., 2001) and bootstrapping was used to obtain the standard error of the mean correlation functions (SEM). Code for correlation analysis can be found in LarsonLab GitHub: https://github.com/CBIIT/Larson-Lab-CCR-NCI/tree/master
All remaining quantitative data was processed and visualized using GraphPad Prism.
Supplementary Material
(A) Schematic of sequential steps to obtain polyclonal cell population and single-cell clones representing unique genes. (B) Expression pattern of iRFP fusion proteins in gene-trap cells after 12 days of Blasticidin selection. iRFP fusion proteins could localize in various cellular compartments, such as nucleus (arrowheads) or cytoplasm (arrows). (C) FACS assays at each step described in Figure 1A. FACS assay 1 (top): Blasticidin and iRFP positive selection. FACS assay 2 (bottom): Introducing MS2 coat protein and FLP recombinase. Cells were gated for iRFP negative selection for single-cell cloning. (D) Genomic PCR verification for the removal of iRFP/Blasticidin selection cassette. Top: Primer design for single-cell clone genomic testing. iRFP negative and Flank-primer-target positive indicates the successful removal of the selection cassette. Bottom: qPCR assay to confirm the complete removal of the selection cassette in single-cell clones. Heatmap represents qPCR amplification signal from genomic DNA. Each bar represents one single-cell clone. (E) Genomic sequencing to detect the integration sites of MS2 or PP7 stem-loops. (F) MS2/PP7 stem-loops tend to integrate into the first intron of a gene. (G) Distribution of the stem-loop integration sites relative to the transcription start sites (TSS). (H) MS2/PP7 stem-loops tend to integrate into the longer introns. (I) 397 single-cell clones are established, tested with high-throughput imaging, genomic PCR, and 66 of which are further confirmed with single-cell-clone genomic sequencing. We identified 15 unique genes labeled with MS2 stem-loops, single insertion per cell. (J) Clustering of single-cell nascent RNA dynamic traces. Contingency analysis of the enrichment of specific genes in each cluster.
(A) RAB7A with MS2 stem loops insertion in intron1 (Insertion site Chr 3: 128,450,384, arrowhead). (B) smFISH images with RAB7A intron (red) and 3UTR (green) probe-sets in WT and RAB7A-clone cells. Arrowheads indicate transcription sites (TS). MS2 stem loops (red) co-localize with the TS as labeled by RAB7A 3UTR probes (green). (C) MS2 stem-loop insertion does not change the overall mRNA molecule abundance, TS frequency and TS intensity. (D) SLC2A1 with MS2 stem-loops intronic insertion (insertion site: Chr1: 43,417,046, green bar and arrowhead). (E and F) mRNA abundance, TS frequency and TS intensity in WT or MS2 stem-loops engineered cells. (G) RHOA with MS2 stem-loops intronic insertion (insertion site Chr 3: 49,447,687, green bar and arrowhead). smFISH probesets targeted regions are indicated in red and green dash lines. (H and I) MS2 stem-loop integration exhibits minimum effect on mRNA abundance, TS frequency and TS intensity.
(A) Integrated live-cell imaging traces with 100 s intervals for ERRFI1 with Mock or pladienolide B (1 µM) treatment. Live-cell imaging is taken immediately after Plad B treatment. (B) Cumulative frequency of ON time distribution for ERRFI1 with Mock or pladienolide B treatment at a gradient of concentrations (10nM, 100nM, and 1 µM). (C) Integrated live-cell imaging traces with 100 s intervals for RAB7A with Mock or SSA (480 nM) treatment. Live-cell imaging is taken immediately after SSA treatment. (D) Cumulative frequency of ON time distribution for RAB7A with Mock or SSA treatment at a gradient of concentrations (4.8 nM, 48 nM, and 480 nM). (E and F) Rates of in situ transcription and splicing measured in a population of cells. (E) Transcription was synchronized with 100 µM DRB treatment for 3 hr. After DRB washout, samples were collected every 5 min for 60 min, transcription and splicing kinetics were measured. Transcription and splicing of SLC2A1 intron 1 in WT (left) and SLC2A1-MS2 engineered cells (right) are measured by qPCR. The gene structure is shown below each graph with arrows indicating the exon-intron junctions that are analyzed. Green bar indicates the insertion site for MS2 stem-loops. Average trace-intensity reflecting transcription wave measured through live-cell imaging (gray curves) is shown in the same chart for the MS2-engineered clones. Right y axis indicates the fluorescent intensity (A.U.) from live -cell imaging. (F) Similarly, transcription elongation rate and splicing rate of intron 1 for gene ERRFI1 in WT cells or MS2 engineered clones. Error bars indicate SEM.
(A) Autoradiography of SDS-PAGE resolving RNA crosslinked to U2AF1 or U2AF2 from 4 thio-Uridine (4sU) labeled cells. (B) Sequence logo showing the enriched motif of U2AF-complex footprints presents in the PAR-CLIP data. (C) Representative snapshots of U2AF-complex footprints in RHOA. U2AF-complex footprints are called through PARpipe. Maximum entropy scores for potential SS are generate by MaxEntScan. (D and E) U1 associated proteins and U2AF complex are detected at RS sites within introns. Average read coverage for U1C, U1A, U2AF complex and hnRNPC are computed across exons (D) and within introns (E). U1A, U1C and hnRNPC cross-linked immunoprecipitation read coverage matrixes are generated centered around U2AF peaks. Shaded areas indicate standard error. (F-J) Nascent RNA sequencing identified RS junctions. (F) Schematic illustration for nascent RNA purification via 10 min pulse labeling with 4sU. (G) Increased intron coverage with nascent RNA sequencing. (H) Genomic distribution of unique splicing junctions identified through nascent RNA sequencing. (I) Nascent RNA seq identified intronic splicing junctions share the same splice-site motif as annotated introns. Intronic junction reads are classified according to their 5′ and 3′ locations (i.e., both intronic, 5′ match annotated SS, 3′ match annotated SS). Occurrence of the 5′ and 3′ SS motif is shown for each group. (J) Intronic splicing junctions tend to occur in longer introns.
(A) Schematic of dual color labeling in RAB7A 1st intron. 24X PP7 stem-loops are integrated via CRISPR/Cas9 746 bp upstream of exon 2. Zeocin served as a selection marker and further removed through Cre/loxP recombination. (B) Genomic testing before and after CRISPR/Cas9 mediated integration. (C) Single-molecule FISH (smFISH) images confirmed the co-localization between PP7 stem-loops and RAB7A 3′SS intronic region (top). MS2 and PP7 stem-loops were integrated in the same allele (bottom).
(A and B) Pulse-chase nascent RNA sequencing captured splicing intermediates in introns. (A) Schematic of pulse-chase nascent RNA sequencing strategy. (B) Sashimi plots for RAB7A nascent RNA sequencing at 10, 20, and 40 min after transcription release. MS2 stem-loop integration sites are labeled according to single-cell clone genomic sequencing results. (C-H) An improved approach for lariat sequencing in human cells. (C) Comparison of multiple approaches for enriching full-intron lariats. Although none of these methods are saturate, polyA and rRNA depletion together with SuperScript VI mediated reverse transcription achieved the highest enrichment of full-intron lariats. (D) Circular RNA enrichment per million reads with different approaches. (E) Lariat length distribution captured by different methods. (F-G) Scatter density plot of lariat length versus intron length detected in patients with DBR1 mutations. Each dot represents a lariat and the intron it derived from. Intron length < 1500 bp are shown in (F) and < 150 kb are shown in (G). (H) The ratio of mature mRNA and nascent RNA for genes belongs to different gene-length groups. Mature mRNA RPKM is calculated from polyA selected RNA sequencing data in HBECs. Nascent RNA RPM is calculated from 4sU pulse-chase nascent RNA sequencing data (10 min) in the same cell line. (I-M) Nascent RNA long-read sequencing revealed stochastic splice site selection in introns. (I) Example of stochastic splice site selection in SRSF7 revealed by U2AF complex PAR-CLIP, lariat seq, and nascent RNA long-read sequencing. Split reads mapped within introns in DBR1 knockdown human cells or patients’ fibroblast with DBR1 mutations are shown in green. Nascent RNA long-read sequencing reads aligned to the gene SRSF7 in human bronchial epithelial cells (HBECs) are shown in gray, with boxes indicate aligned reads and lines indicate splicing junctions. Each continuous line represents a single read. Transcripts with activated RS site in intron 5 are highlighted in brown. The gene structure with annotated splice sites is shown in blue from transcription start site (TSS) to polyA site. Green box indicate the transcript is not subject to NMD pathway. Red box indicates poison exon. (J) Example of stochastic splice site selection in SEMA4B revealed by nascent RNA long-read sequencing. RS site sequence are shown in the zoomed-in window. (K) Venn diagram showing the intersect between RS events and poison exons. Poison exons are extracted based on UPF1 knockdown data. 417 (7.6%) of the RS events could result in poison exons. (L) RS is categorized to three classes: RS with annotated 5′ splice site (SS), RS with annotated 3′ SS, RS with nested splice sites. There are 6.2%, 9.7%, and 5.3% of the RS events in each category could result in poison exons. (M) RS can salvage transcripts by removing poison exons. 17.9%, 10.0%, and 6.8% of RS events could remove poison exons in each category.
KEY RESOURCES TABLE
| REAGENT or RESOURCE | SOURCE | IDENTIFIER |
|---|---|---|
| Antibodies | ||
| Anti-FLAG M2 Magnetic Beads | Sigma-Aldrich | Cat # M8823 |
| Chemicals, peptides, and recombinant proteins | ||
| Pladienolide B (Plad B) | Santa Cruz Biotechnology | CAS 445493-23-2 |
| Spliceostatin (SSA) | Spliceostatin was a generous gift from: Minoru Yoshida Department of Biotechnology, The University of Tokyo, Japan | N/A |
| 5,6-Dichlorobenzimidazole 1-β-D-ribofuranoside (DRB) | Sigma-Aldrich | Cat # D1916 |
| actinomycin | Sigma-Aldrich | Cat # A9415 |
| blasticidin | Fisher Scientific | Cat# BP2647-50 |
| zeocin | InvivoGen | Cat# ant-ZN |
| 4-thiouridine (4sU) | Sigma-Aldrich | Cat # T4509 |
| EZ-link HPDP-biotin | ThermoFisher | Cat # 21341 |
| RNase T1 | Thermo Scientific | Cat # EN0541 |
| Critical commercial assays | ||
| the Nanopore Direct RNA Sequencing kit | Oxford Nanopore Technologies | Cat # SQK-RNA002 |
| E. coli polyA polymerase | New England Biolabs | Cat #M0276S |
| QX200 ddPCR EvaGreen Supermix | Bio-Rad | Cat # 1864034 |
| SuperscriptIII | ThermoFisher | Cat # 18080051 |
| SuperscriptIV | ThermoFisher | Cat # 18090010 |
| ddPCR Supermix for Probes | Bio-Rad | Cat # 1863010 |
| iQ-SYBR Green Supermix | Bio-Rad | Cat # 170880 |
| Streptavidin-coated magnetic beads | MACS Miltenyi Biotec | Cat # 130-074-101 |
| protoScript First Strand cDNA synthesis kit | New England Biolabs | Cat # E6300 |
| Quick-DNA 96 Kit | Zymo Research | Cat # D3010 |
| NEBNext RNA library prep kit for Illumina | New England Biolabs | Cat # E7770 |
| Herculase II Fusion DNA polymerase | Agilent Technologies | Cat # 600675 |
| AMpure XP beads | Beckman | Cat # A63880 |
| NEBNext® Poly(A) mRNA Magnetic Isolation Module | New England Biolabs | Cat # E7490 |
| NEBNext® rRNA Depletion Kit | New England Biolabs | Cat # E6310 |
| NEBNext® Ultra II Directional RNA Library Prep Kit for Illumina | New England Biolabs | Cat # E7760 |
| Deposited data | ||
| Steady-state nascent RNA sequencing | this study | NCBI GEO GSE134377 |
| pulse chase nascent RNA sequencing | this study | NCBI GEO GSE134377 |
| U2AF complex PAR-CLIP | this study | NCBI GEO GSE134377 |
| nanopore nascent RNA sequencing | this study | NCBI GEO GSE134377 |
| lariat sequencing | this study | NCBI GEO GSE134377 |
| patient with DBR1 mutations lariat sequencing | Zhang et al., 2018a | N/A |
| RNaseq data with UPF1 knockdown in human cells | Attig et al., 2016 | N/A |
| BRIC-seq data with UPF1 knockdown in human cells | Tani et al., 2012 | N/A |
| U1 snRNP XLIP-seq | So et al., 2019 | N/A |
| Experimental models: cell lines | ||
| Stable HEK293 expressing FLAG/HA-tagged U2AF1 (FH-U2AF1) under control of a doxycycline inducible promoter | Palangat et al., 2019 | N/A |
| HBEC3-KT cells (normal human bronchial epithelial cells immortalized with CDK4 and hTERT) | Dr. Harold Varmus lab | N/A |
| HBEC3-KT cells with intronic MS2 stem loops (polyclonal population) | this study | N/A |
| HBEC3-KT cells with intronic MS2 stem loops (single cell clones) | this study | N/A |
| HBEC3-KT cells with dual-color intronic stem loop labeling (RAB7A) | this study | N/A |
| Oligonucleotides | ||
| sgRNA for Crispr/CAS9 genomic engineering | IDT | See Table S5 |
| Splicing kinetics primers | IDT | See Table S5 |
| Tiling primers | IDT | See Table S5 |
| ddPCR primers | IDT | See Table S5 |
| Single molecule RNA FISH probes | Biosearch Stellaris | See Table S5 |
| antisense oligos (ASO) | IDT | See Table S5 |
| Recombinant DNA | ||
| Gene-trap vector | this study | N/A |
| 24XPP7 stem-loop donor plasmid | this study | N/A |
| PX458 | Ran et al., 2013 | Addgene Plasmid #48138 |
| Software and algorithms | ||
| Localize | Larson et al., 2013 | https://github.com/CBIIT/Larson-Lab-CCR-NCI/tree/master |
| FishAuxiliary | Larson et al., 2013 | https://github.com/CBIIT/Larson-Lab-CCR-NCI/tree/master |
| FIJI | Schindelin et al., 2012 | https://imagej.net/Fiji |
| R | R: A language and environment for statistical computing. R Foundation for Statistical Computing, Vienna, Austria. | https://www.R-project.org |
| Generalized transcription Model with intron ejection | this study | https://github.com/nih-niddk-mbs/StochasticGene |
| Cellprofiler | Carpenter et al., 2006 | https://cellprofiler.org/ |
| Deeptools (3.3.2) | Ramírez et al., 2016 | https://deeptools.readthedocs.io/en/develop/ |
| MACS2 (macs2 2.1.0.20140616) | Zhang et al., 2008 | https://github.com/macs3-project/MACS |
| minimap2 version 2.17 | Li, 2018 | https://github.com/lh3/minimap2 |
| SQANTI 2 | Tardaguila et al., 2018 | https://github.com/Magdoll/SQANTI2 |
| FLAIR | Tang et al., 2020 | https://github.com/BrooksLabUCSC/flair |
| KNIME based image analysis pipeline | this study | https://github.com/CBIIT/Larson-Lab-CCR-NCI/tree/master |
Highlights.
High-throughput single-molecule microscopy records nascent RNA dynamics in live cells
Transcription burst size is conserved across genes, but frequency is gene specific
Splice site selection and intrinsic spliceosome kinetics explain splicing dynamics
Stochastic splice site selection is pervasive across the human genome
ACKNOWLEDGMENTS
We thank J. Pleiss and B. Fair for discussions and designing primers for detecting splicing intermediates; S. Mount and B.X. Wang for bioinformatic discussions and analysis of the nascent RNA sequencing data; J. R. Hogg for insightful discussions on NMD pathway and poison exons; and R. Casellas, I. Eperon, and A. Raj for comments on the manuscript. We thank X. Wu, B. Tran, J. Shetti, K. Talsania, and Y. Zhao from the CCR Sequencing Facility. This work was supported by Biowulf, the High-Performance Computing Group, and the Center for Information Technology. This research was funded by the Intramural Research Program of the NIH.
Footnotes
SUPPLEMENTAL INFORMATION
Supplemental information can be found online at https://doi.org/10.1016/j.cell.2021.04.012.
DECLARATION OF INTERESTS
The authors declare no competing interests.
REFERENCES
- Ameur A, Zaghlool A, Halvardson J, Wetterbom A, Gyllensten U, Cavelier L, and Feuk L (2011). Total RNA sequencing reveals nascent transcription and widespread co-transcriptional splicing in the human brain. Nat. Struct. Mol. Biol 18, 1435–1440. [DOI] [PubMed] [Google Scholar]
- Attig J, Ruiz de Los Mozos I, Haberman N, Wang Z, Emmett W, Zarnack K, König J, and Ule J (2016). Splicing repression allows the gradual emergence of new Alu-exons in primate evolution. eLife 5, e19545. [DOI] [PMC free article] [PubMed] [Google Scholar]
- Berthold MR, Cebron N, Dill F, Gabriel TR, Kötter T, Meinl T, Ohl P, Sieb C, Thiel K, and Wiswedel B (2008). KNIME: The Konstanz Information Miner. In Studies in Classification, Data Analysis, and Knowledge Organization, Preisach C, Burkhardt H, Schmidt-Thieme L, and Decker R, eds. (Springer; ), pp. 319–326. [Google Scholar]
- Burke JE, Longhurst AD, Merkurjev D, Sales-Lee J, Rao B, Moresco JJ, Yates JR 3rd, Li JJ, and Madhani HD (2018). Spliceosome Profiling Visualizes Operations of a Dynamic RNP at Nucleotide Resolution. Cell 173, 1014–1030.e17. [DOI] [PMC free article] [PubMed] [Google Scholar]
- Burnette JM, Miyamoto-Sato E, Schaub MA, Conklin J, and Lopez AJ (2005). Subdivision of large introns in Drosophila by recursive splicing at non-exonic elements. Genetics 170, 661–674. [DOI] [PMC free article] [PubMed] [Google Scholar]
- Carpenter AE, Jones TR, Lamprecht MR, Clarke C, Kang IH, Friman O, Guertin DA, Chang JH, Lindquist RA, Moffat J, et al. (2006). CellProfiler: image analysis software for identifying and quantifying cell phenotypes. Genome Biol 7, R100. [DOI] [PMC free article] [PubMed] [Google Scholar]
- Chen W, Moore J, Ozadam H, Shulha HP, Rhind N, Weng Z, and Moore MJ (2018). Transcriptome-wide Interrogation of the Functional Intronome by Spliceosome Profiling. Cell 173, 1031–1044.e13. [DOI] [PMC free article] [PubMed] [Google Scholar]
- Corcoran DL, Georgiev S, Mukherjee N, Gottwein E, Skalsky RL, Keene JD, and Ohler U (2011). PARalyzer: definition of RNA binding sites from PAR-CLIP short-read sequence data. Genome Biol 12, R79. [DOI] [PMC free article] [PubMed] [Google Scholar]
- Coulon A, Ferguson ML, de Turris V, Palangat M, Chow CC, and Larson DR (2014). Kinetic competition during the transcription cycle results in stochastic RNA processing. eLife 3, e03939. [DOI] [PMC free article] [PubMed] [Google Scholar]
- Danko CG, Hah N, Luo X, Martins AL, Core L, Lis JT, Siepel A, and Kraus WL (2013). Signaling pathways differentially affect RNA polymerase II initiation, pausing, and elongation rate in cells. Mol. Cell 50, 212–222. [DOI] [PMC free article] [PubMed] [Google Scholar]
- Dietz C, and Berthold MR (2016). KNIME for Open-Source Bioimage Analysis: A Tutorial. Adv. Anat. Embryol. Cell Biol 219, 179–197. [DOI] [PubMed] [Google Scholar]
- Dobin A, Davis CA, Schlesinger F, Drenkow J, Zaleski C, Jha S, Batut P, Chaisson M, and Gingeras TR (2013). STAR: ultrafast universal RNA-seq aligner. Bioinformatics 29, 15–21. [DOI] [PMC free article] [PubMed] [Google Scholar]
- Drexler HL, Choquet K, and Churchman LS (2020). Splicing Kinetics and Coordination Revealed by Direct Nascent RNA Sequencing through Nanopores. Mol. Cell 77, 985–998.e8. [DOI] [PMC free article] [PubMed] [Google Scholar]
- Duff MO, Olson S, Wei X, Garrett SC, Osman A, Bolisetty M, Plocik A, Celniker SE, and Graveley BR (2015). Genome-wide identification of zero nucleotide recursive splicing in Drosophila. Nature 521, 376–379. [DOI] [PMC free article] [PubMed] [Google Scholar]
- Edelstein A, Amodaj N, Hoover K, Vale R, and Stuurman N (2010). Computer control of microscopes using microManager. Curr. Protoc. Mol. Biol Chapter 14, Unit 14.20. [DOI] [PMC free article] [PubMed]
- Gazzoli I, Pulyakhina I, Verwey NE, Ariyurek Y, Laros JF, ‘t Hoen PA, and Aartsma-Rus A (2016). Non-sequential and multi-step splicing of the dystrophin transcript. RNA Biol 13, 290–305. [DOI] [PMC free article] [PubMed] [Google Scholar]
- Girard C, Will CL, Peng J, Makarov EM, Kastner B, Lemm I, Urlaub H, Hartmuth K, and Lührmann R (2012). Post-transcriptional spliceosomes are retained in nuclear speckles until splicing completion. Nat. Commun 3, 994. [DOI] [PubMed] [Google Scholar]
- Hafner M, Landthaler M, Burger L, Khorshid M, Hausser J, Berninger P, Rothballer A, Ascano M Jr., Jungkamp AC, Munschauer M, et al. (2010). Transcriptome-wide identification of RNA-binding protein and microRNA target sites by PAR-CLIP. Cell 141, 129–141. [DOI] [PMC free article] [PubMed] [Google Scholar]
- Harrow J, Frankish A, Gonzalez JM, Tapanari E, Diekhans M, Kokocinski F, Aken BL, Barrell D, Zadissa A, Searle S, et al. (2012). GENCODE: the reference human genome annotation for The ENCODE Project. Genome Res 22, 1760–1774. [DOI] [PMC free article] [PubMed] [Google Scholar]
- Hatton AR, Subramaniam V, and Lopez AJ (1998). Generation of alternative Ultrabithorax isoforms and stepwise removal of a large intron by resplicing at exon-exon junctions. Mol. Cell 2, 787–796. [DOI] [PubMed] [Google Scholar]
- Herzel L, Ottoz DSM, Alpert T, and Neugebauer KM (2017). Splicing and transcription touch base: co-transcriptional spliceosome assembly and function. Nat. Rev. Mol. Cell Biol 18, 637–650. [DOI] [PMC free article] [PubMed] [Google Scholar]
- Herzel L, Straube K, and Neugebauer KM (2018). Long-read sequencing of nascent RNA reveals coupling among RNA processing events. Genome Res 28, 1008–1019. [DOI] [PMC free article] [PubMed] [Google Scholar]
- Hua Y, Sahashi K, Hung G, Rigo F, Passini MA, Bennett CF, and Krainer AR (2010). Antisense correction of SMN2 splicing in the CNS rescues necrosis in a type III SMA mouse model. Genes Dev 24, 1634–1644. [DOI] [PMC free article] [PubMed] [Google Scholar]
- Jaqaman K, Loerke D, Mettlen M, Kuwata H, Grinstein S, Schmid SL, and Danuser G (2008). Robust single-particle tracking in live-cell time-lapse sequences. Nat. Methods 5, 695–702. [DOI] [PMC free article] [PubMed] [Google Scholar]
- Jonkers I, and Lis JT (2015). Getting up to speed with transcription elongation by RNA polymerase II. Nat. Rev. Mol. Cell Biol 16, 167–177. [DOI] [PMC free article] [PubMed] [Google Scholar]
- Jonkers I, Kwak H, and Lis JT (2014). Genome-wide dynamics of Pol II elongation and its interplay with promoter proximal pausing, chromatin, and exons. eLife 3, e02407. [DOI] [PMC free article] [PubMed] [Google Scholar]
- Joseph B, Kondo S, and Lai EC (2018). Short cryptic exons mediate recursive splicing in Drosophila. Nat. Struct. Mol. Biol 25, 365–371. [DOI] [PMC free article] [PubMed] [Google Scholar]
- Kelly S, Georgomanolis T, Zirkel A, Diermeier S, O’Reilly D, Murphy S, Längst G, Cook PR, and Papantonis A (2015). Splicing of many human genes involves sites embedded within introns. Nucleic Acids Res 43, 4721–4732. [DOI] [PMC free article] [PubMed] [Google Scholar]
- Khodor YL, Menet JS, Tolan M, and Rosbash M (2012). Cotranscriptional splicing efficiency differs dramatically between Drosophila and mouse. RNA 18, 2174–2186. [DOI] [PMC free article] [PubMed] [Google Scholar]
- Köster J, and Rahmann S (2018). Snakemake-a scalable bioinformatics workflow engine. Bioinformatics 34, 3600. [DOI] [PubMed] [Google Scholar]
- Lareau LF, Inada M, Green RE, Wengrod JC, and Brenner SE (2007). Unproductive splicing of SR genes associated with highly conserved and ultraconserved DNA elements. Nature 446, 926–929. [DOI] [PubMed] [Google Scholar]
- Larson DR, Fritzsch C, Sun L, Meng X, Lawrence DS, and Singer RH (2013). Direct observation of frequency modulated transcription in single cells using light activation. eLife 2, e00750. [DOI] [PMC free article] [PubMed] [Google Scholar]
- Lee T-H (2009). Extracting kinetics information from single-molecule fluorescence resonance energy transfer data using hidden markov models. J. Phys. Chem. B 113, 11535–11542. [DOI] [PMC free article] [PubMed] [Google Scholar]
- Li H (2018). Minimap2: pairwise alignment for nucleotide sequences. Bioinformatics 34, 3094–3100. [DOI] [PMC free article] [PubMed] [Google Scholar]
- Lim LP, and Burge CB (2001). A computational analysis of sequence features involved in recognition of short introns. Proc. Natl. Acad. Sci. USA 98, 11193–11198. [DOI] [PMC free article] [PubMed] [Google Scholar]
- Montero P, and Vilar JA (2014). TSclust: An R Package for Time series clustering. J. Stat. Softw 62, 1–43. [Google Scholar]
- Moore MJ (2000). Intron recognition comes of AGe. Nat. Struct. Biol 7, 14–16. [DOI] [PubMed] [Google Scholar]
- Oesterreich FC, Herzel L, Straube K, Hujer K, Howard J, and Neugebauer KM (2016). Splicing of Nascent RNA Coincides with Intron Exit from RNA Polymerase II. Cell 165, 372–381. [DOI] [PMC free article] [PubMed] [Google Scholar]
- Pai AA, Henriques T, Paggi J, Burkholder A, Adelman K, and Burge CB (2017). Intron Length and Recursive Sites Are Major Determinants of Splicing Efficiency in Flies. bioRxiv 10.1101/107995. [DOI] [Google Scholar]
- Palangat M, Anastasakis DG, Fei DL, Lindblad KE, Bradley R, Hourigan CS, Hafner M, and Larson DR (2019). The splicing factor U2AF1 contributes to cancer progression through a noncanonical role in translation regulation. Genes Dev 33, 482–497. [DOI] [PMC free article] [PubMed] [Google Scholar]
- Pandya-Jones A, Bhatt DM, Lin CH, Tong AJ, Smale ST, and Black DL (2013). Splicing kinetics and transcript release from the chromatin compartment limit the rate of Lipid A-induced gene expression. RNA 19, 811–827. [DOI] [PMC free article] [PubMed] [Google Scholar]
- Rabani M, Raychowdhury R, Jovanovic M, Rooney M, Stumpo DJ, Pauli A, Hacohen N, Schier AF, Blackshear PJ, Friedman N, et al. (2014). High-resolution sequencing and modeling identifies distinct dynamic RNA regulatory strategies. Cell 159, 1698–1710. [DOI] [PMC free article] [PubMed] [Google Scholar]
- Rädle B, Rutkowski AJ, Ruzsics Z, Friedel CC, Koszinowski UH, and Dölken L (2013). Metabolic labeling of newly transcribed RNA for high resolution gene expression profiling of RNA synthesis, processing and decay in cell culture. J. Vis. Exp (78), 50195. [DOI] [PMC free article] [PubMed] [Google Scholar]
- Raj A, and van Oudenaarden A (2008). Nature, nurture, or chance: stochastic gene expression and its consequences. Cell 135, 216–226. [DOI] [PMC free article] [PubMed] [Google Scholar]
- Ramírez F, Ryan DP, Grüning B, Bhardwaj V, Kilpert F, Richter AS, Heyne S, Dündar F, and Manke T (2016). deepTools2: a next generation web server for deep-sequencing data analysis. Nucleic Acids Res 44 (W1), W160–W165. [DOI] [PMC free article] [PubMed] [Google Scholar]
- Ran FA, Hsu PD, Wright J, Agarwala V, Scott DA, and Zhang F (2013). Genome engineering using the CRISPR-Cas9 system. Nat. Protoc 8, 2281–2308. [DOI] [PMC free article] [PubMed] [Google Scholar]
- Rodriguez J, Ren G, Day CR, Zhao K, Chow CC, and Larson DR (2019). Intrinsic Dynamics of a Human Gene Reveal the Basis of Expression Heterogeneity. Cell 176, 213–226.e18. [DOI] [PMC free article] [PubMed] [Google Scholar]
- Ruskin B, Zamore PD, and Green MR (1988). A factor, U2AF, is required for U2 snRNP binding and splicing complex assembly. Cell 52, 207–219. [DOI] [PubMed] [Google Scholar]
- Russo J, Heck AM, Wilusz J, and Wilusz CJ (2017). Metabolic labeling and recovery of nascent RNA to accurately quantify mRNA stability. Methods 120, 39–48. [DOI] [PMC free article] [PubMed] [Google Scholar]
- Schindelin J, Arganda-Carreras I, Frise E, Kaynig V, Longair M, Pietzsch T, Preibisch S, Rueden C, Saalfeld S, Schmid B, et al. (2012). Fiji: an open-source platform for biological-image analysis. Nat. Methods 9, 676–682. [DOI] [PMC free article] [PubMed] [Google Scholar]
- Shcherbakova I, Hoskins AA, Friedman LJ, Serebrov V, Corrêa IR Jr., Xu MQ, Gelles J, and Moore MJ (2013). Alternative spliceosome assembly pathways revealed by single-molecule fluorescence microscopy. Cell Rep 5, 151–165. [DOI] [PMC free article] [PubMed] [Google Scholar]
- Sibley CR, Emmett W, Blazquez L, Faro A, Haberman N, Briese M, Trabzuni D, Ryten M, Weale ME, Hardy J, et al. (2015). Recursive splicing in long vertebrate genes. Nature 521, 371–375. [DOI] [PMC free article] [PubMed] [Google Scholar]
- Singh J, and Padgett RA (2009). Rates of in situ transcription and splicing in large human genes. Nat. Struct. Mol. Biol 16, 1128–1133. [DOI] [PMC free article] [PubMed] [Google Scholar]
- So BR, Di C, Cai Z, Venters CC, Guo J, Oh JM, Arai C, and Dreyfuss G (2019). A Complex of U1 snRNP with Cleavage and Polyadenylation Factors Controls Telescripting, Regulating mRNA Transcription in Human Cells. Mol. Cell 76, 590–599.e4. [DOI] [PMC free article] [PubMed] [Google Scholar]
- Soille P (2013). Morphological Image Analysis: Principles and Applications (Springer Science & Business Media; ). [Google Scholar]
- Taggart AJ, Lin CL, Shrestha B, Heintzelman C, Kim S, and Fairbrother WG (2017). Large-scale analysis of branchpoint usage across species and cell lines. Genome Res 27, 639–649. [DOI] [PMC free article] [PubMed] [Google Scholar]
- Tang AD, Soulette CM, van Baren MJ, Hart K, Hrabeta-Robinson E, Wu CJ, and Brooks AN (2020). Full-length transcript characterization of SF3B1 mutation in chronic lymphocytic leukemia reveals downregulation of retained introns. Nat. Commun 11, 1438. [DOI] [PMC free article] [PubMed] [Google Scholar]
- Tani H, Imamachi N, Salam KA, Mizutani R, Ijiri K, Irie T, Yada T, Suzuki Y, and Akimitsu N (2012). Identification of hundreds of novel UPF1 target transcripts by direct determination of whole transcriptome stability. RNA Biol 9, 1370–1379. [DOI] [PMC free article] [PubMed] [Google Scholar]
- Tardaguila M, de la Fuente L, Marti C, Pereira C, Pardo-Palacios FJ, Del Risco H, Ferrell M, Mellado M, Macchietto M, Verheggen K, et al. (2018). SQANTI: extensive characterization of long-read transcript sequences for quality control in full-length transcriptome identification and quantification. Genome Res 28, 396–411. [DOI] [PMC free article] [PubMed] [Google Scholar]
- The Bioconductor Dev Team (2014). BSgenome.Hsapiens.UCSC.hg19: Full genome sequences for Homo sapiens (UCSC version hg19) (The R Project for Statistical Computing; ). [Google Scholar]
- Thévenaz P, Ruttimann UE, and Unser M (1998). A pyramid approach to subpixel registration based on intensity. IEEE Trans. Image Process 7, 27–41. [DOI] [PubMed] [Google Scholar]
- Vargas DY, Shah K, Batish M, Levandoski M, Sinha S, Marras SA, Schedl P, and Tyagi S (2011). Single-molecule imaging of transcriptionally coupled and uncoupled splicing. Cell 147, 1054–1065. [DOI] [PMC free article] [PubMed] [Google Scholar]
- Vincent L, and Soille P (1991). Watersheds in digital spaces: an efficient algorithm based on immersion simulations. IEEE Trans. Pattern Anal. Mach. Intell 13, 583–598. [Google Scholar]
- Wagih O (2017). ggseqlogo: a versatile R package for drawing sequence logos. Bioinformatics 33, 3645–3647. [DOI] [PubMed] [Google Scholar]
- Wahl MC, Will CL, and Lührmann R (2009). The spliceosome: design principles of a dynamic RNP machine. Cell 136, 701–718. [DOI] [PubMed] [Google Scholar]
- Will CL, and Lührmann R (2011). Spliceosome structure and function. Cold Spring Harb. Perspect. Biol 3, a003707. [DOI] [PMC free article] [PubMed] [Google Scholar]
- Windhager L, Bonfert T, Burger K, Ruzsics Z, Krebs S, Kaufmann S, Malterer G, L’Hernault A, Schilhabel M, Schreiber S, et al. (2012). Ultrashort and progressive 4sU-tagging reveals key characteristics of RNA processing at nucleotide resolution. Genome Res 22, 2031–2042. [DOI] [PMC free article] [PubMed] [Google Scholar]
- Wohland T, Rigler R, and Vogel H (2001). The standard deviation in fluorescence correlation spectroscopy. Biophys. J 80, 2987–2999. [DOI] [PMC free article] [PubMed] [Google Scholar]
- Wu X, Li Y, Crise B, and Burgess SM (2003). Transcription start regions in the human genome are favored targets for MLV integration. Science 300, 1749–1751. [DOI] [PubMed] [Google Scholar]
- Xiao MS, and Wilusz JE (2019). An improved method for circular RNA purification using RNase R that efficiently removes linear RNAs containing G-quadruplexes or structured 3′ ends. Nucleic Acids Res 47, 8755–8769. [DOI] [PMC free article] [PubMed] [Google Scholar]
- Xu H, Fair BJ, Dwyer ZW, Gildea M, and Pleiss JA (2019). Detection of splice isoforms and rare intermediates using multiplexed primer extension sequencing. Nat. Methods 16, 55–58. [DOI] [PMC free article] [PubMed] [Google Scholar]
- Zhang Y, Liu T, Meyer CA, Eeckhoute J, Johnson DS, Bernstein BE, Nusbaum C, Myers RM, Brown M, Li W, and Liu XS (2008). Model-based analysis of ChIP-Seq (MACS). Genome Biol 9, R137. [DOI] [PMC free article] [PubMed] [Google Scholar]
- Zhang Z, English BP, Grimm JB, Kazane SA, Hu W, Tsai A, Inouye C, You C, Piehler J, Schultz PG, et al. (2016). Rapid dynamics of general transcription factor TFIIB binding during preinitiation complex assembly revealed by single-molecule analysis. Genes Dev 30, 2106–2118. [DOI] [PMC free article] [PubMed] [Google Scholar]
- Zhang SY, Clark NE, Freije CA, Pauwels E, Taggart AJ, Okada S, Mandel H, Garcia P, Ciancanelli MJ, Biran A, et al. (2018a). Inborn Errors of RNA Lariat Metabolism in Humans with Brainstem Viral Infection. Cell 172, 952–965.e18. [DOI] [PMC free article] [PubMed] [Google Scholar]
- Zhang XO, Fu Y, Mou H, Xue W, and Weng Z (2018b). The temporal landscape of recursive splicing during Pol II transcription elongation in human cells. PLoS Genet 14, e1007579. [DOI] [PMC free article] [PubMed] [Google Scholar]
- Zhang S, Aibara S, Vos SM, Agafonov DE, Lührmann R, and Cramer P (2021). Structure of a transcribing RNA polymerase II-U1 snRNP complex. Science 371, 305–309. [DOI] [PubMed] [Google Scholar]
Associated Data
This section collects any data citations, data availability statements, or supplementary materials included in this article.
Supplementary Materials
(A) Schematic of sequential steps to obtain polyclonal cell population and single-cell clones representing unique genes. (B) Expression pattern of iRFP fusion proteins in gene-trap cells after 12 days of Blasticidin selection. iRFP fusion proteins could localize in various cellular compartments, such as nucleus (arrowheads) or cytoplasm (arrows). (C) FACS assays at each step described in Figure 1A. FACS assay 1 (top): Blasticidin and iRFP positive selection. FACS assay 2 (bottom): Introducing MS2 coat protein and FLP recombinase. Cells were gated for iRFP negative selection for single-cell cloning. (D) Genomic PCR verification for the removal of iRFP/Blasticidin selection cassette. Top: Primer design for single-cell clone genomic testing. iRFP negative and Flank-primer-target positive indicates the successful removal of the selection cassette. Bottom: qPCR assay to confirm the complete removal of the selection cassette in single-cell clones. Heatmap represents qPCR amplification signal from genomic DNA. Each bar represents one single-cell clone. (E) Genomic sequencing to detect the integration sites of MS2 or PP7 stem-loops. (F) MS2/PP7 stem-loops tend to integrate into the first intron of a gene. (G) Distribution of the stem-loop integration sites relative to the transcription start sites (TSS). (H) MS2/PP7 stem-loops tend to integrate into the longer introns. (I) 397 single-cell clones are established, tested with high-throughput imaging, genomic PCR, and 66 of which are further confirmed with single-cell-clone genomic sequencing. We identified 15 unique genes labeled with MS2 stem-loops, single insertion per cell. (J) Clustering of single-cell nascent RNA dynamic traces. Contingency analysis of the enrichment of specific genes in each cluster.
(A) RAB7A with MS2 stem loops insertion in intron1 (Insertion site Chr 3: 128,450,384, arrowhead). (B) smFISH images with RAB7A intron (red) and 3UTR (green) probe-sets in WT and RAB7A-clone cells. Arrowheads indicate transcription sites (TS). MS2 stem loops (red) co-localize with the TS as labeled by RAB7A 3UTR probes (green). (C) MS2 stem-loop insertion does not change the overall mRNA molecule abundance, TS frequency and TS intensity. (D) SLC2A1 with MS2 stem-loops intronic insertion (insertion site: Chr1: 43,417,046, green bar and arrowhead). (E and F) mRNA abundance, TS frequency and TS intensity in WT or MS2 stem-loops engineered cells. (G) RHOA with MS2 stem-loops intronic insertion (insertion site Chr 3: 49,447,687, green bar and arrowhead). smFISH probesets targeted regions are indicated in red and green dash lines. (H and I) MS2 stem-loop integration exhibits minimum effect on mRNA abundance, TS frequency and TS intensity.
(A) Integrated live-cell imaging traces with 100 s intervals for ERRFI1 with Mock or pladienolide B (1 µM) treatment. Live-cell imaging is taken immediately after Plad B treatment. (B) Cumulative frequency of ON time distribution for ERRFI1 with Mock or pladienolide B treatment at a gradient of concentrations (10nM, 100nM, and 1 µM). (C) Integrated live-cell imaging traces with 100 s intervals for RAB7A with Mock or SSA (480 nM) treatment. Live-cell imaging is taken immediately after SSA treatment. (D) Cumulative frequency of ON time distribution for RAB7A with Mock or SSA treatment at a gradient of concentrations (4.8 nM, 48 nM, and 480 nM). (E and F) Rates of in situ transcription and splicing measured in a population of cells. (E) Transcription was synchronized with 100 µM DRB treatment for 3 hr. After DRB washout, samples were collected every 5 min for 60 min, transcription and splicing kinetics were measured. Transcription and splicing of SLC2A1 intron 1 in WT (left) and SLC2A1-MS2 engineered cells (right) are measured by qPCR. The gene structure is shown below each graph with arrows indicating the exon-intron junctions that are analyzed. Green bar indicates the insertion site for MS2 stem-loops. Average trace-intensity reflecting transcription wave measured through live-cell imaging (gray curves) is shown in the same chart for the MS2-engineered clones. Right y axis indicates the fluorescent intensity (A.U.) from live -cell imaging. (F) Similarly, transcription elongation rate and splicing rate of intron 1 for gene ERRFI1 in WT cells or MS2 engineered clones. Error bars indicate SEM.
(A) Autoradiography of SDS-PAGE resolving RNA crosslinked to U2AF1 or U2AF2 from 4 thio-Uridine (4sU) labeled cells. (B) Sequence logo showing the enriched motif of U2AF-complex footprints presents in the PAR-CLIP data. (C) Representative snapshots of U2AF-complex footprints in RHOA. U2AF-complex footprints are called through PARpipe. Maximum entropy scores for potential SS are generate by MaxEntScan. (D and E) U1 associated proteins and U2AF complex are detected at RS sites within introns. Average read coverage for U1C, U1A, U2AF complex and hnRNPC are computed across exons (D) and within introns (E). U1A, U1C and hnRNPC cross-linked immunoprecipitation read coverage matrixes are generated centered around U2AF peaks. Shaded areas indicate standard error. (F-J) Nascent RNA sequencing identified RS junctions. (F) Schematic illustration for nascent RNA purification via 10 min pulse labeling with 4sU. (G) Increased intron coverage with nascent RNA sequencing. (H) Genomic distribution of unique splicing junctions identified through nascent RNA sequencing. (I) Nascent RNA seq identified intronic splicing junctions share the same splice-site motif as annotated introns. Intronic junction reads are classified according to their 5′ and 3′ locations (i.e., both intronic, 5′ match annotated SS, 3′ match annotated SS). Occurrence of the 5′ and 3′ SS motif is shown for each group. (J) Intronic splicing junctions tend to occur in longer introns.
(A) Schematic of dual color labeling in RAB7A 1st intron. 24X PP7 stem-loops are integrated via CRISPR/Cas9 746 bp upstream of exon 2. Zeocin served as a selection marker and further removed through Cre/loxP recombination. (B) Genomic testing before and after CRISPR/Cas9 mediated integration. (C) Single-molecule FISH (smFISH) images confirmed the co-localization between PP7 stem-loops and RAB7A 3′SS intronic region (top). MS2 and PP7 stem-loops were integrated in the same allele (bottom).
(A and B) Pulse-chase nascent RNA sequencing captured splicing intermediates in introns. (A) Schematic of pulse-chase nascent RNA sequencing strategy. (B) Sashimi plots for RAB7A nascent RNA sequencing at 10, 20, and 40 min after transcription release. MS2 stem-loop integration sites are labeled according to single-cell clone genomic sequencing results. (C-H) An improved approach for lariat sequencing in human cells. (C) Comparison of multiple approaches for enriching full-intron lariats. Although none of these methods are saturate, polyA and rRNA depletion together with SuperScript VI mediated reverse transcription achieved the highest enrichment of full-intron lariats. (D) Circular RNA enrichment per million reads with different approaches. (E) Lariat length distribution captured by different methods. (F-G) Scatter density plot of lariat length versus intron length detected in patients with DBR1 mutations. Each dot represents a lariat and the intron it derived from. Intron length < 1500 bp are shown in (F) and < 150 kb are shown in (G). (H) The ratio of mature mRNA and nascent RNA for genes belongs to different gene-length groups. Mature mRNA RPKM is calculated from polyA selected RNA sequencing data in HBECs. Nascent RNA RPM is calculated from 4sU pulse-chase nascent RNA sequencing data (10 min) in the same cell line. (I-M) Nascent RNA long-read sequencing revealed stochastic splice site selection in introns. (I) Example of stochastic splice site selection in SRSF7 revealed by U2AF complex PAR-CLIP, lariat seq, and nascent RNA long-read sequencing. Split reads mapped within introns in DBR1 knockdown human cells or patients’ fibroblast with DBR1 mutations are shown in green. Nascent RNA long-read sequencing reads aligned to the gene SRSF7 in human bronchial epithelial cells (HBECs) are shown in gray, with boxes indicate aligned reads and lines indicate splicing junctions. Each continuous line represents a single read. Transcripts with activated RS site in intron 5 are highlighted in brown. The gene structure with annotated splice sites is shown in blue from transcription start site (TSS) to polyA site. Green box indicate the transcript is not subject to NMD pathway. Red box indicates poison exon. (J) Example of stochastic splice site selection in SEMA4B revealed by nascent RNA long-read sequencing. RS site sequence are shown in the zoomed-in window. (K) Venn diagram showing the intersect between RS events and poison exons. Poison exons are extracted based on UPF1 knockdown data. 417 (7.6%) of the RS events could result in poison exons. (L) RS is categorized to three classes: RS with annotated 5′ splice site (SS), RS with annotated 3′ SS, RS with nested splice sites. There are 6.2%, 9.7%, and 5.3% of the RS events in each category could result in poison exons. (M) RS can salvage transcripts by removing poison exons. 17.9%, 10.0%, and 6.8% of RS events could remove poison exons in each category.
Data Availability Statement
Data and code are publicly available.
Processed and raw data can be downloaded from NCBI GEO GSE134377.
The software for nascent RNA sequencing analysis are available at LarsonLab GitHub: https://github.com/CBIIT/Larson-Lab-CCR-NCI/tree/master
The software for imaging analysis (e.g., Localize, FishAuxiliary, KINME based image analysis pipeline) are available at LarsonLab GitHub: https://github.com/CBIIT/Larson-Lab-CCR-NCI/tree/master
Code for Generalized transcription model is available at Github: https://github.com/nih-niddk-mbs/StochasticGene.