

Abstract
Timely detection of liver fibrosis by X‐ray computed tomography (CT) can prevent its progression to fatal liver diseases. However, it remains quite challenging because conventional CT can only identify the difference in density instead of X‐ray attenuation characteristics. Spectral CT can generate monochromatic imaging to specify X‐ray attenuation characteristics of the scanned matter. Herein, an X‐ray energy‐dependent attenuation strategy originated from bismuth (Bi)‐based nanoprobes (BiF3@PDA@HA) is proposed for the accurate diagnosis of liver fibrosis. Bi element in BiF3@PDA@HA can exhibit characteristic attenuation depending on different levels of X‐ray energy via spectral CT, and that is challenging for conventional CT. In this study, selectively accumulating BiF3@PDA@HA nanoprobes in the hepatic fibrosis areas can significantly elevate CT value for 40 Hounsfield units on 70 keV monochromatic images, successfully differentiating from healthy livers and achieving the diagnosis of liver fibrosis. Furthermore, the enhancement produced by the BiF3@PDA@HA nanoprobes in vivo increases as the monochromatic energy decreases from 70 to 40 keV, optimizing the conspicuity of the diseased areas. As a proof of concept, the strategically designed nanoprobes with energy‐dependent attenuation characteristics not only expand the scope of CT application, but also hold excellent potential for precise imaging‐based disease diagnosis.
Keywords: BiF3@PDA@HA nanoprobes, hyaluronic acid, liver fibrosis, spectral computed tomography
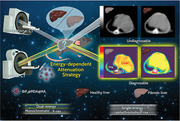
A strategy of energy‐dependent attenuation based on bismuth (Bi) nanomaterials is proposed. BiF3@PDA@HA nanoprobes accumulated in fibrosis‐afflicted areas can attenuate characteristically depending on monoenergetic X‐ray, further leading to fibrotic livers conspicuous via spectral computed tomography (CT). Yet conventional CT with polyenergetic X‐ray can't distinguish liver fibrosis from healthy liver.
1. Introduction
Liver cirrhosis and hepatocellular carcinoma (HCC) are responsible for approximately two million deaths annually worldwide due to the lack of effective treatment options.[ 1 ] Cirrhosis and HCC commonly result from chronic liver fibrosis.[ 2 ] Fortunately, fibrotic progression in liver can be reversed if it is diagnosed in a timely manner,[ 3 ] further improving the patients’ quality of life and survival rate.[ 4 ] However, the routine diagnosis of liver fibrosis depends on highly invasive biopsies that lead to pain and other complications.[ 5 ] Therefore, there is an urgent need to exploit novel imaging techniques for accurately diagnosing liver fibrosis in a non‐invasive manner.[ 6 ]
X‐ray computed tomography (CT) is a common diagnostic tool for tumors,[ 7 ] internal injuries,[ 8 ] fractures,[ 9 ] and so on. However, since conventional CT uses a polychromatic (polyenergetic)[ 10 ] X‐ray spectrum with multienergy photons,[ 11 ] it can only distinguish materials based on their difference in density rather than attenuation characteristics.[ 12 ] Hence, conventional CT cannot differentiate between the fibrotic and healthy liver tissues due to their similarity in density. Acquired with high‐energy and low‐energy X‐ray settings, spectral CT is capable of distinguishing different kinds of tissue in vivo based on their attenuation characteristics[ 13 ] and generates monochromatic (monoenergetic) X‐ray images that represent single X‐ray photon energy level ranging from 40–140 keV.[ 14 ] Yet, when exploiting spectral CT to detect liver fibrosis, a challenge remains: fibrotic and healthy livers share similar X‐ray attenuation coefficients. To better distinguish abnormality in soft tissue, clinical CT scans commonly require the administration of iodine‐based contrast agents.[ 15 ] Nevertheless, the clinical X‐ray spectra contain few photons around the K‐edge of iodine (33 keV),[ 16 ] leading to an exceedingly weak characteristic attenuation of iodine to be identified by spectral CT. Furthermore, the disadvantages of clinical iodinated small‐molecule agents, including short metabolic time[ 17 ] and incompetence of disease targeting,[ 18 ] make iodine‐enhanced spectral CT still inadequate to distinguish between the fibrotic and healthy livers. Bismuth (Bi) has a K‐edge value of 90.5 keV,[ 19 ] and large X‐ray attenuation coefficient (5.74 cm2 g−1 at 100 keV).[ 20 ] Therefore, Bi‐based nanoparticles can overcome the shortcomings of iodinated small molecules, offering higher‐performing contrast enhancement on CT imaging.[ 21 ] More importantly, Bi with high atomic number (Z), can show characteristic attenuation at different energies of the X‐ray beam, known as “energy‐dependent attenuation,”[ 22 ] a property that is suitable for spectral CT. Thus, it is of considerable significance to reasonably design Bi‐based nanoprobes for achieving accurate diagnosis of liver fibrosis.
Herein, an innovative X‐ray energy‐dependent attenuation strategy was proposed for the precise diagnosis of liver fibrosis. Liver fibrosis is characterized by the excessive proliferation and abnormal deposition of the extracellular matrix proteins, such as collagen and hyaluronic acids (HA).[ 23 ] Thus, HA is considered as a vital biomarker of liver fibrosis, and significantly correlated with the severity of liver fibrosis.[ 24 ] By conjugating HA to Bi‐based nanoparticles, novel liver‐fibrosis‐targeting contrast nanoagents were prepared for diagnosing liver fibrosis via spectral CT. The targeting performance of HA toward liver fibrosis has been confirmed by multiple previous studies.[ 25 ] Thus, HA modification can enable BiF3@PDA@HA nanoprobes to selectively accumulate in the fibrotic tissues as opposed to healthy liver tissues, allowing differential imaging between the healthy and fibrotic livers by spectral CT. In contrast, conventional CT was incompetent (Scheme 1 ). Specifically, on the 70 keV monoenergetic images of spectral CT, liver CT Hounsfield unit (HU) value manifested approximately onefold elevation (from 38.50 ± 3.63 to 79.67 ± 11.57 HU) in mice model of liver fibrosis at 30 min after injection of BiF3@PDA@HA nanoprobes. Furthermore, the most obvious distinction between the healthy and fibrotic livers was achieved at the X‐ray energy of 40 keV. Taken together, the X‐ray energy‐dependent attenuation characteristic of BiF3@PDA@HA was quite qualified for the non‐invasively precise diagnosis of liver fibrosis via spectral CT, confirming the feasibility of energy‐dependent attenuation strategy.
Scheme 1.

Schematic diagram of the energy‐dependent attenuation strategy for diagnosing liver fibrosis. After injecting BiF3@PDA@HA nanoprobes, conventional CT and spectral CT were performed in liver fibrosis model mice and healthy control mice. Bismuth (Bi) has characteristic X‐ray attenuation depending on different X‐ray photon energy, also known as energy‐dependent attenuation. As spectral CT can generate monoenergetic images representing single energy level of X‐ray, the strategically designed BiF3@PDA@HA nanoprobes can show unique enhancement in fibrotic liver corresponding with certain energy level of X‐ray via spectral CT, achieving the diagnosis of liver fibrosis. But the conventional CT with polychromatic X‐ray cannot reveal the characteristic energy‐dependent attenuation of Bi, thus incapable of detecting liver fibrosis.
2. Results and Discussion
2.1. Synthesis and Characterization
BiF3 nanoparticles were synthesized as previously described,[ 26 ] and sequentially modified with dopamine (DA) and HA for hydrophilicity and liver‐fibrosis‐targeting, respectively. Transmission electron microscopy (TEM) images (Figure S1, Supporting Information) confirmed the successful preparation of BiF3 nanoparticles and BiF3@PDA@HA nanoprobes. Scanning electron microscopy (SEM) demonstrated the uniform spherical morphology of both BiF3 nanoparticles (Figure S2, Supporting Information) and BiF3@PDA@HA nanoprobes (Figure 1a). Also, BiF3@PDA@HA nanoprobes showed excellent hydrodynamic size distribution centered at 170.7 nm (Figure S3, Supporting Information), explaining their high dispersity without obvious aggregation. Elemental mapping (Figure 1b) further revealed the presence of Bi, F, C, O, and N element in the BiF3@PDA@HA nanoprobes. Furthermore, Fourier transform infrared (FT‐IR) spectra verified the successful surface modification with polydopamine (PDA) and HA (Figure 1c). Finally, X‐ray diffraction (XRD) showed that BiF3 nanoparticles, BiF3@PDA nanoparticles, and BiF3@PDA@HA nanoprobes were in cubic phase (Figure S4, Supporting Information).
Figure 1.
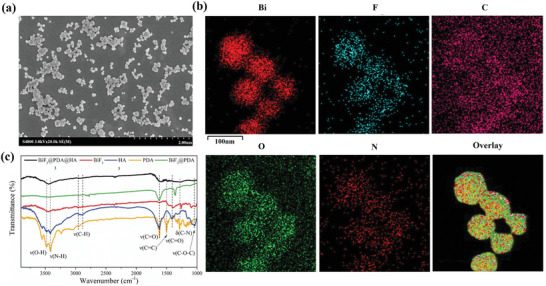
Characterization of BiF3@PDA@HA nanoprobes. a) Scanning electron microscopy (SEM) images of BiF3@PDA@HA. b) Element mappings (Bi, F, C, O, and N) of BiF3@PDA@HA. c) Fourier transformation infrared spectra (FT‐IR) of BiF3@PDA@HA, BiF3@PDA, BiF3, HA, and PDA.
2.2. Computed Tomography Imaging of Bismuth‐Based Nanoprobes In Vitro
The imaging ability of BiF3@PDA@HA nanoprobes with gradient Bi concentration was determined by spectral CT and conventional CT. As shown in Figure 2 , CT phantom images for BiF3@PDA@HA nanoprobes of the higher Bi concentrations were brighter in both forms of CT. But the nanoprobes with the lower amount of Bi became more indistinguishable in conventional CT images (Figure 2a). However, the disparity among different concentrations of Bi was more apparent in spectral CT, even in the range of low Bi concentration (Figure 2b). Furthermore, as the spectral HU curves shown, the CT value of BiF3@PDA@HA nanoprobes increased sharply as the monochromatic energy of spectral CT decreased (Figure 2c). But the spectral HU curves dropped down as concentration of Bi decreased. Spectral HU curve trend of each sample represents their individual characteristic,[ 27 ] hence the energy‐dependent regularity shown in the spectral HU curve of Bi‐based nanoprobes could be used for identifying the existence of selectively accumulated Bi in vivo. Taken together, BiF3@PDA@HA nanoprobes could be used as spectral CT contrast agents by showing characteristic energy‐dependent attenuation.
Figure 2.
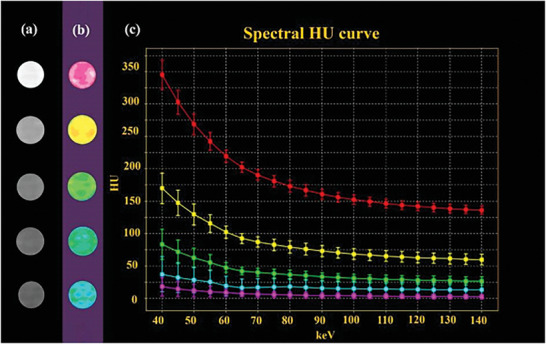
CT performance of BiF3@PDA@HA nanoprobes in vitro. a) Conventional CT images, b) spectral CT monochromatic images, and c) spectral HU curve of BiF3@PDA@HA nanoprobes with gradiently descent Bi concentrations (10 000, 5000, 2500, 1250, and 625 µg mL−1, from top to bottom) with normalization (CT water = 0 HU)
2.3. Cellular Uptake of Bismuth‐Based Nanoprobes In Vitro
The biocompatibility of the nanoparticles was evaluated on the murine hepatocyte AML12 line. The targeted BiF3@PDA@HA nanoprobes and the untargeted BiF3@PDA@PEG nanoparticles were non‐toxic in terms of the cellular viability (Figure S5, Supporting Information).
Furthermore, hepatic stellate cells (HSCs) as liver fibrosis hallmark cells,[ 28 ] were used to confirm the successful target‐specific effect of BiF3@PDA@HA. HSCs activation is a key process in the liver fibrogenesis, and the CD44 receptor is highly expressed in HSCs, which is a major receptor of HA.[ 29 ] From the observation through confocal laser scanning microscopy (CLSM), a higher degree of BiF3@PDA@HA nanoprobes was selectively internalized by HSCs than BiF3@PDA@PEG nanoparticles. As shown in Figure 3 , the BiF3@PDA@HA showed the higher green‐fluorescence intensity which corroborated with faster cellular uptake compared to non‐targeted nanoparticles, BiF3@PDA@PEG BiF3@PDA@HA nanoprobes were distributed across the cell surface and cytoplasm. In contrast, the untargeted BiF3@PDA@PEG and nanoparticles were rarely taken up by HSCs. Besides, the fluorescence intensity significantly decreased when excessive HA was added one hour before BiF3@PDA@HA, demonstrating similar fluorescence intensity with non‐targeted nanoparticles in a relatively low range. Taken together, selective accumulation of targeted BiF3@PDA@HA nanoparticles is probably due to outstanding affinity of HA‐ligand to CD44 receptor‐mediated endocytosis in HSCs, indicating that BiF3@PDA@HA nanoprobes could target HSCs effectively in vitro.
Figure 3.
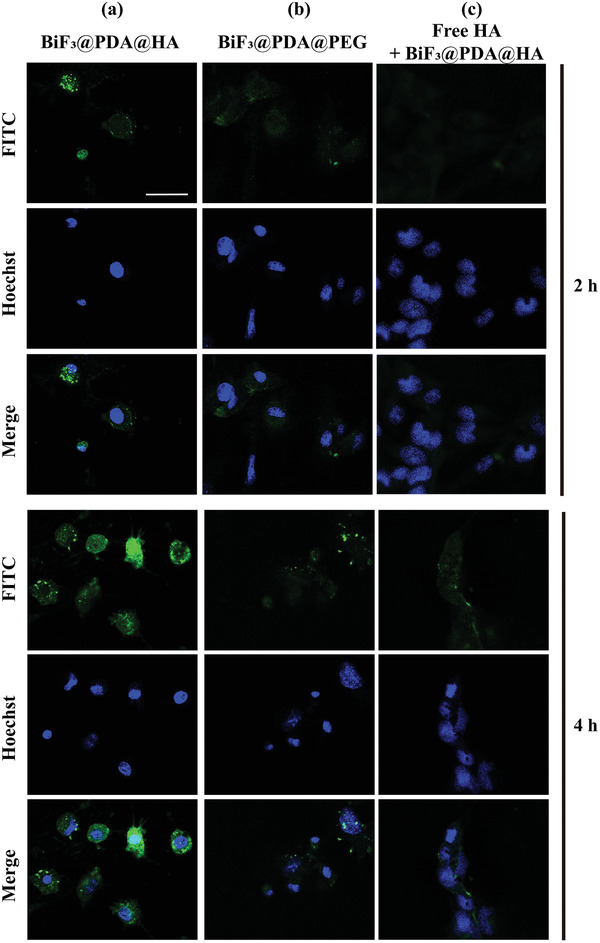
Representative CLSM images of cellular uptake of Bi‐based nanoprobes in vitro. a,b) HSCs incubated with BiF3@PDA@HA (a) and BiF3@PDA@PEG (b) for 2 and 4 h. c) After blocking the CD44 receptor with free HA (5 mg mL−1) for 1 h, the HSCs were incubated with BiF3@PDA@HA nanoprobes for 2 and 4 h. CLSM: confocal laser scanning microscopy; HSCs: hepatic stellate cells; HA: hyaluronic acids.
2.4. Computed Tomography Imaging of Bismuth‐Based Nanoprobes In Vivo
2.4.1. Parallel Comparison between Gemstone Spectral Computed Tomography and Conventional Computed Tomography
The CT imaging ability was investigated by injecting BiF3@PDA@HA nanoprobes into mice with liver fibrosis (targeted group) and healthy mice (control group). As a monochromatic energy level of 70 keV in spectral CT is similar to the average photon energy of a polychromatic X‐ray beam produced by conventional CT,[ 30 ] the images obtained from each form of CT were compared. On 70 keV monoenergetic images of spectral CT, the fibrotic liver in the targeted group manifested enhancement after the injection of BiF3@PDA@HA (Figure 4a, red arrow, and red dashed area), while no apparent enhancement was shown in the control group. Besides, on conventional CT images, both groups exhibited similar performance in hepatic parenchyma post‐injection, with negligible differences from the images of preinjection.
Figure 4.
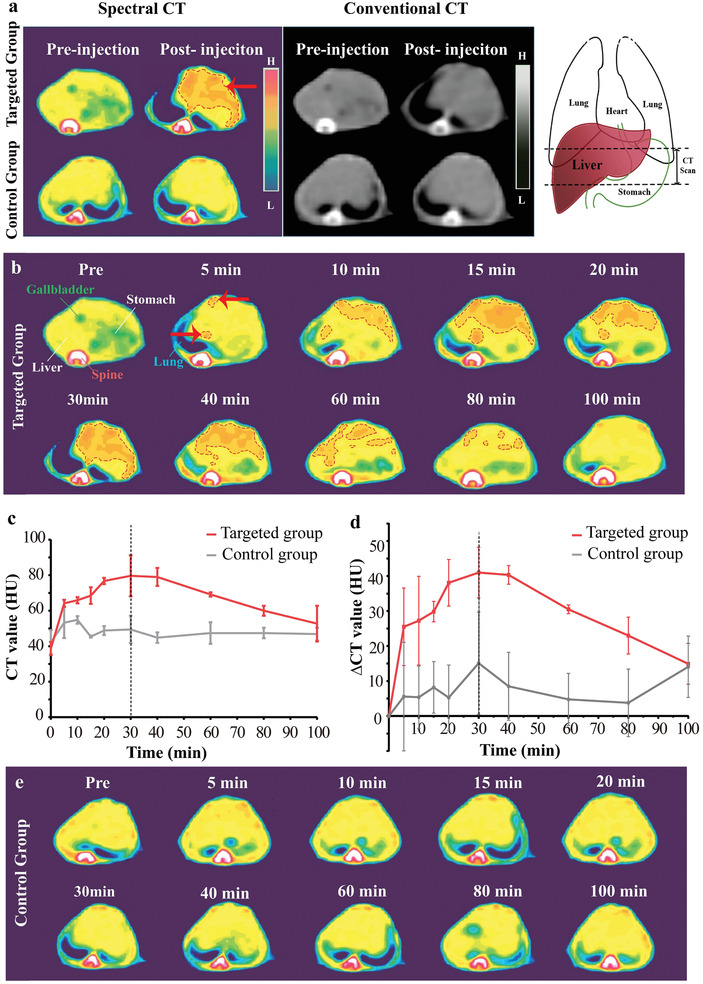
Computed tomography (CT) imaging of BiF3@PDA@HA nanoprobes in vivo. a) Representative CT images acquired at two time points (preinjection and 30 min after the injection of BiF3@PDA@HA) for two groups via spectral CT (70 keV) and conventional CT (140 kVp). Red arrow and red dashed circle represent the enhanced area. The schematic drawings illustrate the taken CT sections. b) Representative spectral CT images of the targeted group before and after the injection of BiF3@PDA@HA. c,d) Dynamic time courses of CT value and CT value change (ΔCT value) of hepatic parenchyma of targeted group (red line, n = 3) and control group (grey line, n = 3). Data was presented as mean ± standard deviation. e) Representative spectral CT images of control group before and after the injection of BiF3@PDA@HA.
Therefore, the dynamic change of the two groups on 70 keV monoenergetic images via spectral CT was investigated in detail. CT value of liver gradually increased and then decreased in the targeted group (Figure 4b, red dashed areas). Besides, the CT value was quantified for diagnosing the fibrosis sensitively. As shown in Figure 4c,d (red lines), liver CT value and ΔCT value (ΔCT value = CTpost − CTpre) of the targeted group increased gradually and reached to a peak at 30 min post‐injection (CT value: 79.67 ± 11.57 HU, ΔCT value: 41.00 ± 15.10 HU). The enhancement then began to weaken but sustained visibly until 80 min post‐injection. Predominant uptake of BiF3@PDA@HA nanoprobes were observed in liver from coronal projection (Figure S6, Supporting Information). In contrast, in the control group, no contrast‐enhanced region inside healthy liver tissue was observed (Figure 4e), or in other tissue following BiF3@PDA@HA injection (Figure S7, Supporting Information). Besides, CT value of the targeted group at each time point was statistically significantly higher than that of the control group from 5 to 80 min post‐injection (Table 1 ). Taken together, the unique attenuation of Bi on 70 keV enabled spectral CT to identify the dynamic changes of Bi concentration in vivo and generated corresponding enhancement in targeted areas on monoenergetic images, further clearly distinguishing liver fibrosis from the healthy liver tissue. Utilizing spectral CT, the fibrosis‐afflicted areas could be successfully delineated, leading to the diagnosis of liver fibrosis.
Table 1.
Mean CT value of three groups and multicomparison results
| CT value [HU] | Targeted group | Control group | Non‐targeted group |
|---|---|---|---|
| 0 min | 38.75 ± 3.63 | 42.17 ± 6.88 | 37.92 ± 6.02 |
| 5 min | 64.17 ± 1.94 | 53.25 ± 8.65* | 41.08 ± 6.91** |
| 10 min | 65.92 ± 1.756 | 54.83 ± 2.08* | 43.92 ± 1.23** |
| 15 min | 68.50 ± 4.68 | 45.42 ± 0.58*** | 38.83 ± 1.94*** |
| 20 min | 76.75 ± 1.75 | 48.83 ± 2.504*** | 33.92 ± 7.715*** |
| 30 min | 79.67 ± 11.57 | 49.42 ± 7.75*** | 40.42 ± 3.75*** |
| 40 min | 79.00 ± 5.06 | 44.83 ± 2.93*** | 36.25 ± 3.31*** |
| 60 min | 69.17 ± 1.18 | 47.42 ± 6.08*** | 38.58 ± 4.73*** |
| 80 min | 60.00 ± 2.82 | 47.42 ± 2.96* | 35.08 ± 2.27*** |
| 100 min | 52.75 ± 10.04 | 46.83 ± 3.626 | 36.33 ± 1.44** |
Note: “min” means minutes. Data were mean ± standard deviation (n = 3 for each group);
Determined by two‐way ANOVA, the liver CT value of all groups was significant for each factor: group (p < 0.0001), time (p < 0.0001), and group × time (p < 0.0001). Then the differences at each time point among groups were compared by Tukey's multiple comparison test;
*/**/*** indicated statistically significant difference from the targeted group (p < 0.05/0.001/0.0001).
Moreover, histopathological examination confirmed liver fibrosis in the targeted group. As shown in Figure S8, Supporting Information, the affected liver tissue had steatotic degeneration of hepatocytes, massive infiltration of inflammatory cells, and extensive fibrous deposition. In contrast, no pathological change was observed in healthy livers of the control group. In addition, abundant Sirius red‐stained collagen fibers were observed in the fibrotic livers of the targeted group and absent in healthy livers of the control group.
Furthermore, changing the monochromatic energy of spectral CT could further strengthen the visibility of BiF3@PDA@HA nanoprobes in the fibrosis‐afflicted areas (Figure 5a), resulting from the energy‐dependent attenuation characteristic of Bi. When the monochromatic energy decreased from 70 to 40 keV, the liver CT value of the targeted group increased up and peaked at 40 keV (109.67 ± 26.24 HU, maximum = 139.00 HU) (Figure 5b). Yet there was no significant variance in the control group over the monochromatic energy changing. Meanwhile, the targeted group's spectral HU curve also illustrated that the CT value increased with the decrease of monochromatic energy (Figure 5c, yellow line), showing a similar trend with the BiF3@PDA@HA phantom in vitro (Figure 2c). Nevertheless, due to the absence of contrast nanoagents, the adjacent muscle tissue did not have notable variance in CT value over monochromatic energy changing (Figure 5c, red line). Taken together, the fibrotic liver tissue accumulated with BiF3@PDA@HA nanoprobes possessed different X‐ray attenuation characteristics compared with other healthy soft tissue. These results may provide an excellent practical example for other imaging techniques using energy‐dependent differences, such as differential phase‐contrast X‐ray imaging[ 31 ] and Raman microspectroscopy.[ 32 ]
Figure 5.
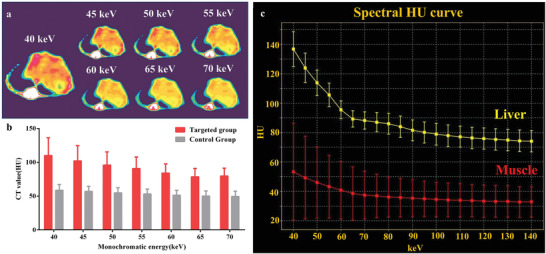
Energy‐dependent attenuation characteristics of BiF3@PDA@HA nanoprobes in vivo at 30 min post‐injection. a) 40–70 keV monochromatic images of the targeted group. b) Comparison between the targeted group (n = 3) and the control group (n = 3) in CT value of monochromatic images of 40–70 keV. Data was presented as mean ± standard deviation. c) Spectral HU curves of liver (yellow line) and muscle (red line) of the targeted group. CT: computed tomography.
2.4.2. Targeting Performance of BiF3@PDA@HA in Liver‐Fibrosis Model
The phenomenal difference in CT values between fibrotic and healthy liver tissue was due to different enrichment of Bi, so the targeting ability of BiF3@PDA@HA nanoprobes toward liver fibrosis was next evaluated. Mice with liver fibrosis applied with BiF3@PDA@PEG nanoparticles were used as the non‐targeted group, in comparison to the targeted group described above. After the injection of BiF3@PDA@PEG, there was no obvious enhancement in hepatic parenchyma of the non‐targeted group (Figures S9 and S10, Supporting Information). In addition, compared to the targeted group, liver CT and ΔCT value of the non‐targeted group only increased slightly for 10–20 min post‐injection and then declined to baseline level (Figure S11, Supporting Information). Furthermore, CT value of the non‐targeted group was statistically significantly lower than that of the targeted group at each time point after injection (Table 1). These results clearly indicated that the favorable targeting performance of BiF3@PDA@HA nanoprobes was beneficial for the diagnosis of liver fibrosis via spectral CT.
2.5. Biocompatibility Assessment
All healthy mice injected with BiF3@PDA@HA well tolerated the nanoprobes without any short‐term (3 days) or long‐term (60 days) adverse effects as per hematological indices as well as histological observation of heart, liver, spleen, lung, and kidney (Figure S12, Supporting Information). Moreover, there was no evident weight difference between the BiF3@PDA@HA‐treated and phosphate‐buffered saline (PBS)‐treated mice over 60 days (Figure S13, Supporting Information). These results suggested the outstanding biocompatibility of BiF3@PDA@HA nanoprobes.
3. Conclusion
In conclusion, an energy‐dependent attenuation strategy was adopted to diagnose liver fibrosis accurately. BiF3@PDA@HA nanoprobes attenuated specifically depending on the level of X‐ray energy and showed characteristic performance correspondingly in monoenergetic imaging via spectral CT. As BiF3@PDA@HA nanoprobes could accumulate in fibrosis‐afflicted regions in liver and remarkably produced enhancement on 70 keV monoenergetic images, the fibrotic livers could be successfully differentiated from healthy ones, further achieving accurate diagnosis of liver fibrosis. Furthermore, due to the energy‐dependent attenuation of Bi, the diseased areas accumulated with BiF3@PDA@HA nanoprobes could be more conspicuous by selecting more suitable monochromatic energy via spectral CT. Especially, CT value of the fibrotic‐afflicted areas reached a maximum on 40 keV monoenergetic images (109.67 ± 26.24 HU) and was approximately 30 HU higher than the CT value at 70 keV (79.67 ± 11.57 HU). This energy‐dependent attenuation strategy was not only highly inspiring for other imaging techniques, but also ignited a novel approach to exploiting interdisciplinary efforts for accurate diagnosis of diseases.
4. Experimental Section
Materials
Bismuth nitrate (Bi[NO3]3·5H2O) and ethylene glycol (EG) were purchased from Adamas‐Beta (Shanghai, China), NH2‐(PEG) n‐SH (MW 2000 Da) from To Yong Bio (Shanghai, China), and Fluorescein isothiocyanate (FITC) isomer I from Sigma‐Aldrich (Shanghai, China). All other solvents and reagents were purchased from Aladdin Co. Ltd. (Shanghai, China). Deionized water was used for all experiments.
Characterizations
SEM (Hitachi S‐48000, Japan) and TEM (JEOL JEM‐2100 at 200 kV, JEOL Ltd., Japan) were used for morphological characterization. Element mapping was performed on a field emission Magellan 400 microscope. Powder XRD patterns were obtained using a Japanese Rigaku D/MAX‐2250V diffractometer with graphite‐monochromatized Cu Kα radiation. FT‐IR spectroscopy was performed on a TENSOR II FT‐IR spectrophotometer (Bruker Corporation) by KBr. Dynamic light scattering tests were conducted on a Nicomp380 Z3000 SOP analyzer (Particle Sizing Systems). BiF3@PDA@HA nanoprobes were prepared using different concentrations (10 000, 5000, 2500, 1250, and 625 μg mL−1) of Bi in the test for their CT imaging ability. The CT measurements were conducted on a clinical CT instrument (GE discovery CT750 HD).
Synthesis of Targeted Nanoprobes and Non‐targeted Nanoparticles
BiF3@PDA@HA nanoprobes: First, Bi(NO3)3·5H2O (1 mm) was dissolved in 10 mL of EG, followed by the addition of 25 mL of EG containing NH4F (24 mm). The solution was incubated for 30 min at 303 K with periodic stirring. After centrifugation, the products were washed twice with deionized water. The resulting BiF3 nanomaterials were then dispersed in 200 mL of deionized water. To convert BiF3 into hydrophilic BiF3@PDA nanoparticles, 400 mg of dopamine was added to the above solution and stirred vigorously for 30 min. Next, 500 µL of ammonium hydroxide was added into the system dropwise and stirred for 12 h. Then, the ensuing products BiF3@PDA nanoparticles were dispersed into 20 mL of deionized water. To conjugate HA onto the nanoparticles, 160 mg of sodium hyaluronate was subsequently added. After stirring for 30 min, 40 µL of ammonium hydroxide was added to the system. After vigorous stirring for 24 h, resulting products were centrifuged and washed with deionized water, and then dispersed in 20 mL of deionized water. Finally, liver‐fibrosis‐targeting BiF3@PDA@HA nanoprobes were successfully synthesized.
BiF3@PDA@HA nanoparticles: To acquire BiF3@PDA@PEG nanoparticles, all the steps, except the conjugation with PEG (160 mg), were the same as described above.
Cell Experiments
Cellular uptake experiment: Briefly, to label FITC onto nanoparticles, 0.1 mg of FITC were dissolved into 1 mL deionized water with 1 mg BiF3@PDA@HA and BiF3@PDA@PEG, respectively, in complete darkness. Then the solution was magnetically stirred vigorously at room temperature for 24 h. Hepatic stellate cells (HSC‐T6) were cultured with a specialized culture medium (both from Guangzhou Jennio Biotech Co., Ltd., China) in the CLSM‐special cell culture dish at 37 °C under 5% CO2. The solution containing labeled nanoparticles was centrifuged, washed thrice with phosphate‐buffered saline (PBS) (HyClone, USA), resuspended in the specialized culture medium for HSCs (Bi at 100 µg mL−1), and incubated with HSCs for 2 and 4 h. After being washed by PBS thrice to remove the free nanoparticles, the cells were stained with Hoechst 33342 (Beyotime, China) and observed under a confocal microscope in the DAPI (blue) and FITC (green) channels via CLSM (Nikon A1 + R‐980).
CD44 receptor blockade examination (competitive test): After applying an excess amount of HA (5 mg mL−1),[ 33 ] the HSCs were treated with FITC‐labeled BiF3@PDA@HA nanoprobes for 2 and 4 h.
Cell toxicity assessment: Mouse liver parenchymal cell line (AML12) was obtained from the Shanghai Cell Bank, Chinese Academy of Science. The AML12 were cultured in mouse hepatocyte‐specialized medium (Shanghai Yaji Biotechnology Co., Ltd., Shanghai, China) at 37 °C under 5% CO2. To determine the cytotoxicity of BiF3@PDA@HA and BiF3@PDA@PEG, the cells were incubated with the respective nanoparticles for 24 h, and their viability was evaluated by the CCK8 assay (Dojindo Laboratories, Japan) according to the manufacturer's instructions. The cell viability was evaluated by the CCK8 assay (Dojindo Laboratories, Japan) according to the manufacturer's instructions. Absorbance at absorption wavelength of 450 nm was measured by the microplate reader (Bio‐TekELx800, USA).
Animal Experiments
All animal experiments were performed following the guidelines and protocols approved by the Institutional Animal Care and Use Committee of Fudan University (accreditation number: 202006011Z).
CT imaging experiment: C57BL/6 mice (Charles River, China) were randomly divided into the following groups: a) control group: healthy mice injected with BiF3@PDA@HA, b) targeted group: liver fibrosis model mice injected with BiF3@PDA@HA, and c) non‐targeted group: liver fibrosis model mice injected with BiF3@PDA@PEG. Liver fibrosis model mice were induced by feeding the mice with methionine/choline‐deficient (MCD) diet[ 34 ] (SYSE Bio‐tech Co., Ltd., Jiangsu, China) for 12 weeks. The healthy controls were fed by regular diet. The animals were injected with BiF3@PDA@HA nanoprobes or BiF3@PDA@PEG nanoparticles via the intravenous route. After imaging, all the mice sacrificed by euthanasia and their liver were dissected and fixed in 4% paraformaldehyde for 24 h. After embedding in paraffin, the tissues were cut into 5–7 µm thick sections and stained with Sirius red, hematoxylin–eosin (H&E) and Masson's trichrome using standard protocols.
In vivo toxicity evaluation: The BiF3@PDA@HA (40 mg Bi per kg body weight) or PBS was injected intravenously into the normal ICR mice (Charles River, Beijing, China). After 3 and 60 days of injection, the mice were sacrificed. Moreover, the main organs, including heart, liver, spleen, lung, and kidney, were harvested for H&E staining to assess toxicity. Routine blood tests were conducted at Huashan Hospital, Fudan University. In addition, body weight of each animal was recorded for 60 days.
Computed Tomography Scanning
Conventional CT and spectral CT (Take gemstone spectral CT as an example) scans were performed on anesthetized mice placed in a supine position using a 64‐detector CT scanner (GE Discovery CT750 HD, GE Medical Healthcare, Wisconsin, USA). The polychromatic images were acquired from conventional CT parameters: tube voltage = 120 kVp; slice thickness = 5 mm. Monochromatic images and spectral HU curves were obtained on spectral CT scanning with following parameters: tube voltage = fast switching between 80 and 140 kVp; slice thickness = 0.625 mm; energy range = 40–140 keV. The scanning parameters of conventional CT and spectral CT were similar in the following aspects: field of view = 50 cm, window width = 350, and window level = 25. The images were processed using GSI Viewer (ADW4.7; GE Healthcare, Wisconsin, USA) in the pseudo‐color mode Sokoloff.
Statistics Analysis
Preprocessing and data analysis: The spectral HU curve was plotted after normalization (CTwater = 0). CT values of the liver parenchyma were measured by an experienced radiologist, who was blinded to the study. Regions‐of‐interest were manually drawn in circular or ellipse shape to encompass as much of the hyper‐enhanced portion as possible (mean pixel number 3, range 2–10) from three contiguous slices. Areas of focal changes of the parenchymal density, as well as large vessels and prominent artifacts, if any, were carefully avoided.
Data presentation, sample size, and statistical methods: Data were reported as mean ± standard error, and compared by two‐way ANOVA followed by Turkey post hoc test. p < 0.05 was considered the statistically significant level. Sample size (n) was three for each statistical analysis.
Software used for statistical analysis: GraphPad Prism 6.0 (GraphPad Software, La Jolla, CA) was used for all statistical analyses. Table 1 .
Conflict of Interest
The authors declare no conflict of interest.
Supporting information
Supporting Information
Acknowledgements
S.W. and X.M. contributed equally to this work. The authors greatly acknowledge the financial support by the National Funds for Distinguished Young Scientists (Grant No. 51725202), the National Natural Science Foundation of China (Grant Nos. 81671732 and 51872094), the Key Project of Shanghai Science and Technology Commission (Grant Nos. 19JC1412000 and 19JC1412002), the National Key R&D Program of China (2018YFA0107900), the China Postdoctoral Science Foundation (BX20200245 and 2020M681397), and Shanghai Key Laboratory of Magnetic Resonance (SKMR2020B01).
Wu S., Meng X., Jiang X., Wu Y., Zhai S., Wang X., Liu Y., Zhang J., Zhao X., Zhou Y., Bu W., Yao Z., Harnessing X‐Ray Energy‐Dependent Attenuation of Bismuth‐Based Nanoprobes for Accurate Diagnosis of Liver Fibrosis. Adv. Sci. 2021, 8, 2002548. 10.1002/advs.202002548
Contributor Information
Yan Zhou, Email: zhouyan@renji.com.
Wenbo Bu, Email: wbbu@fudan.edu.cn.
Zhenwei Yao, Email: zwyao@fudan.edu.cn.
Data Availability Statement
Research data are not shared.
References
- 1. Asrani S. K., Devarbhavi H., Eaton J., Kamath P. S., J. Hepatol. 2019, 70, 151. [DOI] [PubMed] [Google Scholar]
- 2. Ge M., Liu H., Zhang Y., Li N., Zhao S., Zhao W., Zhen Y., Yu J., He H., Shao R. G., Br. J. Pharmacol. 2017, 174, 1147. [DOI] [PMC free article] [PubMed] [Google Scholar]
- 3. Jian Z. C., Long J. F., Liu Y. J., Hu X. D., Liu J. B., Shi X. Q., Li W. S., Qian L. X., World J. Clin. Cases 2019, 7, 1122. [DOI] [PMC free article] [PubMed] [Google Scholar]
- 4. Hagström H., Nasr P., Ekstedt M., Hammar U., Stål P., Hultcrantz R., Kechagias S., J. Hepatol. 2017, 67, 1265. [DOI] [PubMed] [Google Scholar]
- 5. Zhang K., Han Y., Hu Z., Zhang Z., Shao S., Yao Q., Zheng L., Wang J., Han X., Zhang Y., Chen T., Yao Z., Han T., Hong W., Theranostics 2019, 9, 3622. [DOI] [PMC free article] [PubMed] [Google Scholar]
- 6. Lurie Y., Webb M., Cytter‐Kuint R., Shteingart S., Lederkremer G. Z., World J. Gastroenterol. 2015, 21, 11567. [DOI] [PMC free article] [PubMed] [Google Scholar]
- 7.a) Meng X., Zhang H., Zhang M., Wang B., Liu Y., Wang Y., Fang X., Zhang J., Yao Z., Bu W., Adv. Sci. 2019, 6, 1901214; [DOI] [PMC free article] [PubMed] [Google Scholar]; b) Tian R., Zhang H., Chen H., Liu G., Wang Z., Adv. Sci. 2018, 5, 1800214. [DOI] [PMC free article] [PubMed] [Google Scholar]
- 8.a) Jung P. Y., Park E. J., Shim H., Jang J. Y., Bae K. S., Kim S., Int. J. Surg. 2020, 77, 146;. [DOI] [PubMed] [Google Scholar]; b) Faget C., Taourel P., Charbit J., Ruyer A., Alili C., Molinari N., Millet I., Eur. Radiol. 2015, 25, 3620. [DOI] [PubMed] [Google Scholar]
- 9.a) Burns J. E., Yao J., Summers R. M., Radiology 2017, 284, 788;. [DOI] [PMC free article] [PubMed] [Google Scholar]; b) Wang Y., Jiang C., He W., Ai K., Ren X., Liu L., Zhang M., Lu L., ACS Nano 2016, 10, 4164. [DOI] [PubMed] [Google Scholar]
- 10. Bismark R. N. K., Frysch R., Abdurahman S., Beuing O., Blessing M., Rose G., Z. Med. Phys. 2020, 30, 40. [DOI] [PubMed] [Google Scholar]
- 11. Pessis E., Campagna R., Sverzut J. M., Bach F., Rodallec M., Guerini H., Feydy A., Drapé J. L., Radiographics 2013, 33, 573. [DOI] [PubMed] [Google Scholar]
- 12. McCollough C. H., Leng S., Yu L., Fletcher J. G., Radiology 2015, 276, 637. [DOI] [PMC free article] [PubMed] [Google Scholar]
- 13.a) Ding H., Zhao B., Baturin P., Behroozi F., Molloi S., Med. Phys. 2014, 41, 101901; [DOI] [PMC free article] [PubMed] [Google Scholar]; b) Liu X., Yu L., Primak A. N., McCollough C. H., Med. Phys. 2009, 36, 1602. [DOI] [PMC free article] [PubMed] [Google Scholar]
- 14. Goo H. W., Goo J. M., Korean J. Radiol. 2017, 18, 555. [DOI] [PMC free article] [PubMed] [Google Scholar]
- 15.a) Lu X., Lu Z., Yin J., Gao Y., Chen X., Guo Q., Quant. Imaging Med. Surg. 2019, 9, 188;. [DOI] [PMC free article] [PubMed] [Google Scholar]; b) Cauteren T. V., Gompel G. V., Nieboer K. H., Willekens I., Evans P., Macholl S., Droogmans S., de Mey J., Buls N., Sci. Rep. 2018, 8, 17493. [DOI] [PMC free article] [PubMed] [Google Scholar]
- 16. Cormode D. P., Naha P. C., Fayad Z. A., Contrast Media Mol. Imaging 2014, 9, 37. [DOI] [PMC free article] [PubMed] [Google Scholar]
- 17. Hainfeld J., Ridwan S., Stanishevskiy F., Smilowitz H., Sci. Rep. 2020, 10, 15627. [DOI] [PMC free article] [PubMed] [Google Scholar]
- 18. Dong Y., Hajfathalian M., Maidment P., Hsu J., Naha P., Si‐Mohamed S., Breuilly M., Kim J., Chhour P., Douek P., Litt H., Cormode D., Sci. Rep. 2019, 9, 14912. [DOI] [PMC free article] [PubMed] [Google Scholar]
- 19. Shahbazi M. A., Faghfouri L., Ferreira M. P. A., Figueiredo P., Maleki H., Sefat F., Hirvonen J., Santos H. A., Chem. Soc. Rev. 2020, 49, 1253. [DOI] [PubMed] [Google Scholar]
- 20. Cheng Y., Zhang H., Chem. ‐ Eur. J. 2018, 24, 17405. [DOI] [PubMed] [Google Scholar]
- 21.a) Liao W., Lei P., Pan J., Zhang C., Sun X., Zhang X., Yu C., Sun S.‐K., Biomaterials 2019, 203, 1;. [DOI] [PubMed] [Google Scholar]; b) Li L., Lu Y., Jiang C., Zhu Y., Yang X., Hu X., Lin Z., Zhang Y., Peng M., Xia H., Mao C., Adv. Funct. Mater. 2018, 28, 1704623. [DOI] [PMC free article] [PubMed] [Google Scholar]
- 22. Fitzgerald P. F., Colborn R. E., Edic P. M., Lambert J. W., Torres A. S., Bonitatibus P. J., Yeh B. M., Radiology 2016, 278, 723. [DOI] [PMC free article] [PubMed] [Google Scholar]
- 23. Takahashi K., Murata S., Fukunaga K., Ohkohchi N., World J. Gastroenterol. 2013, 19, 5250. [DOI] [PMC free article] [PubMed] [Google Scholar]
- 24. Hu Z., Qin F., Gao S., Zhen Y., Huang D., Dong L., Am. J. Transl. Res. 2018, 10, 1012. [PMC free article] [PubMed] [Google Scholar]
- 25.a) Kim K. S., Hur W., Park S. J., Hong S. W., Choi J. E., Goh E. J., Yoon S. K., Hahn S. K., ACS Nano 2010, 4, 3005;. [DOI] [PubMed] [Google Scholar]; b) Li W., Zhou C., Fu Y., Chen T., Liu X., Zhang Z., Gong T., Acta Pharm. Sin. B 2020, 10, 693;. [DOI] [PMC free article] [PubMed] [Google Scholar]; c) Liang H., Li Z., Ren Z., Jia Q., Guo L., Li S., Zhang H., Hu S., Zhu D., Shen D., Yu Z., Cheng K., Nano Res. 2020, 13, 2197. [Google Scholar]
- 26. Lei P., An R., Yao S., Wang Q., Dong L., Xu X., Du K., Feng J., Zhang H., Adv. Mater. 2017, 29, 1700505. [DOI] [PubMed] [Google Scholar]
- 27. Jin Y., Ni D., Gao L., Meng X., Lv Y., Han F., Zhang H., Liu Y., Yao Z., Feng X., Bu W., Zhang J., Adv. Funct. Mater. 2018, 28, 1802656. [Google Scholar]
- 28. Zhang C., Liu X. Q., Sun H. N., Meng X. M., Bao Y. W., Zhang H. P., Pan F. M., Zhang C., Int. Immunopharmacol. 2018, 63, 183. [DOI] [PubMed] [Google Scholar]
- 29.a) Zhang K., Han X., Zhang Z., Zheng L., Hu Z., Yao Q., Cui H., Shu G., Si M., Li C., Shi Z., Chen T., Han Y., Chang Y., Yao Z., Han T., Hong W., Nat. Commun. 2017, 8, 144; [DOI] [PMC free article] [PubMed] [Google Scholar]; b) Ossipov D., Expert Opin. Drug Delivery 2010, 7, 681. [DOI] [PubMed] [Google Scholar]
- 30. Sun Z., Ng C. K. C., Squelch A., Quant. Imaging Med. Surg. 2019, 9, 6. [DOI] [PMC free article] [PubMed] [Google Scholar]
- 31. Mechlem K., Sellerer T., Viermetz M., Herzen J., Pfeiffer F., Phys. Med. Biol. 2020, 65, 065010. [DOI] [PubMed] [Google Scholar]
- 32. Swain R. J., Kemp S. J., Goldstraw P., Tetley T. D., Stevens M. M., Biophys. J. 2008, 95, 5978. [DOI] [PMC free article] [PubMed] [Google Scholar]
- 33. Wang Z., Sau S., Alsaab H. O., Iyer A. K., Nanomedicine 2018, 14, 1441. [DOI] [PMC free article] [PubMed] [Google Scholar]
- 34. Tomita K., Teratani T., Suzuki T., Shimizu M., Sato H., Narimatsu K., Okada Y., Kurihara C., Irie R., Yokoyama H., Shimamura K., Usui S., Ebinuma H., Saito H., Watanabe C., Komoto S., Kawaguchi A., Nagao S., Sugiyama K., Hokari R., Kanai T., Miura S., Hibi T., Hepatology 2014, 59, 154. [DOI] [PubMed] [Google Scholar]
Associated Data
This section collects any data citations, data availability statements, or supplementary materials included in this article.
Supplementary Materials
Supporting Information
Data Availability Statement
Research data are not shared.