

Abstract
COVID-19 can cause severe neurological symptoms, but the underlying pathophysiological mechanisms are unclear. Here, we interrogated the brain stems and olfactory bulbs in postmortem patients who had COVID-19 using imaging mass cytometry to understand the local immune response at a spatially resolved, high-dimensional, single-cell level and compared their immune map to non-COVID respiratory failure, multiple sclerosis, and control patients. We observed substantial immune activation in the central nervous system with pronounced neuropathology (astrocytosis, axonal damage, and blood-brain-barrier leakage) and detected viral antigen in ACE2-receptor-positive cells enriched in the vascular compartment. Microglial nodules and the perivascular compartment represented COVID-19-specific, microanatomic-immune niches with context-specific cellular interactions enriched for activated CD8+ T cells. Altered brain T-cell-microglial interactions were linked to clinical measures of systemic inflammation and disturbed hemostasis. This study identifies profound neuroinflammation with activation of innate and adaptive immune cells as correlates of COVID-19 neuropathology, with implications for potential therapeutic strategies.
Keywords: SARS-CoV-2, COVID-19, encephalopathy, brain autopsy, microglia, T cells, high-dimensional imaging, neuroinflammation, single-cell analysis, mass cytometry
Graphical abstract
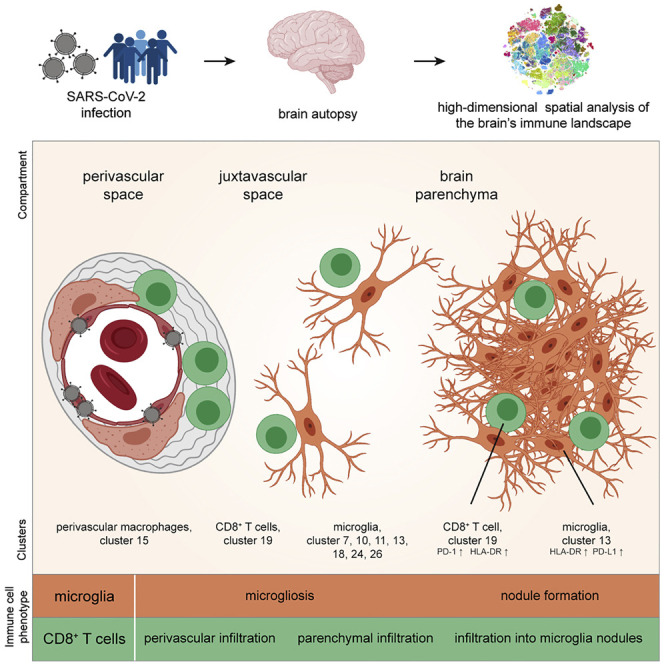
COVID-19 can cause severe neurological symptoms. By deep spatial analysis of postmortem brain tissue, Schwabenland et al. identify accumulation of distinct microglial and T cell subsets in microglial nodules and the perivasculature. They observe neuroinflammation with axonal damage, virus-associated perivascular inflammation, and compromised blood-brain barrier. This profound neuroinflammation highlights the need for better strategies against this COVID-19 CNS manifestation.
Introduction
COVID-19 due to SARS-CoV-2 is a multifaceted disease with multi-organ complications. Major complications include neurological symptoms that can occur during acute infection in up to 67% of patients but can also persist or even emerge after viral elimination (Helms et al., 2020; Mao et al., 2020; Varatharaj et al., 2020). A characteristic neurological symptom of COVID-19 is anosmia (the loss of the sense of smell), but neurological symptoms range from headache, fatigue, memory impairment, vomiting, and gait disorders to breathing difficulties and coma, suggesting involvement of several brain regions, such as the olfactory bulb but also infratentorial regions such as the medulla (Ellul et al., 2020). Thromboembolic events, including stroke, are reported to be a complication of COVID-19 but are unlikely to explain COVID-19 neurological symptoms in most cases. A recent report further points to microvascular pathology in COVID-19 brains (Lee et al., 2021). A possible central nervous system (CNS) entry mechanism described is olfactory transmucosal SARS-CoV-2 invasion, which may give access to the olfactory bulb (Cantuti-Castelvetri et al., 2020; Meinhardt et al., 2021), but neuroinvasion into cortical neurons has also been described (Song et al., 2021). SARS-CoV-2 has been detected in some brain tissue (Matschke et al., 2020; Puelles et al., 2020). The role of immune activation in COVID-19 brains is debated, based on differing observations from a few small case series (Kantonen et al., 2020; Matschke et al., 2020; Reichard et al., 2020; Schaller et al., 2020; Solomon et al., 2020; von Weyhern et al., 2020). Comprehensive data with detailed dissection of immune cell populations on a large collection of brains from COVID-19 patients are not currently available. Previous studies on peripheral immune functions in patients with COVID-19 indicate that pre-existing and induced SARS-CoV-2-specific T cell responses may mediate protection during infection; however, an immunotype with overtly strong CD4 T cell activation and expansion of plasmablasts is observed in patients with the highest NIH COVID-severity scales (Kuri-Cervantes et al., 2020; Mathew et al., 2020; Schulien et al., 2021; Sekine et al., 2020), suggesting that excessive immune responses can mediate severe disease courses.
Despite these insights, it is currently unclear whether these analyses in the peripheral blood reflect the immune responses in the tissues and which immune populations are involved in mediating organ pathology. Thus, to understand the cellular, immunological, and anatomical basis of COVID-19 in the brain, we performed a highly multiplexed spatial analysis of the adaptive and innate immune system in brain sections from 25 COVID-19 patients who succumbed to the disease, in comparison with (1) control patients who died of non-infectious, non-inflammatory, and non-neurological causes; (2) respiratory disease controls with histories of severe respiratory failure requiring extracorporeal membrane oxygenation (ECMO) therapy; and (3) patients with severe autoimmune CNS disease (multiple sclerosis [MS]). We used imaging mass cytometry (IMC), which allowed the simultaneous detection of several key immune populations, including disease-linked clusters of CD4 and CD8 T cells, and numerous myeloid and brain-specific innate immune populations, their cellular interactions, and their compartmentalization in distinct anatomical regions of the brain stem and the olfactory bulb. Spatial mapping revealed neuroinflammation with infiltration of distinct immune cell clusters, in particular, activated CD8 T cells and microgliosis-related cell clusters in most patients and frequent formation of microglial nodules as a hotspot for microglia-T-cell interactions. Viral antigen was associated with the vascular compartment and prominent innate and adaptive immune activation, but no widespread viral CNS infection was found. The detailed immune map of COVID-19 neuropathology provides a rationale for therapeutic avenues aiming to reduce neuroinflammation in patients with COVID-19.
Results
Highly multiplexed imaging of the brain microarchitecture by IMC indicates strong immune activation in patients with COVID-19
To understand the immune response in COVID-19-associated neuropathology, we performed highly multiplexed high-dimensional imaging using IMC in sections from patients who succumbed to COVID-19. We compared those with (1) control patients who died of non-infectious, non-inflammatory, and non-neurological reasons; (2) patients who died after respiratory failure, despite ECMO therapy; and (3) patients with a defined autoimmune, neuroinflammatory disease, MS (Figure 1 A). Diagnostic gold-standard immunohistochemistry (IHC) was used in all patients to assess cytotoxic T cell marker CD8 and myeloid-cell-marker-ionized calcium-binding adaptor molecule (Iba)1, which revealed significant CD8 T cell infiltration and an elevated number of parenchymal Iba1+ cells. The cells had a typical microglial morphology, expressed CD68 and the microglial marker TMEM119, indicating a robust microgliosis in the brain stem, which is in agreement with previous reports (Figures 1B and S1A; Matschke et al., 2020). Microgliosis occurred either diffusely, or with dense microglial clusters, which are referred to as microglia nodules. The observed CD8 immunoreactivity in 17 of 25 patients (68%) and pronounced microglia activation in 20 of 25 patients (80%) indicated classical neuroinflammation (Prinz and Priller, 2017) as a histopathological hallmark of COVID-19-related neuropathology.
Figure 1.

Highly multiplexed imaging mass cytometry analysis of COVID-19 brains reveals neuroinflammation
(A) Experimental workflow. Medulla oblongata tissue slices from patient autopsies with COVID-19 (n = 25), history of ECMO therapy (n = 5), or multiple sclerosis (n = 6); control patients (n = 5); and COVID-19 olfactory bulb tissue slices (n = 11) were analyzed by IHC and IMC.
(B) Exemplary visualization of corresponding COVID-19 medulla tissue by IHC (left) and IMC (right). The area of interest is magnified in the insert. Scale bars: 100 μm and 50 μm. Left: IHC for Iba1 (brown) and CD8 (pink), counterstained with hematoxylin (blue). Arrows indicate CD8+ T cells. Right: Iba1 (red), CD8 (green), collagen (light blue), CD163 (yellow), and histone H3 (blue) IMC data channels are visualized.
(C) Exemplary visualization of indicated marker expression IMC data from channels in the same area as (B). Scale bar: 50 μm.
(D) Manual cell counting of defined immune populations was performed on the IMC dataset and compared among control (black), ECMO (gray), COVID-19 (blue), and multiple sclerosis patients (purple). Bar graphs indicate means ± SEM.
(E) Immunohistochemical reaction for APP (brown), indicating axonal damage in control and COVID-19 medullae. Counterstaining with hematoxylin (blue). Scale bars: 100 μm; 10 μm in the inserts. Right: quantification of APP deposits is shown; bar graph indicates means ± SEM.
See also Figure S1.
However, because conventional IHC allows analysis of only a few markers, limiting insight into the fine composition of cellular phenotypes and immune cell subsets, we designed and validated a highly multiplexed IMC approach to comprehensively profile key brain immune and parenchymal cell populations. Tissue sections were immunolabeled with antibodies coupled to metal isotopes preloaded to polymers or directly coupled to cisplatin (Mei et al., 2016). Spatial expression data were obtained after tissue laser ablation at ~1 μm resolution and mass spectrometry analysis of metal labels. Resolution of IMC data was comparable to conventional IHC (Figure 1B), but the high-parametric information provided by this technique allowed deeper insights into the cellular composition in specific anatomical compartments, such as areas with dense microglial accumulation, known as microglial nodules, which are absent in healthy brain tissue (Prinz and Priller, 2017; Tay et al., 2017). Next, expression of markers for canonical lymphoid and myeloid immune populations, and parenchymal brain cells were assessed, together with markers of immune activation, function, and regulation (Figure 1C). Manual inspection of IMC data indicated a significant immune infiltration of the brain stem from patients with COVID-19 by CD8 T cells and (albeit, to a lesser degree) CD4 T cells along with few B cells (Figure 1D). This infiltration by adaptive immune cells, which was largely absent in control brains, occurred in the presence of increased numbers of Iba1+ cells as well as CD163+ perivascular macrophages (Figure 1D). Of note, the neuroinflammation with microgliosis and T cell infiltration in COVID-19 brains was significantly greater than that of patients who did not have COVID-19 but required ECMO therapy, and the degree of immune cell infiltration was only exceeded by comparison with patients who had long-term histories of active MS (Figure 1D; Table S1).
Given the profound immune activation in COVID-19 brains, we wondered whether that robust immune activation pattern in the brain stem was linked to tissue destruction and neuronal damage. Thus, we quantified amyloid precursor protein (APP) deposits in the brains of COVID-19 patients and controls. Patients with COVID-19 had more APP+ deposits, indicative of increased axonal damage (Figure 1E). Axonal pathology was further supported by apparent axonal rarefactions, visualized with Bielschowsky silver staining (Figure S1B). This damage occurred in the absence of apparent tissue necrosis, suggesting a specific, and likely directed, immune-mediated pathology.
Together, these analyses reveal neuroinflammation with significant immune infiltration, activation of the CNS endogenous innate immune system, and accompanying increased neuronal damage in the brains of patients with COVID-19.
Single-cell segmentation identifies enrichment of distinct brain immune-cell clusters in COVID-19
To understand the cellular phenotypes in the CNS during SARS-CoV-2 infection in greater detail, we used supervised machine learning to generate cell masks that allowed image segmentation using a reference pipeline adapted for better resolution of microglial cells (Berg et al., 2019; McQuin et al., 2018; Schapiro et al., 2017; Figure 2 A). We then extracted high-dimensional, single-cell-level data and clustered them using the PhenoGraph algorithm to identify the cellular composition across the entire cohort of patients (Figure 2A). PhenoGraph was chosen based on its robustness to identify even rare, but phenotypically distinct, populations (Levine et al., 2015). This clustering strategy identified 34 distinct cellular clusters in the IMC analysis based on the high-dimensional, segmented, single-cell data, which correlated with manual count analysis. The cluster designations will be used throughout the manuscript (Figures 2A and S2). Based on morphology and molecular expression signatures, we identified abundant clusters of stromal (clusters c1–c6, c9, c17, c23, c31, and c33), neuronal (c16 and c28), and astrocytic (c12, c22, and c30) cells, in agreement with the dominance of these cell types in the CNS (Figures 2B and S3A–S3C). Other clusters included cells with the typical expression of endothelial cell markers (e.g., CD34, c8). This analysis also identified multiple distinct immune clusters, such as several microglial clusters, with varying expression of Iba1 and markers of immune activation, and lysosomal function, such as human leukocyte antigen-DR isotype (HLA-DR) and CD68 in clusters c7, c10, c11, c13, c18, c24, and c26 as well as in subsets of other myeloid cells, i.e., CD163+CD204+ cell cluster c15, a typical phenotype of perivascular macrophages. Leukocyte clusters included CD3+ CD8 and CD3+ CD4 T cell subsets, CD3−GzmB+ cytotoxic cells, and plasma cells (clusters c19, c32, c29, and c34) (Figure 2B). Further insights into the heterogeneity of the myeloid cell compartment was gained through an extension panel, which also validated microglial cell clusters by expression of TMEM119 and P2YR12 as prototypical microglia markers (Prinz et al., 2021) in addition to Iba1 expression (Figure 2C). The spatial protein expression analysis was in line with greater expression by their respective mRNA in a cell-type atlas of bulk human microglial/myeloid populations (Figure S3D; Zhang et al., 2016). To understand changes in the brain immune landscape in COVID-19, we next visualized the immune cell clusters on a brain-immune map, generated via t-distributed stochastic neighbor embedding (t-SNE), and analyzed their abundance in patients and controls (Figures 2D–2F and S3C; Data S1). This approach revealed major changes in the immune cell composition in the brains of COVID-19-affected patients, which were qualitatively and quantitatively dominated by activated microglial and other myeloid cell clusters (e.g., c7, c13, c15, c25, and c26), together with adaptive immune cell infiltration (c19, c29, and c32). In contrast, fewer immune clusters were present in control brains, but, in particular, one quiescent microglial cluster (c18) was reduced in patients with COVID-19, suggesting a role for disturbed immune homeostasis within the microglial compartment. Taken together, our analyses identified distinct, adaptive and innate immune cell clusters in the brain during SARS-CoV-2 infection that were not present in control individuals.
Figure 2.

The molecular and cellular census of the CNS shows neuroinflammatory alterations in response to SARS-CoV-2 infection
(A) Segmentation of IMC images into cellular masks was performed on the entire dataset by supervised machine learning. Single-cell data extracted was clustered with PhenoGraph and visualized on a t-SNE map.
(B) Heatmap visualization of cluster marker expression. Normalized median marker expression after subtraction of background is shown. Clusters were annotated according to their expression pattern and spatial distribution; key expression features are indicated. A corresponding Z-score-normalized heatmap is shown in Figure S2B.
(C) Heatmap of myeloid cluster heterogeneity. Median marker intensity, distance-to-vessel, and microglia nodule index (see Figure 4) of myeloid clusters were determined in the extension cohort and are visualized in a hierarchically clustered column-normalized heatmap.
(D) t-SNE visualization of the brain immune map based on the immune cell clusters identified in (B).
(E) Immune cell cluster composition of COVID-19 and control patients is shown by stacked bar charts displaying mean counts per group.
(F) Brain immune landscape of COVID-19 (blue) and control patients (black) is shown as in (D).
See also Figures S2 and S3.
The cellular interactome identifies immune cell crosstalk at the perivascular compartment during COVID-19 neuroinflammation
We next wondered which immune clusters were differentially enriched or depleted in the CNS of patients with COVID-19. As expected based on the analysis above, comparison of high-dimensional clusters indicated a significant enrichment of the CD8 T cell cluster c19, CD4 T cell cluster c32, and perivascular macrophage cluster c15 across COVID-19 patients (Figure 3 A). Moreover, these data also revealed that COVID-19-associated neuroinflammation is linked to a significant expansion of microglial clusters (c7 and c24) in the brain stem (Figure 3A).
Figure 3.

Spatial profiling of the brain immune response in COVID-19 indicates localized and orchestrated adaptive immune infiltration
(A) High-dimensional annotated cell clusters were compared across patients and controls. Immune cell clusters with significantly different abundances in COVID-19 and control patients are shown by scattered dot plots with bar graphs indicating means ± SEM; each dot represents one patient.
(B) Spatial interactions between each pair of cell types in patients with COVID-19 were analyzed by permutation-based neighborhood analysis. The percentages of images with significant neighborhood interactions are displayed as a hierarchically clustered heatmap, ranging from −0.4 (avoidance) to +1 (interaction). Rows represent the neighborhood of a cell phenotype of interest. Columns indicate the enrichment or depletion of a cell in other neighborhoods.
(C) Cluster c19 spatial neighborhood interactions were determined in COVID-19 and control patients. Columns indicate significant enrichment or depletion of c19 cells in the vicinity of cells from clusters c1–c34.
(D) Distance of cluster c19 cells (blue dots) to the nearest collagen+ or CD34+ vessel was determined in COVID-19 brain sections and compared with a random distribution. The 25th, 50th, and 75th percentiles are depicted.
(E) CD8 T cell activation in the brains of patients with COVID-19. Cluster c19 cells were analyzed for markers of T cell activation, differentiation, exhaustion, and function. Absolute cell counts were compared among patient groups and visualized by boxplots; dots represent samples.
(F) CD8 T cells isolated from medulla, olfactory bulb, cortex, and regional lymph node of a deceased COVID-19 patient were analyzed by suspension-mode mass cytometry. CD8 T cell heterogeneity is shown on a t-SNE map; expression of indicated exhaustion markers is indicated by heatmap coloring. Frequencies are illustrated by bar graphs.
See also Figure S4.
The accumulation of the perivascular macrophage cluster c15 in patients with COVID-19 pointed toward vasculature-related inflammation as a potential driver of neuroinflammation. We, therefore, asked whether the accumulation of the other enriched immune populations was linked to their proximity to perivascular macrophages. Neighborhood analysis was performed, using an established bioinformatic approach, in which neighborhood interactions of each pair of cell clusters across the stained samples is systematically interrogated, and significant non-random interactions indicative of cellular organization are identified (Schapiro et al., 2017). As shown in Figure 3B, that analysis highlighted CD8 T cell cluster c19 cells as a closely interacting immune cell type of cluster c15 perivascular macrophages. Of note, this neighborhood pattern of cluster c19 cells was more significant in patients with COVID-19 compared with control patients (Figures 3C and S4). Because endothelial cell cluster c8 displayed similarly significant neighborhood relationships with cluster c15 and cluster c19 cells (Figure 3B), we speculated that most CD8 T cells were infiltrating at the vasculature. To test that hypothesis, we determined the distance of CD8 T cells from CD34+ or collagen+ vascular structures and compared that distance to a random distribution. That analysis, indeed, showed a vasculature-associated bias of infiltrating CD8 T cells (Figure 3D). However, despite the preferential accumulation near the vasculature, many CD8 T cells were located at distances exceeding 20 μm from vessels, suggesting additional microanatomical sites of CD8 T cell infiltration. In sum, these data demonstrate a clear link between CD8 T cell infiltration and vascular activation.
CD8+ T cells in COVID-19 brains display a dominant, activated effector phenotype
The enrichment of c19 in COVID-19 brains pointed to a central role of this immune cell population. To understand its degree of activation and effector function, we tested that cluster for expression of molecules informative about T cell differentiation, transcriptional programming, activation/exhaustion, and cytotoxicity. We observed a strong enrichment of cluster c19 cells expressing CD45RO, indicative of non-naive T cells (Figures 3E and S4C). Cluster c19 cells also highly expressed HLA-DR and ectoenzymes CD38 and CD39 as well as immune checkpoints PD-1 and Tim-3, together with transcription factors Eomes and TOX, a phenotype compatible with highly activated effector cells with a possible induction of features of T cell exhaustion (Bengsch et al., 2018). Despite expression of exhaustion markers by some CD8 T cells, we also observed elevated expression of granzyme B, indicating cytotoxic effector T cell function by some CD8 T cells (Figure 3E). Single-cell analysis by suspension-mode mass cytometry, indeed, revealed heterogeneity of CD8 T cell phenotypes in one COVID-19 brain and enrichment of CD8 T cells with exhausted phenotypes in the medulla and olfactory bulb but also detection of other perforin+ cytotoxic CD8 T cells without typical features of exhaustion (Figures 3F and S4D). In sum, the strong enrichment of CD8 T cells with clear activation signatures involving several immune checkpoints implicates this immune cell population as a central mediator of neuroinflammation during SARS-CoV-2 infection.
Immune activation in brains of patients with COVID-19 occurs at distinct anatomical niches
Despite the vascular bias of CD8 T cluster c19, not all cells in that cluster were associated with the perivascular space (Figure 3D). Indeed, we also observed additional COVID-19-specific neighborhood relationships of CD8 T cell cluster c19 with microglial clusters outside the perivascular region, in particular, with microglial cluster c13 (Figures 3B and 3C), suggesting additional anatomical immune niches with CD8-microglial crosstalk in the brain parenchyma.
To systematically dissect these anatomical regions, we generated automated maps based on collagen/CD34 and Iba1 expression, which provided information about the cellular distance to the vasculature and identified microglial hotspots (Figures 4 A–4D). These analyses highlighted microglial nodules with an accumulation of densely packed Iba1+ TMEM119+ HLA-DR+ microglial cells as an additional major site of infiltration by CD8 T cell cluster c19. The presence of microglial nodules was observed in the medulla of 36% (9 out of 25) of the patients with COVID-19, using IMC analysis, and in none of the control cases (Figure 4E). Microglia nodules differed from more scattered parenchymal microgliosis observed in most (19 out of 25; 76%) of the patients with COVID-19 (Figure 4E). Patients with microglial nodules had numerically higher APP deposits than patients without nodules, but that difference did not reach statistical significance in our cohort (Figure 4F). Together, these data identify the perivascular and microglial nodule compartments as key sites of COVID-19 immune responses. Clearly, however, some additional CD8 T cell cluster c19 cells could also be identified in the parenchyma. We wondered about the roles of these distinct anatomical compartments as places of local immune responses and performed a detailed cluster-composition analysis in the perivascular, juxtavascular, parenchymal, and microglial nodule compartments. That analysis revealed major differences in cluster composition (Figure 4G). Most changes in cluster composition were found in microglial nodules that were enriched in microglial clusters c11, c13, c18, c24, and CD8 T cell cluster c19 as well as CD4 T cell cluster c32 (Figures 4G and 4H). Among the microglial clusters, c13 dominated in microglial nodules, indicating context-specific roles for this microglial population. In contrast, the perivascular compartment displayed enrichment of endothelial cell cluster c8 and perivascular macrophage cluster c15, with some enrichment of CD8 T cell cluster c19, CD3−GzmB+ cell cluster c29, and CD4 T cell cluster c32 (Figures 4G and 4H). Differences in cluster composition increased with distance from the perivascular to juxtavascular parenchymal compartment, but their composition clearly differed from that observed in nodules (Figure 4G). These data illustrate differential immune activation consisting of defined cell clusters at distinct anatomical regions in COVID-19-associated brains and identifies the key adaptive and innate immune subsets in each compartment.
Figure 4.

Spatial analysis allocates immune cell clusters to distinct anatomical niches in the brains of patients with COVID-19
(A) The microglial nodule index calculated based on Iba1 signal across a 15-μm radius is visualized by color coding on a map (middle) of the representative image (left) also displayed in Figure 1B. The indicated area of interest is magnified (right).
(B) Microglia nodule index map (top panel), and respective IMC images visualizing Iba1 (red) and CD8 (green) (bottom panel) are shown for nodule regions in additional patients with COVID-19. Scale bar: 50 μm.
(C) Confocal immunofluorescence analysis of Iba1 (red), TMEM119 (yellow), HLA-DR (green), and DAPI (blue) in a microglial nodule area. Scale bars: 20 μm and 10 μm.
(D) Left: representative IMC image as in (A) showing CD8a (green), CD34 (purple), and collagen (blue) expression. Middle: vascular distance was estimated as distance to collagen+ or CD34+ structure. Proximity is indicated by increasing darkness, as indicated. Right: magnified insets of areas of interest, indicated by the boxes. Arrows, arrowheads, and stars indicate CD8 T cells distant to, next to, or inside vascular structures, respectively. Scale bars: 100 μm and 50 μm.
(E) Presence of microgliosis or microglial nodules in IMC images is visualized in pie charts for patients with COVID-19 and control patients. Severity of microglial alterations is indicated by color code.
(F) APP+ deposits were compared between control (black) and COVID-19 patients with or without microglia nodules, as in Figure 1E.
(G) Compartment cluster composition was evaluated for patients with COVID-19 and displayed as stacked bar graphs of cluster frequencies per anatomical compartment.
(H) Enrichment of individual clusters in anatomical compartments was visualized by an enrichment index (mean cluster frequency in given compartment/mean cluster frequency of total).
Microglial nodules represent microanatomically distinct immune-activation hotspots
We next tested whether these anatomical compartments had an effect on CD8 T cell activation and differentiation, represented by changes in cluster c19. Indeed, we observed differences in T cell activation in the different anatomical regions. In the perivascular, juxtavascular, or parenchymal compartment, cluster c19 cells were enriched for cells expressing PD-1, CD39, Tim-3, and Eomes; however, the highest expression of these markers of activated T cells with a possible bias toward exhaustion was found in microglial nodules (Figure 5 A). The significant activation signature in the microglial nodules was shared across different immune cell clusters in the nodules, as indicated by high HLA-DR expression across multiple microglial and T cell clusters in microglial nodules (c11, c13, c19, and c32) (Figures 4C, 5B, 5C, S5A, and S5B). Together, these results indicate the greatest activation of T cells and microglial clusters in microglial nodules but also differences in the expression of specific immune regulatory molecules between microglial nodules and other anatomical sites.
Figure 5.

Immune cell activation in anatomical compartments indicates pervasive inflammatory effect of microglial nodules on T cell activation and immune checkpoint expression
(A) Cluster c19 CD8 T cells were assessed across perivascular, juxtavascular, parenchymal, and nodule compartments for the fraction of PD-1+, CD39+, PD-1+CD39+, Tim3+, and Eomes+ cells.
(B) Spatial heatmap of HLA-DR signal intensities in segmented cells in a representative IMC image. Scale bar: 100 μm.
(C) Fluorescent IHC for Iba1 (green), HLA-DR (yellow), CD8a (red), and DAPI (blue) of a microglia nodule. Image shows a three-dimensional (3D) Z stack. Scale bars: 10 μm, 3 μm, and 1 μm. White arrows indicate HLA-DR expression at CD8+ cell contact sites.
(D) Spatial heatmap of PD-1 signal intensities as in (B)
(E) Cluster c19 CD8 T cells were analyzed in different anatomical compartments depending on presence or absence of microglial nodules. Fraction of PD-1+, CD39+, PD-1+CD39+, Eomes+, and HLA-DR+ cells is shown.
(F) Spatial heatmap of PD-L1 signal intensities as in (B)
(G and H) Fraction of Iba1+PD-L1+ cells (G) and of PD-L1-expressing CD45+Iba1+ cells (H) was compared across perivascular, juxtavascular, parenchymal, and nodule compartments.
(I) Confocal immunofluorescence analysis of Iba1 (green), PD-L1 (violet), CD8a (red), and DAPI (blue) of a microglia nodule. Image shows a Z stack. The scale bar: 10 μm. Boxplots with dots display the median with interquartile range (IQR) and upper and lower whiskers.
See also Figure S5.
Blood-brain-barrier dysfunction in COVID-19 brains is associated with cytotoxic CD8 T cell subsets enriched near the vasculature
Subclustering of CD8 T cell cluster c19 revealed further heterogeneity among CD8 T cells, as expected based on the differential T cell activation patterns tied to microanatomic sites. We identified 12 CD8 subclusters; among which, a CD8 subcluster (sc_c12) was dominant in nodules that displayed high expression of activation markers and immune checkpoints (PD-1, CD38, CD39, CD69, and HLA-DR), together with the co-expression of T-bet and GzmB, indicating cytotoxic effector function (Figures S5C–S5E). Other CD8 subclusters expressed varying degrees of activation, memory, and exhaustion markers. Interestingly, one cytotoxic GzmB+ CD8 subcluster (sc_c2) associated with the parenchyma had a typical phenotype of resident memory T cells, indicated by PD-1, CD103, and CD69 expression, and expressed less co-regulatory molecules compared with that of the nodule-associated T cell subcluster. Another activated GzmB+ CD8 subcluster (sc_c4) was identified among the most-abundant clusters in both microglial nodules and the perivascular compartment but lacked Tim-3, CD39, HLA-DR, or Tox in comparison with the dominant nodule cluster sc_c12. (Figures S5C–S5E). We speculated that the presence of cytotoxic CD8 T cells at the vasculature in the relative absence of co-regulatory immune checkpoints might indicate T-cell-mediated immunopathology. Indeed, investigation of blood-brain-barrier (BBB) integrity, by measuring fibrinogen extravasation, revealed significant vascular leakage in patients with COVID-19, exceeding the extravasation observed in control groups (Figure S5F). These data suggest that T-cell-mediated vascular immunopathology compromising the BBB contributes to the neuroinflammation in COVID-19 brains.
Microglial nodules have a pervasive effect on immune activation at distant sites
We next asked whether the presence of microglial nodules might orchestrate more severe neuroinflammation. High-resolution confocal microscopy confirmed elevated expression of HLA-DR on microglial cells, but also on T cells, with HLA-DR expression frequently localized to interfacing cell sections (Figure 5C). PD-1 was also highly expressed by cluster c19 CD8 T cells in microglial nodules (Figures 5A and 5D). We therefore analyzed the immune activation and co-regulatory molecule patterns of key immune cells in the different compartments depending on the presence or absence of microglial nodules. Cluster c19 analysis revealed greater PD-1, CD39, and HLA-DR expression in the parenchyma and greater PD-1/CD39 co-expression together with transcriptional regulator Eomes in the juxtavascular compartment in patients with microglial nodules. In those patients, we also observed greater Eomes expression on cluster c19 cells in the perivascular compartment (Figure 5E). Analysis of immune-checkpoint ligand PD-L1 revealed greater expression by microglial cells in nodules, although, interestingly, we also observed high expression of the corresponding immune-checkpoint receptor PD-1 on adjacent cells, suggesting active cellular crosstalk (Figures 5D and 5F–5I). Together, these data illustrate a pervasive, pro-inflammatory effect linked to the presence of microglial nodules across all brain compartments. They demonstrate significant differences in the anatomical immune regulation in COVID-19-affected brains and point toward a specific role for microglial nodules and CD8 T-cell-microglia crosstalk in orchestrating brain immune responses.
The immune infiltrate in COVID-19 brains differs from that of patients with ECMO therapy and multiple sclerosis
We wondered whether patterns of COVID-19 neuroinflammation differed from patients with severe histories of respiratory failure and ECMO therapy or patients with MS. Indeed, we observed major differences in cellular immune subsets between COVID-19 patients and ECMO or MS patients (Figures 6A and 6B). As expected, patients with MS had the greatest abundance of cellular immune infiltration, with high enrichment of T cell clusters as well as microglial- and myeloid-infiltrating clusters c11 and c20 (Figure 6A). These MS-linked microglial- and myeloid-infiltrating clusters varied phenotypically from microglial clusters c13 and c24 in their limited P2RY12 and TMEM119 expression (Figure 2C). The immune infiltrate in patients with COVID-19 did not show evidence of demyelination, in contrast to MS (Figure 6C). A distinguishing COVID-19-specific immune pattern was revealed by the strong enrichment of perivascular macrophage cluster c15 (Figure 6A), in agreement with the importance of the vascular compartment in patients with COVID-19 illustrated earlier (Figures 2, 3, and 4). Other notable differences included astrocyte clusters c12 and c22, which were enriched in COVID-19 (Figure 6A). In sum, these analyses illustrate specific COVID-19 immune-infiltration patterns, which highlight the role of the perivascular immune compartment and point to significant differences in microglial, myeloid, and T cell clusters in comparison with ECMO and MS disease controls.
Figure 6.

COVID-19 brains display disease-specific immune alterations
(A) Cluster distribution in patients with ECMO (gray), COVID-19 (green), and multiple sclerosis (purple). Enrichment of individual clusters in the patient groups is visualized (mean cluster frequency in specific patient group/mean cluster frequency in all three groups).
(B) Immune cell cluster composition in ECMO, COVID-19 and MS patients visualized as stacked bar charts indicating mean counts per group.
(C) Demyelination was assessed by Luxol-Fast-Blue (blue) and Periodic-Acid-Schiff (purple) staining. Representative images of a COVID-19 (upper panel) and a MS patient (lower panel) are shown. Scale bars: 200 μm and 100 μm. The asterisk indicates an area with marked demyelination.
COVID-19 neuroinflammation differs between the brain stem and olfactory bulb
We had initially focused our analysis on the brain stem because of the significant immune cell infiltration observed in conventional histopathology (Figure 1; Matschke et al., 2020). To understand whether the observed patterns of neuroinflammation were maintained across distances at other brain sites, in particular, the olfactory bulb as a possible entry site for SARS-CoV-2 (Meinhardt et al., 2021), we additionally assessed closely located brain stem and olfactory bulb sections in 12 patients. Corresponding pairs of brain-stem sections showed comparable immune infiltration patterns (Figure S5A). In contrast, sections from the olfactory bulb displayed significant differences in parenchymal and immune cell clusters (Figures S6A and S6B). Microglial clusters c7 and c21 were enriched in the brain stem, in contrast to microglial cluster c10 enriched in the olfactory bulb (Figure S6B). In our cohort, we observed reduced microglial nodule formation in the olfactory bulb compared with the brain stem, both by IMC and by additional IHC analysis, which covered larger brain areas (Figure S6C). Additional differences in cell subtypes were found for astrocytic clusters—although cluster c12 cells were primarily found in the medulla, cluster c22 cells enriched in the olfactory bulb (Figure S6B). Cluster c22 had greater per-cell protein expression of GFAP, in line with reactive astrogliosis in the olfactory bulb, and also displayed greater ACE2 expression (Figures 6A, 6D, and 6E). Despite these differences in cellular composition, key immune populations enriched in COVID-19 patients over controls in the brain stem, such as microglial cluster c13, perivascular macrophage cluster c15, CD8 T cell cluster c19, and CD4 cluster c32, were similarly abundant in the olfactory bulb, indicating a core COVID-19 immune pattern (Figure S6B).
SARS-CoV-spike-positive cells are enriched in the perivascular compartment
The evidence of vasculature-associated immune activation in COVID-19 brains raised the question of whether that reflected antigen-specific responses or represented bystander immune activation. To evaluate the viral spike protein in the olfactory bulb and brain stem of patients with COVID-19, we used an established anti-SARS-CoV-spike monoclonal antibody (Meinhardt et al., 2021), which we metal-labeled for IMC analysis and also used for IHC. The antibody reaction was positive in lung respiratory tissue from COVID-19 patients, with no staining in brains from ECMO and MS patients, indicating specificity (Figure S7A). IMC and IHC identified cells with viral protein in the cytoplasm, in particular, endothelial cells lining the vasculature, even though only a fraction of vessels stained positive for the spike protein (Figures 7A and 7B). Indeed, most SARS+ cells were found in close proximity to vessels, in line with the proximity of spike-positive cells to CD34, collagen, and ACE2 staining (Figures 7A–7C). In the olfactory bulb, we observed an increase in ACE2 expression in cluster c8 endothelial cells (Figure 7D). This finding correlated with the abundance of ACE2-expressing cluster c22 cells in the olfactory bulb (Figures 7D, 7E, and S6E). Moreover, cluster c8 cells in patients with COVID-19 were more frequently surrounded by collagen than were those in the control groups, suggesting increased vascular activation (Figure 7D). Despite some variation across test assays, samples with positive virus detection by IMC had a minimum of three other positive virus tests by different detection approaches (Figure 7E); however, direct detection of viral-protein-positive cells in the brain was, overall, an infrequent event. In sum, the presence of viral antigen was linked to vascular proximity and ACE2 expression and was correlated with the perivascular immune activation patterns of CD8 and CD4 T cells and myeloid- and microglial-cell subsets observed throughout the study.
Figure 7.

COVID-19 patients show disease-specific alterations in the central nervous system that correlate with blood chemistry
(A) IMC image with expression of SARS-CoV-spike protein (pink), collagen (light blue), ACE2 (yellow), CD34 (blue), GFAP (green), Iba1 (red), HLA-DR (orange), and histone H3 (blue), and an overlay graph depicts an olfactory bulb section from a patient with COVID-19. For each marker the whole image (left) and two areas of interest (right) are shown. Scale bars: 100 μm and 20 μm.
(B) The immunohistochemical reaction for SARS-CoV-spike protein (brown) and counterstaining with hematoxylin (blue) is shown at multiple magnifications in the medulla section of a patient with COVID-19. The arrowhead points to a SARS-CoV-spike-protein-positive endothelial cell. The asterisk indicates positive signal in the blood within the vessel lumen. Scale bars: 500 μm, 50 μm, or 20 μm.
(C) Violin plot visualizing the distance to the closest vessel (in μm) for all SARS-CoV+ cells. Each dot represents one cell; dotted lines indicate median and IQR.
(D) ACE-2 (left) and collagen (right) expression by endothelial cell cluster c8 was compared among patient groups and localizations. Fraction of positive cells is depicted per patient. Box and whiskers plot displays median and IQR.
(E) A total of nine different tests for viral protein or RNA were performed in the brains of patients with COVID-19. Results are shown in the heatmap (positive, red; negative, blue; gray; test was not performed).
(F) Spearman correlations are visualized between clinical parameters, neuroinflammatory features, and immune clusters from the deep spatial analysis. The heatmap coloring indicates the correlation coefficient; significance levels are indicated by asterisks, and boxes indicate an adjusted FDR < 0.05.
See also Figure S7.
Clinical parameters correlate with neuroinflammation in COVID-19 brains
Finally, we asked whether the observed neuroinflammatory changes observed in the patients’ brain tissues by our deep spatial profiling were linked to their clinical data (Figure 7F). There was a positive correlation between CD8 cluster c19 counts and serum C-reactive protein (CRP) concentration, whereas c19 counts were inversely correlated with international normalized ratio (INR) and with partial thromboplastin time (PTT), whereas microglial cluster c13 counts were negatively correlated with systemic hemoglobin concentration (Figures 7F and S7C–S7E). These findings provoke the speculation of a link between CD8-driven neuroinflammation and a systemic inflammatory pro-coagulant state, which, given our previous observations (Figure S5), could drive the disintegrity of the BBB in COVID-19. However, although mechanistic conclusions cannot be determined from these associations, the analysis indicates several clinical correlates of neuroinflammatory changes and immune-cell dynamics observed by deep spatial profiling.
In sum, these analyses highlight the vascular compartment as a key site of immune activation and virus detection in COVID-19 brains. Our analysis provides a framework for understanding the neurological comorbidities of SARS-CoV-2-infection, highlights specific cellular brain immune clusters involved in a COVID-19-specific neuroinflammatory pattern, and can help identify targets for immune intervention.
Discussion
Here, by performing highly multiplexed spatial analysis of the cellular composition and immunological phenotype of CNS tissue from patients who died with COVID-19, we identified profound immune activation, dominated by (1) specific CD8 T cell clusters affecting the vasculature, and (2) significant CD8 T-cell-microglial crosstalk in the parenchyma, which frequently manifests in the formation of microglial nodules. Virus protein could be identified in vascular brain structures, providing a possible foundation for the broad immune activation observed. The degree of neuroinflammation was variable, but major changes in microglial immune activation were observed in about 80% of patients. This immune infiltration was associated with considerable axonal and vascular pathology. This severe neuroinflammation, with profound neuronal damage in patients with COVID-19, might explain the high prevalence of transitory and long-lasting neurological comorbidities in SARS-CoV-2 infection.
Key findings of our study are the broad immune activation and anatomical compartmentalization of the altered brain immune responses in patients with COVID-19. Perivascular immune activation and infiltration by distinct CD8 and CD4 T cell clusters and expansion of disease-associated clusters of perivascular macrophages and microglial cells was a dominant feature found in most patients. Our analyses also revealed compartmentalized changes in brain immunity. In particular, the perivascular immune infiltrate differed quantitatively and qualitatively from the parenchymal and microglial nodule immune response and was associated with increased vascular leakage as an indication of compromised BBB. This microvascular injury is in line with a recent report of compromised vascular integrity in patients with COVID-19 (Lee et al., 2021). Microgliosis and microglial nodules were another key feature of COVID-19-related neuroinflammation and were observed in 76% and 36%–44% of patients, respectively. These pathologic features of microgliosis and microglial nodules, which can also be observed in other viral infections of the brain (Tröscher et al., 2019)—whereas a cerebrovascular inflammation pattern leading to microglial activation is also important in other brain infections and cerebral malaria (Medana et al., 1997)—were linked to increasing and pervasive immune activation. Cellular analysis of microglial nodules revealed high HLA-DR expression and significant T-cell-microglial crosstalk, which occurred together with significantly greater immune activation in the rest of the tissue in those patients, including the perivascular compartment, pointing to microglia nodules as hubs orchestrating neuroinflammation. The broad immune activation observed here was also tied to significant axonal damage observed in the patient cohort and provides a mechanistic basis for COVID-19 neurological manifestations.
In our study, we tested for expression of multiple targetable immune checkpoints, against which, therapeutic agents have been tested in clinical trials. These targets included PD-1, PD-L1, CD38, CD39, Tim-3, and TIGIT. PD-1 expression on SARS-CoV-2-specific CD8 T cells has also been identified in the peripheral blood with—at least partially—intact T cell function (Rha et al., 2021). Transcriptomes compatible with T cell exhaustion have been identified in the cerebral fluid of patients with COVID-19 and neurological symptoms (Heming et al., 2021). The PD-1/PD-L1 pathway is of particular interest because we could observe high expression of PD-1 on CD8 T cells, particularly in microglial nodules and PD-L1, on closely interacting microglial nodule clusters, suggesting active regulation of T cell responses in microglial nodules. However, it remains unclear whether boosting adaptive immunity by checkpoint-blockade antibodies would benefit disease outcomes because even greater T cell activation and immunopathology could be predicted, and in particular, PD-1-positive T cells were also observed at the vasculature and implicated in compromised BBB.
The broad neuroinflammation observed by deep spatial immune analysis in this study points to a profound CNS manifestation of COVID-19. In our large, prospectively collected, post-mortem cohort, 80% of patients displayed significant microglial alterations, 68% of patients had notable parenchymal CD8 infiltration, and 36%–44% of patients had the most severe phenotype, with profound microglial nodule formation. Moreover, axonal degeneration was typically found in the medulla of patients with COVID-19, but that neuropathology occurred in the absence of any necrosis. Perivascular leakage was prominent in the cohort we studied, and fit to the observed microvascular injury and compromised BBB. However, our results were unexpected in light of earlier assessments that mainly reported hypoxic changes and thromboembolic events and did not report significant encephalitis (Solomon et al., 2020). Of note, only 16% of the patients in our cohort had thromboembolic events that occurred in distant brain regions, suggesting that the profound neuroinflammation observed in the brain stem and olfactory bulb and the thromboembolic events are unrelated. Moreover, even when those samples were excluded from our studies, similar conclusions were reached (data not shown). The high prevalence of neuroinflammation during COVID-19 observed in our work highlights the need for better strategies targeting or preventing that inflammatory encephalitis.
Our study highlights the relevance of high-parametric, deeply resolved spatial analysis of brain immunity that is able to dissect the brain’s immune populations, such as distinct microglial clusters, and multiple brain compartments to understand the immunological and pathophysiological changes during COVID-19. The identification of disease-linked CD8 T-cell-microglial crosstalk that occurred in specific anatomical compartments and between defined cellular clusters that involve multiple immune checkpoints highlights possible cellular and molecular targets for therapeutic intervention.
Limitations of the study
This work is based on postmortem tissue samples obtained during the first wave of the COVID-19 pandemic in Germany. The broad neuroinflammation observed by deep spatial immune analysis in this study provides information about the CNS manifestation of COVID-19 and fits the high rate of neurologic symptoms during COVID-19 (Ellul et al., 2020). Because only patients who succumbed to disease and who did not have prospective complete neurological assessments could be analyzed, however, it remains to be determined whether the neuroinflammation observed in this study is also linked to specific neurological symptoms or whether they are also present in patients with neurological symptoms that recover.
The use of autopsy tissue samples in this study precluded functional studies, which would be important to determine the degree of functionality and the relevance of cellular interactions of several of the immune cell populations identified in this work. As a consequence, our interpretation of the data pointing to different interactions of microglia and T cell data, although highly suggestive because of our multi-modal and high-resolution methodological approaches, is based on surrogate markers of specific activation and differentiation states and not on functional assays. Thus, determining the precise roles and functional consequences of specific immune cell populations and targets as well as potential therapeutic consequences of immunomodulatory approaches will require additional controlled studies.
The detection of viral-antigen-positive cells by IMC would further benefit from more-sensitive assays. Although our study indicates viral antigen present in cells surrounding the brain vasculature, a main site of immune infiltration and pathology, it remains unclear whether that also provides information about antigen-specific responses or active replication. It also does not exclude a role for other viral CNS entry mechanisms, such as through the olfactory nerves, or for antigen-independent vascular activation. In sum, additional investigations of the role of SARS-CoV-2 neurotropism and immunoregulation will be required to better delineate the relationship among virus, antigen, neuroinflammation, and immunomodulation.
STAR★Methods
Key resources table
| REAGENT or RESOURCE | SOURCE | IDENTIFIER |
|---|---|---|
| Antibodies | ||
| Rabbit monoclonal anti-CD45 (D9M8I) XP antibody | Cell Signaling Technology | Cat# 13917; RRID: AB_2750898 |
| Rabbit polyclonal Anti-Human P2Y12 Antibody, Unconjugated | AnaSpec | Cat# 55042A; RRID: AB_2267540 |
| Mouse anti-human HLA-DR (TAL 1B5) -BSA and Azide free | Abcam | Cat# ab176408; RRID: AB_445401 |
| Recombinant rabbit monoclonal Anti-Iba1 antibody (EPR16588) - BSA and Azide free | Abcam | Cat# ab220815; RRID: AB_2636859 |
| Recombinant rabbit monoclonal anti-NCAM antibody (EPR2566) - BSA and Azide free | Abcam | Cat# ab214436; RRID: AB_2728815 |
| Purified mouse anti-human CD15 (SSEA-1) antibody, clone HI98 | BioLegend | Cat# 301902; RRID: AB_314194 |
| Rabbit anti-GFAP antibody (EPR1034Y) – BSA and Azide free | Abcam | Cat# ab68428; RRID: AB_1209224 |
| Rabbit monoclonal Anti-CD69 antibody (EPR21814) - BSA and Azide free | Abcam | Cat# ab234512; RRID: AB_2891140 |
| Rabbit monoclonal Anti-Olig2 antibody (EPR2673) - BSA and Azide free | Abcam | Cat# ab220796; RRID: AB_10861310 |
| Rabbit monoclonal Anti-CD39 antibody (EPR20627) - BSA and Azide free | Abcam | Cat# ab236038; RRID: AB_2889212 |
| Mouse monoclonal Anti-Human CD163/M130-147Sm | Fluidigm | Cat# 3147021D; RRID: AB_2892115 |
| Purified mouse anti-FOX3 (NeuN) Antibody (1B7) | BioLegend | Cat# 834501; RRID: AB_2564991 |
| Rabbit monoclonal Anti-CD103 antibody (EPR22590-27) - BSA and Azide free | Abcam | Cat# ab254201; RRID: AB_2891141 |
| PD-L1 (E1L3N) XP Rabbit Antibody | Cell Signaling Technology | Cat# 13684; RRID: AB_2687655 |
| Mouse monoclonal anti-ACE-2 Antibody (AC18F) | Novus Biologicals | Cat# NBP2-80035; RRID: AB_2891142 |
| Purified rat monoclonal anti-human ACE2 antibody, Clone A20069I | BioLegend | Cat# 375802; RRID: AB_2860959 |
| TCF1 (C63D9) Rabbit mAb antibody | Cell Signaling Technology | Cat# 2203; RRID: AB_2199302 |
| Rat monoclonal Anti-TOX antibody (NAN448B) | Abcam | Cat# ab237009; RRID: AB_2883984 |
| Rabbit monoclonal Anti-Human CD366/TIM-3 (D5D5R)-154Sm antibody | Fluidigm | Cat# 3154024D; RRID: AB_2811068 |
| Mouse FOXP3 Monoclonal Antibody (236A/E7), eBioscience | Thermo Fisher Scientific | Cat# 14-4777-82; RRID: AB_467556 |
| Rabbit monoclonal Anti-Human CD4 (EPR6855)-156Gd antibody | Fluidigm | Cat# 3156033D; RRID: AB_2811051 |
| Mouse monoclonal anti-TIGIT antibody (4A12) | Enzo Life Sciences | Cat# ENZ-ABS698-0100; RRID: AB_2891143 |
| Anti-TMEM119 antibody - C-terminal (ab185333) | Abcam | Cat# ab185333; RRID: AB_2687894 |
| Purified mouse monoclonal anti-IRF8 antibody, Clone 7G11A45 | BioLegend | Cat# 656501; RRID: AB_2562396 |
| Mouse monoclonal Anti-SARS spike glycoprotein antibody (3A2) - Coronavirus | Abcam | Cat# ab272420; RRID: AB_2891144 |
| Mouse monoclonal Anti-Human CD68 (KP1)-159Tb antibody | Fluidigm | Cat# 3159035D; RRID: AB_2810859 |
| Mouse monoclonal Anti-Human/Mouse Tbet (4B10)-160Gd antibody | Fluidigm | Cat# 3160010B; RRID: AB_2810251 |
| Mouse monoclonal Anti-Human CD20-161Dy antibody | Fluidigm | Cat# 3161029D; RRID: AB_2811016 |
| Mouse monoclonal Anti-Human CD8a (C8/144B)-162Dy antibody | Fluidigm | Cat# 3162034D; RRID: AB_2811053 |
| Mouse monoclonal EOMES Antibody (WD1928), eBioscience | Thermo Fisher Scientific | Cat# 14-4877-82; RRID: AB_2572882 |
| Rabbit monoclonal Anti-Arginase-1 (D4E3M)-164Dy antibody | Fluidigm | Cat# 3164027D; RRID: AB_2891145 |
| Rabbit monoclonal PD-1 (D4W2J) XP® antibody | Cell Signaling Technology | Cat# 86163; RRID: AB_2728833 |
| CD204 Mouse Monoclonal Antibody (J5HTR3), eBioscience | Thermo Fisher Scientific | Cat# 14-9054-82; RRID: AB_2662676 |
| Rabbit monoclonal Anti-Human Granzyme B (EPR20129-217)-167Er antibody | Fluidigm | Cat# 3167021D; RRID: AB_2811057 |
| Mouse monoclonal Anti-Ki-67 (B56)-168Er antibody | Fluidigm | Cat# 3168007B; RRID: AB_2800467 |
| Goat polyclonal Anti-Human Collagen Type I-169Tm antibody | Fluidigm | Cat# 3169023D; RRID: AB_2810857 |
| Rabbit polyclonal Anti-Human CD3 (C-Terminal)-170Er antibody | Fluidigm | Cat# 3170019D; RRID: AB_2811048 |
| Rabbit monoclonal Anti-Histone 3 (D1H2)-176Yb antibody | Fluidigm | Cat# 3176023D; RRID: AB_2811058 |
| Mouse monoclonal anti-CD56 Antibody (123C3) | Thermo Fisher Scientific | Cat# 07-5603; RRID: AB_2532931 |
| Rabbit monoclonal Recombinant Anti-CD38 antibody (EPR4106) - Low endotoxin, Azide free | Abcam | Cat# ab176886; RRID: AB_2864383 |
| Mouse monoclonal Anti-Human CD45RO (UCHL1)-173Yb antibody | Fluidigm | Cat# 3173016D; RRID: AB_2811052 |
| Rabbit monoclonal Anti-CD33 antibody [SP266] - BSA and Azide free | Abcam | Cat# ab238784; RRID: AB_2725782 |
| Rabbit monoclonal Recombinant Anti-CD34 antibody [EP373Y] - BSA and Azide free | Abcam | Cat# ab198395; RRID: AB_2889381 |
| Mouse monoclonal Purified anti-Myelin CNPase antibody, Clone SMI 91 | BioLegend | Cat# 836403; RRID: AB_2728547 |
| Histone H3 (D1H2) XP Rabbit mAb antibody | Cell Signaling Technology | Cat# 4499; RRID: AB_10544537 |
| Recombinant Anti-Iba1 antibody [EPR16588] (ab178846) | Abcam | Cat# ab178846; RRID: AB_2636859 |
| Monoclonal Mouse Anti-Human CD8 | DAKO | Cat# IR62361-2; RRID: AB_2892113 |
| Goat Anti-Rabbit IgG(H+L), Mouse/Human ads-BIOT antibody | SouthernBiotech | Cat# 4050-08; RRID: AB_2732896 |
| Goat Anti-Mouse IgG(H+L), Human ads-BIOT antibody | SouthernBiotech | Cat# 1031-08; RRID: AB_2794309 |
| Anti-APP A4 Antibody, a.a. 66-81 of APP, clone 22C11 | Millipore | Cat# MAB348; RRID: AB_9488 |
| Monoclonal Mouse Anti-Human CD68, Clone PG-M1 | DAKO | Cat # IR61361-2; RRID: AB_2892114 |
| Rabbit IBA1 antiserum | Synaptic Systems | Cat# 234 004; RRID: AB_2493179 |
| Monoclonal Mouse Anti-Human HLA-DP, DQ, DR Antigen, Clone CR3/43 | DAKO | Cat# M0775; RRID: AB_2313661 |
| Anti-CD8A polyclonal antibody | Atlas Antibodies | Cat# HPA037756; RRID: AB_2675648 |
| Anti-Collagen Type IV antibody | Millipore | Cat# AB769; RRID: AB_92262 |
| PD-L1 (E1L3N®) XP® Rabbit monoclonal antibody | Cell Signaling Technology | Cat # 13684T; RRID AB_2687655 |
| Purified anti-human CD8a antibody | Biolegend | Cat# 372902; RRID: AB_2650657 |
| Polyclonal Rabbit Anti-Human Fibrinogen/FITC | DAKO | Cat# F0111; RRID: AB_2335705 |
| Donkey anti-Guinea Pig, Alexa Fluor 488 | Jackson ImmunoResearch Labs | Cat# 706-545-148; RRID: AB_2340472 |
| Donkey anti-Mouse, Alexa Fluor 568 | Thermo Fisher Scientific | Cat# A10037; RRID: AB_2534013 |
| Donkey anti-Rabbit, Alexa Fluor 647 | Thermo Fisher Scientific | Cat# A-31573; RRID: AB_2536183 |
| Donkey anti-Goat, Alexa Fluor 647 | Thermo Fisher Scientific | Cat# A-21447; RRID: AB_2535864 |
| Mouse monoclonal purified anti-human CD45 antibody, Clone HI30 | BioLegend | Cat# 304002; RRID: AB_314390 |
| Mouse monoclonal purified anti-human CD4 antibody, Clone RPA-T4 | BioLegend | Cat# 300502; RRID: AB_314070 |
| Mouse monoclonal purified anti-human CD3 antibody, Clone UCHT1 | BioLegend | Cat# 300402; RRID: AB_314056 |
| Mouse monoclonal Purified anti-human CD39 antibody, Clone A1 | BioLegend | Cat# 328202; RRID: AB_940438 |
| Mouse monoclonal Purified anti-human IL-17A antibody, Clone BL168 | BioLegend | Cat# 512302; RRID: AB_961399 |
| Rat monoclonal Purified anti-human IL-6 (Maxpar(R) Ready) antibody, Clone MQ2-13A5 | BioLegend | Cat# 501115; RRID: AB_2562841 |
| Mouse monoclonal Purified anti-human CD8a antibody, Clone RPA-T8 | BioLegend | Cat# 301002; RRID: AB_314120 |
| Mouse monoclonal Purified anti-human CD19 antibody, Clone HIB19 | BioLegend | Cat# 302202; RRID: AB_314232 |
| Mouse monoclonal Purified anti-human IFN-gamma antibody, Clone B27 | BioLegend | Cat #506502; RRID: AB_315435 |
| Mouse monoclonal anti-Perforin antibody [B-D48] - Azide free | Abcam | Cat# ab47225; RRID: AB_2169084 |
| Mouse monoclonal Purified NA/LE Mouse Anti-Human CD152 (CTLA-4), Clone BNI3 | BD | Cat# 555850; RRID: AB_396173 |
| Mouse TNF alpha Monoclonal Antibody (MAb11), eBioscience | Thermo Fisher Scientific | Cat# 14-7349-85; RRID: AB_468490 |
| Mouse monoclonal Purified Mouse Anti-Ki-67, Clone B56 | BD | Cat# 556003; RRID: AB_396287 |
| Mouse monoclonal Purified anti-human CD45RA (Maxpar(R) Ready) antibody, Clone HI100 | BioLegend | Cat# 304143; RRID: AB_2562822 |
| Mouse monoclonal Purified anti-human CD197 (CCR7) antibody, Clone G043H7 | BioLegend | Cat# 353202; RRID: AB_10945157 |
| Rabbit monoclonal Anti-CD11b (EPR1344)-149Sm | Fluidigm | Cat# 3149028D; RRID: AB_2891189 |
| Mouse monoclonal Anti-Human IL-22 (22URTI)-150Nd antibody | Fluidigm | Cat# 3150007B; RRID: AB_2810972 |
| Mouse monoclonal Purified anti-human TCR Valpha24-Jalpha18 (iNKT cell) antibody, Clone 6B11 | BioLegend | Cat# 342902; RRID: AB_2229301 |
| Rat monoclonal IL-2 Monoclonal Antibody (MQ1-17H12), eBioscience | BioLegend | Cat# 14-7029-85; RRID: AB_468409 |
| Mouse monoclonal Anti-Human TCR Va7.2 (3C10)-153Eu | Fluidigm | Cat# 3153024B; RRID: AB_2891190 |
| Mouse monoclonal Human XCL1/Lymphotactin mAb (Clone 109001) antibody | R&D Systems | Cat# MAB6951; RRID: AB_2217055 |
| Mouse monoclonal Purified anti-human CD27 antibody, Clone O323 | BioLegend | Cat# 302802; RRID: AB_314294 |
| Mouse monoclonal Purified anti-human CD161 antibody, Clone HP-3G10 | BioLegend | Cat# 339902; RRID: AB_1501090 |
| Mouse monoclonal Purified anti-human CD274 (B7-H1, PD-L1) antibody, Clone 29E.2A3 | BioLegend | Cat# 329702; RRID: AB_940372 |
| Mouse monoclonal Purified anti-human CD279 (PD-1) antibody, Clone EH12.2H7 | BioLegend | Cat# 329902; RRID: AB_940488 |
| Mouse monoclonal Purified anti-human CD14 antibody, Clone M5E2 | BioLegend | Cat# 301802; RRID: AB_314184 |
| Mouse monoclonal Purified anti-human CD127 (IL-7Ralpha) antibody, Clone A019D5 | BioLegend | Cat# 351302; RRID: AB_10718513 |
| Mouse monoclonal Purified anti-human IL-21 antibody, Clone 3A3-N2 | BioLegend | Cat# 513002; RRID: AB_1027621 |
| Armenian hamster monoclonal Purified anti-human/mouse/rat CD278 (ICOS) antibody, Clone C398.4A | BioLegend | Cat#313502; RRID: AB_416326 |
| Mouse monoclonal anti-human SGK (Clone H-4) antibody | Santa Cruz Biotechnology | Cat# sc-28338; RRID: AB_2188272 |
| Rat monoclonal FOXP3 Monoclonal Antibody (PCH101), eBioscience | Thermo Fisher Scientific | Cat#14-4776-82; RRID: AB_467554 |
| Mouse monoclonal CD38 Monoclonal Antibody (HIT2), eBioscience | Thermo Fisher Scientific | Cat# 14-0389-82; RRID: AB_467222 |
| TOX Antibody, anti-human/mouse, APC, REAfinity | Miltenyi | Cat# 130-118-335; RRID: AB_2751485 |
| Mouse TIGIT Monoclonal Antibody (MBSA43), Functional Grade, eBioscience | Thermo Fisher Scientific | Cat# 16-9500-82; RRID: AB_10718831 |
| Rat Anti-CXCR5 Monoclonal Antibody, Unconjugated, Clone RF8B2 | BD Biosciences | Cat# 552032; RRID: AB_394324 |
| Mouse Anti-TCR gamma / delta Monoclonal Antibody, Unconjugated, Clone B1 | BD Biosciences | Cat# 55571; RRID: AB_396059 |
| Mouse monoclonal Purified anti-human CX3CR1 antibody, Clone K0124E1 | BioLegend | Cat# 355702; RRID: AB_2561726 |
| Mouse monoclonal Purified anti-human HLA-DR antibody, Clone L243 | BioLegend | Cat# 307602; RRID:AB_314680 |
| Rat monoclonal Purified anti-human IL-10 antibody, Clone JES3-9D7 | BioLegend | Cat# 501402; RRID: AB_315168 |
| Mouse monoclonal Purified anti-human CD103 (Integrin alphaE) antibody, Clone Ber-ACT8 | BioLegend | Cat# 350202; RRID: AB_10639864 |
| Anti-Human CD56 (NCAM16.2)-176Yb antibody | Fluidigm | Cat# 3176008B; RRID: AB_2661813 |
| Anti-Human CD16 (3G8)-209Bi antibody | Fluidigm | Cat# 3165001C; RRID: AB_2756431 |
| Biological samples | ||
| COVID-19 patient brain sections | University Medical Center Hamburg-Eppendorf | See Table S1 |
| Control patient brain sections | University of Freiburg | See Table S1 |
| ECMO patient brain sections | University of Freiburg | See Table S1 |
| Multiple sclerosis brain sections | University of Goettingen | See Table S1 |
| Chemicals, peptides, and recombinant proteins | ||
| 89-Yttrium (III) nitrate tetrahydrate | Sigma Aldrich | Cat# 217239-10G |
| 113-Indium (III) chloride | Trace Sciences Int. | N/A |
| 139-Lanthanum (III) chloride | Sigma Aldrich | Cat# 449230 |
| 157-Gadolinium (III) chloride | Trace Sciences Int. | N/A |
| EnVision Flex Target Retrieval Solution, High pH | Dako/Agilent | Cat# K800421-2 |
| SuperBlock (TBS) Blocking Buffer | Thermo Fisher Scientific | Cat# 37581 |
| Cell-ID Intercalator-Ir - 500 μM | Fluidigm | Cat# 201192B |
| Cell-ID Cisplatin-194Pt | Fluidigm | Cat# 201194 |
| 30% hydrogen peroxidase | Merck Millipore | Cat# 1.08597.1000 |
| Normal Goat Serum | SouthernBiotech | Cat# 0060-01 |
| Triton® X 100 | Carl Roth | Cat# 3051.4 |
| EnVision Flex Wash Buffer | DAKO | Cat# DM831 |
| Streptavidin-HRP | SouthernBiotech | Cat# 7100-05 |
| EnVision Flex DAB Chromogen | DAKO | Cat# DM827 |
| EnVision Flex Substrate Buffer | DAKO | Cat# DM823 |
| Streptavidin-AP | SouthernBiotech | Cat# 7100-04 |
| Monosan Permanent AP-Red Kit | Monosan | Cat# MON-APP185 |
| Hematoxylin solution modified acc. to Gill II for microscopy | Sigma Aldrich | Cat# 1051750500 |
| Kaiser’s glycerol gelatine phenol-free | Carl Roth | Cat# 6474.1 |
| Target Retrieval Solution, Citrate pH 6.1 (10x) | DAKO | Cat# S1699 |
| Vitro-Clud® mounting medium | R. Langenbrinck GmbH | Cat# 04-0001 |
| Albumin Fraction V (BSA) | Carl Roth | Cat# 8076.3 |
| DAPI | Carl Roth | Cat# 6335.2 |
| Mowiol 4-88 Reagent | MerckMillipore | Cat# 475904-100GM |
| 1,4-Diazabicyclo[2.2.2]octane (DABCO) | Sigma Aldrich | Cat# D2522-25G |
| Luxolechtblau MBS | Waldeck GmbH | Cat# 1B 389 |
| Lithium carbonate | Merck | Cat# 5671 |
| Periodic acid | Sigma | Cat# 77310-25G |
| Schiffs reagent | Merck | Cat# 1.09033.0500 |
| Silver nitrate | Carl Roth | Cat# 7908.2 |
| 32% ammonia solution | Merck | Cat# 1.05426.1000 |
| 37% formaldehyde solution | Carl Roth | Cat# CP10.1 |
| Citric acid | Merck | Cat# 1.00244.1000 |
| 65% nitric acid | Merck | Cat# 1.00443.1000 |
| Sodium thiosulphate | Merck | Cat# 1.06516.1000 |
| Maleimido-mono-amine-DOTA | Macrocyclics | Cat# B-272 |
| Foxp3 / Transcription Factor Staining Buffer Set | eBiosciences | Cat# 00-5523-00 |
| Critical commercial assays | ||
| Maxpar® X8 Antibody Labeling Kit | Fluidigm | Cat# 201151B |
| EnVision FLEX system | DAKO | Cat# K8000 |
| Deposited data | ||
| Mass cytometry data | This paper | FlowRepository ID FR-FCM-Z3SN; https://flowrepository.org/id/FR-FCM-Z3SN |
| Software and algorithms | ||
| CyTOF® Software v7.0, MCD viewer v1.0.560.6 | Fluidigm, Inc. | RRID: SCR_021055 |
| ImcSegmentationPipeline: A pixel classification based multiplexed image segmentation pipeline | https://github.com/BodenmillerGroup/ImcSegmentationPipeline | https://doi.org/10.5281/zenodo.3841961 |
| CellProfiler Image Analysis Software v3.1.9 and v4.0.4 | http://cellprofiler.org | https://doi.org/10.1186/gb-2006-7-10-r100; RRID: SCR_007358 |
| Ilastik v1.3.3 | http://ilastik.org/ | DOI: https://doi.org/10.1038/s41592-019-0582-9; RRID: SCR_015246 |
| histoCAT v1.76 | https://bodenmillergroup.github.io/histoCAT/ | DOI: https://doi.org/10.1038/nmeth.4391 |
| Cytometry analysis platform OMIQ | OMIQ, Inc. | https://www.omiq.ai/ |
| FlowJo v10 | TreeStar Inc. | RRID: SCR_008520https://www.flowjo.com/solutions/flowjo |
| GraphPad Prism v8 | GraphPad Software, Inc. | RRID: SCR_002798 |
| Nolan Lab bead-based Normalizer v0.3 | Nolan lab | https://github.com/nolanlab/bead-normalization/releases |
| R studio v3.6.3 | https://www.rstudio.com/ | RRID: SCR_001905 |
| pheatmap | https://cran.r-project.org/web/packages/pheatmap/index.html | RRID: SCR_016418 |
| BBmisc | https://cran.rstudio.com/web/packages/BBmisc/index.html | N/A |
| ggplot2 | https://cran.r-project.org/web/packages/ggplot2/index.html | RRID: SCR_014601 |
| ggpubr | https://CRAN.R-project.org/package=ggpubr | RRID: SCR_021139 |
| tidyverse | https://CRAN.R-project.org/package=tidyverse | RRID: SCR_019186 |
| forcats | https://cran.r-project.org/web/packages/forcats/index.html | N/A |
| dplyr | https://cran.r-project.org/web/packages/dplyr/index.html | RRID: SCR_016708 |
| janitor | https://cran.r-project.org/web/packages/janitor/index.html | N/A |
| Fiji v1.52p | http://fiji.sc | RRID: SCR_002285 |
| ImageJ | https://imagej.net/ | RRID: SCR_003070 |
| Imaris v9.6.0 | Bitplane; http://www.bitplane.com/imaris/imaris | RRID: SCR_007370 |
| Phenograph | As implemented in histoCAT v1.76 | RRID: SCR_016919 |
| opt-SNE | As implemented in OMIQ | DOI: https://doi.org/10.1038/s41467-019-13055-y |
| UMAP | As implemented in OMIQ | DOI: https://doi.org/10.21105/joss.00861; RRID: SCR_018217 |
| Other | ||
| ImmEdge Hydrophobic Barrier PAP Pen | Vector Laboratories | Cat# H-4000 |
| Decloaking Chamber NxGen | Biocare Medical | Cat# DC2012-220V |
Resource availability
Lead contact
Requests for further information resources, reagents and code should be directed to and will be fulfilled by the lead contact, Bertram Bengsch (bertram.bengsch@uniklinik-freiburg.de).
Materials availability
This study did not generate any new unique reagents.
Data and code availability
Imaging mass cytometry data are available from the lead contact. Mass cytometry data are available from FlowRepository (ID: FR-FCM-Z3SN; URL: https://flowrepository.org/id/FR-FCM-Z3SN). Additional Supplemental Items are available from Mendeley Data: https://doi.org/10.17632/yzrfb9cxyz.1.
Experimental model and subject details
Human FFPE brain sections from COVID-19 patients (n = 25), multiple sclerosis patients (n = 6), patients who received ECMO therapy (n = 5) and age-matched control patients (n = 5) were obtained postmortem. COVID-19 patients were autopsied between March 13 and April 24, 2020 upon order issued by the Hamburg public health authorities in accordance with section 25(4) of the German Infection Protection Act. Age, sex and clinical data of the patients are listed in Table S1. Tissue used for mass cytometry analysis of n = 1 COVID-19 patient (male, age = 54 years) was obtained postmortem in March 2021 and further processed as described in the Methods details. The analyses were performed with the approval of the Institutional Review Boards (Ethic Committee of the Albert-Ludwigs-University, Freiburg: 322/20, 10008/09; Ethics Committee of the Hamburg Chamber of Physicians: WF-051/20, PV7311). The study was performed in agreement with the principles expressed in the Declaration of Helsinki (2013).
Method details
Specimen collection
Formaldehyde-fixed paraffin-embedded (FFPE) CNS sections from 25 COVID-19 patients that had been tested positive for SARS-CoV-2 were obtained from autopsies that underwent routine neuropathological workup performed at the Institute of Legal Medicine of the University Medical - Center of Hamburg-Eppendorf during the first wave of the SARS-CoV-2 pandemic in Germany. As control groups, 5 aged-matched tissues from patients who died of non-infectious, non-inflammatory and non-neurological causes and 5 control tissues from patients with respiratory failure that required ECMO therapy prior to their deaths were obtained from autopsies performed at the Institute of Neuropathology, Freiburg prior to the pandemic. Tissues from 6 patients that died with severe multiple sclerosis were obtained from autopsies performed at the Institute of Neuropathology, University Hospital Goettingen.
Chromogenic immunohistochemistry
For initial deparaffinization, slides were incubated at 80°C for one hour, then deparaffinized in Xylene and in EnVision FLEX Target Retrieval Solution High pH cooking buffer for 20 minutes. Endogenous tissue peroxidase was blocked in 3% hydrogen peroxidase for 10 minutes. Samples were blocked with 10% normal goat serum plus 1% Triton X-100 in TRIS buffer (EnVision Flex Wash Buffer) for one hour. Double-immunolabelling for Iba1 and CD8 was performed sequentially: the sections were first incubated with Iba1 antibody (ab178846, 1:1000) in 10% NGS 1%, Triton X-100 in TRIS buffer overnight at +4°C. After washing three times with TRIS buffer, sections were incubated with a goat anti-rabbit secondary antibody (cat# 4050-08, 1:300) in 10% normal goat serum, 1% Triton X-100 in TRIS buffer for 45 minutes at RT. Three more washing steps were performed before incubating the sections with 0.1% streptavidin peroxidase in TRIS buffer for 45 minutes at RT. Specimens were rinsed three times with TRIS buffer. Next, slides were incubated with DAB solution: 1 drop EnVision Flex DAB Chromogen per 1 mL EnVision Flex Substrate Buffer. The incubation time was determined by continuous monitoring of the staining progress using a light microscope. Thereafter, the procedure was repeated for the immunohistochemical reaction for CD8 using a goat anti-mouse secondary antibody (cat# 1031-08, 1:200) and 0.1% streptavidin-AP. Permanent Red served as chromogen. Finally, the slides were counterstained with Gill’s Hematoxylin solution. Coverslips were mounted with Kaisers Glycerin-Gelatine. The immunohistochemical reaction against TMEM119 (ab185333, 1:250) was conducted using citrate buffer as antigen retrieval for 40 minutes. Images were taken with a 20x objective (Keyence, BioRevo). The immunohistochemical reactions for APP (cat# MAB348) were performed using the EnVision FLEX Target Retrieval Solution Low pH cooking buffer and the EnVision FLEX system. The immunohistochemical reaction for SARS-CoV spike glycoprotein (Cat# ab272420, 1:100) and CD68 (Cat# IR613, RTU) were conducted using the EnVision FLEX Target Retrieval Solution High pH and the EnVision FLEX system. Slides were counterstained with Gill’s Hematoxylin solution. Coverslips were mounted with xylene-based Vitro-Clud mounting medium. APP-positive deposits were counted manually using a light microscope (Olympus, BX41). Representative pictures were acquired with 4x, 10x, 20x and 40x objectives (Leica, DFC450).
Fluorescent immunohistochemistry
The slides were first deparaffinized in Xylene and cooked in EnVision FLEX Target Retrieval Solution High pH cooking buffer. 5% Bovine Serum Albumin and 0.5% Triton X-100 in PBS were used for blocking for one hour. The sections were incubated with the following primary antibodies (diluted in the blocking solution) overnight at +4°C: Iba1 (Cat# 234004, 1:500), HLA-DR (Cat# M0775, 1:400), CD8a (Cat# HPA037756-100UL, 1:500), TMEM119 (Cat# ab185333, 1:500), Collagen (Cat# AB769, 1:200, incubation for two nights), PD-L1 (Cat# 13684T, 1:200), CD8a (Cat# 372902, 1:100), Fibrinogen-FITC (Cat# F0111, 1:50). After three washes with PBS, the slides were incubated with the following secondary antibodies (diluted 1:500 in the blocking solution) for two hours: Donkey anti-Guinea Pig, Alexa Fluor 488 (Cat# 706-545-148), Donkey anti-Mouse, Alexa Fluor 568 (Cat# A-10037), Donkey anti-Rabbit, Alexa Fluor 647 (Cat# A-31573), Donkey anti-Goat, Alexa Fluor 647 (Cat# A-21447). Thereafter, DAPI (1:10’000) was added for 30 minutes. After washing three times with PBS, coverslips were mounted using Mowiol solution as mounting reagent. Mowiol solution was prepared as follows: 7.2 g Mowiol 4-88 Reagent was added to 18 g Glycerol and 18 mL distilled water and stirred overnight. After dissolving the mixture in 36 mL 0.2 M TRIS pH 8.5 at 53°C, the solution was centrifuged at 5000 rpm for 20 minutes. 0.1% 1,4-Diazabicyclo[2.2.2]octane added to the supernatant. The solution was stored at −20°C until use. The vascular leakage was scored by a neuropathologist who analyzed the whole section and graded the extent of extravascular fibrinogen signal on a linear scale from 0 (no extravascular signal) to 10 (representing the section with the strongest extravascular fibrinogen signal in all cohorts). Tissue with fresh bleedings was used as positive control. Z stacks were taken using a confocal microscope (Leica, SP8) and a 20x or 63x objective, respectively. A single plane of the z stack is shown in Figures 4C and S4F. Z stacks from Figures 5C and 5I were visualized using the IMARIS software.
Stainings
Luxol-Fast-Blue and Periodic-Acid-Schiff (LFB-PAS) stain: Paraffin slides were deparaffinized in xylene and placed in 96% and 90% ethanol for 5 minutes each. Luxol-Fast-Blue solution contained 1 g LFB in 1000 mL 96% ethanol and 5 mL 10% acidic acid. Sections were incubated in this solution overnight at 60°C. After rinsing them with 70% ethanol and distilled water, the sections were differenciated in 0.05% lithium carbonate in 70% ethanol. Periodic acid Schiff (PAS) reaction was conducted as follows: incubation in 1% periodic acid for 5 minutes, rinsing with distilled water, incubation with Schiffs reagent for 30 minutes, rinsing with tap water. Samples were counterstained with Gill’s Hematoxylin solution and placed in xylene. Vitro-Clud® served as mounting medium for coverslips. Bielschowsky silver impregnation was conducted as follows: after deparaffinization in Xylene, the slides were incubated in a 20% silver nitrate solution for 20 minutes. Thereafter, the slides were transferred to distilled water. 32% ammonia solution was added dropwise to the silver nitrate solution until the precipitates had dissolved. Two more drops were added. The sections were incubated in this solution for 15 minutes in the dark. After rinsing the specimens in 100 mL distilled water with 3 drops of 32% ammonia solution, 10 drops of developer solution were added to the silver nitrate solution. The developer solution was obtained by diluting 20 mL of 37% formaldehyde solution in 100 mL distilled water, supplemented with 0.5 g citric acid and 2 drops 65% nitric acid. The reaction was stopped by washing the slides in water, followed by a 2 minute incubation in a 2% sodium thiosulphate solution. After counterstaining with Gill’s Hematoxylin solution, Vitro-Clud® was used as mounting medium.
IMC antibody panel
A 38-marker IMC panel was designed including markers for the adaptive and innate immune system as well as brain-specific cell populations and stained in 25 COVID-19 patients and 5 control patients (Table S2). For extension experiments, the panel was updated to a 41-marker IMC panel including antibodies against SARS-CoV-spike protein and stained in 12 COVID-19 patients, 5 ECMO and 6 MS patients. Metal-labeled antibodies were either obtained pre-conjugated (Fluidigm) or labeled in-house by conjugating purified antibodies to lanthanide metals using the Maxpar X8 antibody labeling kit according to the manufacturer’s instructions. In addition, 89-Yttrium (III) nitrate tetrahydrate, 113-Indium (III) chloride and 157-Gadolinium (III) chloride were diluted in L-buffer to a 1M stock solution and further diluted to a 50 μM working solution for subsequent antibody labeling with the Maxpar X8 labeling kit. 20μL Cell-ID Cisplatin-194Pt were used for antibody labeling of anti-Histone H3 as described in Mei et al. (2016). Metal-conjugated antibodies were titrated and validated on brain, liver and tonsil tissue.
Sample preparation and staining for IMC
Tissue sections were incubated at 60°C for one hour, dewaxed in Xylene twice for 15 minutes and rehydrated in descending concentrations of ethanol (100% - 100% - 95% - 80%) for five minutes each, then rinsed in TBS (pH 7.6) for 10 minutes. Epitope retrieval was performed in a decloaking chamber with EnVision FLEX Target Retrieval Solution High pH for 30 minutes at 95°C. Slides were cooled down to room temperature for 20 minutes inside the buffer and 10 minutes in TBS. Tissue sections were encircled with a PAP pen and blocked for 45 minutes at room temperature using SuperBlock (TBS) Blocking Buffer. The sections were then stained with a mix of metal-labeled primary antibodies diluted in TBS with 0.5% BSA and incubated at 4°C overnight. Slides were rinsed in TBS-T (TBS supplemented with 0.2% Tween-20) twice and twice in TBS for 5 minutes each. Tissue sections were then stained with Iridium Cell-ID intercalator at 250nM in TBS for 30 minutes at room temperature. Slides were rinsed three times for 5 minutes in TBS, dipped in ddH2O for 5 s and air-dried. Slides were stored at room temperature until image acquisition.
Image acquisition
Tuning of the instrument was performed according to the manufacturer’s instructions. Regions of interest were determined using immunohistochemistry of subsequent sections. Tissue sections were laser-ablated spot-by-spot at 200 Hz resulting in a pixel size/resolution of 1 μm2. Preprocessing of the raw data was conducted using the CyTOF software v7.0. Image acquisition control was performed using MCD Viewer v1.0.560.6. A 1500 μm2 image per medulla or olfactory bulb section was acquired using a Hyperion Imaging System (Fluidigm). Due to small tissue sections in some olfactory bulb sections, multiple ROIs were obtained for those samples and data was analyzed after area normalization.
Data processing
MCD files containing the raw data were converted into tiff files and segmented into single cells using an unbiased, supervised analysis pipeline adapted from https://github.com/BodenmillerGroup/ImcSegmentationPipeline. Briefly, nucleated cells were segmented using a combination of Ilastik v1.3.3, CellProfiler v3.1.9 and v4.0.4 (McQuin et al., 2018, Berg et al., 2019). Pixels were classified into nuclei, cytoplasm and background using Ilastik. A probability map for the three classifications was generated and used to create a cell mask with CellProfiler. For combination with a subsequent Iba1 mask to improve segmentation of myeloid cells lacking a nucleus in the image plane, Iba1 signal was classified as background. A second cell mask was then created in CellProfiler using Iba1 expression levels. Both masks were combined in CellProfiler v4.0.4 through the combine objects module and prioritization of the probability mask objects. Data folders containing tiff images of the 41 markers, seven background channels and the combined cell mask were loaded into histoCAT v1.76 and mean marker intensity of pixels and spatial features of segmented cells were calculated. Further processing of single-cell level data was performed after data export to OMIQ or FlowJo.
Manual cell count
CD3+CD8+, CD3+CD4+, CD20+, parenchymal Iba1+ microglia cells and CD163+ perivascular macrophages were visualized in MCD viewer and counted manually by an expert neuropathologist. Due to an unfavorable signal-to-noise ratio in the 141-channel of one specimen, a MS patient was excluded from the manual parenchymal Iba1+ cell counting analysis.
Suspension mode mass cytometry acquisition
Tissue from a deceased patient with COVID-19 pneumonia and invasive ventilation was obtained postmortem. Immunohistochemistry for Iba1 revealed many microglia nodules within the medulla of this patient. Tissues were manually dissociated and filtered using a 40μm cell strainer. Mononuclear cells were isolated using density gradient centrifugation. Viable cells were counted and stained for mass cytometry. Mass cytometry reagents were obtained or generated by custom conjugation to isotope-loaded polymers using the Maxpar X8 antibody labeling kit. Mass cytometry antibodies used are shown in Table S3. Staining was performed after β2-microglobulin-based sample barcoding. Briefly, single-cell suspensions were pelleted, incubated with 20 μM Lanthanum-139-loaded maleimido-mono-amine-DOTA in PBS for 10min at RT for live/dead discrimination (LD). Cells were washed in staining buffer and resuspended in surface antibody cocktail, incubated for 30min at RT, washed twice in staining buffer, fixed and permeabilized using FoxP3 staining buffer set, and stained intracellularly for 60min at RT. Cells were further washed twice before fixation in 1.6% PFA solution containing 125nM Iridium overnight at 4°C. Prior to data acquisition on CyTOF Helios (Fluidigm), cells were washed twice in PBS and once in cell acquisition solution.
High-dimensional analysis of IMC data
Non-transformed data was normalized to 99th percentile for Phenograph clustering algorithm implemented in histoCAT that can identify even rare clusters of cells with distinct marker expression. Clustering was performed based on data from channels containing lineage and activation markers: Arg-1, CD103, CD163, CD204, CD20, CD33, CD34, CD38, CD39, CD3, CD45RO, CD45, CD4, CD68, CD8a, GFAP, GzmB, HLA-DR, Iba1, NeuN, PD-1, PD-L1, Tim-3 (Nearest Neighbors = 30, random seed = 2). Single-cell cluster data was integrated with expression data. Further processing of single-cell data was performed using OMIQ. Marker positivity was determined based on thresholds obtained by sampling background areas of the image in MCD viewer. Two samples were excluded from the study due to technical artifacts causing high Iba1 background signal. The total imaging mass cytometry dataset consisted of n = 246.350 cells.
t-SNE analysis
Visualization of the global single-cell landscape was performed in OMIQ after arcsinh transformation (factor 0.5) using Opt-SNE based on channels (Arg-1, CD103, CD163, CD204, CD20, CD33, CD34, CD38, CD39, CD3, CD45RO, CD45, CD4, CD68, CD69, CD8a, Collagen, GFAP, GzmB, HLA-DR, Iba1, NeuN, PD-1, PD-L1, Tim-3, Myelin-CNPase) (random seed 5849, max iterations 1000, opt-SNE end 5000, perplexity 30, theta 0.5 and verbosity 25). Phenograph clusters identified as immune cells were visualized on an opt-SNE calculated on immune cell markers (Arg-1, CD103, CD163, CD204, CD20, CD33, CD38, CD39, CD3, CD45RO, CD45, CD4, CD68, CD69, CD8a, GzmB, HLA-DR, Iba1PD-1, PD-L1, Tim-3) (random seed 4495, max iterations 1000, opt-SNE end 5000, perplexity 30, theta 0.5 and verbosity 25).
Subclustering of CD8 T cells
C19 cells from all patients (n = 3756) were loaded into OMIQ and re-clustered using Phenograph clustering algorithm with arcsinh transformed (factor 0.5) markers commonly expressed by CD8 T cells (CD103, CD38, CD39, CD45RO, CD69, Eomes, GzmB, HLA-DR, PD-1, Tbet, TCF-1, TOX, Tim-3) (k = 50, euclidean distance metric, Louvain seed = 5951).
UMAP analysis
Visualization of the CD8 T cell subclusters was performed using UMAP based on arcsinh transformed (factor 0.5) channels (CD103, CD38, CD39, CD45RO, CD69, Eomes, GzmB, HLA-DR, PD-1, Tbet, TCF-1, TOX, Tim-3) (15 nearest neighbors, minimum distance 0.4, euclidean distance metric, 200 epochs, random seed = 3880).
Heatmaps
Median signal intensity of marker expression in Phenograph clusters and CD8 T cell subclusters as well as the mean cluster frequency between patient cohorts and CNS localizations were determined in OMIQ and visualized in R studio using the Pheatmap package. For heatmaps shown in Figures 2B and 2C, background signal (determined by sampling negative areas of the image) was subtracted and the data was normalized to values between 0 and 1 in R studio with BBmisc package normalize function. Corresponding heatmaps to Figure 2B and a heatmap of CD8 T cell subclusters visualizing the z-score of median marker expression are shown in Figures S3B and S5E. Heatmap visualization of correlations between clinical and high-dimensional data of patients in Figure 7F was conducted in R studio using corrplot and RColorBrewer packages.
Cluster compositions (stacked bar graphs)
Clusters were gated on patients and counts were exported from OMIQ. The cluster composition between patient groups was visualized using the ggplot2 stacked bar graph function in R studio.
Neighborhood analysis
Spatial cellular interaction patterns were tested by neighborhood analysis as implemented in histoCAT. Briefly, it was examined per image whether a cell of a certain Phenograph cluster was located significantly (p < 0.05) more frequently in close proximity (4 pixel) to a cell of another cell cluster than expected by a random distribution of cells. The results for each cluster pair were summarized and visualized in a heatmap using R studio Pheatmap package. Rows represent the neighborhood of a cell phenotype of interest whereas columns indicate the enrichment or depletion of a cell in other neighborhoods.
Distance to vasculature of CD8 T cells
Distance to vasculature was assessed for all cluster c19 cells and a violin plot was generated using GraphPad Prism 8. Based on the calculations of the vascular proximity map, a random distribution of cells was generated by plotting the distances of all pixels of the images.
Vascular proximity map
FIJI, a distribution of ImageJ, was used for the calculation of the proximity of each pixel to the closest collagen- or CD34-positive structure above background threshold. The values for all 2.25 million pixels per image were obtained and plotted with ggplot2 function in R studio.
Microglia nodule index map
The calculation of the microglia nodule index map was performed in a similar way to the vascular proximity map. The starting point was the signal in the 141Pr-Iba1 channel. The 141Pr-Iba1-positive pixels were measured in a radius of 15 μm and put in relation to the total area. The values were calculated for all 2.25 million pixels in the image. The map was again visualized using ggplot2 in R studio.
Microglia nodule and microgliosis quantification and pie chart
The composition of the cohort was visualized based on the criteria of microgliosis (moderate microgliosis with > 80 microglia cells per mm2 and severe microgliosis > 160 cells per mm2) and the presence or absence of microglia nodules.
CNS compartments
Distances to vasculature inferred by distance to nearest collagen- or CD34- expressing pixel and microglia nodule index were used to identify 4 compartments: Microglia nodules (nodule index ≥ 0.5), perivascular (nodule index < 0.5, distance to vasculature < 5 μm), juxtavascular (nodule index < 0.5, distance to collagen-I ≥ 5 μm and ≤ 20 μm), parenchymal (nodule index < 0.5, distance to collagen-I > 20 μm).
Cluster enrichment scores
Cluster enrichment was determined by comparing the cluster frequency in a given compartment (Figure 4H) or cohort (Figure 6A) or CNS region (Figure S6B) to the cluster frequency in the combined respective dataset corrected for differences in area (in some samples in Figure S6B). The frequencies were determined using mean cluster counts in the compartments, cohort or CNS region. In Figure S6B, the ratio between the mean cluster counts in the olfactory bulb and the mean cluster counts in the medulla was visualized on a log2 scale.
Suspension mode mass cytometry analysis
Bead-based normalization of CyTOF data was performed using the Nolan lab normalizer prior to manual sample debarcoding. FCS files were further analyzed by commercial software FlowJo v10, and OMIQ. Live singlet CD45+CD3+CD19-CD8+ T cells were gated and optSNE (1000 iterations, perplexity 30, theta 0.5, random seed 9506, verbosity 25) was performed on information from CD39, CD127, ICOS, SGK1, FoxP3, CD38, TOX, CXCR5, CD27, CD161, PDL1, PD1, Eomes, CD103, Perforin, CTLA-4, CCR7, CD45RA, TIGIT, CX3CR1, HLA-DR, CD56 channels. Data is presented by heatmap coloring of individual channels on the tSNE dot plot. Frequency of exhaustion marker expression was obtained after gating in FlowJo.
Quantification and statistical analysis
Statistical analyses and visualizations were performed using GraphPad Prism 8. Differences in cell counts of clusters and cell populations as well as APP density and fibrinogen scoring between COVID-19 and control patients in Figures 1D, 1E, 3A, 3E, 4C, 5F, and 6B were analyzed by t tests with Welch’s correction. Frequencies of cell populations and APP deposits between different CNS compartments or patient groups in Figures 4F, 5A, 5E, 5G, 5H, and 7D and GFAP+ pixels in Figure S6D were analyzed by Mann-Whitney-U tests. Comparison of MSI of GFAP in Figure S6D and frequencies of ACE2+ cells of astrocyte clusters c12 and c22 in Figure S6E were analyzed by Wilcoxon signed-rank tests. Differences in cluster counts between COVID-19, ECMO and MS patients in Figure 6A were determined by ordinary one-way ANOVA tests for each cluster. Further statistical details for each plot can be found in the corresponding figure legend.
For the correlations between clinical and high-dimensional data shown as a matrix in Figure 7F the pairwise correlation was determined using spearman tests and the significance of the correlation was determined by fisher’s exact test using ggplot2, tidyverse, ggpubr, forcats, dplyr and janitor packages. Correlations between CRP, Quick and aPTT with c19 cell count in Figures S7C–S7E were determined using the ggscatter function of the ggpubr package in R studio.
Throughout the manuscript ∗ indicates p < 0.05, ∗∗ p < 0.01, ∗∗∗ p < 0.001 and ∗∗∗∗ p < 0.0001.
Acknowledgments
This project was supported by the German Research Foundation (DFG) (SFB992, SFB1160, SFB/TRR167, SFB/TRR179, CIBSS-EXC-2189 project 390939984, IMM-PACT 413517907, ME-3644/5-1 to H.E.M., BE-5496/5-1 to B.B., and the Reinhart-Kosellek grant and Gottfried Wilhelm Leibniz prize to M.P.), research funds from the Ministry for Science, Research and Art of Baden-Wuerttemberg dedicated to “COVID-19 research” and “neuroinflammation,” and the Sobek prize to M.P. was further supported by the Ernst-Jung Foundation and the . DEFEAT PANDEMIcs project by the German Federal Ministry of Education and Research (BMBF). Graphical abstractions were created using BioRender.com. We thank M. Haeussler for help with informative RNA sequencing (RNA-seq) datasets. We thank E. Barleon, M. Ditter, and S. Hirner for excellent technical assistance.
Author contributions
Conceptualization, M.P. and B.B.; methodology, H.S., M.S., and B.B.; algorithmic analysis, H.S., M.S., J.T., and L.M.; validation, H.S., M.S., P.B., M.P., and B.B.; formal analysis, H.S., M.S., and M.G.; investigation – tissue preparation, M.S., J.M., K.P., and C.S.; investigation – experiments and data acquisition, M.S., H.S., S.K., M.S.L., A.E.S., and J.M.; investigation – patient data, M.S., N.G., A.F., and B.O.; resources, H.E.M., T. Blank, C.N.-H., M.H., R.T., M.G., A.B., J.S.-R., K.-P.K., T. Boettler., M.P., and B.B.; writing – original draft, M.P. and B.B.; visualization, M.S. and H.S.; supervision, M.P. and B.B.; funding acquisition, M.P. and B.B.
Declaration of interests
The authors declare no competing interests.
Published: June 9, 2021
Footnotes
Supplemental information can be found online at https://doi.org/10.1016/j.immuni.2021.06.002.
Supplemental information
References
- Bengsch B., Ohtani T., Khan O., Setty M., Manne S., O’Brien S., Gherardini P.F., Herati R.S., Huang A.C., Chang K.M., et al. Epigenomic-guided mass cytometry profiling reveals disease-specific features of exhausted CD8 T cells. Immunity. 2018;48:1029–1045.e5. doi: 10.1016/j.immuni.2018.04.026. [DOI] [PMC free article] [PubMed] [Google Scholar]
- Berg S., Kutra D., Kroeger T., Straehle C.N., Kausler B.X., Haubold C., Schiegg M., Ales J., Beier T., Rudy M., et al. ilastik: interactive machine learning for (bio)image analysis. Nat. Methods. 2019;16:1226–1232. doi: 10.1038/s41592-019-0582-9. [DOI] [PubMed] [Google Scholar]
- Cantuti-Castelvetri L., Ojha R., Pedro L.D., Djannatian M., Franz J., Kuivanen S., van der Meer F., Kallio K., Kaya T., Anastasina M., et al. Neuropilin-1 facilitates SARS-CoV-2 cell entry and infectivity. Science. 2020;370:856–860. doi: 10.1126/science.abd2985. [DOI] [PMC free article] [PubMed] [Google Scholar]
- Ellul M.A., Benjamin L., Singh B., Lant S., Michael B.D., Easton A., Kneen R., Defres S., Sejvar J., Solomon T. Neurological associations of COVID-19. Lancet Neurol. 2020;19:767–783. doi: 10.1016/S1474-4422(20)30221-0. [DOI] [PMC free article] [PubMed] [Google Scholar]
- Helms J., Kremer S., Merdji H., Clere-Jehl R., Schenck M., Kummerlen C., Collange O., Boulay C., Fafi-Kremer S., Ohana M., et al. Neurologic features in severe SARS-CoV-2 infection. N. Engl. J. Med. 2020;382:2268–2270. doi: 10.1056/NEJMc2008597. [DOI] [PMC free article] [PubMed] [Google Scholar]
- Heming M., Li X., Räuber S., Mausberg A.K., Börsch A.L., Hartlehnert M., Singhal A., Lu I.N., Fleischer M., Szepanowski F., et al. Neurological manifestations of COVID-19 feature t cell exhaustion and dedifferentiated monocytes in cerebrospinal fluid. Immunity. 2021;54:164–175.e6. doi: 10.1016/j.immuni.2020.12.011. [DOI] [PMC free article] [PubMed] [Google Scholar]
- Kantonen J., Mahzabin S., Mäyränpää M.I., Tynninen O., Paetau A., Andersson N., Sajantila A., Vapalahti O., Carpén O., Kekäläinen E., et al. Neuropathologic features of four autopsied COVID-19 patients. Brain Pathol. 2020;30:1012–1016. doi: 10.1111/bpa.12889. [DOI] [PMC free article] [PubMed] [Google Scholar]
- Kuri-Cervantes L., Pampena M.B., Meng W., Rosenfeld A.M., Ittner C.A.G., Weisman A.R., Agyekum R.S., Mathew D., Baxter A.E., Vella L.A., et al. Comprehensive mapping of immune perturbations associated with severe COVID-19. Sci. Immunol. 2020;5:eabd7114. doi: 10.1126/sciimmunol.abd7114. [DOI] [PMC free article] [PubMed] [Google Scholar]
- Lee M.H., Perl D.P., Nair G., Li W., Maric D., Murray H., Dodd S.J., Koretsky A.P., Watts J.A., Cheung V., et al. Microvascular injury in the brains of patients with covid-19. N. Engl. J. Med. 2021;384:481–483. doi: 10.1056/NEJMc2033369. [DOI] [PMC free article] [PubMed] [Google Scholar]
- Levine J.H., Simonds E.F., Bendall S.C., Davis K.L., Amir A.D., Tadmor M.D., Litvin O., Fienberg H.G., Jager A., Zunder E.R., et al. Data-driven phenotypic dissection of aml reveals progenitor-like cells that correlate with prognosis. Cell. 2015;162:184–197. doi: 10.1016/j.cell.2015.05.047. [DOI] [PMC free article] [PubMed] [Google Scholar]
- Mao L., Jin H., Wang M., Hu Y., Chen S., He Q., Chang J., Hong C., Zhou Y., Wang D., et al. Neurologic manifestations of hospitalized patients with coronavirus disease 2019 in Wuhan, China. JAMA Neurol. 2020;77:683–690. doi: 10.1001/jamaneurol.2020.1127. [DOI] [PMC free article] [PubMed] [Google Scholar]
- Mathew D., Giles J.R., Baxter A.E., Oldridge D.A., Greenplate A.R., Wu J.E., Alanio C., Kuri-Cervantes L., Pampena M.B., D’Andrea K., et al. UPenn COVID Processing Unit Deep immune profiling of COVID-19 patients reveals distinct immunotypes with therapeutic implications. Science. 2020;369:eabc8511. doi: 10.1126/science.abc8511. [DOI] [PMC free article] [PubMed] [Google Scholar]
- Matschke J., Lütgehetmann M., Hagel C., Sperhake J.P., Schröder A.S., Edler C., Mushumba H., Fitzek A., Allweiss L., Dandri M., et al. Neuropathology of patients with COVID-19 in Germany: a post-mortem case series. Lancet Neurol. 2020;19:919–929. doi: 10.1016/S1474-4422(20)30308-2. [DOI] [PMC free article] [PubMed] [Google Scholar]
- McQuin C., Goodman A., Chernyshev V., Kamentsky L., Cimini B.A., Karhohs K.W., Doan M., Ding L., Rafelski S.M., Thirstrup D., et al. CellProfiler 3.0: next-generation image processing for biology. PLoS Biol. 2018;16:e2005970. doi: 10.1371/journal.pbio.2005970. [DOI] [PMC free article] [PubMed] [Google Scholar]
- Medana I.M., Hunt N.H., Chan-Ling T. Early activation of microglia in the pathogenesis of fatal murine cerebral malaria. Glia. 1997;19:91–103. doi: 10.1002/(sici)1098-1136(199702)19:2<91::aid-glia1>3.0.co;2-c. [DOI] [PubMed] [Google Scholar]
- Mei H.E., Leipold M.D., Maecker H.T. Platinum-conjugated antibodies for application in mass cytometry. Cytometry A. 2016;89:292–300. doi: 10.1002/cyto.a.22778. [DOI] [PubMed] [Google Scholar]
- Meinhardt J., Radke J., Dittmayer C., Franz J., Thomas C., Mothes R., Laue M., Schneider J., Brunink S., Greuel S., et al. Olfactory transmucosal SARS-CoV-2 invasion as a port of central nervous system entry in individuals with COVID-19. Nat. Neurosci. 2021;24:168–175. doi: 10.1038/s41593-020-00758-5. [DOI] [PubMed] [Google Scholar]
- Prinz M., Masuda T., Wheeler M.A., Quintana F.J. Microglia and central nervous system-associated macrophages-from origin to disease modulation. Annu. Rev. Immunol. 2021;39:251–277. doi: 10.1146/annurev-immunol-093019-110159. [DOI] [PMC free article] [PubMed] [Google Scholar]
- Prinz M., Priller J. The role of peripheral immune cells in the CNS in steady state and disease. Nat. Neurosci. 2017;20:136–144. doi: 10.1038/nn.4475. [DOI] [PubMed] [Google Scholar]
- Puelles V.G., Lütgehetmann M., Lindenmeyer M.T., Sperhake J.P., Wong M.N., Allweiss L., Chilla S., Heinemann A., Wanner N., Liu S., et al. Multiorgan and renal tropism of SARS-CoV-2. N. Engl. J. Med. 2020;383:590–592. doi: 10.1056/NEJMc2011400. [DOI] [PMC free article] [PubMed] [Google Scholar]
- Reichard R.R., Kashani K.B., Boire N.A., Constantopoulos E., Guo Y., Lucchinetti C.F. Neuropathology of COVID-19: a spectrum of vascular and acute disseminated encephalomyelitis (ADEM)-like pathology. Acta Neuropathol. 2020;140:1–6. doi: 10.1007/s00401-020-02166-2. [DOI] [PMC free article] [PubMed] [Google Scholar]
- Rha M.S., Jeong H.W., Ko J.H., Choi S.J., Seo I.H., Lee J.S., Sa M., Kim A.R., Joo E.J., Ahn J.Y., et al. PD-1-expressing SARS-CoV-2-specific CD8+ T cells are not exhausted, but functional in patients with COVID-19. Immunity. 2021;54:44–52.e3. doi: 10.1016/j.immuni.2020.12.002. [DOI] [PMC free article] [PubMed] [Google Scholar]
- Schaller T., Hirschbuhl K., Burkhardt K., Braun G., Trepel M., Markl B., Claus R. Postmortem examination of patients with COVID-19. JAMA. 2020;323:2518–2520. doi: 10.1001/jama.2020.8907. [DOI] [PMC free article] [PubMed] [Google Scholar]
- Schapiro D., Jackson H.W., Raghuraman S., Fischer J.R., Zanotelli V.R.T., Schulz D., Giesen C., Catena R., Varga Z., Bodenmiller B. histoCAT: analysis of cell phenotypes and interactions in multiplex image cytometry data. Nat. Methods. 2017;14:873–876. doi: 10.1038/nmeth.4391. [DOI] [PMC free article] [PubMed] [Google Scholar]
- Schulien I., Kemming J., Oberhardt V., Wild K., Seidel L.M., Killmer S., Sagar, Daul F., Salvat Lago M., Decker A., et al. Characterization of pre-existing and induced SARS-CoV-2-specific CD8+ T cells. Nat. Med. 2021;27:78–85. doi: 10.1038/s41591-020-01143-2. [DOI] [PubMed] [Google Scholar]
- Sekine T., Perez-Potti A., Rivera-Ballesteros O., Strålin K., Gorin J.B., Olsson A., Llewellyn-Lacey S., Kamal H., Bogdanovic G., Muschiol S., et al. Karolinska COVID-19 Study Group Robust T cell immunity in convalescent individuals with asymptomatic or mild COVID-19. Cell. 2020;183:158–168.e14. doi: 10.1016/j.cell.2020.08.017. [DOI] [PMC free article] [PubMed] [Google Scholar]
- Solomon I.H., Normandin E., Bhattacharyya S., Mukerji S.S., Keller K., Ali A.S., Adams G., Hornick J.L., Padera R.F., Jr., Sabeti P. Neuropathological features of COVID-19. N. Engl. J. Med. 2020;383:989–992. doi: 10.1056/NEJMc2019373. [DOI] [PMC free article] [PubMed] [Google Scholar]
- Song E., Zhang C., Israelow B., Lu-Culligan A., Prado A.V., Skriabine S., Lu P., Weizman O.E., Liu F., Dai Y., et al. Neuroinvasion of SARS-CoV-2 in human and mouse brain. J. Exp. Med. 2021;218:e20202135. doi: 10.1084/jem.20202135. [DOI] [PMC free article] [PubMed] [Google Scholar]
- Tay T.L., Mai D., Dautzenberg J., Fernández-Klett F., Lin G., Sagar, Datta M., Drougard A., Stempfl T., Ardura-Fabregat A., et al. A new fate mapping system reveals context-dependent random or clonal expansion of microglia. Nat. Neurosci. 2017;20:793–803. doi: 10.1038/nn.4547. [DOI] [PubMed] [Google Scholar]
- Tröscher A.R., Wimmer I., Quemada-Garrido L., Köck U., Gessl D., Verberk S.G.S., Martin B., Lassmann H., Bien C.G., Bauer J. Microglial nodules provide the environment for pathogenic T cells in human encephalitis. Acta Neuropathol. 2019;137:619–635. doi: 10.1007/s00401-019-01958-5. [DOI] [PMC free article] [PubMed] [Google Scholar]
- Varatharaj A., Thomas N., Ellul M.A., Davies N.W.S., Pollak T.A., Tenorio E.L., Sultan M., Easton A., Breen G., Zandi M., et al. CoroNerve Study Group Neurological and neuropsychiatric complications of COVID-19 in 153 patients: a UK-wide surveillance study. Lancet Psychiatry. 2020;7:875–882. doi: 10.1016/S2215-0366(20)30287-X. [DOI] [PMC free article] [PubMed] [Google Scholar]
- von Weyhern C.H., Kaufmann I., Neff F., Kremer M. Early evidence of pronounced brain involvement in fatal COVID-19 outcomes. Lancet. 2020;395:e109. doi: 10.1016/S0140-6736(20)31282-4. [DOI] [PMC free article] [PubMed] [Google Scholar]
- Zhang Y., Sloan S.A., Clarke L.E., Caneda C., Plaza C.A., Blumenthal P.D., Vogel H., Steinberg G.K., Edwards M.S., Li G., et al. Purification and characterization of progenitor and mature human astrocytes reveals transcriptional and functional differences with mouse. Neuron. 2016;89:37–53. doi: 10.1016/j.neuron.2015.11.013. [DOI] [PMC free article] [PubMed] [Google Scholar]
Associated Data
This section collects any data citations, data availability statements, or supplementary materials included in this article.
Supplementary Materials
Data Availability Statement
Imaging mass cytometry data are available from the lead contact. Mass cytometry data are available from FlowRepository (ID: FR-FCM-Z3SN; URL: https://flowrepository.org/id/FR-FCM-Z3SN). Additional Supplemental Items are available from Mendeley Data: https://doi.org/10.17632/yzrfb9cxyz.1.