

ABSTRACT
Motivation
Cancer somatic driver mutations associated with genes within a pathway often show a mutually exclusive pattern across a cohort of patients. This mutually exclusive mutational signal has been frequently used to distinguish driver from passenger mutations and to investigate relationships among driver mutations. Current methods for de novo discovery of mutually exclusive mutational patterns are limited because the heterogeneity in background mutation rate can confound mutational patterns, and the presence of highly mutated genes can lead to spurious patterns. In addition, most methods only focus on a limited number of pre-selected genes and are unable to perform genome-wide analysis due to computational inefficiency.
Results
We introduce a statistical framework, MEScan, for accurate and efficient mutual exclusivity analysis at the genomic scale. Our framework contains a fast and powerful statistical test for mutual exclusivity with adjustment of the background mutation rate and impact of highly mutated genes, and a multi-step procedure for genome-wide screening with the control of false discovery rate. We demonstrate that MEScan more accurately identifies mutually exclusive gene sets than existing methods and is at least two orders of magnitude faster than most methods. By applying MEScan to data from four different cancer types and pan-cancer, we have identified several biologically meaningful mutually exclusive gene sets.
Availability and implementation
MEScan is available as an R package at https://github.com/MarkeyBBSRF/MEScan.
Supplementary information
Supplementary data are available at Bioinformatics online.
1 Introduction
Cancer arises from somatically acquired genetic and epigenetic alterations. While large consortia like The Cancer Genome Atlas (TCGA) and the International Cancer Genome Consortium have profiled genomic somatic mutations of thousands of tumor samples from various cancer types based on whole-genome/exome sequencing, meaningful mechanistic interpretation of these gene variation results are still very limited. One basic yet challenging task is to distinguish driver mutations, which are causally implicated in cancer development, from passenger mutations, which occur randomly with neutral effect. Despite a few exceptions, most driver mutations occur in only a small fraction of tumor samples (Tamborero et al., 2013). Therefore, identifying these low recurrent driver mutations that are buried among a vast pool of passenger mutations is challenging. Tremendous efforts have been spent on identifying driver mutations (Ding et al., 2018; ICGC/TCGA Pan-Cancer Analysis of Whole Genomes Consortium, 2020). It has been suggested that assessing mutations in a set of related genes may enhance the power of the detection, since genes act together in various biological (regulatory, signaling and metabolic) pathways (Leiserson et al., 2013, 2015; Szczurek and Beerenwinkel, 2014; Vandin et al., 2012). Mutations associated with genes within a pathway often show a mutually exclusive pattern across a cohort of patients, meaning that each patient carries just one mutation in the pathway, which is often sufficient to perturb the function of that pathway. Although the mutation rate for each gene in the pathway is often low, the mutually exclusive mutations among genes in the pathway provide a stronger combined signal that is easier to detect. This is due to the increased mutation rate by considering the set of genes as a whole as well as the mutually exclusive pattern across genes that provides an additional signal for detection.
Several bioinformatics methods have been developed for de novo discovery of mutually exclusive gene sets (Constantinescu et al., 2016; Ding et al., 2018; Hua et al., 2016; Kim et al., 2017; Leiserson et al., 2013, 2015, 2016; Mina et al., 2017; Szczurek and Beerenwinkel, 2014; Vandin et al., 2012). However, there are still three major challenges. Firstly, the heterogeneity in background (or passenger) mutation rate needs to be adjusted. Lawrence et al. (2013) demonstrated large variation in the background mutation rate across genes and across patients of the same cancer type from TCGA data. Adjusting for a patient- and gene-specific background mutation rate has been shown as the key to reduce artifactual findings and improving the identification of driver genes (Korthauer and Kendziorski, 2015; Lawrence et al., 2013; Youn and Simon, 2011). This is also true for dN/dS-style tests, where dS represents a proxy for background mutation rate (Martincorena et al., 2017; Nik-Zainal et al., 2016; Zhao et al., 2019). The heterogeneity in the background mutation rate can also affect identification of mutually exclusive mutational patterns, because spurious patterns are more likely to occur in genes and patients with high background mutation rates. However, only a few mutual exclusivity analysis methods have taken into account the heterogeneity in the background mutation rate, and adjustment approaches are limited. Hua et al. (2016) used a likelihood-based approach to directly adjust for the background mutation rate. However, that method required the assumption that the relative mutation frequencies of genes in a mutually exclusive gene set are proportional to the background mutation frequencies of those genes. It also assumed the same background mutation rate of a gene across patients. A few other methods (Kim et al., 2017; Leiserson et al., 2015, 2016) used a conditional technique to indirectly adjust for the mutation rate heterogeneity. These methods used either permutation or a hypergeometric distribution method to make inferences by conditioning on the observed mutation frequencies of genes and patients. However, the conditional technique was unable to distinguish whether the observed mutation frequencies were due to random background noise or true signals that drive cancer development.
Secondly, as pointed out by Leiserson et al. (2015), a gene with a very high mutation rate plus a few other genes with very low mutation rates may show a mutually exclusive mutational pattern by random chance. The highly mutated gene, e.g. TP53 in several cancer types, could be a driver gene by itself. But other genes in this spurious mutually exclusive set may not be drivers and may be biologically unrelated to the highly mutated gene. Such an unbalanced pattern, dominated by the highly mutated gene, is less of interest as compared to a more balanced pattern, where each gene in the gene set has a non-negligible contribution to the overall pattern. Note that, adjusting for the background mutation rate does not solve this problem. The highly mutated gene could be a driver whose mutation rate is much higher than the background so that the pattern would still be significant even after the background mutation rate adjustment. Many bioinformatics methods do not distinguish unbalanced and more balanced patterns, and therefore can lead to spurious results. Although a conditional method (Leiserson et al., 2015) has been proposed to favor more balanced patterns, its power could still be affected by the presence of a highly mutated gene based on our simulations (see Section 3).
Thirdly, computational efficacy is a major hurdle for genome-scale screening of mutual exclusive gene sets. Most methods (Constantinescu et al., 2016; Hua et al., 2016; Kim et al., 2017; Leiserson et al., 2015, 2016; Szczurek and Beerenwinkel, 2014) are based on statistical tests to examine mutual exclusivity of gene sets. However, current statistical tests have high computational burden because they involve computationally intensive statistical modeling and/or require permutation to calculate P-values. Furthermore, the computational burden increases dramatically as the size of the candidate gene set increases. Although a few methods have been proposed to reduce this computational burden (Kim et al., 2017; Leiserson et al., 2016), the improvement is still limited. As a compromise, most methods only focused on genes with relatively high mutation rates and/or known to be cancer drivers. The number of genes they considered was typically <1000, or even <100, which limited their ability to perform genome-scale screening.
Due to these major hurdles, current mutual exclusivity analysis methods have limited ability of analyzing the whole genome to identify novel driver genes, especially those with low mutation frequencies. In this article, we explore methods for removing those hurdles so as to unleash the power of mutual exclusivity analysis for genome-wide screening of driver gene mutations. We introduce a new statistical framework, MEScan, in this endeavor. Specifically, we propose a new statistical test to assess mutual exclusivity of a candidate gene set while adjusting for the background mutation rate and gene mutation frequency. Importantly, the formula of our test statistic only involves simple algebra, and thus is very fast to calculate. Equipped with this test, we implement a Markov chain Monte Carlo (MCMC) algorithm to efficiently scan for mutually exclusive gene sets at the genomic scale, a false discovery rate (FDR) adjustment procedure to control false positives, and a summarization procedure to select high-confidence findings. We demonstrate that our test statistic outperforms several existing methods based on simulation studies. Our algorithm has been applied to TCGA data for genome-scale screening of mutually exclusive gene sets.
2 Materials and methods
2.1 MEScan framework
An overview of the MEScan framework is provided in Figure 1. We propose a test statistic, TG, to examine whether a candidate gene set G pertains to a mutually exclusive mutational pattern. The TG quantifies the difference between the observed potential of mutual exclusivity in G with its expected value due to background noise. A larger TG score indicates that the gene set is more likely to be mutually exclusive. As the background mutation rate varies across patients and genes, the TG incorporates a patient- and gene-specific background mutation rate in the calculation to adjust for the background noise. In addition, TG includes a gene-specific weight to down-weigh genes with very high mutation rates, which could lead to spurious unbalanced mutually exclusive patterns. As illustrated in the figure, the candidate gene set appears to show a mutually exclusive mutational pattern. However, most of the mutations are from gene g2 while the other two genes, g4 and g5, have very few mutations. The apparent mutually exclusive pattern is highly unbalanced and dominated by g2. To balance the impact of each individual gene on the overall pattern, our TG statistic includes a gene-specific weight, which is inversely correlated with the gene’s mutation rate, to reduce the impact of g2. Furthermore, TG is very fast to calculate, which is critical for genome-scale screening over a vast number of candidate gene sets.
Fig. 1.

Overview of the MEScan framework. A key component of MEScan is a fast and powerful statistical test, TG, for assessing mutual exclusivity of a candidate gene set. This test accounts for a patient- and gene-specific background mutation rate (for illustration, darker blue indicates higher and lighter blue indicates lower background mutation rate). By using a gene-specific weight, the test also balances the impact of each gene on the overall significance of the gene set. Based on this test, our genome-scale screening follows a multi-step procedure. Starting from the observed mutation data matrix, an MCMC algorithm is used to screen across candidate gene sets, where the probability of a gene set being sampled is proportional to the TG score of that set. Next, significant gene sets are identified with the control of the FDR. Finally, high-confidence gene sets are selected based on the criteria that all subsets of them are also significant and they do not have substantial overlaps
Building upon this test, we use a multi-step procedure for genome-scale screening of mutually exclusive gene sets. Firstly, we use an MCMC algorithm to efficiently identify potential mutually exclusive gene sets at the genomic scale. Given the vast number of candidate genes and numerous combinations of genes to form gene sets, examining all the possible gene sets is impractical. Therefore, for each size of candidate gene sets, we construct a Markov chain for more efficient screening, where more focus are given to gene sets that are more likely to be mutually exclusive. Secondly, we identify significant mutually exclusive gene sets by implementing an FDR control method. Finally, we investigate significant gene sets across different sizes to identify high-confidence mutually exclusive gene sets that are strongly supported by the data and distinct from each other. We expect these high-confidence mutually exclusive gene sets are of most interest for further biological interpretation and investigation. In the rest of this section, we will describe each component of the framework in details.
2.2 Testing mutual exclusivity of a single gene set
We propose a new statistical test to examine the presence or absence of a mutually exclusive pattern for a gene set G based on mutation data from a cohort of n patients, while adjusting for patient- and gene-specific background mutation rate as well as the impact of highly mutated genes. Our test statistic quantifies the observed potential of mutual exclusivity beyond what is expected due to random background for each gene and patient, and then takes a summation across genes and patients. To favor more balanced patterns, each gene’s contribution to the overall test is weighted by a factor inversely correlated with its mutation rate.
Let Uig take value 1 or 0 to indicate whether the ith patient satisfies the mutually exclusive mutational pattern and the mutation occurs in a gene , i.e.
where Yig takes value 1 or 0 to indicate if gene g is mutated in patient i. Under the null hypothesis of no mutually exclusive pattern, the expectation of Uig is
where ηig is the background mutation rate for gene g in patient i calculated based on the MADGiC (Korthauer and Kendziorski, 2015) method. MADGiC considers a multiplicative model that quantifies the patient- and gene-specific background mutation rate by a product of parameters representing a number of factors that are known to affect the mutation rate. Those factors include patient-specific mutation rate, mutation type and dinucleotide context (the specific nucleotide change of the mutation and whether the mutation occurs in CpG dinucleotides), replication timing of the region and expression level of the gene. The empirical Bayes method is used to estimate the patient-specific mutation rate parameter, and the method of moments is used to estimate other parameters.
We quantify the contribution of gene g in patient i to the mutually exclusive pattern by , which calculates the difference between the observed value of Uig and its expected value under the null hypothesis. By standardizing Zig and taking a weighted sum across genes in G, we obtain the following statistic to quantify the evidence of mutual exclusivity in the ith patient
| (1) |
where is the variance of Zig and λ is a small constant to mitigate the impact of extremely small θig values. Following the suggestion of Tusher et al. (2001), we set λ to be the fifth percentile of all ’s, where is approximately the SD of Zig because θig is usually much smaller than 1 so that .
It is important to note that in Equation (1), we include a gene-specific weight, wg, to adjust for the difference in mutation rate of genes in G. Specifically,
As wg is inversely correlated with the mutation rate of gene g, it down-weighs the impact of highly mutated genes, such as TP53, to the overall statistic, and therefore makes the statistic favor balanced patterns. The wg removes the confounding effect of the difference in genes’ mutation rates by standardizing the statistic to a balanced pseudo-population, where the number of subjects having mutations in g but no other genes in G is the same for each . It is analogous to the inverse probability weighting in survey sampling (Little, 1991; Pfeffermann, 1996).
Finally, we take the sum of Ti over all patients and standardize it to obtain our test statistic, TG, for mutual exclusivity of gene set G:
| (2) |
where the expectation and variance of Ti are
and
The TG can be calculated very quickly because the formula only involves simple algebra.
2.3 Genome-wide screening
The efficiency of the TG test makes it possible to perform genomic scale screening for mutually exclusive gene sets from thousands of genes. However, due to the vast number of candidate gene sets, it is still impractical to perform a mutual exclusivity test exhaustively on each of those gene sets. Therefore, we consider an MCMC method to screen candidate gene sets more efficiently and prioritize gene sets that are more likely to pertain the mutually exclusive pattern. We define a probability distribution on candidate gene sets satisfying that the probability of a candidate gene set is proportional to its TG score. A Markov chain is then constructed to have that probability distribution as its equilibrium distribution. Therefore, the MCMC algorithm favors sampling gene sets with large TG scores, which are more likely to be mutually exclusive sets. A similar approach was used in Leiserson et al. (2015).
In the implementation, we consider a separate MCMC for each size of gene sets. For each MCMC, we use the following Metropolis–Hastings algorithm to obtain Monte Carlo samples. For a gene set G, we define NB(G) as a collection of its neighborhood gene sets who contain the same number of genes as G and differ from G by only one gene. We require that a gene set can only transit to its neighborhood gene sets. Specifically, at each MCMC iteration, the proposed state given the current state G is a random sample from NB(G). The Metropolis acceptance probability for is
where τ is a tuning parameter to control the acceptance rate to be around 30%.
2.4 Determining a cutoff value to control the FDR
We identify significantly mutually exclusive gene sets by controlling the FDR <0.05 based on the local fdr method from Efron (2004). The local fdr method considers the observed distribution of TG as a mixture of null and non-null distributions. It empirically estimates the null and non-null distributions for possibly non-independent test statistics of large-scale simultaneous hypothesis testing. The FDR is then calculated based on the empirical null and non-null distributions. A cutoff value of TG corresponding to FDR <0.05 is determined so that gene sets with TG scores larger than the cutoff value are considered as significantly mutually exclusive. The cutoff value is determined for each size of gene sets separately. Note that, the original method in Efron (2004) requires using the TG’s of all candidate gene sets to estimate the empirical null and non-null distributions and determine the TG cutoff value, which is computationally intractable for our situation. Therefore, instead of using all candidate gene sets, we randomly sample 107 gene sets to estimate the TG cutoff value for each size of gene sets. As those gene sets are randomly selected, they are likely to represent the distribution of TG in all candidate gene sets. Based on real data analysis, as shown in Supplementary Figure S1, sampling 107 gene sets is sufficient to obtain stable cutoff values.
2.5 Identifying high-confidence mutually exclusive gene sets
By applying the TG cutoff value as described in the last subsection, we can identify a number of significant mutually exclusive gene sets with FDR<0.05 for each size of gene sets. Let be a collection of the significant gene sets across all sizes. Based on our experience, there can be a large number of gene sets in and many of those gene sets overlap with each other. To promote more robust and focused inferences, we further define high-confidence mutually exclusive gene sets, satisfying that (i) all subsets are also significantly mutually exclusive and (ii) different gene sets do not have substantial overlaps. A two-step procedure is used to select high-confidence mutually exclusive gene sets. The first step identifies all maximal cliques in . A clique is defined as a gene set (size ) such that itself and all of its subsets (size ) are all in . A maximal clique is a clique that cannot be expanded by including any additional gene. These maximal cliques are likely to be real mutually exclusive sets because they are validated by all their subsets. Note that, we do not consider gene sets of size 2 as cliques because they do not have subsets to validate. The second step removes largely overlapped maximal cliques of the same size. For maximal cliques of size >3, if the number of overlapped genes between two maximal cliques of the same size is >50% of the size, we remove one of them with a lower TG score. For maximal cliques of size 3, because the size is too small to define meaningful overlaps, we simply select the top 100 maximal cliques with the largest TG scores. After the two-step procedure, the remaining maximal cliques are considered as high-confidence mutually exclusive gene sets.
3 Results
3.1 Simulation studies
We performed simulation studies to evaluate the performance of MEScan and compare to the following five existing methods: MEGSA (Hua et al., 2016), Dendrix (version 0.3) (Vandin et al., 2012), TiMEx (version 0.99.0) (Constantinescu et al., 2016), WExT (weighted-row-exclusivity test, version 1.3.0) (Leiserson et al., 2016) and CoMEt (Leiserson et al., 2015). For CoMEt, we used the WExT row-exclusivity test implementation as suggested by the article (Leiserson et al., 2016). To mimic a real-world situation, our simulated datasets were generated based on the TCGA ovarian cancer dataset described in section 3.3.
As the goal of the analysis is to identify truly mutually exclusive mutation patterns while avoiding spurious patterns, the following simulation studies were conducted to evaluate and compare each method’s performance in ranking candidate gene sets. We randomly selected 200 patients and 3 genes from TCGA ovarian cancer dataset and artificially added a mutually exclusive mutational pattern on 10%, 20%, 30% or 40% of patients, which was referred to as the coverage. We considered two different mutually exclusive mutational patterns, one with a 1:1:1 ratio of mutation frequencies for the three genes (equal number of mutations in each gene) and the other with a 3:2:1 ratio of mutation frequencies. We additionally included 17 other genes, each has at least 5 mutations in the TCGA ovarian cancer dataset, as ‘noisy’ genes without any mutually exclusive pattern. We considered two different approaches to select those genes. One approach was to randomly select 17 genes from the real data. The other was to intentionally include TP53, which had a high mutation frequency of 94.6%, and randomly select the other 16 genes. This second approach aimed to assess each method’s performance in the presence of a highly mutated driver gene but not part of the mutually exclusive pattern, where such a gene could yield spurious unbalanced mutually exclusive patterns by random chance. A summary of the simulation scenarios is provided in Supplementary Table S1.
We evaluated methods’ performance in identifying the true 3-gene mutually exclusive gene set. Under each scenario, we applied each method (except for TiMEx) to all candidate gene sets of size 3 and identified the top-ranked gene set. Here, the candidate gene sets were ranked based on the TG score for MEScan, the weight W for Dendrix, the P-value for CoMEt, WExT and TiMEx, and the likelihood for MEGSA. Note that, because TiMEx is computationally intensive, we only applied it to a smaller subset of candidate gene sets, i.e. the union of top 10 gene sets ranked by each of the other methods and the gene set with the true mutual exclusive pattern, which may bias the result in favor of this method. Our simulations were replicated 100 times and the frequency that the top-ranked gene set was the gene set containing the true mutually exclusive mutation pattern we generated was calculated, which was referred to as the power.
Figure 2 shows the simulation results. In all scenarios, MEScan had the highest power compared to other methods, especially when the coverage was low. For example, when a true mutually exclusive pattern with equal number of mutations in each of the three genes was presented in 10% of patients, MEScan was able to achieve 80% power (Fig. 2A). In contrast, all other methods had power <25%. This is likely due to the adjustment of the background mutation rate by MEScan, which provides a better detection of true patterns against spurious patterns coming from random noise.
Fig. 2.
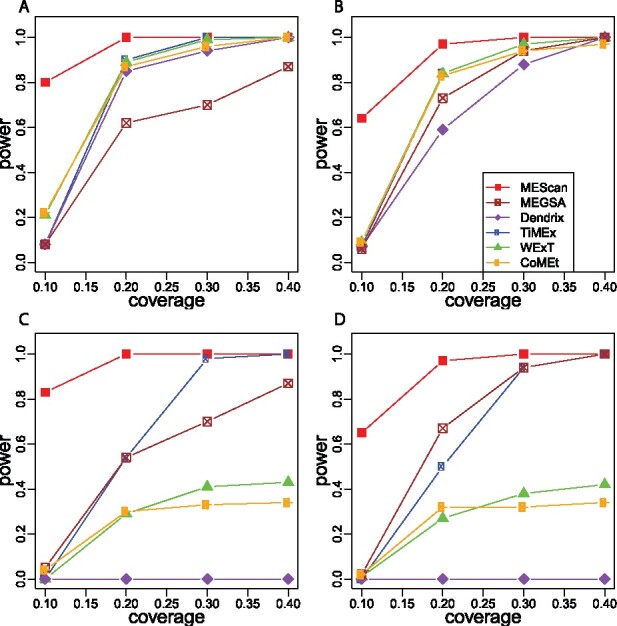
Comparison of power for identifying a true mutually exclusive gene set based on simulations. Each simulated dataset contained 20 genes, including 3 genes with a true mutually exclusive mutational pattern and the other 17 genes without any pattern. Simulations were replicated 100 times and the power was calculated as the frequency that the top-ranked gene set was the 3-gene set with the true mutually exclusive mutational pattern. Four scenarios were considered. (A) The ratio of mutation frequencies was 1:1:1 for the 3 genes and the other 17 genes did not include a highly mutated gene; (B) the ratio of mutation frequencies was 3:2:1 for the 3 genes and the other 17 genes did not include a highly mutated gene; (C) the ratio of mutation frequencies was 1:1:1 for the 3 genes and the other 17 genes included a highly mutated gene; and (D) the ratio of mutation frequencies was 3:2:1 for the 3 genes and the other 17 genes included a highly mutated gene
We next assessed the impact of a highly mutated noisy gene (TP53) that was not part of the true mutually exclusive pattern. Figure 2 compares the power of each method in the absence (top panels) versus presence (bottom panels) of TP53. MEScan was able to maintain the power after the addition of the highly mutated gene, indicating that it was robust to such a gene that could cause spurious unbalanced patterns by random chance. In contrast, the power of all other methods decreased. Dendrix did not have any power even when the coverage increased, which is as expected, because it was sensitive to unbalanced spurious patterns (Leiserson et al., 2015). In fact, the top-ranked gene set from Dendrix was always a set containing TP53. CoMEt, which used a conditional method to reduce the bias toward unbalanced patterns (Leiserson et al., 2015), also had substantial decrease in power. Therefore, the conditional method appeared not adequately address the issue of unbalanced spurious patterns.
We also conducted another set of simulation studies to compare different methods in identifying subsets of a true mutually exclusive gene set. This is important because all subsets of a true mutually exclusive gene set are also mutually exclusive. The ability to accurately identify these subsets can strengthen our confidence in the downstream interpretation of the mutually exclusive pattern, which also motivated us to define high-confidence mutually exclusive gene sets (see Section 2). In addition, when the full gene set is difficult to detect due to limited sample size, the identification of its subsets provides useful information about the existence of the pattern. MEScan still outperformed other methods in this simulation (Supplementary Fig. S2).
In addition, we applied each methods to all candidate gene sets of sizes from 2 to 6 and calculated the fraction of simulations that the top-ranked gene set is exactly the true 3-gene mutually exclusive set, is a subset of the true set, contains the true set, or otherwise. Compared to other methods, MEScan yielded the highest fraction of simulations with the top-ranked gene set being the true mutually exclusive set when the coverage was low. It was also robust to the presence of a highly mutated noisy gene. Details of this simulation study are provided in Supplementary Section S3 and Figures S3–S7.
We further evaluated the FDR control of our method. In the absence of a highly mutated noisy gene, the observed FDR was around the nominal FDR. In the presence of a highly mutated noisy gene, the observed FDR was smaller than the nominal FDR. These results suggest that our method was able to control the FDR. Details are provided in Supplementary Section S4 and Figure S8.
3.2 Time cost comparison
Computational time is very critical for a mutual exclusivity test due to the vast number of candidate gene sets needing to be examined. We compared the computational time of MEScan, MEGSA, Dendrix, WExT and CoMEt for assessing 1000 candidate gene sets for each of the size 3–7 based on 200 patients randomly selected from the TCGA ovarian cancer dataset. Note that, TiMEx was not included in the comparison, because it was substantially slower than other methods. Table 1 presents the running time of each method. MEScan was the fastest method. The only other method that was on the same scale is Dendrix. However, as pointed out by Leiserson et al. (2015) and also observed in our simulations, Dendrix did not adjust for the impact of highly mutated genes, and therefore could lead to spurious results. Apart from Dendrix, MEScan was at least two orders of magnitude faster than the rest three methods. For example, it took MEScan only 0.017 s to analyze 1000 gene sets of size 3, while the other 3 methods took more than 8 s. In addition, MEScan only had a <40% increase in computational time as the size of gene set increased from 3 to 7. In contrast, CoMEt and WExT had a 10-fold increase in computational time. Therefore, MEScan provides a very fast and robust test that is instrumental for genome-scale screening of mutually exclusive gene sets.
Table 1.
Comparison of computational time
| Size of gene set | MEScan | MEGSA | Dendrix | WExT | CoMEx |
|---|---|---|---|---|---|
| 3 | 0.017 | 14.604 | 0.052 | 8.807 | 8.488 |
| 4 | 0.021 | 18.166 | 0.056 | 12.791 | 12.701 |
| 5 | 0.022 | 26.260 | 0.060 | 31.575 | 23.611 |
| 6 | 0.023 | 37.285 | 0.061 | 50.402 | 46.922 |
| 7 | 0.023 | 54.675 | 0.076 | 96.574 | 85.256 |
Note: The reported computational time (in seconds) was for analyzing 1000 gene sets of a given size.
3.3 Whole-genome data analysis
We applied our method to TCGA glioblastoma (Brennan et al., 2013), squamous cell lung cancer (Network et al., 2012b), ovarian cancer (Network et al., 2011), pan-cancer (Kandoth et al., 2013; Weinstein et al., 2013) and breast cancer (Network et al., 2012a) studies. Results from the first four studies are presented in this section, while results from the breast cancer study are provided in Supplementary Figure S3. All the data were downloaded from Synapse (syn1729383) (Kandoth et al., 2013). For each dataset, we limited our analysis to non-synonymous mutations and filtered out genes with no more than one mutation. The filtered datasets contain 3193–16 984 genes. A detailed list of the number of genes and patients in each filtered dataset is provided in Supplementary Table S2. We applied MEScan and searched for mutual exclusive gene sets of size between 2 and 7. For each gene set size, 4 independent MCMC chains, each having 108 iterations with burn-in iterations, were generated using 4 different random seeds and the results were pooled together. To control for FDR, we randomly selected 107 gene sets of a given size to estimate the empirical null distribution of TG and FDR. We chose the cutoff value of TG score such that FDR<0.05 and called gene sets with TG scores higher than the cutoff value as significant mutually exclusive gene sets. Finally, high-confidence mutually exclusive sets were determined by investigating the consensus of mutually exclusive gene sets across different sizes as described in the Section 2. A complete list of the identified high-confidence mutually exclusive sets based on each dataset is provided in Supplementary Table S3. Below, we focused on some of these high-confidence mutually exclusive sets and explored their biological interpretations. The selection of these interesting cases was based on the biological importance and relevance of these gene mutations as well as the clinically actionable mutations of interest.
3.3.1 Glioblastoma
We identified a high-confidence mutually exclusive set with IDH1, EGFR, phosphatase and tensin homolog (PTEN) and PIK3CA (Fig. 3A). Aberrant PI3K/Akt signaling is frequently observed in cancers including glioma, which often is achieved by loss of the PI3K inhibitor PTEN or gain-of-function mutations of EGFR (Li et al., 2016; Xu et al., 2017) or PI3KCA (Carracedo and Pandolfi, 2008). IDH1 is a NADP-dependent enzyme that catalyzes the oxidative decarboxylation of isocitrate to α-ketoglutarate (α-KG) in the TCA cycle. IDH mutations are frequently present in gliomas and result in a gain of enzyme function of NADPH-dependent reduction of α-KG to 2-hydroxyglutarate that promotes tumorigenesis (Philip et al., 2018). Mutant IDH1 activates mTOR signaling downstream of the PI3K/AKT/TSC1/2 pathway by inhibiting KDM4A, an α-KG-dependent histone demethylase (Carbonneau et al., 2016). Thus, in glioblastoma, we have identified three regulators of PI3K/AKT/mTOR signaling.
Fig. 3.

High-confidence mutually exclusive gene sets identified from real data analysis. MEScan was applied to identify high-confidence mutually exclusive gene sets based on (A) TCGA glioblastoma (n=290); (B) TCGA lung squamous cell carcinoma (n=174); (C) TCGA ovarian cancer (n=314); and (D) TCGA pan-cancer datasets (n=3205). One selected high-confidence mutually exclusive gene set from each dataset was presented in this figure. A full list of identified high-confidence gene sets is provided in Supplementary Table S3. Pathway diagrams in the figure were generated by using PathwayMapper (Bahceci et al., 2017)
3.3.2 Squamous cell lung cancer
A high-confidence mutually exclusive set we identified consists of three genes, kelch-like ECH-associated protein 1 (KEAP1), PTEN and nuclear factor erythroid-2-related factor 2 (NFE2L2/NRF2), see Figure 3B. NRF2 is a transcription factor and critical regulator of response to oxidative stress. KEAP1 is a negative regulator of NRF2, and in response to oxidative stress, NRF2 is released from KEAP1 where it travels to the nucleus and activates transcription of target genes that are generally anti-oxidants. When KEAP1 is mutated, NRF2 accumulates (Chen et al., 2019). Constitutive activation of NRF2, either through mutations in NRF2 itself or the regulatory partner KEAP1, is recognized to increase tumorigenesis and drive resistance to chemotherapies. In addition, many lung cancers have constitutive NRF2 activation in the absence of NRF2 and KEAP1 mutations (Kerins and Ooi, 2018). PTEN has recently emerged as a negative regulator of NRF2, and loss of PTEN is associated with constitutive activation of NRF2 (Best et al., 2018). Therefore, our analysis has identified two regulators of a final common transcription factor, strongly implicated in tumorigenesis and resistance to chemotherapy.
3.3.3 Ovarian cancer
Breast cancer gene 1 (BRCA1), neurofibromatosis type [neurofibromin 1 (NF1)] and cyclin-dependent kinase (CDK) 12 was identified as a high probability mutually exclusive gene set in ovarian cancer (Fig. 3C). CDK12 is transcriptional regulator of DNA damage response (DDR) genes including those involved in the homologous recombination (HR) like BRCA1 (Joshi et al., 2014; Paculová and Kohoutek, 2017), via phosphorylation of the RNA polymerase II C-terminal domain. Loss of function mutations of CDK12 result in compromised DDR and homologous recombination, which is observed in ovarian cancers (Joshi et al., 2014). Neurofibromatosis is a hereditary syndrome in which individuals typically develop benign neurofibromas because of NF1 mutations, but are also at increased risk of breast cancer (Jeon et al., 2015). Recent work demonstrated an association between NF1 deletions and ESR1, the gene for the estrogen receptor (ER) expression and ER positivity (Dischinger et al., 2018). In breast cancer, NF1 binds to and represses ER and loss of function mutations of NF1 activate ER transcriptional pathways (Chang et al., 2018). Like breast cancer, ovarian cancer is a hormone-responsive cancer with ER present in about 60–100% of ovarian cancers (Modugno et al., 2012). It is likely that for ovarian cancers, there are two subtypes. One is driven by mutations in CDK12/BRCA signaling while the other is driven by mutations in NF1/ER signaling. Our gene set analysis has thus identified mechanisms of tumorigenesis of ovarian cancer.
3.3.4 Pan-cancer
CDKN2A, NPM1, Ribosomal protein L22 (RPL22) and SMC1A were identified as high-confidence mutually exclusive gene sets from TCGA pan-cancer data (Fig. 3D). P53 is a well-established tumor suppressor in human cancer. CDKN2A encodes p14ARF, which inhibits MDM2 and promotes p53 function, such as cell cycle control, apoptosis and tumor suppression (Sherr, 2006). NPM1 (nucleophosmin) complexes with and stabilizes p14ARF (Sherr, 2006). Mutated NPM1 fails to protect p14ARF from degradation and attenuates the ability of p14ARF to promote p53 function (Colombo et al., 2006). NPM1 also directly interacts with p53 and positively regulates the stability and transcriptional activity of p53 (Colombo et al., 2002). RPL22 is highly mutated in various human cancers. Studies have shown that RPL22 binds with and inhibits MDM2 E3 ligase and thus functions as a p53 positive regulator (Cao et al., 2017). Finally, SMC1A is a component of the cohesin complex that plays a crucial role during mitosis in holding sister chromatids together from DNA replication in S phase to anaphase to ensure proper chromosome separation. SMC1A mutations would impact cohesin functions (Hirano, 2006) and would theoretically result in error-prone chromosome replication and segregation, which may induce p53-mediated cell cycle control, although it has not been experimentally confirmed. The cohesin complex has been shown to bind to the transcription start sites of p53 and mdm2, and the knockdown of Rad21 (a cohesin component) increased their transcription (Rhodes et al., 2010). It is possible that SMC1A mutations would enhance p53 and mdm2 transcription. Thus pan-cancer mutations in CDKN2A, NPM1, RPL22 and SMC1A can be functionally connected through the p14ARF-MDM2-p53 tumor suppressor pathway.
3.4 Real-world validation and comparison
We used four real datasets to validate our method from different aspects. We also tried to compare our method to exist ones when possible. Note that, we attempted to try existing methods on the whole-genome real data examples presented in the last subsection. However, all attempts with those methods failed to finish. Dendrix ran out of computer memory (i.e. >64 GB of RAM). MEGSA, CoMEt and WEXT did not finish after using over 6 days of CPU time. Therefore, we compared our methods to others using a smaller scale real data example presented in the first validation study of this subsection, where some of the existing methods were able to generate results.
Our first validation study considered the pan-cancer data on 299 driver genes from TCGA MC3 (Ding et al., 2018) to assess whether MEScan as well as other methods can identify the mutually exclusive patterns reported in the article. Two sets of analyses were performed. The first set of analyses focused on examining all candidate gene sets of size 2. Ding et al. (2018) reported eight mutually exclusive gene sets based on the exact Mantel–Haenszel test. MEScan was able to identify all those eight gene sets as significantly mutually exclusive. In contrast, WExT was able to identify seven, CoMEt was able to identify one, Dendrix was unable to identify any of those gene sets and MEGSA was unable to complete the analysis with 6 days of CPU time. The second set of analyses focused on examining candidate gene sets of size >2. Ding et al. (2018) reported four such gene sets. MEScan was able to identify all of them as significantly mutually exclusive. In contrast, Dendrix was unable to identify any of those gene sets, and other methods were unable to complete the analysis with 6 days of CPU time, see Supplementary Table S5. Our second validation study considered the set of BRAF and NRAS, whose mutations are known to be mutually exclusive in melanoma (Platz et al., 2008). We applied each method to TCGA melanoma data (Akbani et al., 2015) (n=253). We focused on all gene sets of size 2 and investigated whether a method was able to identify the gene set of BRAF and NRAS. Results are summarized in Supplementary Table S6. MEScan gave a TG score of 125.6 for the set of BRAF and NRAS, which is highly significant. In contrast, other methods were unable to finish after using over 6 days of CPU time. Our third validation study used an independent large-scale cohort, PCAWG (ICGC/TCGA Pan-Cancer Analysis of Whole Genomes Consortium, 2020), to validate our findings from TCGA pan-cancer analysis. The PCAWG cohort contains 1810 cancer patients after excluding overlapped patients between PCAWG and TCGA. After filtering out a few genes with no observed mutations in the PCAWG cohort, we examined a total of 149 high-confident mutually exclusive gene sets, we identified from the TCGA pan-cancer cohort. About 95% of those gene sets were also significantly mutually exclusive in the PCAWG cohort (see Supplementary Table S3). Our fourth validation study used an independent cohort of 2433 primary breast tumors (Pereira et al., 2016) to validate our findings from TCGA breast cancer analysis. Because the validation cohort sequenced a panel of 173 genes, we focused our analysis on high-confidence gene sets consisting of those genes. As shown in Supplementary Table S3, 84% of those gene sets remained significant in the validation cohort. These four validation studies suggested that MEScan was able to identify known mutually exclusive patterns and provide reproducible results.
4 Discussion
We have introduced a statistical framework, MEScan, for accurate and efficient genome-wide de novo discovery of mutually exclusive gene sets. Our framework uses a simple yet powerful statistical test for identifying mutually exclusive gene sets. The test allows adjustment of background mutation rate, mitigates the impact of highly mutated genes, and is very fast to calculate. Coupled with this test is an MCMC algorithm to efficiently screen candidate gene sets at the genomic scale. MEScan is able to search through thousands of candidate genes without restricting to known cancer drivers or genes with high mutation rates. To reduce false positives, we use an FDR control procedure to identify significant gene sets and a summarization method to further select high-confidence mutually exclusive gene sets. Although our method focuses on detecting mutual exclusive patterns, it could potentially be extended to detect other important mutational patterns, such as co-occurrence patterns (Avivar-Valderas et al., 2018; Ding et al., 2018; Thomas et al., 2007), but the formula needs to be tweaked toward quantifying those specific patterns. Another important extension of our method is to include somatic copy number variations in the analysis.
We noticed that mutual exclusivity could originate from different mechanisms. The focus of most current research is on mutations of genes from the same biological pathway. However, gene mutations specific to different cancer subtypes could also form a mutually exclusive pattern. For example, from TCGA ovarian cancer data, we identified a high-confidence mutually exclusive gene set of BRCA1, NF1 and CDK12, which is likely to contain two different subtypes of ovarian cancer driven by CDK12/BRCA1 signaling and NF1/ER signaling, respectively. Therefore, a potential new use of mutual exclusivity analysis might be to identify cancer subtypes and subtype-specific gene mutations. Further research in this area will be of great interest. Furthermore, mutually incompatible mutations (e.g. synthetically lethal mutations) would also produce mutual exclusivity in mutation as possible demonstrated by an identified high-confidence mutually exclusive pattern in breast cancer in Supplementary Figure S3.
One limitation of MEScan is that it does not account for intratumoral heterogeneity. Mutations identified using whole-exome bulk sequencing usually come from a mixture of multiple subclones within a tumor (McGranahan and Swanton, 2017). Delineating the intratumor heterogeneity (Schwartz and Schäffer, 2017) could provide a cleaner signal to improve mutual exclusivity analysis. Furthermore, recent advances in single-cell sequencing technologies (Zhang et al., 2019) hold the promise of revealing intratumor heterogeneity at a much higher resolution. With the accumulation of such data, performing mutual exclusivity analysis at the single-cell level will be an interesting topic for future research.
Funding
This work was supported by the National Institutes of Health [R21CA205778, UL1TR001998, P20GM103436-15 and the Cloud Credits Model Pilot, a component of the National Institutes of Health Big Data to Knowledge (BD2K) program]; the Kentucky Lung Cancer Research Program [PO2 415 1400004000, PO2 415 1600001032]; and the Biostatistics and Bioinformatics Shared Resource Facility of the University of Kentucky Markey Cancer Center [P30CA177558].
Conflict of Interest: none declared.
Supplementary Material
Contributor Information
Sisheng Liu, Adcolony Inc., Bellevue, WA 98004, USA.
Jinpeng Liu, Markey Cancer Center, University of Kentucky, Lexington, KY 40536, USA.
Yanqi Xie, Molecular and Cellular Biochemistry, University of Kentucky, Lexington, KY 40536, USA.
Tingting Zhai, Department of Statistics, University of Kentucky, Lexington, KY 40536, USA.
Eugene W Hinderer, Molecular and Cellular Biochemistry, University of Kentucky, Lexington, KY 40536, USA.
Arnold J Stromberg, Department of Statistics, University of Kentucky, Lexington, KY 40536, USA.
Nathan L Vanderford, Markey Cancer Center, University of Kentucky, Lexington, KY 40536, USA; Department of Toxicology and Cancer Biology, University of Kentucky, Lexington, KY 40536, USA.
Jill M Kolesar, Markey Cancer Center, University of Kentucky, Lexington, KY 40536, USA; Department of Pharmacy Practice and Science, University of Kentucky, Lexington, KY 40536, USA.
Hunter N B Moseley, Markey Cancer Center, University of Kentucky, Lexington, KY 40536, USA; Molecular and Cellular Biochemistry, University of Kentucky, Lexington, KY 40536, USA.
Li Chen, Markey Cancer Center, University of Kentucky, Lexington, KY 40536, USA; Department of Internal Medicine, University of Kentucky, Lexington, KY 40536, USA.
Chunming Liu, Markey Cancer Center, University of Kentucky, Lexington, KY 40536, USA; Molecular and Cellular Biochemistry, University of Kentucky, Lexington, KY 40536, USA.
Chi Wang, Markey Cancer Center, University of Kentucky, Lexington, KY 40536, USA; Department of Internal Medicine, University of Kentucky, Lexington, KY 40536, USA.
References
- Akbani R. et al. (2015) Genomic classification of cutaneous melanoma. Cell, 161, 1681–1696. [DOI] [PMC free article] [PubMed] [Google Scholar]
- Avivar-Valderas A. et al. (2018) Functional significance of co-occurring mutations in PIK3CA and MAP3K1 in breast cancer. Oncotarget, 9, 21444–21458. [DOI] [PMC free article] [PubMed] [Google Scholar]
- Bahceci I. et al. (2017) PathwayMapper: a collaborative visual web editor for cancer pathways and genomic data. Bioinformatics, 33, 2238–2240. [DOI] [PMC free article] [PubMed] [Google Scholar]
- Best S.A. et al. (2018) Synergy between the KEAP1/NRF2 and PI3K pathways drives non-small-cell lung cancer with an altered immune microenvironment. Cell Metab., 27, 935–943. [DOI] [PubMed] [Google Scholar]
- Brennan C.W. et al. (2013) The somatic genomic landscape of glioblastoma. Cell, 155, 462–477. [DOI] [PMC free article] [PubMed] [Google Scholar]
- Cao B. et al. (2017) Cancer-mutated ribosome protein L22 (RPL22/eL22) suppresses cancer cell survival by blocking p53-MDM2 circuit. Oncotarget, 8, 90651–90661. [DOI] [PMC free article] [PubMed] [Google Scholar]
- Carbonneau M. et al. (2016) The oncometabolite 2-hydroxyglutarate activates the mTOR signalling pathway. Nat. Commun., 7, 12700. [DOI] [PMC free article] [PubMed] [Google Scholar]
- Carracedo A., Pandolfi P. (2008) The PTEN–PI3K pathway: of feedbacks and cross-talks. Oncogene, 27, 5527–5541. [DOI] [PubMed] [Google Scholar]
- Chang E.C. et al. (2018) Abstract 1814: NF1 as an estrogen receptor-α co-repressor in breast cancer. Cancer Res., 78 (Suppl. 13), 1814.
- Chen X. et al. (2019) Artesunate promotes Th1 differentiation from CD4+ t cells to enhance cell apoptosis in ovarian cancer via miR-142. Braz. J. Med. Biol. Res., 52, e7992. [DOI] [PMC free article] [PubMed] [Google Scholar]
- Colombo E. et al. (2002) Nucleophosmin regulates the stability and transcriptional activity of p53. Nat. Cell Biol., 4, 529–533. [DOI] [PubMed] [Google Scholar]
- Colombo E. et al. (2006) Delocalization and destabilization of the Arf tumor suppressor by the leukemia-associated NPM mutant. Cancer Res., 66, 3044–3050. [DOI] [PubMed] [Google Scholar]
- Constantinescu S. et al. (2016) TiMEx: a waiting time model for mutually exclusive cancer alterations. Bioinformatics, 32, 968–975. [DOI] [PubMed] [Google Scholar]
- Ding L. et al. (2018) Perspective on oncogenic processes at the end of the beginning of cancer genomics. Cell, 173, 305–320. [DOI] [PMC free article] [PubMed] [Google Scholar]
- Dischinger P.S. et al. (2018) NF1 deficiency correlates with estrogen receptor signaling and diminished survival in breast cancer. NPJ Breast Cancer, 4, 29. [DOI] [PMC free article] [PubMed] [Google Scholar]
- Efron B. (2004) Large-scale simultaneous hypothesis testing: the choice of a null hypothesis. J. Am. Stat. Assoc., 99, 96–104. [Google Scholar]
- Hirano T. (2006) At the heart of the chromosome: SMC proteins in action. Nat. Rev. Mol. Cell Biol., 7, 311–322. [DOI] [PubMed] [Google Scholar]
- Hua X. et al. (2016) MEGSA: a powerful and flexible framework for analyzing mutual exclusivity of tumor mutations. Am. J. Hum. Genet., 98, 442–455. [DOI] [PMC free article] [PubMed] [Google Scholar]
- ICGC/TCGA Pan-Cancer Analysis of Whole Genomes Consortium. (2020) Pan-cancer analysis of whole genomes. Nature, 578, 82. [DOI] [PMC free article] [PubMed] [Google Scholar]
- Jeon Y.W. et al. (2015) Early-onset breast cancer in a family with neurofibromatosis type 1 associated with a germline mutation in BRCA1. J. Breast Cancer, 18, 97–100. [DOI] [PMC free article] [PubMed] [Google Scholar]
- Joshi P.M. et al. (2014) Ovarian cancer-associated mutations disable catalytic activity of CDK12, a kinase that promotes homologous recombination repair and resistance to cisplatin and poly (ADP-ribose) polymerase inhibitors. J. Biol. Chem., 289, 9247–9253. [DOI] [PMC free article] [PubMed] [Google Scholar]
- Kandoth C. et al. (2013) Mutational landscape and significance across 12 major cancer types. Nature, 502, 333–339. [DOI] [PMC free article] [PubMed] [Google Scholar]
- Kerins M.J., Ooi A. (2018) A catalogue of somatic NRF2 gain-of-function mutations in cancer. Sci. Rep., 8, 12846. [DOI] [PMC free article] [PubMed] [Google Scholar]
- Kim Y.-A. et al. (2017) WeSME: uncovering mutual exclusivity of cancer drivers and beyond. Bioinformatics, 33, 814–821. [DOI] [PMC free article] [PubMed] [Google Scholar]
- Korthauer K.D., Kendziorski C. (2015) MADGiC: a model-based approach for identifying driver genes in cancer. Bioinformatics, 31, 1526–1535. [DOI] [PMC free article] [PubMed] [Google Scholar]
- Lawrence M.S. et al. (2013) Mutational heterogeneity in cancer and the search for new cancer-associated genes. Nature, 499, 214–218. [DOI] [PMC free article] [PubMed] [Google Scholar]
- Leiserson M.D. et al. (2013) Simultaneous identification of multiple driver pathways in cancer. PLoS Comput. Biol., 9, e1003054. [DOI] [PMC free article] [PubMed] [Google Scholar]
- Leiserson M.D. et al. (2015) CoMEt: a statistical approach to identify combinations of mutually exclusive alterations in cancer. Genome Biol., 16, 160. [DOI] [PMC free article] [PubMed] [Google Scholar]
- Leiserson M.D. et al. (2016) A weighted exact test for mutually exclusive mutations in cancer. Bioinformatics, 32, i736–i745. [DOI] [PMC free article] [PubMed] [Google Scholar]
- Li X. et al. (2016) PI3K/Akt/mTOR signaling pathway and targeted therapy for glioblastoma. Oncotarget, 7, 33440–33450. [DOI] [PMC free article] [PubMed] [Google Scholar]
- Little R.J. (1991) Inference with survey weights. J. Off. Stat., 7, 405. [Google Scholar]
- Martincorena I. et al. (2017) Universal patterns of selection in cancer and somatic tissues. Cell, 171, 1029–1041. [DOI] [PMC free article] [PubMed] [Google Scholar]
- McGranahan N., Swanton C. (2017) Clonal heterogeneity and tumor evolution: past, present, and the future. Cell, 168, 613–628. [DOI] [PubMed] [Google Scholar]
- Mina M. et al. (2017) Conditional selection of genomic alterations dictates cancer evolution and oncogenic dependencies. Cancer Cell, 32, 155–168. [DOI] [PubMed] [Google Scholar]
- Modugno F. et al. (2012) Hormone response in ovarian cancer: time to reconsider as a clinical target? Endocr. Relat. Cancer, 19, R255–R279. [DOI] [PMC free article] [PubMed] [Google Scholar]
- Network C.G.A. et al. (2012. a) Comprehensive molecular portraits of human breast tumours. Nature, 490, 61. [DOI] [PMC free article] [PubMed] [Google Scholar]
- Network C.G.A.R. et al. (2011) Integrated genomic analyses of ovarian carcinoma. Nature, 474, 609. [DOI] [PMC free article] [PubMed] [Google Scholar]
- Network C.G.A.R. et al. (2012. b) Comprehensive genomic characterization of squamous cell lung cancers. Nature, 489, 519. [DOI] [PMC free article] [PubMed] [Google Scholar]
- Nik-Zainal S. et al. (2016) Landscape of somatic mutations in 560 breast cancer whole-genome sequences. Nature, 534, 47–54. [DOI] [PMC free article] [PubMed] [Google Scholar]
- Paculová H., Kohoutek J. (2017) The emerging roles of CDK12 in tumorigenesis. Cell Div., 12, 7. [DOI] [PMC free article] [PubMed] [Google Scholar]
- Pereira B. et al. (2016) The somatic mutation profiles of 2,433 breast cancers refine their genomic and transcriptomic landscapes. Nat. Commun., 7, 1–16. [DOI] [PMC free article] [PubMed] [Google Scholar]
- Pfeffermann D. (1996) The use of sampling weights for survey data analysis. Stat. Methods Med. Res., 5, 239–261. [DOI] [PubMed] [Google Scholar]
- Philip B. et al. (2018) Mutant IDH1 promotes glioma formation in vivo. Cell Rep., 23, 1553–1564. [DOI] [PMC free article] [PubMed] [Google Scholar]
- Platz A. et al. (2008) Human cutaneous melanoma; a review of NRAS and BRAF mutation frequencies in relation to histogenetic subclass and body site. Mol. Oncol., 1, 395–405. [DOI] [PMC free article] [PubMed] [Google Scholar]
- Rhodes J.M. et al. (2010) Positive regulation of c-Myc by cohesin is direct, and evolutionarily conserved. Dev. Biol., 344, 637–649. [DOI] [PMC free article] [PubMed] [Google Scholar]
- Schwartz R., Schäffer A.A. (2017) The evolution of tumour phylogenetics: principles and practice. Nat. Rev. Genet., 18, 213–229. [DOI] [PMC free article] [PubMed] [Google Scholar]
- Sherr C.J. (2006) Autophagy by ARF: a short story. Mol. Cell, 22, 436–437. [DOI] [PubMed] [Google Scholar]
- Szczurek E., Beerenwinkel N. (2014) Modeling mutual exclusivity of cancer mutations. PLoS Comput. Biol., 10, e1003503. [DOI] [PMC free article] [PubMed] [Google Scholar]
- Tamborero D. et al. (2013) Comprehensive identification of mutational cancer driver genes across 12 tumor types. Sci. Rep., 3, 2650. [DOI] [PMC free article] [PubMed] [Google Scholar]
- Thomas R.K. et al. (2007) High-throughput oncogene mutation profiling in human cancer. Nat. Genet., 39, 347–351. [DOI] [PubMed] [Google Scholar]
- Tusher V.G. et al. (2001) Significance analysis of microarrays applied to the ionizing radiation response. Proc. Natl. Acad. Sci. USA, 98, 5116–5121. [DOI] [PMC free article] [PubMed] [Google Scholar]
- Vandin F. et al. (2012) De novo discovery of mutated driver pathways in cancer. Genome Res., 22, 375–385. [DOI] [PMC free article] [PubMed] [Google Scholar]
- Weinstein J.N. et al. ; The Cancer Genome Atlas Research Network. (2013) The Cancer Genome Atlas Pan-Cancer analysis project. Nat. Genet., 45, 1113–1120. [DOI] [PMC free article] [PubMed] [Google Scholar]
- Xu H. et al. (2017) Epidermal growth factor receptor in glioblastoma. Oncol. Lett., 14, 512–516. [DOI] [PMC free article] [PubMed] [Google Scholar]
- Youn A., Simon R. (2011) Identifying cancer driver genes in tumor genome sequencing studies. Bioinformatics, 27, 175–181. [DOI] [PMC free article] [PubMed] [Google Scholar]
- Zhang L. et al. (2019) Single-cell whole-genome sequencing reveals the functional landscape of somatic mutations in B lymphocytes across the human lifespan. Proc. Natl. Acad. Sci. USA, 116, 9014–9019. [DOI] [PMC free article] [PubMed] [Google Scholar]
- Zhao S. et al. (2019) Detailed modeling of positive selection improves detection of cancer driver genes. Nat. Commun., 10, 1–13. [DOI] [PMC free article] [PubMed] [Google Scholar]
Associated Data
This section collects any data citations, data availability statements, or supplementary materials included in this article.