

Summary
Imaging across scales reveals disease mechanisms in organisms, tissues, and cells. Yet, particular infection phenotypes, such as virus-induced cell lysis, have remained difficult to study. Here, we developed imaging modalities and deep learning procedures to identify herpesvirus and adenovirus (AdV) infected cells without virus-specific stainings. Fluorescence microscopy of vital DNA-dyes and live-cell imaging revealed learnable virus-specific nuclear patterns transferable to related viruses of the same family. Deep learning predicted two major AdV infection outcomes, non-lytic (nonspreading) and lytic (spreading) infections, up to about 20 hr prior to cell lysis. Using these predictive algorithms, lytic and non-lytic nuclei had the same levels of green fluorescent protein (GFP)-tagged virion proteins but lytic nuclei enriched the virion proteins faster, and collapsed more extensively upon laser-rupture than non-lytic nuclei, revealing impaired mechanical properties of lytic nuclei. Our algorithms may be used to infer infection phenotypes of emerging viruses, enhance single cell biology, and facilitate differential diagnosis of non-lytic and lytic infections.
Subject areas: Virology, Machine learning
Graphical abstract
Highlights
-
•
Artificial intelligence identifies HSV- and AdV-infected cells without specific probes.
-
•
Imaging lytic-infected cells reveals nuclear envelope rupture and AdV dissemination.
-
•
Live cell imaging and neural networks presciently pinpoint lytic-infected cells.
-
•
Lytic-infected cell nuclei have mechanical properties distinct from non-lytic nuclei.
Virology; Machine learning
Introduction
Virus infections give rise to a wide range of phenotypes with complex cell biology. Depending on the virus, infections can lead to cell cycle and growth enhancement or arrest, cell swelling or shrinkage, membrane blebbing or contraction, and organelle alterations, such as the collapse of the secretory pathway, mitochondrial aggregation or nuclear condensation, increasingly studied with single cell and single virus resolution (Belov, 2016; den Boon et al., 2010; Roulin et al., 2014; Suomalainen et al., 2020; White et al., 2014). Alterations can be pro- or anti-viral and comprise metabolic changes, such as shifts in glucose, lipid or nucleotide metabolism, as well as apoptotic, necroptotic, and virus-induced cell lysis phenotypes (Delgado et al., 2010; Lotzerich et al., 2018; Munger et al., 2008; Prusinkiewicz and Mymryk, 2019). While programmed cell death is triggered prior to virus dissemination and has strong anti-viral and anti-inflammatory effects, virus-controlled cell lysis is typically proviral, releases large amounts of progeny virions, enhances inflammation, and disseminates virions to neighboring cells and other organisms.
The onset of cell lysis overshadows non-lytic virus transmission, as shown recently with human adenovirus (AdV) (Georgi et al., 2020a, 2020b). Cell lysis has been observed with both enveloped and nonenveloped viruses. It is exploited in clinical applications with oncolytic viruses, such as herpes simplex virus (HSV), measles virus, Newcastle disease virus, vaccinia virus, reovirus, parvovirus, coxsackie virus, polio virus, and AdV (reviewed in Lawler et al., 2017). Yet, lysis is difficult to detect by ultrastructural analyses, which provide snap-shots insights, although time-lapse fluorescence microscopy with single-cell resolution promises to directly visualize lytic events (Georgi et al., 2020a; Pied and Wodrich, 2019; Puntener et al., 2011; Wild et al., 2019; Yakimovich et al., 2012; Yamauchi et al., 2008a).
Fluorescence microscopy has been a key technology in the life sciences. Many of its original limitations, including sensitivity, sample penetration depth, spatiotemporal resolution, and toxicity have been resolved by improvements in optics and chip technology, as well as fluorophore chemistry (Sahl et al., 2017; Wang et al., 2018; Witte et al., 2018). In recent years, it has been enhanced by artificial intelligence (AI). Particularly deep learning methods allow for complex data analysis, often on par with human capabilities (Dechter, 1986; LeCun et al., 2015). AI and deep learning are increasingly used in biomedical sciences, for example for image recognition, restorations upon low light sampling, and object segmentation (Christiansen et al., 2018; Falk et al., 2019; Fisch et al., 2019; Lee et al., 2020; Ounkomol et al., 2018; Silver et al., 2017; Weigert et al., 2018; Yakimovich, 2019).
Recently, AI applications for pattern recognition have been enhanced by artificial neural networks (ANNs). One of the first implementations of ANN was the multilayer perceptron (MLP). Inspired by the architecture of the animal visual cortex (Hubel and Wiesel, 1968), MLPs comprise layers of fully connected nodes (artificial neurons), where each layer's output is used as input for succeeding layers. Each neuron of the MLP represents a non-linear function with trainable weights applied to an input signal to generate an output. In image recognition, trained MLPs have been known to perform on par or better than conventional machine learning methods, at the same time being notoriously hard to train and prone to overfitting. The recent introduction of convolutional neural networks (CNNs) addresses this issue by exploiting the fact that complex patterns in images can be broken down to successively simpler features (convolutions). CNNs are composed of three basic building blocks – convolutional layers, pooling layers, and dense layers. Convolutional layers apply random convolution filters for sub-regions of the input image and derive a feature map, to which a nonlinear function is applied. This layer helps to identify and extract features from the images. The pooling layers down-sample the feature maps extracted by the convolutional layers. This reduces the dimensionality of the data while preserving important information. Dense layers are essentially single layers of an MLP and usually are the final refinement of the CNN and yield the ultimate classification based on the features extracted from the previous convolutional and pooling layers. CNNs distinguish complex patterns based on reusable network architecture, which makes CNNs versatile for retraining and addressing similar, yet unrelated problems based on new data (Rawat and Wang, 2017).
One of the current state-of-the-art CNNs uses a residual learning framework to shorten the training time of the networks and make them more accurate. They are called residual neural networks (ResNets) (He et al., 2015). ResNets are widely used by computer vision scientists, and mimic the functionality in the brain, where neurons are arranged in cortical layers and receive input from axonal and dendritic connections in layers distinct from the receiving neuron, thereby skipping other layers. Such skip connection strategies allow a ResNet to further mitigate overfitting and address the problem of vanishing gradient.
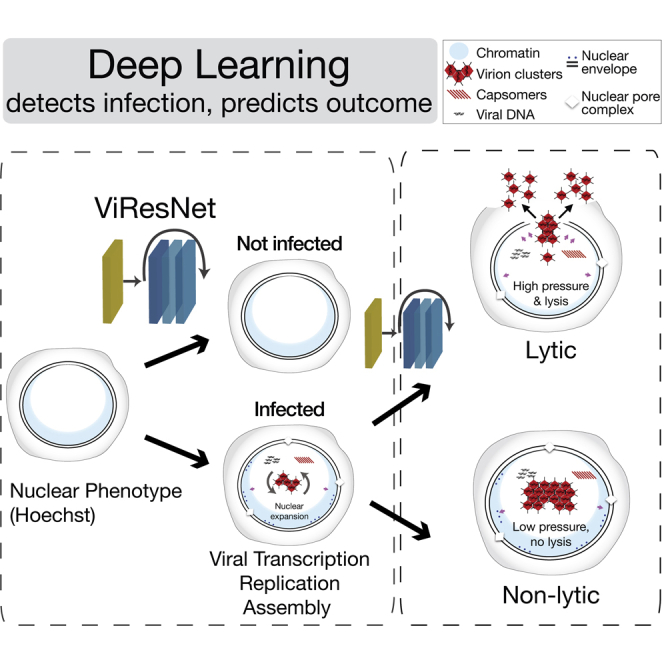
Here, we present a ResNet, termed ViResNet, which detects HSV-1 or AdV infected cells with very high accuracy. Deep learning in ViResNet is qualitatively different from classical machine learning, as it implicitly detects complex morphological features of the infected cell nuclei stained with the DNA-binding agent Hoechst 33342 and imaged by fluorescence microscopy (Latt and Stetten, 1976; Yakimovich et al., 2017). We demonstrate that these learned features can be used to effectively annotate infections with virus serotypes not included in the training set of the network.
HSV-1 and AdV are abundant enveloped and nonenveloped double-stranded DNA viruses, respectively. They replicate and assemble progeny capsids in the cell nucleus (Berk, 2013; Roizman and Knipe, 2001). HSV-1 causes persistent and acute infections of mucosal tissue and a latency phenotype in the trigeminal ganglia of the nervous system (Steiner et al., 2007). Poorly controlled HSV-1 can give rise to encephalitis, conjunctivitis, Bell's palsy, eczema, or genital skin lesion. AdVs, in turn, infect the respiratory, ocular and digestive tracts, as well as blood cells and persist in lymphoid cells of human intestines and tonsils (Greber, 2020; Greber et al., 2013; Greber and Flatt, 2019; Lion, 2014). Upon immunosuppression, they spread to intestinal epithelial cells by unknown pathways and cause severe morbidity and mortality (Kosulin et al., 2016). Our high-fidelity CNN recognizes features of prospective lytic AdV-infected cells, based on Hoechst DNA staining and live cell imaging. These procedures allowed us to identify physical and morphological features of lytic-infected cell nuclei, contrasting non-lytic-infected cells. Our results extend the classical machine learning algorithms, which for example extract virion trafficking features in cells, or identify particular cell phenotypes (Burckhardt et al., 2011; Chenouard et al., 2014; Gazzola et al., 2009; Helmuth et al., 2007, 2009; Sommer and Gerlich, 2013). The work here provides a resource for analyzing the cell lysis mechanisms in virus infections, a challenging topic owing to the rapid and terminal nature of cell death.
Results
Machine-labeling identifies HSV- and AdV-infected cells without virus-specific staining
To explore the power of deep learning for virus infection biology, we used high content fluorescence imaging and implemented a pipeline scoring the morphology of HSV-1 and AdV infected nuclei stained in live cell mode with the DNA-dye Hoechst 33342 (Figures 1A and 1B). We noticed that the Hoechst-stained infected cell nuclei appeared to be distinct from uninfected nuclei. The presence of Hoechst throughout the multi-round infection cycles did not affect the formation of viral plaques (Figure S1A). We used wild-type AdV-C2 and immuno-staining, or the GFP-expressing replication-competent AdV-C2-dE3B-GFP, AdV-C2-dE3B-dADP, AdV-C2-V-GFP, HSV-1-VP16-GFP, and HSV-1 C12 viruses (Crameri et al., 2018; Glauser et al., 2010; Yamauchi et al., 2008b). For AdV, we acquired images at 72 hr post infection (pi), and for HSV-1 at 48 hr pi, reflecting the different replication kinetics of the viruses. The nuclei were computationally segmented and individually annotated according to the infection signal, as AdV or HSV-1 infected or uninfected nuclei. They were further processed to obtain images of individual infected and not infected nuclei (Figure S1B). This procedure generated up to 2000 cells per condition. We used this dataset to train the computational detection of infected cells using modified architecture cutting-edge network ResNet-50 (He et al., 2015) named ViResNet. We trained two ViResNet classifiers, one for AdV and one for HSV-1 infected cells (Figure S1C). To accommodate imaging data of segmented nuclei, input images were resized to 224 x 224 pixels, and the ViResNet output layer was adapted to two classes, infected and not infected cells, with additional dense and pooling layers. The hidden layers of the untrained network were initialized using ResNet-50 ImageNet weights. The trained ViResNet had detection accuracies of 95% and 94% for AdV and HSV-1 infected cells, which were considerably higher than conventional machine learning methods, including k-nearest neighbors (k-NN), support vector machine (SVM), and decision tree classifiers, all applied on the same test data set (Table 1). The ViResNet detection classifiers had precision values of 0.94 and recall values of 0.92, respectively, which were much higher than those determined by conventional machine learning methods, namely 0.6 and 0.58 on average for AdV and HSV-1, respectively. The receiver operating characteristic (ROC) curves of ViResNet, k-NN, SVM, and decision tree classifiers are shown in Figure S1D. The trained 2-class classifiers were then used on segmented images of nuclei to assess the infection status at the population level. This procedure allows for visualization and quantification of viral plaques in the cell population and enables the assessment of viral spread from infected to uninfected cells, and plaque phenotypes (Figure 1B). To further challenge the trained ViResNet, we performed infection prediction on AdV-C5-IX-FS2A-GFP, a virus serotype distinct from AdV-C2 used to train the network. The infection prediction had an accuracy of 93% (Figure S1E).
Figure 1.

Distinction of HSV-1- and AdV-infected from uninfected cells by machine labeling (see also Figure S1)
(A) Overview of the machine labeling pipeline for the identification of infected cells. Nuclei stained with Hoechst were acquired using high-content imaging microscope and images fed into ViResNet for classification. (B) Sample of input images, classification results and ground truth data (validation) from GFP transgene expression in case of AdV-C2-dE3B-GFP and HSV-1-VP16-GFP, or immunofluorescence staining for AdV-C2 infection. Uninfected single cells were used as controls.
Table 1.
Accuracy, precision, and recall performance in detecting AdV-C2- and HSV-1-infected cells by ViResNet compared to k-NN, SVM, and decision tree methods
| AdV-C2: | |||
| ViResNet | 0.95 | 0.94 | 0.92 |
| k-NN | 0.64 | 0.62 | 0.61 |
| SVM | 0.63 | 0.63 | 0.58 |
| Decision tree | 0.64 | 0.62 | 0.59 |
| HSV-1: | |||
| ViResNet | 0.94 | 0.92 | 0.93 |
| k-NN | 0.64 | 0.61 | 0.56 |
| SVM | 0.61 | 0.58 | 0.59 |
| Decision tree | 0.65 | 0.62 | 0.61 |
TP, TN, FP, and FN denote true positives, true negatives, false positives, and false negatives of the predictions on the test data set correspondingly.
In sum, the trained ViResNet accurately identified single AdV and HSV-1 infected cells, as well as plaquing cell populations, and outperformed the conventional machine learning methods. Notably, identification of infected cells was possible in the absence of specific viral staining, which was previously not possible.
Lytic egress of AdV from infected cells visualized by fluorescence microscopy
We next employed live cell fluorescence microscopy to analyze the nuclear egress of AdV-C2-GFP-V. This virus incorporates about 40 GFP-V fusion proteins into its particle, could be purified and tracked in cells during entry by live cell microscopy (Puntener et al., 2011). Infection of HeLa cells stably expressing histone H2B-mCherry with AdV-C2-GFP-V at multiplicity of infection (MOI) 0.2 showed that newly synthesized GFP-V accumulated in the cell nuclei at about 30 hr pi (Figure 2A, and Video S1). At 30 to 39 hr pi, the localization of GFP-V changed, as indicated by an increased diffuse signal in the cytosol, followed by appearance of GFP-V clusters in the cytoplasm. These clusters were largely devoid of H2B-mCherry, which is consistent with the notion that they were made up of AdV particles, which are devoid of histones (Ostapchuk et al., 2017; Puntener et al., 2011). After the appearance of cytoplasmic GFP-V clusters, the nuclei and the cytoplasm progressively lost GFP-V, and also H2B-mCherry, albeit to different extents, indicative of nuclear and cellular lysis, and at least partial nuclear disintegration (Figures 2A and 2B, Videos S1 and S2). The quantification of the data showed that about 5.5% of the infected cells developed a lytic nuclear phenotype until 45 hr pi (Figure 2C). The nuclear lysis phenotype was confirmed by EM analyses at 35 hr pi revealing clustered AdV-C2-GFP-V particles in the nucleus and the cytoplasm (Figure 2D). Together the data show that AdV induced nuclear lysis releases clusters comprising several hundred virions to the cytoplasm and extracellular medium.
Figure 2.

Live cell fluorescence and EM analyses of lytic egress of AdV-C2-GFP-V from HeLa cells
(A) Live cell confocal fluorescence microscopy of H2B-mCherry cells infected with AdV-C2-GFP-V at MOI 0.2 reveals dispersion of GFP-V clusters from the nucleus to the cytoplasm at 35:45 to 38:45 hr:min pi. Images show merged maximum projections for GFP-V (green) and H2B-mCherry (red), including the corresponding black/white images at 37 hr pi. The white arrow indicates a GFP-V expressing H2B-mCherry-positive nucleus undergoing rupture, and arrow heads show GFP-V-positive clusters in the cytoplasm. See also Video S1. (B) Loss of GFP-V clusters from AdV-C2-GFP-V-infected cell nuclei. The white arrow points to a GFP-V-positive nucleus, which completely loses GFP-V from 32 to 39 hr pi. The gray bars denote infected nuclei, which lose GFP-V and H2B-mCherry to a lesser extent in the same time frame. See also Video S2. (C) Frequency analysis of AdV-C2-GFP-V lytic infected cells. Cell lysis events were scored by the disappearance of both GFP-V and H2B-mCherry signals, quantified from eight different movies at 24 to 45 hr pi. (D) Transmission EM images of ultrathin 80 nm sections from epon embedded HER-911 cells 37 hr pi. The images show clustered and solitary AdV-C2 (left) or AdV-C2-GFP-V particles (right) in the nucleus (n) and the cytoplasm (c) indicative of nuclear rupture. The virus particles appear in different shades of gray depending on how much of them was present in the section. Also notable are the crystalline-like inclusions (incl) of viral proteins.
Data set preparation towards deep learning of lytic and non-lytic infections
Towards harnessing the power of ViResNet in assessing and quantifying the spreading efficiency of AdV, we employed live cell fluorescence imaging in high-throughput mode at very low MOI for up to 4 days. Monolayers of A549 cells were infected with AdV-C2-dE3B-GFP, AdV-C2-GFP-V, or AdV-C2-dE3B-GFP-dADP (Puntener et al., 2011; Yakimovich et al., 2012). The AdV-C2-dE3B-GFP lacks the E3B region encoding the receptor internalization and degradation proteins RIDα and RIDβ, and 14.7K, which are involved in protecting AdV infected cells against apoptosis and premature lysis by tumor necrosis factor (Gooding et al., 1988; Tollefson et al., 1998). The AdV-C2-dE3B-GFP-dADP additionally lacks the AdV death protein (ADP, E3-11.6K), which is implicated in virus-controlled cell lysis and spreading to neighboring cells (Tollefson et al., 1996a, 1996b). All these reporter viruses express GFP from the CMV promoter, replicate and form progeny in cell culture. Accordingly, we monitored the nuclear changes and cell lysis by including Hoechst 33342 and propidium iodide (PI) in the medium, and tracked, segmented, and quantified the infected cells using the nuclear Hoechst signal. PI is a membrane-impermeable dye and becomes fluorescent upon binding to nucleic acids in the cytosol or the nucleus of lysed cells (Jimenez et al., 2014; Luisoni et al., 2015). The PI stain gives a distinct signal of lysed cells but not of intact cells.
As expected (Yakimovich et al., 2012), the AdV-C2-dE3B-GFP gave rise to comet-shaped plaques 72 hr pi, owing to spreader cells, which lysed (Figure 3A, and also Figure 2). Remarkably, only about 25% of the infected GFP-positive cells 24 hr pi turned out to be spreaders at 72 hr pi (Figures 3A and 3B). The deletion of ADP reduced the spreader frequency to about 3%, similar as AdV-C2-GFP-V, which expresses GFP-V instead of V and is attenuated in virus propagation (Puntener et al., 2011). Unlike the AdVs, HSV-1-GFP yielded an average of about 85% spreading efficiency, and remarkably this virus gave rise to round-shaped plaques, distinct from the comet-shaped plaques with AdV (Figures 1B, 3A, and 3B). Comet-shaped plaques arise with lytic released but not cell-associated virions carried by convection forces in the culture medium to distant cells (Yakimovich et al., 2012). We confirmed this notion with the cell lysis indicator PI. A lysing, PI-positive cell always preceded the formation of comet-shaped AdV plaques (Figure 3C), whereas HSV-1 infected cells giving rise to round plaques had no PI-positive donor cell at their origin (Video S3), consistent with a non-lytic egress mode of HSV (Everett et al., 2008). It can be noted that, at later timepoints of infection and further rounds of replication (>4 days), additional lytic cells were observed, but it could not be determined if these cells formed plaques because of the high density of preexisting infected cells.
Figure 3.

Prediction of AdV lytic and non-lytic infection outcomes based on artificial neural network learning from live cell fluorescence infection analyses (see also Figure S3)
(A) Fluorescence micrographs displaying the initial infection of human lung epithelial A549 cells (24 hr pi) and AdV-C2-dE3B-GFP spread at 72 hr pi in presence of Hoechst 33342 staining the nuclei. (B) Measurement of spreader cell fraction for different GFP expressing viruses. Error bars represent standard deviations. Note the reduction of virus-infected A549 spreader cells upon deletion of ADP and in case of AdV-C2-GFP-V, which is known to be attenuated in particle assembly (Puntener et al., 2011). The latter result was in excellent agreement with data from HeLa-H2B-mCherry cells (see Figure 2C). Note the rather high spreading frequency of HSV-1-GFP-infected cells in the absence of lysis of the source cell (PI negative, see Video S3). (C) Tracking of the infection spreader using live cell fluorescence confocal microscopy of infected A549 cells. Blue indicates nuclear signal (Hoechst), green represents AdV-C2-dE3B-GFP expression and red indicates cell leakiness (propidium iodide, PI). (D) Overview of the processing pipeline in the prediction of spreader and nonspreader cells based on classification of nuclei up to as much as 20 hr before lysis. (E) Prediction of spreader fraction in AdV-C2- and AdV-C2-dE3B-GFP-infected cells, including the experimentally determined ground truth validation data. Error bars represent standard deviations.
Deep learning predicts the lytic and non-lytic infection outcomes
Using the live imaging data from three AdV infections, AdV-C2-dE3B-GFP, AdV-C2-GFP-V, and AdV-C2-dE3B-GFP-dADP, we constructed a training, validation, and testing data set for a CNN cell fate predictor based on the nuclear Hoechst stain (Figure S2A). The data set contained approximately 300 tracked spreader and nonspreader nuclei, each having 10–24 frames of interest (about 4000 images) and additional 2000 images of uninfected nuclei. The frames of interest for spreader and nonspreader nuclei were chosen 24–48 hr pi, when virus is actively replicating in the nucleus. This phase of the AdV infection features the typical cartwheel structures in the nucleus, characteristic for many AdV-infected cells (Puvion-Dutilleul and Puvion, 1995; Wang et al., 2013). We used a modified version of the already established ViResNet to predict the nonlytic and lytic phenotypes. The output layer was changed to three classes – spreading, nonspreading, and not infected cells. Feeding test images into the trained network revealed a high level of accuracy (95%), as well as precision and recall values of 0.94 and 0.93, respectively. This was much higher than the accuracies of conventional machine learning methods, as indicated by the ROC curves for identifying the spreader, the nonspreader, and the not infected cells among the remaining cells in the population (Figure S2B).
We then utilized the acquired data to construct a pipeline for the prediction of spreader cells for AdV-C2 and AdV-C2-dE3B-GFP infections (Figure 3D). For both viruses, the ViResNet predicted the spreader fraction to be about 25% of the infected cells, in excellent agreement with the wet lab data from the AdV-C2-dE3B-GFP infections (Figure 3E). This result concurred with the notion that the E3B region of the viral genome is not essential for the lytic events (Yakimovich et al., 2012). Next, we addressed the classification accuracy in time-resolved infections. The accuracies of the trained ViResNet in recognizing spreader and nonspreader cells increased with infection time from 8 to about 32 hr pi, while the detection accuracy of uninfected cells remained unaffected (Figure S2C). This result was expected, based on the visual inspection of sample images of spreader and nonspreader nuclei. Collectively, the results indicate that the optimal window for training lytic/nonlytic prediction algorithms sampling nuclear morphology information is between 24 and 40 hr pi.
Faster nuclear accumulation of GFP-V in spreader than nonspreader cells
Having established an AI for the predictive determination of cell-fate, we aimed for an initial characterization of lytic and non-lytic infected cells. The trained networks may be visualized using class activation maps (CAMs). This can be used to characterize phenotypes learned from different information classes (Zhou and Wei, 2016). The ViResNet CAMs showed that the Hoechst signal in the nuclear periphery was more pronounced in the nonspreader than the spreader cells, while internal Hoechst stained regions seemed to be similar overall (Figure 4A). We next analyzed the dynamics of the Hoechst signal and the nuclear size from 0 to 68 hr pi, when most of the spreading cells had lysed. While the average Hoechst intensity profiles remained indistinguishable between spreader and nonspreader nuclei, the nuclear area dynamics were distinct, showing a steady area increase for nonspreader nuclei until 30 hr pi, followed by a decline until 50 hr pi and another increase to 68 hr pi (Figure 4B). In contrast, the area of the spreader nuclei did not significantly increase until 20 hr pi but then rapidly surged till 40 hr pi, followed by a steady phase and a decline a few hours before lysis. Interestingly, the expansion phase of spreader nuclei (annotated by the cell lysis indicator PI) coincided with the rapid accumulation of the viral structural protein GFP-V (Figure 4C). Importantly, GFP-V is a functional fusion protein, and in AdV-C2-GFP-V replaces the wild-type V, an inner virion component serving as a linker between the virion DNA and the capsid wall, and localizing to the nucleoplasm and nucleolus of infected cells (Greber and Flatt, 2019; Matthews, 2001; Puntener et al., 2011). The data show that spreader and nonspreader nuclei exhibit significant morphological differences, as well as distinct accumulation rates of the viral structural protein GFP-V.
Figure 4.

Features of spreader and nonspreader nuclei
(A) The CNN ViResNet defines class activation maps predicting spreader and nonspreader nuclei. (B) Time-resolved analysis of spreader and nonspreader nuclei prior to lysis, based on the average intensity of Hoechst in the segmented nuclear area. Spreader and nonspreader nuclei are notated in blue and red accordingly (n = 10). Thin lines denote the standard deviation of the mean. (C) Tracking of AdV-C2-GFP-V-infected cells based on nuclear (Hoechst), viral (GFP) and cell lysis (PI) indicators. Thick lines indicate the average normalized intensity of GFP-V signal, or the average normalized intensity of the PI signal (n = 30). Thin lines denote the standard deviation of the mean. The expression rate of GFP-V at 24–40 hr pi (green area) was derived from linear regression of the average normalized intensity of GFP-V (n = 30).
Spreader cell nuclei have distinct mechanics from nonspreader nuclei
Lytic spreading of AdV entails that the infected cell bursts open and releases virions to the neighboring cells and the environment, as observed in cell culture, animal models, and reactivation from persistence in human intestines (Jogler et al., 2006; Kosulin et al., 2016; Yakimovich et al., 2012). The lytic release of AdV particles from the nucleus requires the rupture of the nuclear envelope (NE). NE rupture in interphase is commonly defined as the event where the integrity of the nuclear membrane is lost, and nuclear and cytoplasmic proteins rapidly mislocalize, notably in the absence of chromatin condensation. NE typically ruptures in cells with defects in nuclear lamina organization, and under mechanical stress, such as enhanced acto-myosin contractile forces, or in micronuclei, which arise as a consequence of mitotic pathology. The latter may be caused by unrepaired DNA damage, chromatin mis-segregation or breakage of chromatin bridges at the end of mitosis (Hatch, 2018; King and Lusk, 2016). Limited NE rupture is also thought to release intranuclear pressure when cells migrate through small constrictions and facilitate nuclear deformation (Shah et al., 2017).
To assess mechanical features in spreader and nonspreader infected nuclei, we experimentally breached the integrity of the NE by laser ablation microscopy of AdV-C2-GFP-V-infected cells in presence of the nuclear dye Hoechst (Figure 5A and S3). Prior to ablation at 40 hr pi, live cells were classified on the fly as either spreaders or nonspreaders using the above developed CNN. This was then followed by a focused illumination with an intense laser beam (laser ablation) at invariant intensity and size leading to distinct openings of the NE. The volume of the nuclei and the exerted nuclear contents stained by Hoechst in the cytoplasm were recorded by fluorescence imaging at low intensity. Results indicated that rapidly after ablation (<1min), the prospective lytic nuclei lost more than 50% of their original volume, whereas the non-lytic or uninfected nuclei collapsed only minimally (Figure 5B). This suggested that the mechanical strength of the NE was lower in lytic than non-lytic infected nuclei. To estimate if the relative nuclear pressure across the NE was higher in the lytic than non-lytic infected cells, we measured the area of exerted Hoechst-positive material in the cytoplasm upon laser rupture of the NE. The spreader cells were found to extrude Hoechst-positive material amounting to about three-fold higher than the extrusion area in the nonspreader cells, whereas uninfected cells released only a minimal amount of Hoechst-positive material to the cytoplasm upon ablation (Figure 5C). This suggested that the NE was under higher macromolecular pressure from the nuclear contents than the cytoplasmic side. The results show that the nuclei of lytic infected cells have mechanical properties distinct from the non-lytic cells. These differences are the result of lower NE stability and increased nuclear to cytoplasmic pressure ratio compared to non-lytic cells. This raises the possibility that the changes in the mechanical properties of nuclei and, possibly, the cytoplasm are an important determinant for effective cell lysis and rapid spread of infection.
Figure 5.

Modulation of nuclear mechanics by AdV (see also Figure S5)
(A) Live cell imaging of pseudo-colored Hoechst nuclear signal in nuclei identified as spreader and nonspreader, 5 min before laser ablation of the NE, as well as 290 s after the laser ablation, denoted as the ablation region. The lower row highlights the Hoechst-positive material extruded into the cytoplasm upon laser ablation and is highlighted by the extruded area. (B) The normalized nuclear volume was measured using Hoechst signal every minute post ablation up to 5 min by normalizing the segmented volume to the initial volume (n = 5). (C) The exerted area was measured as exerted background area of the Hoechst signal post ablation normalized by the segmented initial area of the z stack maximum projection of the nucleus (n = 5). Error bars represent standard deviations. Spreader, nonspreader, and not infected nuclei are denoted in blue, red, and black, respectively.
Discussion
Viruses are released from an infected cell by multistep processes, conceptionally comparable to entry into cells. For viruses replicating in the nucleus, a key step is to transfer the viral genome to the cytoplasm. For example, human immunodeficiency virus or influenza virus use the nuclear export machineries to transport their unpackaged genomes from the nucleus to the cytoplasm (Boulo et al., 2007; Cullen, 2003), whereas AdVs, parvoviruses, or polyomaviruses package their genome into a protein capsid and induce the rupture of the NE (Daniels et al., 2007; Greber, 2020; Majumder et al., 2018; Puvion-Dutilleul et al., 1998; Suzuki et al., 2010; Tollefson et al., 1996b). Other capsids, for instance those from herpesviruses and baculoviruses, egress from the nucleus by engaging non-disruptive processes, including budding and fusion in the nuclear membranes (Bigalke and Heldwein, 2016; Blissard and Theilmann, 2018; Wang et al., 2018; Zeev-Ben-Mordehai et al., 2015), although herpesviruses were also reported to rupture the NE, or dilatate nuclear pores (Grimm et al., 2012; Klupp et al., 2011; Maric et al., 2014; Wild et al., 2019). The mechanisms of AdV egress from the nucleus have been difficult to explore, largely because of the unpredictable nature of the lysis process (Georgi et al., 2020a; Georgi and Greber, 2020; Prasad et al., 2020). Our machine learning protocols developed here combine live cell fluorescence microscopy with CNNs and prospectively identify infected nuclei programmed to undergo lytic AdV egress.
CNNs and a machine-based procedure identify virus-infected cells
Initially, we devised a procedure to identify and characterize infected cells by cell feature learning, and a machine-based CNN, a so called ViResNet. CNNs are accurate algorithms widely used in computer vision and image recognition (Berg et al., 2019). They separate signal from noise in a linear fashion and autonomously detect complex patterns in user-annotated data (LeCun et al., 2015). Deep learning algorithms then iterate thousands of samples and annotate features that are normally hidden to human analytics. The technology is robust and can be extended to clinical settings (De Fauw et al., 2018; Tomasev et al., 2019; Topol, 2019). Our ViResNets identified distinct phenotypes in HSV-1 or AdV infected nuclei. Both viruses affect the host chromatin, for example by enriching heterochromatin in the nuclear periphery (Aho et al., 2017; Lopez et al., 2008; Puvion-Dutilleul et al., 1998). To reveal the virus-specific nuclear signatures we used the live cell dye Hoechst 33342, a versatile bisbenzimide, commonly used in flow cytometry and fluorescence microscopy, for example to identify S-phase cells with duplicated genome contents. Bisbenzimides bind to double-stranded DNA by hydrophobic interactions with adenosine-thymidine rich regions without affecting HSV-1 or AdV infections, and they represent an ideal marker for live cell infections (Fornander et al., 2013; Latt and Wohlleb, 1975; Yakimovich et al., 2017). We demonstrate that deep learning can be readily applied at timepoints where virus-induced nuclear signatures become apparent. We expect that DNA-dyes combined with already trained ViResNet weights can be repurposed to other viruses in a procedure called transfer learning (Pan and Yang, 2010). This may then become applicable for example to polyomaviruses, which elicit distinct chromatin changes in the infected nuclei (Erickson et al., 2012). The timepoints of detection of nuclear phenotypes can be tuned to the particular virus, for example by performing timecourse experiments in fixed or live settings, in order to identify timepoints where nuclear features are particularly prominent. The procedure may also be adaptable to viral diagnostics, for example with chemically fixed clinical specimens. This may help to distinguish viral from bacterial infections and contribute to reducing inappropriate applications of antibiotics in viral infections.
AdV clusters and lytic egress
By using live cell fluorescence microscopy, we found that a fraction of the AdV-infected cells released clusters of GFP-V positive particles from the nucleus. Clusters of cytosolic virions were several micrometers in diameter and appeared 1–2 hr before they dispersed from the cells to the medium. EM analyses showed that the cytoplasmic clusters contained several hundred particles, often adjacent to broken-up NEs, and crystalline-like inclusions of viral proteins in the nucleus, akin to earlier observations (Franqueville et al., 2008). We speculate that the virion pseudocrystals are formed by phase separation in the nucleus in a coarsening process of interfacial area reduction, known as ‘Ostwald ripening’, in reference to the physical chemist W. Ostwald who first described the process (Ostwald, 1900). ‘Ostwald ripening’ involves the minimization of total interfacial energy between components and drives crystal growth from precipitate clusters in inorganic systems and organic crystals, such as tobacco mosaic virus (Malkin and McPherson, 1993; Voorhees, 1992).
The AdV pseudocrystals were eventually released from the cell implying a lytic process, a phenomenon which has also been observed in infected tissue (Guedan et al., 2010; Yakimovich et al., 2012). Notably, the plasma membrane ruptured after the NE broke apart indicating that these are independent events. We speculate that nuclear rupture releases the viral cysteine protease L3/p23 to the cytosol, and thereby enhances degradation of the cytoskeleton (Greber, 1998; Mangel and San Martin, 2014). The virion clusters dispersed in the extracellular medium and gave rise to infection of neighboring cells, most likely at a high multiplicity of virus particles. This is in agreement with the observation that viral transgene expression occurred just a couple of hours after lysis of the founder cell. Essentially all the cells that were observed to form a plaque within three to four days of infection are lytic infected, that is, they turn PI-positive shortly before spreading virus to neighboring cells (Georgi et al., 2020a; Yakimovich et al., 2012). The lytic viruses spread rapidly and give rise to fast growing comet-shaped plaques which overshadow the slow growing non-lytic plaques, and also the infected GFP-positive cells that do not form plaques. Non-lytic round shaped plaques have been observed upon suppression of the lytic pathway, or in limiting dilution experiments with a single plaque per well (Georgi et al., 2020a).
Towards understanding lytic AdV egress by CNNs
The lytic release of AdV from the nucleus involves the ADP, and possibly proteolysis of NE proteins (Chiou and White, 1998; Doronin et al., 2003; Georgi and Greber, 2020; Tollefson et al., 1996b; Ying and Wold, 2003). The underlying mechanisms are, however, unclear. ADP is a small protein with a single transmembrane segment and cytosolic C-terminal domain (Tollefson et al., 1996b). It is critical for nuclear lysis and the production of large viral plaques, and the overexpression of ADP from engineered AdV leads to enlarged plaques and enhanced cytopathic effects (Doronin et al., 2003; Lichtenstein et al., 2004). Our CNN procedures combined with low-invasive high-throughput time-lapse microscopy showed that lytic infected cells enriched the viral structural protein GFP-V in the nucleus at faster rates than non-lytic infected cells. The levels of GFP-V in lytic and non-lytic cells reached similar levels, suggesting that viral protein expression alone is not a discriminator of the lytic/non-lytic infection outcome. Upon experimental disruption of the NE by laser force, however, the lytic nuclei shrunk to greater extent and expelled their chromatin contents further to the cytoplasm than the non-lytic cells. The former implies that the NE and the peripheral chromatin of lytic cells are less stable than non-lytic cells. It can now be tested if, for example, critical components of peripheral heterochromatin are depleted in lytic cells, or if the nuclear membrane is destabilized. One possibility is that the LINC (linker of nucleoskeleton and cytoskeleton) complex in the NE connecting the cytoplasmic and the nuclear filaments is selectively impaired in lytic but not non-lytic infection (Crisp et al., 2006; Rothballer et al., 2013). Since the difference between the apparent macromolecular pressure between the nucleus and the cytoplasm was larger in the lytic cells than the non-lytic cells, it is also possible that proteins and nucleic acids in the nucleus exert osmotic pressure, which may be enhanced by host chromatin fragmentation and decompaction, or redistribution of proteins of the LINC complexes (Mazumder and Shivashankar, 2010; Rao et al., 1996; Skinner and Johnson, 2017). The molecular mechanisms of nuclear rupture can now be addressed by dissecting the interactions between lamin and inner nuclear membrane proteins, including those harboring LEM and SUN domains (Barton et al., 2015; Gerace and Tapia, 2018). In conclusion, our deep learning procedure is versatile and adaptable to other pathogens. It extends existing single cell analysis technology beyond infection studies in predicting specific infection phenotypes.
Limitations of the study
Our machine learning procedures identify AdV-C2, AdV-C5, and HSV-1 infected human lung epithelial A549 cells based on a fluorescent bisbenzimide derivative, which binds to double-stranded DNA. The procedures require distinct training data for AdVs and for HSV-1. We acknowledge that the baseline comparison of ViResNet to other methods may yield variable results, should one attempt to push each individual algorithm to its theoretical limit. We show that the procedure for AdVs is directly applicable to a range of different AdV-C2 genotypes, as well as AdV-C5, which replicate in the cell nucleus. To adapt the procedure to other cell types and viruses, the network requires retraining with hundreds to thousands of appropriate high-quality images providing ground truth. This is facilitated by broadly available high-content fluorescence microscopy, which readily allows the acquisition of thousands of images in an automated fashion. The adaptation to other cell types and viruses can be further enhanced by a procedure called ‘transfer learning’ (Pan and Yang, 2010). Together, these advances will ease the application of our machine learning procedures in viral diagnostics of chemically fixed clinical specimens, provided that appropriate training samples are available, and transfer learning procedures implemented.
STAR★methods
Key resources table
| REAGENT or RESOURCE | SOURCE | IDENTIFIER |
|---|---|---|
| Antibodies | ||
| α-pan-AdV hexon antibody | Sigma-Aldrich | Cat#MAB8052; RRID:AB_95243 |
| α-mouse Alexa594 | Abcam | Cat#ab150116; RRID:AB_2650601 |
| Bacterial and virus strains | ||
| AdV-C2 | (Imelli et al., 2009) | N/A |
| AdV-C2-dE3B-GFP | (Yakimovich et al., 2012) | N/A |
| AdV-C2-dE3B-GFP-dADP | This paper | N/A |
| AdV-C2-GFP-V | (Puntener et al., 2011) | N/A |
| AdV-C5-IX-FS2A-GFP | Provided by S. Hemmi (University of Zürich, Switzerland) | N/A |
| HSV-1-GFP C12 expressing GFP from the major CMV promoter | Provided by S. Efstathiou (Cambridge, UK) (Glauser et al., 2010) |
N/A |
| HSV-1-VP16-GFP | Provided by Y. Yamauchi (Yamauchi et al., 2008a) | N/A |
| Chemicals, peptides, and recombinant proteins | ||
| Hoechst 33342 | Sigma-Aldrich | Cat#B2261 |
| Draq7 | Abcam | Cat#ab109202 |
| Propidium iodide solution | Sigma-Aldrich | Cat#P4864 |
| Datasets | ||
| VirResNet training sets | This paper | https://gitlab.com/vardan.andriasyan/virusnuc/-/raw/master/datasets.tar.gz |
| Experimental models: cell lines | ||
| Human lung carcinoma (HLC)-A549 cells | ATCC | ATCC CCL-185 |
| HeLa--mCherry | (Held et al., 2010) | N/A |
| Software and algorithms | ||
| ViResNet | This paper | https://github.com/viresnet |
| ViresNet Demo | This paper | https://bit.ly/ViResNet |
| ViResNetML Demo | This paper | https://bit.ly/ViResNetML |
| Anaconda Python v3.7.3 | Continuum Analytics | https://www.anaconda.com/distribution/ |
| Keras v2.2.4 | Keras | http://keras.io |
| Scikit-learn 0.24.1 | (Pedregosa et al., 2011) | https://scikit-learn.org/ |
| ResNet | (He et al., 2016) | N/A |
| TensorFlow | Google Brain Team | https://www.tensorflow.org |
| Fiji | (Schindelin et al., 2012) | https://fiji.sc/ |
| ImageJ | https://imagej.nih.gov/ij/ | |
| Trackmate plugin | (Tinevez et al., 2017) | https://imagej.net/TrackMate |
| Trackpy library v0.3.2 | Trackpy | https://soft-matter.github.io/trackpy/v0.3.2/ |
| CellProfiler | (Carpenter et al., 2006) | http://cellprofiler.org |
| Plaque 2.0 | (Yakimovich et al., 2015) | http://plaque2.github.io |
| Arivis Vision4D | Arivis AG | https://www.arivis.com |
| Other | ||
| Nvidia GeForce GTX 1080 Ti GPU | Nvidia | N/A |
| Automated high-throughput widefield fluorescence microscope IXM-XL | Molecular Devices | N/A |
| Automated high-throughput confocal fluorescence microscope IXM-C | Molecular Devices | N/A |
| TCS SP8 multiphoton microscope equipped with DS+ Dual (680-1300 nm & 1041nm) ultrafast NIR laser | Leica | N/A |
Resource availability
Lead contact
Further information and requests for resources and reagents should be directed to and will be fulfilled by the lead contacts, Prof. Dr. Urs Greber (urs.greber@uzh.ch) and Dr. Vardan Andriasyan (vardan.andriasyan@uzh.ch).
Materials availability
This study did not generate new unique reagents.
Data and code availability
Our ViResNet works by object segmentation, and expressive capacity adaptation through residual nodes which allows to learn object features without overfitting of the data. We present an empirical procedure for exploratory data analyses. ViResNet50 network provides trained sets of weights of nuclear features based on fluorescence images to identify and classify infected cells. All the code is available at (https://github.com/viresnet/).
Specifically, the user is provided with detailed guidelines to applying the methods and procedures developed here. A general demo is available at https://bit.ly/ViResNet. A user type interface demonstrates the capability and power of the ViResNet network for analyses of virus infection phenotypes. The user requires a Google account, and provides a link to his / her image data of interest. The user loads and segments own images and uses our trained data sets to identify features of infected cell nuclei, such as infection phenotypes.
The program is described as a Jupiter notebook, and can be run off-line, if the ViResNet libraries are downloaded and installed on a local machine. The user can adjust the network structure on demand. This is possible using the neural network training pipeline at: https://bit.ly/ViResNetML.
This link provides a path for retraining and fine-tuning the ViResNet, in particular focusing on morphological features of the nucleus recorded by fluorescence microscopy. To interpret the resulting data, the ground truth is required, in this case the knowledge of the infection status of a cell. The training datasets (about 200 mb) are available in a packed/archived format on gitlab repository (https://gitlab.com/vardan.andriasyan/virusnuc/-/raw/master/datasets.tar.gz), together with the example images. The raw datasets of approximately 8 tb, can be made available on demand.
Experimental model and subject details
Cell culture
Human lung carcinoma A549-ATCC cells were cultivated in a T75 flask and incubated at 37°C, 5% CO2 and 95 % humidity (standard conditions) in DMEM supplemented with 8% FCS, 1% P/S and 1% L-glutamine. The culture was passaged by splitting 1:10 twice per week. The old medium was removed, cells were washed with PBS and briefly soaked in 1.5 ml trypsin (Sigma-Aldrich) and incubated at 37°C for 3 min. Trypsin was inactivated by adding fresh medium, the cells were resuspended and seeded in new flasks. Hela cells stably expressing histone H2B-mCherry were kindly obtained from Daniel Gerlich (Held et al., 2010).
Viruses
AdV-C2-dE3B-GFP, AdV-C2-GFP-V and AdV-C5-dE1-GFP were grown as described (Nagel et al., 2003; Puntener et al., 2011; Yakimovich et al., 2012). AdV-C5-IX-FS2A-GFP was kindly provided by S. Hemmi (University of Zürich, Switzerland). HSV-1-VP16-GFP and HSV-1-C12 viruses were kindly provided by C. Fraefel (University of Zürich, Switzerland) and Y. Yamauchi (University of Bristol, United Kingdom), respectively (Crameri et al., 2018; Glauser et al., 2010; Yamauchi et al., 2008b). AdV-C2-dE3B-dADP was generated using two recombineering steps (Imelli et al., 2009; Warming et al., 2005; Yakimovich et al., 2012). At first, the GalK cassette was introduced into pKSB2-AdV-C2-dE3B-GFP to replace the ADP sequence. The GalK cassette was amplified using the forward primer 5’- ACTGCAAATTTGATCAAACCCAGCTTCAGCTTGCCTGCTCCAGAGcctgttgacaattaatcatcggca-3’ and the reverse primer 5’- GAACTAATGACCCCGTAATTGATTACTATTAATAACTAGTCTCATctcagcactgtcctgctcctt -3’ introducing 45 nucleotides of flanking sequences. Subsequently, the GalK sequence was replaced with a dsDNA of the sequence actgcaaatttgatcaaacccagcttcagcttgcctgctccagagatgagactagttattaatagtaatcaattacggggtcattagttc resulting in deletion of ADP. To generate infectious virus, circular pKSB2-AdV-C2_dE3B_GFP_dADP was transfected in human 911 cells stably expressing I-SceI endonuclease (Ibanes and Kremer, 2013) using the JetPEI transfection reagent (Polyplus transfection, Illkirch-Graffenstaden, France). Constitutive I-SceI expression in these cells was accomplished following transduction with MLV-ER-I-SceI-HA, which encodes a form of the endonuclease that can be translocated to the nucleus upon treatment with 4-OH-tamoxifen 3h post transfection (Courilleau et al., 2012). Cells were selected in medium containing puromycin at 1 μg/ml and bulk cultures were expanded under selection conditions. I-SceI expression was confirmed by Western blotting of whole cell lysates using the anti-HA antibody (HA.11 clone 16B12, Covance). Resulting recombinant AdV-C2-dE3B-dADP was plaque-purified and amplified, followed by two rounds of CsCl purification (Prasad et al., 2014). Loss of ADP expression was confirmed by Western blot using the rabbit α-ADP78-93 antibody and immunofluorescence staining using the rabbit α-ADP87-101 antibody, both kindly supplied by William Wold (Saint-Louis University, Saint-Louis, USA, Doronin et al., 2003).
Method details
Live-cell microscopy of AdV-C2-GFP-V
Live-cell laser scanning fluorescence microscopy was conducted with an inverted Leica SP5 confocal microscope (Leica Microsystems) equipped with a 63x (oil immersion, NA 1.4) objective, a diode laser (405 nm excitation), an argon laser (458/476/488/496/514 nm excitation), a helium laser (561/594/633 nm excitation) and a humidified chamber at 37°C and 5% CO2. HeLa cells stably expressing H2B-mCherry (Held et al., 2010) were plated at 25% confluency onto 35 mm glass bottom microwell dishes (Thermo Fisher), and cells allowed to adhere overnight, followed by infection with AdV-C2-GFP-V (0.8 μg/dish) for 24 h. Image stacks were recorded every 15 min for 21.5 h and processed with ImageJ. From 8 movies, cell lysis events identified based on loss of GFP-V were determined and plotted against total numbers of infected cells as judged by the expression of GFP-V.
Time-lapse live cell imaging for machine learning infection phenotypes
A549 cells were seeded in 100 μl per well into 96-well plates (Greiner Bio-One) to achieve 70% confluency and incubated at standard conditions. The next day, cells were inoculated with virus in full medium for 30 min. The cells were washed with PBS and 100 μl imaging medium added (phenol red-free DMEM supplemented with nuclear dyes Hoechst (250 ng/ml) and propidium iodide (100 ng/ml)). The cells were monitored every 1.75 h for 4 days on an automated high-throughput fluorescence confocal microscope (IXM-C, Molecular Devices) using a 20x air objective. In each well, 36 sites were acquired to cover 85% of the well area. At each time point, the final image was generated by maximum projection of 8 slices of the sample spanning 30 μm along the Z-axis.
To identify and classify the features characteristic for AdV lytic and nonlytic infection, a time-lapse experiment was performed in A549 cells. Cells were inoculated with AdV-C2-GFP-V for 1 h at 37°C, washed with PBS and incubated in 100 μl imaging medium (phenol red-free DMEM supplemented with Hoechst (250 ng/ml) and propidium iodide (100 ng/ml). Hoechst was used as nuclear dye, the nuclear dye propidium iodide to indicate cell lysis as described earlier (Puntener et al., 2011; Yakimovich et al., 2012, 2015), except that here a less invasive high-throughput spinning disc confocal microscopy protocol was used (IXM-C, Molecular Devices). The cells were monitored every 1-2 hours for 4 days, and images were acquired using a 20x air objective. At each time point, an image was computed using a maximum projection of 8 optical slices spanning across 30 μm along the Z-axis. The projected images were loaded into Fiji image processing environment (Schindelin et al., 2012), and infected nuclei centroids tracked utilizing the Trackmate plugin (Tinevez et al., 2017) and the Python-based Trackpy library (https://soft-matter.github.io/trackpy/v0.3.2/). The derived tracks were curated either as spreading or nonspreading infected cells depending on presence or absence of the propidium iodide staining at later time points of infection. As the tracks only contain information about the centroid of the nuclei and not the entire segmented nuclei, additional segmentation was performed using custom segmentation pipeline implemented in python (https://github.com/viresnet/). Using the acquired segmentation mask, the average intensities and standard deviations were calculated.
Training dataset preparation and machine learning
ViResNet is based on the published state-of-the-art convolutional neural network (CNN) for image recognition (ResNet-50) (He et al., 2016). It utilizes the Python programming language high-level deep learning library Keras (https://keras.io/) and Tensorflow (Abadi et al., 2016). The ViResNet architecture contains 50 residual learning building blocks, in total 177 layers and 23587712 parameters. The architecture was modified by substituting the last layer with a custom head, containing average pooling, dense, dropout layers followed by a final 2 or 3 dimensional feedforward layer with sigmoid or softmax activation functions, respectively, depending on whether the network was intended to classify infected/not infected nuclei or spreading/nonspreading/not infected nuclei. The training sets acquired by fluorescence microscopy were augmented and expanded (random rotations, shifts, flips) using tools provided by the Keras library. Training set images for ViResNets classification of nuclei in HSV-1 and AdV-C2 infected cells were based on the nuclear Hoechst signals of AdV-dE3B-GFP, AdV-dE3B-GFP-dADP, AdV-C2-GFP-V, AdV-C2 and HSV-1-C12/HSV-VP16 infected cells, and also uninfected cells. Images were acquired at 48 and 72 h pi for AdV-C2 and 24 and 48 h pi for HSV-1. These datasets totaled 2000 images per class and per virus. Training set images for predicting spreader and nonspreader phenotypes using ViResNet were comprised the nuclear Hoechst signals of AdV-dE3B-GFP, AdV-dE3B-GFP-dADP and AdV-C2-GFP-V infected cells. Images of infected cell nuclei with known fate acquired at 16-36 h pi for AdV-dE3B-GFP and 28-48 h pi for AdV-C2-GFP-V were employed. This dataset totaled at 2000 images per condition. Timepoints for both ‘infection’ and ‘no infection’ classification and spreader/nonspreader/not infection prediction were chosen based on known approximate virus lifecycle times and visual assessment of disruption of Hoechst nuclear signal. All resulting datasets were split 75/20/5 percent for training, validation and testing sets, respectively. To provide sufficient data for the training, the training datasets were extended using random augmentations of images, such as rotations and flips. All images were down-scaled to 224x224 pixels and converted to 3-channel RGB 8-bit in order to correspond to the ViResNet architecture input layer. The grayscale to 3-channel conversion was done by duplicating the original grayscale image into red, green and blue channels. During the initial step of training transfer learning was performed by first initializing the base ResNet-50 model with the pre-trained ResNet-50 weights for ImageNet competition. Then all layers of the base model were frozen and training was only performed on the head part of the network. After accuracy reached saturation the training was stopped, and additional fine tuning was performed. This was done by iteratively unfreezing residual block layers of the base ResNet-50 model. This process was repeated until highest possible accuracy and lowest possible loss were obtained. ‘Adam optimizer’ was employed using the default values (Kingma and Ba, 2014). The learning rate was set to 10-6 with a decay of 10-7. Training was performed in batches of 32 images. The source code is available at https://github.com/viresnet/.
To further assess the performance of ViResNet, we compared it with classical machine learning methods, SVM, k-NN and decision tree algorithms. The input images were kept the same as used for ViResNet training without further feature engineering. We utilized the implementations provided by the well-established python ‘Scikit-learn’ library (Pedregosa et al., 2011). The parameters for SVM were initialized with a linear kernel, ‘Squared_Hinge’ loss function and ‘Cramer_Singer’ multiclass strategy. The training was performed until saturation of accuracy value was reached (∼1000 iterations). K-NN was run as a ‘brute-force’ search, with 10 neighbors and ‘Minkowski’ distance metric. Decision tree was initialized with ‘Gini’ criterion, and other parameters were left with their default values. All hyperparameters were optimized heuristically, for example by iterative changing of the learning rate.
Laser ablation of infected cells and quantification of volume change after ablation
A549 cells were seeded on a glass bottom 35 mm petri dish (WPI, FlouroDish) and infected the next day with AdV-C2-GFP-V to achieve 20% infected cells. 24 h pi, the full medium was exchanged to full medium supplemented with Hoechst (250 ng/ml). Both imaging and laser ablation were performed on a TCS SP8 multiphoton microscope (Leica) using an Insight DS+ Dual (680-1,300 nm & 1,041 nm) ultrafast NIR laser tuned to 800 nm and operating at 1% of its maximal power of 1.3 W. Ablation was conducted at 20% of the maximal power at 36 h pi. Prior to ablation, a Z-stack was acquired in both nuclear and viral channels, which was then fed into a custom Python tool. The script generated a maximum projection and fed it into the pre-trained CNN to predict the future lytic or nonlytic phenotype. After the ablation, the Hoechst signal of the nuclei was imaged every minute up to 5. The acquired Z-stacks were segmented into nuclear and exerted material volumes using Arivis and Fiji software packages (Schindelin et al., 2012).
Electron microscopy analyses
Human embryonic retinoblast 911 cells (Fallaux et al., 1996) were grown in 10 cm culture dishes to 70% confluency and infected with AdV-C2 or AdV-C2-GFP-V at an MOI of 1 for 40 h. Cells were fixed in glutaraldehyde, detached from the dish, embedded in Epon resin, ultrathin sectioned and analyzed by electron microscopy (EM) as described (Gastaldelli et al., 2008).
Quantification and statistical analysis
Quantification of spreader ratio
To quantify the plaque formation efficacy, the number of infected cells at the end of the first round of infection and the number of plaques developed in the subsequent infection cycles were assessed. AdVs and HSV were titrated on A549 ATCC cells. Monolayers of 15,000 cells per well were seeded in 96-well plates (Greiner Bio-One) in 100 μl medium. The next day, virus stocks were diluted 1:10,000, followed by a 1:2 serial dilution in full medium. The cell supernatant was removed and 100 μl virus dilution or full medium were added. Following 30 min of incubation at 37°C, the supernatant was replaced by 100 μl fresh full medium for endpoint measurements (AdV-C2-GFP-V) or fresh live cell imaging medium (phenol red-free DMEM supplemented with 8% FCS, 1% P/S, 1% L-glutamine, 250 ng/ml Hoechst 33342 (Sigma-Adrich) and 3 μM DRAQ7 (Abcam). The cells were incubated at standard conditions.
For endpoint immunofluorescent quantification of AdV-C2-GFP-V, two separate plates were infected and fixed in 4% PFA supplemented with 6 μg/ml Hoechst 33342 at the indicated time points, followed by staining with the mouse α-AdV-C2 hexon antibody (MAB8052, Sigma-Adrich) and α-mouse Alexa594 (ab150116, Abcam) prior to imaging. Imaging at the indicated time points was performed on an automated high-throughput fluorescence microscope (IXM-XL or IXM-C, Molecular Devices) using a 4x objective at widefield mode.
The number of infected cells and the number of plaques in a well were scored using the Plaque 2.0 software (Yakimovich et al., 2015). The detection of infected cells was verified using CellProfiler (Carpenter et al., 2006). Virus dilutions were chosen such that well emerging plaques were well separated and could be unequivocally assessed. The following time points for first and second replication cycles were used: AdV-C2-dE3B-GFP 48 and 76 h post infection (pi), AdV-C2-GFP-V 48 and 78 h pi, AdV-C2-dE3B-GFP-dADP, and AdV-C5-dE1-GFP 48 and 72 h pi, HSV-1-GFP 14 and 27 h pi, respectively. Spreader ratios were calculated for each well by dividing the plaque number (second replication cycle) by the number of infected cells (first round of replication) multiplied by 100.
Quantification and tracking of live infected cells
The acquired image projections were loaded into the Fiji image processing environment (Schindelin et al., 2012), and infected nuclei centroids were tracked utilizing the Trackmate plugin (Tinevez et al., 2017) and Python-based Trackpy library (https://soft-matter.github.io/trackpy/v0.3.2/). The derived tracks were labeled either as spreading or nonspreading, depending on presence or absence of the propidium iodide staining. As the tracks only contain information about the centroid of the nuclei and not the entire segmented nuclei, additional segmentation was performed using customized Python segmentation functionality. Using the acquired segmentation mask, the average intensities and standard deviations were calculated.
Additional resources
Detailed guidelines to applying the methods and procedures developed here as well as a demo are available at https://bit.ly/ViResNet.
Acknowledgments
We thank Silvio Hemmi for generating AdV-C2-dE3B-GFP-dADP, Ivo Sbalzarini and Thomas Greber for fruitful discussions. Nicole Meili, Melanie Grove, Corinne Wilhelm, and Karin Boucke are acknowledged for expert help with tissue culture and electron microscopy. The work was supported by a grant from the Swiss National Foundation, Switzerland to UFG (31003A_179256/1), a Sinergia grant from the Swiss National Foundation, Switzerland to UFG (CRSII5_170929/1), and the Kanton of Zürich.
Author contributions
Coordinated the study: U.F.G. Conceived and designed the experiments: V.A., A.Y., F.G., D.P., and U.F.G. Performed the experiments: V.A., F.G., A.P., R.W., and D.P. Analyzed the data: V.A., F.G., A.Y., D.P., and U.F.G. Performed training and designing the CNN: V.A. Contributed reagents, materials, analysis tools: D.P., V.A., F.G., A.P., and A.Y. Wrote the paper: V.A., A.Y., A.P., F.G., and U.F.G.
Declaration of interests
The authors declare no competing interests.
Published: June 25, 2021
Footnotes
Supplemental information can be found online at https://doi.org/10.1016/j.isci.2021.102543.
Supplemental information
HeLa cells stably expressing H2B-mCherry were infected with AdV-C2-GFP-V at MOI 0.2 and recorded by live cell confocal fluorescence microscopy from 24 to 45 hr pi at 15 min intervals. Merged pseudo-colored maximum projections are shown with GFP-V in green and H2B-mCherry in red. Dispersion of GFP-V clusters from the nucleus into a confined cytoplasmic region around the nucleus (see cell in the center of the video) 35:45–38:30 hr:min pi. Note that the clusters and nuclear GFP-V signals disappear almost completely while the GFP-V signal in non-lytic infected cells persists.
HeLa cells stably expressing H2B-mCherry were infected with AdV-C2-GFP-V at MOI 0.2 and recorded by live cell confocal fluorescence microscopy from 24 to 45 hr pi at 15 min intervals. Merged pseudo-colored maximum projections are shown with GFP-V in green and H2B-mCherry in red. Loss of GFP-V clusters from AdV-C2-GFP-V-infected cell nuclei.
Infection is visualized by the virus expressing VP-16-GFP fusion protein (green), nuclei are stained with Hoechst (blue), and lysed cells are stained with PI (red).
References
- Abadi M., Agarwal A., Barham P., Brevdo E., Chen Z., Citro C., Corrado G., Davis A., Dean J., Devin M. TensorFlow: large-scale machine learning on heterogeneous distributed systems. arXiv. 2016 arXiv:1603.04467. [Google Scholar]
- Aho V., Myllys M., Ruokolainen V., Hakanen S., Mantyla E., Virtanen J., Hukkanen V., Kuhn T., Timonen J., Mattila K. Chromatin organization regulates viral egress dynamics. Sci. Rep. 2017;7:3692. doi: 10.1038/s41598-017-03630-y. [DOI] [PMC free article] [PubMed] [Google Scholar]
- Barton L.J., Soshnev A.A., Geyer P.K. Networking in the nucleus: a spotlight on LEM-domain proteins. Curr. Opin. Cell Biol. 2015;34:1–8. doi: 10.1016/j.ceb.2015.03.005. [DOI] [PMC free article] [PubMed] [Google Scholar]
- Belov G.A. Dynamic lipid landscape of picornavirus replication organelles. Curr. Opin. Virol. 2016;19:1–6. doi: 10.1016/j.coviro.2016.05.003. [DOI] [PMC free article] [PubMed] [Google Scholar]
- Berg S., Kutra D., Kroeger T., Straehle C.N., Kausler B.X., Haubold C., Schiegg M., Ales J., Beier T., Rudy M. ilastik: interactive machine learning for (bio)image analysis. Nat. Methods. 2019;16:1226–1232. doi: 10.1038/s41592-019-0582-9. [DOI] [PubMed] [Google Scholar]
- Berk A.J. Adenoviridae: the viruses and their replication. In: Knipe D.M., Howley P.M., editors. Fields Virology. Lippincott Williams & Wilkins; 2013. pp. 1704–1731. [Google Scholar]
- Bigalke J.M., Heldwein E.E. Nuclear Exodus: herpesviruses lead the way. Annu. Rev. Virol. 2016;3:387–409. doi: 10.1146/annurev-virology-110615-042215. [DOI] [PMC free article] [PubMed] [Google Scholar]
- Blissard G.W., Theilmann D.A. Baculovirus entry and egress from insect cells. Annu. Rev. Virol. 2018;5:113–139. doi: 10.1146/annurev-virology-092917-043356. [DOI] [PubMed] [Google Scholar]
- Boulo S., Akarsu H., Ruigrok R.W., Baudin F. Nuclear traffic of influenza virus proteins and ribonucleoprotein complexes. Virus Res. 2007;124:12–21. doi: 10.1016/j.virusres.2006.09.013. [DOI] [PubMed] [Google Scholar]
- Burckhardt C.J., Suomalainen M., Schoenenberger P., Boucke K., Hemmi S., Greber U.F. Drifting motions of the adenovirus receptor CAR and immobile integrins initiate virus uncoating and membrane lytic protein exposure. Cell Host Microbe. 2011;10:105–117. doi: 10.1016/j.chom.2011.07.006. [DOI] [PubMed] [Google Scholar]
- Carpenter A.E., Jones T.R., Lamprecht M.R., Clarke C., Kang I.H., Friman O., Guertin D.A., Chang J.H., Lindquist R.A., Moffat J. CellProfiler: image analysis software for identifying and quantifying cell phenotypes. Genome Biol. 2006;7:R100. doi: 10.1186/gb-2006-7-10-r100. [DOI] [PMC free article] [PubMed] [Google Scholar]
- Chenouard N., Smal I., de Chaumont F., Maska M., Sbalzarini I.F., Gong Y., Cardinale J., Carthel C., Coraluppi S., Winter M. Objective comparison of particle tracking methods. Nat. Methods. 2014;11:281–289. doi: 10.1038/nmeth.2808. [DOI] [PMC free article] [PubMed] [Google Scholar]
- Chiou S.K., White E. Inhibition of ICE-like proteases inhibits apoptosis and increases virus production during adenovirus infection. Virology. 1998;244:108–118. doi: 10.1006/viro.1998.9077. [DOI] [PubMed] [Google Scholar]
- Christiansen E.M., Yang S.J., Ando D.M., Javaherian A., Skibinski G., Lipnick S., Mount E., O'Neil A., Shah K., Lee A.K. In silico labeling: predicting fluorescent labels in unlabeled images. Cell. 2018;173:792–803.e19. doi: 10.1016/j.cell.2018.03.040. [DOI] [PMC free article] [PubMed] [Google Scholar]
- Courilleau C., Chailleux C., Jauneau A., Grimal F., Briois S., Boutet-Robinet E., Boudsocq F., Trouche D., Canitrot Y. The chromatin remodeler p400 ATPase facilitates Rad51-mediated repair of DNA double-strand breaks. J. Cell Biol. 2012;199:1067–1081. doi: 10.1083/jcb.201205059. [DOI] [PMC free article] [PubMed] [Google Scholar]
- Crameri M., Bauer M., Caduff N., Walker R., Steiner F., Franzoso F.D., Gujer C., Boucke K., Kucera T., Zbinden A. MxB is an interferon-induced restriction factor of human herpesviruses. Nat. Commun. 2018;9:1980. doi: 10.1038/s41467-018-04379-2. [DOI] [PMC free article] [PubMed] [Google Scholar]
- Crisp M., Liu Q., Roux K., Rattner J.B., Shanahan C., Burke B., Stahl P.D., Hodzic D. Coupling of the nucleus and cytoplasm: role of the LINC complex. J. Cell Biol. 2006;172:41–53. doi: 10.1083/jcb.200509124. [DOI] [PMC free article] [PubMed] [Google Scholar]
- Cullen B.R. Nuclear mRNA export: insights from virology. Trends Biochem. Sci. 2003;28:419–424. doi: 10.1016/S0968-0004(03)00142-7. [DOI] [PubMed] [Google Scholar]
- Daniels R., Sadowicz D., Hebert D.N. A very late viral protein triggers the lytic release of SV40. PLoS Pathog. 2007;3:e98. doi: 10.1371/journal.ppat.0030098. [DOI] [PMC free article] [PubMed] [Google Scholar]
- De Fauw J., Ledsam J.R., Romera-Paredes B., Nikolov S., Tomasev N., Blackwell S., Askham H., Glorot X., O'Donoghue B., Visentin D. Clinically applicable deep learning for diagnosis and referral in retinal disease. Nat. Med. 2018;24:1342–1350. doi: 10.1038/s41591-018-0107-6. [DOI] [PubMed] [Google Scholar]
- Dechter R. C.S.D. University of California, Cognitive Systems Laboratory; 1986. Learning while Searching in Constraint-Satisfaction Problems.http://www.aaai.org/Papers/AAAI/1986/AAAI86-029.pdf [Google Scholar]
- Delgado T., Carroll P.A., Punjabi A.S., Margineantu D., Hockenbery D.M., Lagunoff M. Induction of the Warburg effect by Kaposi's sarcoma herpesvirus is required for the maintenance of latently infected endothelial cells. Proc. Natl. Acad. Sci. U S A. 2010;107:10696–10701. doi: 10.1073/pnas.1004882107. [DOI] [PMC free article] [PubMed] [Google Scholar]
- den Boon J.A., Diaz A., Ahlquist P. Cytoplasmic viral replication complexes. Cell Host Microbe. 2010;8:77–85. doi: 10.1016/j.chom.2010.06.010. [DOI] [PMC free article] [PubMed] [Google Scholar]
- Doronin K., Toth K., Kuppuswamy M., Krajcsi P., Tollefson A.E., Wold W.S. Overexpression of the ADP (E3-11.6K) protein increases cell lysis and spread of adenovirus. Virology. 2003;305:378–387. doi: 10.1006/viro.2002.1772. [DOI] [PubMed] [Google Scholar]
- Erickson K.D., Bouchet-Marquis C., Heiser K., Szomolanyi-Tsuda E., Mishra R., Lamothe B., Hoenger A., Garcea R.L. Virion assembly factories in the nucleus of polyomavirus-infected cells. PLoS Pathog. 2012;8:e1002630. doi: 10.1371/journal.ppat.1002630. [DOI] [PMC free article] [PubMed] [Google Scholar]
- Everett R.D., Parada C., Gripon P., Sirma H., Orr A. Replication of ICP0-null mutant herpes simplex virus type 1 is restricted by both PML and Sp100. J. Virol. 2008;82:2661–2672. doi: 10.1128/JVI.02308-07. [DOI] [PMC free article] [PubMed] [Google Scholar]
- Falk T., Mai D., Bensch R., Cicek O., Abdulkadir A., Marrakchi Y., Bohm A., Deubner J., Jackel Z., Seiwald K. U-Net: deep learning for cell counting, detection, and morphometry. Nat. Methods. 2019;16:67–70. doi: 10.1038/s41592-018-0261-2. [DOI] [PubMed] [Google Scholar]
- Fallaux F.J., Kranenburg O., Cramer S.J., Houweling A., Van Ormondt H., Hoeben R.C., Van Der Eb A.J. Characterization of 911: a new helper cell line for the titration and propagation of early region 1-deleted adenoviral vectors. Hum. Gene Ther. 1996;7:215–222. doi: 10.1089/hum.1996.7.2-215. [DOI] [PubMed] [Google Scholar]
- Fisch D., Yakimovich A., Clough B., Wright J., Bunyan M., Howell M., Mercer J., Frickel E. Defining host-pathogen interactions employing an artificial intelligence workflow. eLife. 2019;8:e40560. doi: 10.7554/eLife.40560. [DOI] [PMC free article] [PubMed] [Google Scholar]
- Fornander L.H., Wu L., Billeter M., Lincoln P., Norden B. Minor-groove binding drugs: where is the second Hoechst 33258 molecule? J. Phys. Chem. B. 2013;117:5820–5830. doi: 10.1021/jp400418w. [DOI] [PubMed] [Google Scholar]
- Franqueville L., Henning P., Magnusson M., Vigne E., Schoehn G., Blair-Zajdel M.E., Habib N., Lindholm L., Blair G.E., Hong S.S. Protein crystals in Adenovirus type 5-infected cells: requirements for intranuclear crystallogenesis, structural and functional analysis. PLoS One. 2008;3:e2894. doi: 10.1371/journal.pone.0002894. [DOI] [PMC free article] [PubMed] [Google Scholar]
- Gastaldelli M., Imelli N., Boucke K., Amstutz B., Meier O., Greber U.F. Infectious adenovirus type 2 transport through early but not late endosomes. Traffic. 2008;9:2265–2278. doi: 10.1111/j.1600-0854.2008.00835.x. [DOI] [PubMed] [Google Scholar]
- Gazzola M., Burckhardt C.J., Bayati B., Engelke M., Greber U.F., Koumoutsakos P. A stochastic model for microtubule motors describes the in vivo cytoplasmic transport of human adenovirus. PLoS Comput. Biol. 2009;5:e1000623. doi: 10.1371/journal.pcbi.1000623. [DOI] [PMC free article] [PubMed] [Google Scholar]
- Georgi F., Andriasyan V., Witte R., Murer L., Hemmi S., Yu L., Grove M., Meili N., Kuttler F., Yakimovich A. The FDA-approved drug Nelfinavir inhibits lytic cell-free, but not cell-associated non-lytic transmission of human adenovirus. Antimicrob. Agents Chemother. 2020;64:e01002–e01020. doi: 10.1128/AAC.01002-20. [DOI] [PMC free article] [PubMed] [Google Scholar]
- Georgi F., Greber U.F. The Adenovirus Death Protein - a small membrane protein controls cell lysis and disease. FEBS Lett. 2020;594:1861–1878. doi: 10.1002/1873-3468.13848. [DOI] [PubMed] [Google Scholar]
- Georgi F., Kuttler F., Murer L., Andriasyan V., Witte R., Yakimovich A., Turcatti G., Greber U.F. A high-content image-based drug screen of clinical compounds against cell transmission of adenovirus. Sci. Data. 2020;7:265. doi: 10.1038/s41597-020-00604-0. [DOI] [PMC free article] [PubMed] [Google Scholar]
- Gerace L., Tapia O. Messages from the voices within: regulation of signaling by proteins of the nuclear lamina. Curr. Opin. Cell Biol. 2018;52:14–21. doi: 10.1016/j.ceb.2017.12.009. [DOI] [PMC free article] [PubMed] [Google Scholar]
- Glauser D.L., Seyffert M., Strasser R., Franchini M., Laimbacher A.S., Dresch C., de Oliveira A.P., Vogel R., Buning H., Salvetti A. Inhibition of herpes simplex virus type 1 replication by adeno-associated virus rep proteins depends on their combined DNA-binding and ATPase/helicase activities. J. Virol. 2010;84:3808–3824. doi: 10.1128/JVI.01503-09. [DOI] [PMC free article] [PubMed] [Google Scholar]
- Gooding L.R., Elmore L.W., Tollefson A.E., Brady H.A., Wold W.S. A 14,700 MW protein from the E3 region of adenovirus inhibits cytolysis by tumor necrosis factor. Cell. 1988;53:341–346. doi: 10.1016/0092-8674(88)90154-7. [DOI] [PubMed] [Google Scholar]
- Greber U.F. Virus assembly and disassembly: the adenovirus cysteine protease as a trigger factor. Rev. Med. Virol. 1998;8:213–222. doi: 10.1002/(sici)1099-1654(1998100)8:4<213::aid-rmv225>3.0.co;2-w. [DOI] [PubMed] [Google Scholar]
- Greber U.F. Adenoviruses - infection, pathogenesis and therapy. FEBS Lett. 2020;594:1818–1827. doi: 10.1002/1873-3468.13849. [DOI] [PubMed] [Google Scholar]
- Greber U.F., Arnberg N., Wadell G., Benko M., Kremer E.J. Adenoviruses - from pathogens to therapeutics: a report on the 10th International adenovirus meeting. Cell Microbiol. 2013;15:16–23. doi: 10.1111/cmi.12031. [DOI] [PubMed] [Google Scholar]
- Greber U.F., Flatt J.W. Adenovirus entry: from infection to immunity. Annu. Rev. Virol. 2019;6:177–197. doi: 10.1146/annurev-virology-092818-015550. [DOI] [PubMed] [Google Scholar]
- Grimm K.S., Klupp B.G., Granzow H., Muller F.M., Fuchs W., Mettenleiter T.C. Analysis of viral and cellular factors influencing herpesvirus-induced nuclear envelope breakdown. J. Virol. 2012;86:6512–6521. doi: 10.1128/JVI.00068-12. [DOI] [PMC free article] [PubMed] [Google Scholar]
- Guedan S., Rojas J.J., Gros A., Mercade E., Cascallo M., Alemany R. Hyaluronidase expression by an oncolytic adenovirus enhances its intratumoral spread and suppresses tumor growth. Mol. Ther. 2010;18:1275–1283. doi: 10.1038/mt.2010.79. [DOI] [PMC free article] [PubMed] [Google Scholar]
- Hatch E.M. Nuclear envelope rupture: little holes, big openings. Curr. Opin. Cell Biol. 2018;52:66–72. doi: 10.1016/j.ceb.2018.02.001. [DOI] [PMC free article] [PubMed] [Google Scholar]
- He K., Zhang X., Ren S., Sun J. Deep residual learning for image recognition. arXiv. 2015 1512.03385. [Google Scholar]
- He, K., Zhang, X., Ren, S., and Sun, J. (2016). Deep residual learning for image recognition. Paper presented at: 2016 IEEE Conference on Computer Vision and Pattern Recognition (CVPR) (IEEE).
- Held M., Schmitz M.H., Fischer B., Walter T., Neumann B., Olma M.H., Peter M., Ellenberg J., Gerlich D.W. CellCognition: time-resolved phenotype annotation in high-throughput live cell imaging. Nat. Methods. 2010;7:747–754. doi: 10.1038/nmeth.1486. [DOI] [PubMed] [Google Scholar]
- Helmuth J.A., Burckhardt C.J., Greber U.F., Sbalzarini I.F. Shape reconstruction of subcellular structures from live cell fluorescence microscopy images. J. Struct. Biol. 2009;167:1–10. doi: 10.1016/j.jsb.2009.03.017. [DOI] [PubMed] [Google Scholar]
- Helmuth J.A., Burckhardt C.J., Koumoutsakos P., Greber U.F., Sbalzarini I.F. A novel supervised trajectory segmentation algorithm identifies distinct types of human adenovirus motion in host cells. J. Struct. Biol. 2007;159:347–358. doi: 10.1016/j.jsb.2007.04.003. [DOI] [PubMed] [Google Scholar]
- Hubel D.H., Wiesel T.N. Receptive fields and functional architecture of monkey striate cortex. J. Physiol. 1968;195:215–243. doi: 10.1113/jphysiol.1968.sp008455. [DOI] [PMC free article] [PubMed] [Google Scholar]
- Ibanes S., Kremer E.J. Canine adenovirus type 2 vector generation via I-Sce1-mediated intracellular genome release. PLoS One. 2013;8:e71032. doi: 10.1371/journal.pone.0071032. [DOI] [PMC free article] [PubMed] [Google Scholar]
- Imelli N., Ruzsics Z., Puntener D., Gastaldelli M., Greber U.F. Genetic reconstitution of the human adenovirus type 2 temperature-sensitive 1 mutant defective in endosomal escape. Virol. J. 2009;6:174. doi: 10.1186/1743-422X-6-174. [DOI] [PMC free article] [PubMed] [Google Scholar]
- Jimenez A.J., Maiuri P., Lafaurie-Janvore J., Divoux S., Piel M., Perez F. ESCRT machinery is required for plasma membrane repair. Science. 2014;343:1247136. doi: 10.1126/science.1247136. [DOI] [PubMed] [Google Scholar]
- Jogler C., Hoffmann D., Theegarten D., Grunwald T., Uberla K., Wildner O. Replication properties of human adenovirus in vivo and in cultures of primary cells from different animal species. J. Virol. 2006;80:3549–3558. doi: 10.1128/JVI.80.7.3549-3558.2006. [DOI] [PMC free article] [PubMed] [Google Scholar]
- King M.C., Lusk C.P. A model for coordinating nuclear mechanics and membrane remodeling to support nuclear integrity. Curr. Opin. Cell Biol. 2016;41:9–17. doi: 10.1016/j.ceb.2016.03.009. [DOI] [PMC free article] [PubMed] [Google Scholar]
- Kingma D.P., Ba J. Adam: a method for stochastic optimization. arXiv. 2014 arXiv 1412.6980. [Google Scholar]
- Klupp B.G., Granzow H., Mettenleiter T.C. Nuclear envelope breakdown can substitute for primary envelopment-mediated nuclear egress of herpesviruses. J. Virol. 2011;85:8285–8292. doi: 10.1128/JVI.00741-11. [DOI] [PMC free article] [PubMed] [Google Scholar]
- Kosulin K., Geiger E., Vecsei A., Huber W.D., Rauch M., Brenner E., Wrba F., Hammer K., Innerhofer A., Potschger U. Persistence and reactivation of human adenoviruses in the gastrointestinal tract. Clin. Microbiol. Infect. 2016;22:381 e381–388. doi: 10.1016/j.cmi.2015.12.013. [DOI] [PubMed] [Google Scholar]
- Latt S.A., Stetten G. Spectral studies on 33258 Hoechst and related bisbenzimidazole dyes useful for fluorescent detection of deoxyribonucleic acid synthesis. J. Histochem. Cytochem. 1976;24:24–33. doi: 10.1177/24.1.943439. [DOI] [PubMed] [Google Scholar]
- Latt S.A., Wohlleb J.C. Optical studies of the interaction of 33258 Hoechst with DNA, chromatin, and metaphase chromosomes. Chromosoma. 1975;52:297–316. doi: 10.1007/BF00364015. [DOI] [PubMed] [Google Scholar]
- Lawler S.E., Speranza M.C., Cho C.F., Chiocca E.A. Oncolytic viruses in cancer treatment: a review. JAMA Oncol. 2017;3:841–849. doi: 10.1001/jamaoncol.2016.2064. [DOI] [PubMed] [Google Scholar]
- LeCun Y., Bengio Y., Hinton G. Deep learning. Nature. 2015;521:436–444. doi: 10.1038/nature14539. [DOI] [PubMed] [Google Scholar]
- Lee J.Y., Sadler N.C., Egbert R.G., Anderton C.R., Hofmockel K.S., Jansson J.K., Song H.S. Deep learning predicts microbial interactions from self-organized spatiotemporal patterns. Comput. Struct. Biotechnol. J. 2020;18:1259–1269. doi: 10.1016/j.csbj.2020.05.023. [DOI] [PMC free article] [PubMed] [Google Scholar]
- Lichtenstein D.L., Toth K., Doronin K., Tollefson A.E., Wold W.S. Functions and mechanisms of action of the adenovirus E3 proteins. Int. Rev. Immunol. 2004;23:75–111. doi: 10.1080/08830180490265556. [DOI] [PubMed] [Google Scholar]
- Lion T. Adenovirus infections in immunocompetent and immunocompromised patients. Clin. Microbiol. Rev. 2014;27:441–462. doi: 10.1128/CMR.00116-13. [DOI] [PMC free article] [PubMed] [Google Scholar]
- Lopez M.R., Schlegel E.F., Wintersteller S., Blaho J.A. The major tegument structural protein VP22 targets areas of dispersed nucleolin and marginalized chromatin during productive herpes simplex virus 1 infection. Virus Res. 2008;136:175–188. doi: 10.1016/j.virusres.2008.05.010. [DOI] [PMC free article] [PubMed] [Google Scholar]
- Lotzerich M., Roulin P.S., Boucke K., Witte R., Georgiev O., Greber U.F. Rhinovirus 3C protease suppresses apoptosis and triggers caspase-independent cell death. Cell Death Dis. 2018;9:272. doi: 10.1038/s41419-018-0306-6. [DOI] [PMC free article] [PubMed] [Google Scholar]
- Luisoni S., Suomalainen M., Boucke K., Tanner L.B., Wenk M.R., Guan X.L., Grzybek M., Coskun U., Greber U.F. Co-option of membrane wounding enables virus penetration into cells. Cell Host Microbe. 2015;18:75–85. doi: 10.1016/j.chom.2015.06.006. [DOI] [PubMed] [Google Scholar]
- Majumder K., Wang J., Boftsi M., Fuller M.S., Rede J.E., Joshi T., Pintel D.J. Parvovirus minute virus of mice interacts with sites of cellular DNA damage to establish and amplify its lytic infection. eLife. 2018;7:e37750. doi: 10.7554/eLife.37750. [DOI] [PMC free article] [PubMed] [Google Scholar]
- Malkin A., McPherson A. Crystallization of satellite tobacco mosaic virus II. Postnucleation events. J. Cryst. Growth. 1993;126:555–564. [Google Scholar]
- Mangel W.F., San Martin C. Structure, function and dynamics in adenovirus maturation. Viruses. 2014;6:4536–4570. doi: 10.3390/v6114536. [DOI] [PMC free article] [PubMed] [Google Scholar]
- Maric M., Haugo A.C., Dauer W., Johnson D., Roller R.J. Nuclear envelope breakdown induced by herpes simplex virus type 1 involves the activity of viral fusion proteins. Virology. 2014;460-461:128–137. doi: 10.1016/j.virol.2014.05.010. [DOI] [PMC free article] [PubMed] [Google Scholar]
- Matthews D.A. Adenovirus protein V induces redistribution of nucleolin and B23 from nucleolus to cytoplasm. J. Virol. 2001;75:1031–1038. doi: 10.1128/JVI.75.2.1031-1038.2001. [DOI] [PMC free article] [PubMed] [Google Scholar]
- Mazumder A., Shivashankar G.V. Emergence of a prestressed eukaryotic nucleus during cellular differentiation and development. J. R. Soc. Interface. 2010;7(Suppl 3):S321–S330. doi: 10.1098/rsif.2010.0039.focus. [DOI] [PMC free article] [PubMed] [Google Scholar]
- Munger J., Bennett B.D., Parikh A., Feng X.J., McArdle J., Rabitz H.A., Shenk T., Rabinowitz J.D. Systems-level metabolic flux profiling identifies fatty acid synthesis as a target for antiviral therapy. Nat. Biotechnol. 2008;26:1179–1186. doi: 10.1038/nbt.1500. [DOI] [PMC free article] [PubMed] [Google Scholar]
- Nagel H., Maag S., Tassis A., Nestle F.O., Greber U.F., Hemmi S. The alphavbeta5 integrin of hematopoietic and nonhematopoietic cells is a transduction receptor of RGD-4C fiber-modified adenoviruses. Gene Ther. 2003;10:1643–1653. doi: 10.1038/sj.gt.3302058. [DOI] [PubMed] [Google Scholar]
- Ostapchuk P., Suomalainen M., Zheng Y., Boucke K., Greber U.F., Hearing P. The adenovirus major core protein VII is dispensable for virion assembly but is essential for lytic infection. PLoS Pathog. 2017;13:e1006455. doi: 10.1371/journal.ppat.1006455. [DOI] [PMC free article] [PubMed] [Google Scholar]
- Ostwald W. Über die vermeintliche Isomerie des roten und gelben Quecksilberoxyds und die Oberflächenspannung fester Körper. Z. Phys. Chem. 1900;34:495–503. [Google Scholar]
- Ounkomol C., Seshamani S., Maleckar M.M., Collman F., Johnson G.R. Label-free prediction of three-dimensional fluorescence images from transmitted-light microscopy. Nat. Methods. 2018;15:917–920. doi: 10.1038/s41592-018-0111-2. [DOI] [PMC free article] [PubMed] [Google Scholar]
- Pan S.J., Yang Q. A survey on transfer learning. IEEE Trans. Knowledge Data Eng. 2010;22:1345–1359. [Google Scholar]
- Pedregosa F., Varoquaux G., Gramfort A., Michel V., Thirion B., Grisel O., Blondel M., Prettenhofer P., Weiss R., Dubourg V. Scikit-learn: machine learning in Python. J. Machine Learn. Res. 2011;12:2825–2830. [Google Scholar]
- Pied N., Wodrich H. Imaging the adenovirus infection cycle. FEBS Lett. 2019;593:3419–3448. doi: 10.1002/1873-3468.13690. [DOI] [PubMed] [Google Scholar]
- Prasad V., Suomalainen M., Jasiqi Y., Hemmi S., Hearing P., Hosie L., Burgert H.G., Greber U.F. The UPR sensor IRE1alpha and the adenovirus E3-19K glycoprotein sustain persistent and lytic infections. Nat. Commun. 2020;11:1997. doi: 10.1038/s41467-020-15844-2. [DOI] [PMC free article] [PubMed] [Google Scholar]
- Prasad V., Suomalainen M., Pennauer M., Yakimovich A., Andriasyan V., Hemmi S., Greber U.F. Chemical induction of unfolded protein response enhances cancer cell killing through lytic virus infection. J. Virol. 2014;88:13086–13098. doi: 10.1128/JVI.02156-14. [DOI] [PMC free article] [PubMed] [Google Scholar]
- Prusinkiewicz M.A., Mymryk J.S. Metabolic reprogramming of the host cell by human adenovirus infection. Viruses. 2019;11:141. doi: 10.3390/v11020141. [DOI] [PMC free article] [PubMed] [Google Scholar]
- Puntener D., Engelke M.F., Ruzsics Z., Strunze S., Wilhelm C., Greber U.F. Stepwise loss of fluorescent core protein V from human adenovirus during entry into cells. J. Virol. 2011;85:481–496. doi: 10.1128/JVI.01571-10. [DOI] [PMC free article] [PubMed] [Google Scholar]
- Puvion-Dutilleul F., Besse S., Pichard E., Cajean-Feroldi C. Release of viruses and viral DNA from nucleus to cytoplasm of HeLa cells at late stages of productive adenovirus infection as revealed by electron microscope in situ hybridization. Biol. Cell. 1998;90:5–38. doi: 10.1016/s0248-4900(98)80230-x. [DOI] [PubMed] [Google Scholar]
- Puvion-Dutilleul F., Puvion E. Immunocytochemistry, autoradiography, in situ hybridization, selective stains: complementary tools for ultrastructural study of structure-function relationships in the nucleus. Applications to adenovirus-infected cells. Microsc. Res. Tech. 1995;31:22–43. doi: 10.1002/jemt.1070310104. [DOI] [PubMed] [Google Scholar]
- Rao L., Perez D., White E. Lamin proteolysis facilitates nuclear events during apoptosis. J. Cell Biol. 1996;135:1441–1455. doi: 10.1083/jcb.135.6.1441. [DOI] [PMC free article] [PubMed] [Google Scholar]
- Rawat W., Wang Z. Deep convolutional neural networks for image classification: a comprehensive review. Neural Comput. 2017;29:2352–2449. doi: 10.1162/NECO_a_00990. [DOI] [PubMed] [Google Scholar]
- Roizman B., Knipe D.M. Herpes simplex viruses and their replication. In: Knipe D.M., Howley P.M., editors. Fundamental Virology. Lippincott-Raven); 2001. pp. 1123–1183. [Google Scholar]
- Rothballer A., Schwartz T.U., Kutay U. LINCing complex functions at the nuclear envelope: what the molecular architecture of the LINC complex can reveal about its function. Nucleus. 2013;4:29–36. doi: 10.4161/nucl.23387. [DOI] [PMC free article] [PubMed] [Google Scholar]
- Roulin P.S., Lotzerich M., Torta F., Tanner L.B., van Kuppeveld F.J., Wenk M.R., Greber U.F. Rhinovirus uses a phosphatidylinositol 4-phosphate/cholesterol counter-current for the formation of replication compartments at the ER-golgi interface. Cell Host Microbe. 2014;16:677–690. doi: 10.1016/j.chom.2014.10.003. [DOI] [PubMed] [Google Scholar]
- Sahl S.J., Hell S.W., Jakobs S. Fluorescence nanoscopy in cell biology. Nat. Rev. Mol. Cell Biol. 2017;18:685–701. doi: 10.1038/nrm.2017.71. [DOI] [PubMed] [Google Scholar]
- Schindelin J., Arganda-Carreras I., Frise E., Kaynig V., Longair M., Pietzsch T., Preibisch S., Rueden C., Saalfeld S., Schmid B. Fiji: an open-source platform for biological-image analysis. Nat. Methods. 2012;9:676–682. doi: 10.1038/nmeth.2019. [DOI] [PMC free article] [PubMed] [Google Scholar]
- Shah P., Wolf K., Lammerding J. Bursting the bubble - nuclear envelope rupture as a path to genomic instability? Trends Cell Biol. 2017;27:546–555. doi: 10.1016/j.tcb.2017.02.008. [DOI] [PMC free article] [PubMed] [Google Scholar]
- Silver D., Schrittwieser J., Simonyan K., Antonoglou I., Huang A., Guez A., Hubert T., Baker L., Lai M., Bolton A. Mastering the game of Go without human knowledge. Nature. 2017;550:354–359. doi: 10.1038/nature24270. [DOI] [PubMed] [Google Scholar]
- Skinner B.M., Johnson E.E. Nuclear morphologies: their diversity and functional relevance. Chromosoma. 2017;126:195–212. doi: 10.1007/s00412-016-0614-5. [DOI] [PMC free article] [PubMed] [Google Scholar]
- Sommer C., Gerlich D.W. Machine learning in cell biology - teaching computers to recognize phenotypes. J. Cell Sci. 2013;126:5529–5539. doi: 10.1242/jcs.123604. [DOI] [PubMed] [Google Scholar]
- Steiner I., Kennedy P.G., Pachner A.R. The neurotropic herpes viruses: herpes simplex and varicella-zoster. Lancet Neurol. 2007;6:1015–1028. doi: 10.1016/S1474-4422(07)70267-3. [DOI] [PubMed] [Google Scholar]
- Suomalainen M., Prasad V., Kannan A., Greber U.F. Cell-to-cell and genome-to-genome variability of adenovirus transcription tuned by the cell cycle. J. Cell Sci. 2020;134 doi: 10.1242/jcs.252544. jcs.252544. [DOI] [PubMed] [Google Scholar]
- Suzuki T., Orba Y., Okada Y., Sunden Y., Kimura T., Tanaka S., Nagashima K., Hall W.W., Sawa H. The human polyoma JC virus agnoprotein acts as a viroporin. PLoS Pathog. 2010;6:e1000801. doi: 10.1371/journal.ppat.1000801. [DOI] [PMC free article] [PubMed] [Google Scholar]
- Tinevez J.Y., Perry N., Schindelin J., Hoopes G.M., Reynolds G.D., Laplantine E., Bednarek S.Y., Shorte S.L., Eliceiri K.W. TrackMate: an open and extensible platform for single-particle tracking. Methods. 2017;115:80–90. doi: 10.1016/j.ymeth.2016.09.016. [DOI] [PubMed] [Google Scholar]
- Tollefson A.E., Hermiston T.W., Lichtenstein D.L., Colle C.F., Tripp R.A., Dimitrov T., Toth K., Wells C.E., Doherty P.C., Wold W.S. Forced degradation of Fas inhibits apoptosis in adenovirus-infected cells. Nature. 1998;392:726–730. doi: 10.1038/33712. [DOI] [PubMed] [Google Scholar]
- Tollefson A.E., Ryerse J.S., Scaria A., Hermiston T.W., Wold W.S. The E3-11.6-kDa adenovirus death protein (ADP) is required for efficient cell death: characterization of cells infected with adp mutants. Virology. 1996;220:152–162. doi: 10.1006/viro.1996.0295. [DOI] [PubMed] [Google Scholar]
- Tollefson A.E., Scaria A., Hermiston T.W., Ryerse J.S., Wold L.J., Wold W.S. The adenovirus death protein (E3-11.6K) is required at very late stages of infection for efficient cell lysis and release of adenovirus from infected cells. J. Virol. 1996;70:2296–2306. doi: 10.1128/jvi.70.4.2296-2306.1996. [DOI] [PMC free article] [PubMed] [Google Scholar]
- Tomasev N., Glorot X., Rae J.W., Zielinski M., Askham H., Saraiva A., Mottram A., Meyer C., Ravuri S., Protsyuk I. A clinically applicable approach to continuous prediction of future acute kidney injury. Nature. 2019;572:116–119. doi: 10.1038/s41586-019-1390-1. [DOI] [PMC free article] [PubMed] [Google Scholar]
- Topol E.J. High-performance medicine: the convergence of human and artificial intelligence. Nat. Med. 2019;25:44–56. doi: 10.1038/s41591-018-0300-7. [DOI] [PubMed] [Google Scholar]
- Voorhees P. Ostwald ripening of two-phase mixtures. Annu. Rev. Mater. Sci. 1992;22:197–215. [Google Scholar]
- Wang I.H., Burckhardt C.J., Yakimovich A., Greber U.F. Imaging, tracking and computational analyses of virus entry and egress with the cytoskeleton. Viruses. 2018;10 doi: 10.3390/v10040166. [DOI] [PMC free article] [PubMed] [Google Scholar]
- Wang I.H., Suomalainen M., Andriasyan V., Kilcher S., Mercer J., Neef A., Luedtke N.W., Greber U.F. Tracking viral genomes in host cells at single-molecule resolution. Cell Host Microbe. 2013;14:468–480. doi: 10.1016/j.chom.2013.09.004. [DOI] [PubMed] [Google Scholar]
- Warming S., Costantino N., Court D.L., Jenkins N.A., Copeland N. Simple and highly efficient BAC recombineering using galK selection. Nucleic Acids Res. 2005;33:e36. doi: 10.1093/nar/gni035. [DOI] [PMC free article] [PubMed] [Google Scholar]
- Weigert M., Schmidt U., Boothe T., Muller A., Dibrov A., Jain A., Wilhelm B., Schmidt D., Broaddus C., Culley S. Content-aware image restoration: pushing the limits of fluorescence microscopy. Nat. Methods. 2018;15:1090–1097. doi: 10.1038/s41592-018-0216-7. [DOI] [PubMed] [Google Scholar]
- White M.K., Pagano J.S., Khalili K. Viruses and human cancers: a long road of discovery of molecular paradigms. Clin. Microbiol. Rev. 2014;27:463–481. doi: 10.1128/CMR.00124-13. [DOI] [PMC free article] [PubMed] [Google Scholar]
- Wild P., Leisinger S., de Oliveira A.P., Doehner J., Schraner E.M., Fraevel C., Ackermann M., Kaech A. Nuclear envelope impairment is facilitated by the herpes simplex virus 1 Us3 kinase. F1000Res. 2019;8:198. doi: 10.12688/f1000research.17802.1. [DOI] [PMC free article] [PubMed] [Google Scholar]
- Witte R., Andriasyan V., Georgi F., Yakimovich A., Greber U.F. Concepts in light microscopy of viruses. Viruses. 2018;10 doi: 10.3390/v10040202. [DOI] [PMC free article] [PubMed] [Google Scholar]
- Yakimovich A. mSphere of influence: the rise of artificial intelligence in infection biology. mSphere. 2019;4:e00315-19. doi: 10.1128/mSphere.00315-19. [DOI] [PMC free article] [PubMed] [Google Scholar]
- Yakimovich A., Andriasyan V., Witte R., Wang I.H., Prasad V., Suomalainen M., Greber U.F. Plaque2.0-A high-throughput analysis framework to score virus-cell transmission and clonal cell expansion. PLoS One. 2015;10:e0138760. doi: 10.1371/journal.pone.0138760. [DOI] [PMC free article] [PubMed] [Google Scholar]
- Yakimovich A., Gumpert H., Burckhardt C.J., Lutschg V.A., Jurgeit A., Sbalzarini I.F., Greber U.F. Cell-free transmission of human adenovirus by passive mass transfer in cell culture simulated in a computer model. J. Virol. 2012;86:10123–10137. doi: 10.1128/JVI.01102-12. [DOI] [PMC free article] [PubMed] [Google Scholar]
- Yakimovich A., Huttunen M., Zehnder B., Coulter L.J., Gould V., Schneider C., Kopf M., McInnes C.J., Greber U.F., Mercer J. Inhibition of poxvirus gene expression and genome replication by bisbenzimide derivatives. J. Virol. 2017;91:e00838-17. doi: 10.1128/JVI.00838-17. [DOI] [PMC free article] [PubMed] [Google Scholar]
- Yamauchi Y., Kiriyama K., Kimura H., Nishiyama Y. Herpes simplex virus induces extensive modification and dynamic relocalisation of the nuclear mitotic apparatus (NuMA) protein in interphase cells. J. Cell Sci. 2008;121:2087–2096. doi: 10.1242/jcs.031450. [DOI] [PubMed] [Google Scholar]
- Yamauchi Y., Kiriyama K., Kubota N., Kimura H., Usukura J., Nishiyama Y. The UL14 tegument protein of herpes simplex virus type 1 is required for efficient nuclear transport of the alpha transinducing factor VP16 and viral capsids. J. Virol. 2008;82:1094–1106. doi: 10.1128/JVI.01226-07. [DOI] [PMC free article] [PubMed] [Google Scholar]
- Ying B., Wold W.S. Adenovirus ADP protein (E3-11.6K), which is required for efficient cell lysis and virus release, interacts with human MAD2B. Virology. 2003;313:224–234. doi: 10.1016/s0042-6822(03)00287-3. [DOI] [PubMed] [Google Scholar]
- Zeev-Ben-Mordehai T., Weberruss M., Lorenz M., Cheleski J., Hellberg T., Whittle C., El Omari K., Vasishtan D., Dent K.C., Harlos K. Crystal structure of the herpesvirus nuclear egress complex provides insights into inner nuclear membrane remodeling. Cell Rep. 2015;13:2645–2652. doi: 10.1016/j.celrep.2015.11.008. [DOI] [PMC free article] [PubMed] [Google Scholar]
- Zhou Y., Wei Y. Learning hierarchical spectral-spatial features for hyperspectral image classification. IEEE Trans. Cybern. 2016;46:1667–1678. doi: 10.1109/TCYB.2015.2453359. [DOI] [PubMed] [Google Scholar]
Associated Data
This section collects any data citations, data availability statements, or supplementary materials included in this article.
Supplementary Materials
HeLa cells stably expressing H2B-mCherry were infected with AdV-C2-GFP-V at MOI 0.2 and recorded by live cell confocal fluorescence microscopy from 24 to 45 hr pi at 15 min intervals. Merged pseudo-colored maximum projections are shown with GFP-V in green and H2B-mCherry in red. Dispersion of GFP-V clusters from the nucleus into a confined cytoplasmic region around the nucleus (see cell in the center of the video) 35:45–38:30 hr:min pi. Note that the clusters and nuclear GFP-V signals disappear almost completely while the GFP-V signal in non-lytic infected cells persists.
HeLa cells stably expressing H2B-mCherry were infected with AdV-C2-GFP-V at MOI 0.2 and recorded by live cell confocal fluorescence microscopy from 24 to 45 hr pi at 15 min intervals. Merged pseudo-colored maximum projections are shown with GFP-V in green and H2B-mCherry in red. Loss of GFP-V clusters from AdV-C2-GFP-V-infected cell nuclei.
Infection is visualized by the virus expressing VP-16-GFP fusion protein (green), nuclei are stained with Hoechst (blue), and lysed cells are stained with PI (red).
Data Availability Statement
Our ViResNet works by object segmentation, and expressive capacity adaptation through residual nodes which allows to learn object features without overfitting of the data. We present an empirical procedure for exploratory data analyses. ViResNet50 network provides trained sets of weights of nuclear features based on fluorescence images to identify and classify infected cells. All the code is available at (https://github.com/viresnet/).
Specifically, the user is provided with detailed guidelines to applying the methods and procedures developed here. A general demo is available at https://bit.ly/ViResNet. A user type interface demonstrates the capability and power of the ViResNet network for analyses of virus infection phenotypes. The user requires a Google account, and provides a link to his / her image data of interest. The user loads and segments own images and uses our trained data sets to identify features of infected cell nuclei, such as infection phenotypes.
The program is described as a Jupiter notebook, and can be run off-line, if the ViResNet libraries are downloaded and installed on a local machine. The user can adjust the network structure on demand. This is possible using the neural network training pipeline at: https://bit.ly/ViResNetML.
This link provides a path for retraining and fine-tuning the ViResNet, in particular focusing on morphological features of the nucleus recorded by fluorescence microscopy. To interpret the resulting data, the ground truth is required, in this case the knowledge of the infection status of a cell. The training datasets (about 200 mb) are available in a packed/archived format on gitlab repository (https://gitlab.com/vardan.andriasyan/virusnuc/-/raw/master/datasets.tar.gz), together with the example images. The raw datasets of approximately 8 tb, can be made available on demand.