Abstract
Background
Dispersion and gradients in repolarization have been associated with life‐threatening arrhythmias, but are difficult to quantify precisely from surface electrocardiography. The objective of this study was to evaluate electrocardiographic imaging (ECGI) to noninvasively detect repolarization‐based abnormalities.
Methods and Results
Ex vivo data were obtained from Langendorff‐perfused pig hearts (n=8) and a human donor heart. Unipolar electrograms were recorded simultaneously during sinus rhythm from an epicardial sock and the torso‐shaped tank within which the heart was suspended. Regional repolarization heterogeneities were introduced through perfusion of dofetilide and pinacidil into separate perfusion beds. In vivo data included torso and epicardial potentials recorded simultaneously in anesthetized, closed‐chest pigs (n=5), during sinus rhythm, and ventricular pacing. For both data sets, ECGI accurately reconstructed T‐wave electrogram morphologies when compared with those recorded by the sock (ex vivo: correlation coefficient, 0.85 [0.52–0.96], in vivo: correlation coefficient, 0.86 [0.52–0.96]) and repolarization time maps (ex‐vivo: correlation coefficient, 0.73 [0.63–0.83], in vivo: correlation coefficient, 0.76 [0.67–0.82]). ECGI‐reconstructed repolarization time distributions were strongly correlated to those measured by the sock (both data sets, R 2 ≥0.92). Although the position of the gradient was slightly shifted by 8.3 (0–13.9) mm, the mean, max, and SD between ECGI and recorded gradient values were highly correlated (R 2=0.87, 0.75, and 0.86 respectively). There was no significant difference in ECGI accuracy between ex vivo and in vivo data.
Conclusions
ECGI reliably and accurately maps potentially critical repolarization abnormalities. This noninvasive approach allows imaging and quantifying individual parameters of abnormal repolarization‐based substrates in patients with arrhythmogenesis, to improve diagnosis and risk stratification.
Keywords: ECG, electrocardiographic imaging, electrocardiography, electrophysiology mapping, repolarization
Subject Categories: Translational Studies, Electrophysiology
Nonstandard Abbreviations and Acronyms
- CC
correlation coefficient
- ECGI
electrocardiographic imaging
- MAE
mean absolute error
- RT
repolarization times
- ΔRT
repolarization time gradient
Clinical Perspective
What Is New?
This study confirms for the first time that electrocardiographic imaging can be used to accurately detect repolarization‐based abnormalities, including global prolongation/abbreviation and dispersion, as well as local regions of abnormal repolarization and gradients though with minor spatial inaccuracies.
The strong correspondence seen between electrocardiographic imaging results for ex vivo hearts in a drug‐free state and the in vivo hearts suggest that the results from this study can be translated to a clinical setting, allowing repolarization time abnormalities to be studied with electrocardiographic imaging in patients to help understand the mechanisms underlying many electrical diseases, though interpretation of the results should take into consideration the spatial inaccuracies highlighted in this study.
What Are the Clinical Implications?
Electrocardiographic imaging reconstructions are also consistent and stable on a beat‐to‐beat basis, meaning the dynamic of repolarization anomalies could be accurately assessed at rest and under stress.
Diagnosis, risk stratification, and prevention of life‐threatening arrhythmias of unknown origin are major challenges of present‐day cardiology. Repolarization heterogeneities likely play an important role in primary electrical diseases, although their detection and quantification, relying on invasive procedures, are difficult.
Noninvasive electrocardiographic imaging (ECGI) is a tool to noninvasively map epicardial electrograms and reconstruct activation and repolarization maps using high‐density body surface potentials and 3‐dimensional imaging of the heart and torso. 1 , 2 ECGI has been applied for repolarization mapping in patients 3 , 4 , 5 , 6 and has demonstrated the presence of (1) steep repolarization gradients and (2) abnormally prolonged or abbreviated repolarization, compared with normal subjects, as well as the dynamic of these anomalies under stress. Although these findings are highly relevant for identifying the exact mechanisms leading to sustained ventricular arrhythmias in primary electrical disease, the exact value of ECGI in establishing a quantitatively correct representation of repolarization heterogeneities is unknown. This is particularly important given recent work demonstrating the large discrepancies between ECGI and contact mapping in patients with conduction‐based abnormalities. 7 To date, there has been no experimental or clinical validation of ECGI in the presence of repolarization‐based abnormalities, nor in the ability to reconstruct potentially critical repolarization gradients.
In this study, we evaluate for the first time the accuracy of ECGI in the presence of steep repolarization gradients using a completely experimental approach, including human and pig hearts in an ex vivo torso tank model. To determine how this accuracy translates to clinical application, we have further compared these results to evaluations of ECGI using data from healthy in vivo pigs in sinus rhythm and during ventricular pacing.
Methods
The experimental data used in this study are available from the corresponding author upon reasonable request. A subset of the data are available through the Experimental Data and Geometric Analysis Repository 8 and can be accessed at https://edgar.sci.utah.edu/.
Ex Vivo Tank Data
Ex vivo experiments were carried out in accordance with institutional guidelines and the recommendations of the Directive 2010/63/EU of the European Parliament on the protection of animals used for scientific purposes and approved by the local ethical committee of Bordeaux CEEA50. Procurement and use of human donor hearts were approved by the National Biomedical Agency and in a manner conforming to the Declaration of Helsinki.
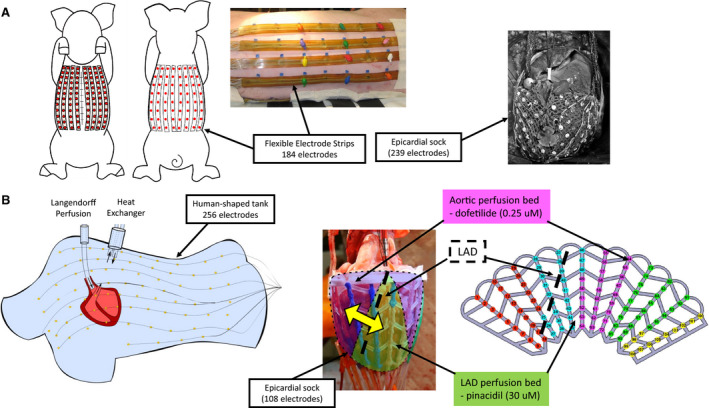
Hearts were excised from male pigs (n=8; 30–40 kg) and transported in an ice‐cold cardioplegic solution to the laboratory. One human donor heart was used from a 76‐year‐old woman who died of ischemic stroke with a history of hypertension. Hearts were perfused in Langendorff mode with a 1:9 mixture of blood and Tyrode's solution (Tyrode's solution only for the human heart), oxygenated with 95%/5% O2/CO2 (pH 7.4, 37°C). The left anterior descending artery (LAD) was cannulated on a separate perfusion from the aorta. An epicardial electrode sock (108 electrodes, 8–14 mm spacing) was attached to the ventricles. After instrumentation, the hearts were transferred to a human torso–shaped tank fitted with electrodes (256 electrodes, 30–60 mm spacing) filled with Tyrode's (Figure 1B). Regional repolarization heterogeneities were introduced through perfusion of dofetilide (250 nmol/L) into the aorta and subsequently pinacidil (30 μmol/L) into the LAD. Torso and sock potentials were simultaneously recorded (BioSemi, Amsterdam, the Netherlands) during sinus rhythm at baseline and in each drug state. All signals were sampled at 2 kHz, bandlimited (0.05–1000 Hz), and referenced to an electrode on the lower abdomen. Three‐dimensional rotational fluoroscopy (Artis; Siemens, Munich, Germany) was used to obtain subject‐specific epicardial surface meshes and electrode locations.
Figure 1. (A) In vivo and (B) ex vivo experimental setups.
In Vivo Data
In vivo data have previously been described, 9 were carried out in accordance with institutional guidelines, and were approved by the Animal Ethics Committee of the University of Auckland and conform to the Guide for the Care and Use of Laboratory Animals (National Institutes of Health publication no. 85‐23). In brief, a midline sternotomy was performed in healthy, anesthetized female pigs (n=5; 30–40 kg). The heart was exposed and supported in a pericardial cradle. An electrode sock was placed over the ventricles (239 electrodes, 5–10 mm spacing). The thorax was closed and air expelled. Flexible strips (184 electrodes, 30–45 mm spacing) were attached to the torso (Figure 1A). Epicardial and body‐surface potentials were recorded simultaneously during (1) sinus rhythm and (2) pacing from endocardial leads or sock electrodes. All signals were sampled at 2 kHz, bandlimited (0.05–1000 Hz), and referenced to an electrode on the lower abdomen. Magnetic resonance imaging was performed postmortem to obtain subject‐specific epicardial surface meshes and torso electrode locations. Epicardial electrode locations were captured from excised hearts with a multiaxis digitizing arm (FARO Technologies, Lake Mary, FL). Magnetic resonance imaging contrast markers placed on the sock were localized and used to register sock electrode locations.
Signal Processing and Comparisons
Torso potentials were filtered using a 40‐Hz low‐pass filter, and the isoelectric point before the P‐wave was set to 0. ECGI unipolar electrograms were reconstructed from torso potentials to subject‐specific epicardial meshes using a homogeneous torso model and previously described methods 10 for both ex vivo and in vivo data. Analysis using alternative methods demonstrated that these were the optimal potential‐based methods to use (Figure S1, Table S1).
Quantitative evaluation of ECGI electrogram T‐wave morphology was performed using a Pearson's correlation coefficient (CC) against corresponding sock recorded electrograms (gold standard). Repolarization times (RTs) were defined from recorded and ECGI electrograms as the time of maximum T‐wave upslope 11 relative to the QRS onset. Repolarization gradients (ΔRTs) were computed as the difference in RT between 2 adjacent electrodes divided by the distance between them. 3 , 4 , 5 ECGI RTs and ΔRTs were compared against sock recordings using CC and the mean absolute error (MAE). In addition, RT and ΔRT distributions were compared using a simple linear regression with the metrics in Table 1.
Table 1.
Metrics Used to Evaluate RT and ΔRT Distributions
| Metric | Definition |
|---|---|
| Mean RT | The mean overall RT representing global prolongation/abbreviation in recovery |
| Std RT | The SD over all RT representing the whole‐heart dispersion in recovery |
| Total RT dispersion | The RT range representing the whole‐heart dispersion in recovery |
| Peak timings | The timing of the peaks of a kernel probability distribution fitted to RT histograms using a bandwidth of 7 ms, representing the whole‐heart dispersion in recovery |
| MeanΔRT | The mean overall ΔRT representing the presence/absence of local ΔRTs |
| stdΔRT | The SD over all ΔRT representing the dispersion of local ΔRTs |
| MaxΔRT | The maximum ΔRT value representing the presence/absence of local ΔRTs |
RT indicates repolarization time; and ΔRT, repolarization time gradient.
An extra sum‐of‐squares F‐test was used to compare the fit of individual curves with the fit of a single linear regression model to in vivo and ex vivo data (Prism 7.04, GraphPad Software, La Jolla, CA). The square of the correlation coefficient between observed and predicted values (R 2) and the SD of the residuals were computed. Significance of differences was tested between ex vivo and in vivo data using a Student t test, and between human and pig hearts using a 1‐way ANOVA with a Dunn's correction. Statistical significance was defined as P<0.05. Data are expressed as mean±std (SD over all ΔRTs representing the dispersion of local ΔRTs) or median [upper quartile–lower quartile].
Results
Ex Vivo ECGI
Local T‐Wave Morphology and RTs
Figure 2 presents recorded (top) and ECGI (bottom) epicardial electrograms with RTs (vertical lines) at electrodes marked on the recorded RT map for a representative experiment in sinus rhythm during dofetilide and pinacidil perfusion. Electrograms are presented at (1) baseline (blue) with no drug perfusion, (2) with dofetilide‐only (green) perfusion in non‐LAD coronaries, and (3) with the additional perfusion of pinacidil (red) in the LAD (white dashed line), creating a sharp transition from early to late repolarization between the perfusion beds.
Figure 2. Recorded (top) and ECGI reconstructed (bottom) epicardial electrograms with repolarization times (vertical lines) for a representative case using torso tank data.
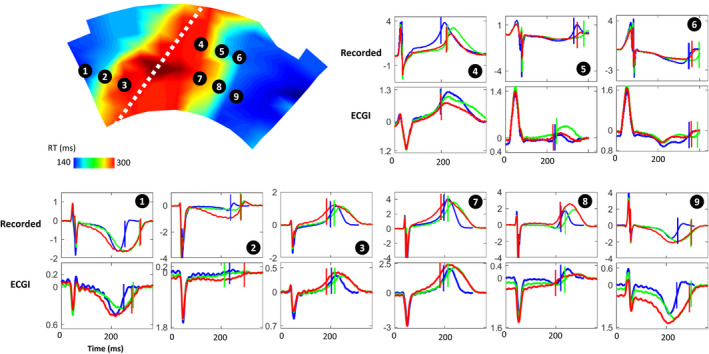
Electrograms are presented for electrodes marked on the recorded repolarization map during dofetilide+pinacidil perfusion, at (1) baseline (blue) with no drug perfusion; (2) with dofetilide‐only (green) perfusion in non‐LAD coronaries, which prolongs RT; and (3) with the additional perfusion of pinacidil (red) in the LAD (white dashed line) which shortens RT. ECGI indicates electrocardiographic imaging; LAD, left anterior descending artery; and RT, repolarization time.
In this experiment, ECGI accurately captured the timing of the T‐wave upstroke in the early (electrodes 3, 4, and 7) and late recovery regions (electrodes 1 and 9), and their shortening and delay during drug perfusion. Electrograms from the transition regions (biphasic T waves) were accurately captured in a few areas (eg, electrode 8). However, in general, they showed lower morphologic similarity to recorded electrograms. For example, the early repolarizing electrode 4 is well reconstructed, but at electrodes 5 and 6, near the gradient border, inaccurate T‐wave morphology with 2 upstrokes were reconstructed. This transition could also be seen as a flattening of the T wave (eg, electrode 2). In these cases, RT estimation may be less reliable.
Recorded RT maps for this experiment (Figure 3A) demonstrated early repolarization in the LAD perfusion bed at baseline, and late repolarization elsewhere. With dofetilide‐only perfusion, RTs were prolonged outside the LAD perfusion bed by 55±13 ms. With additional pinacidil perfusion, RTs were abbreviated in the LAD region by 47±23 ms. ECGI RT maps corresponded well to those recorded, capturing the general timing and location of the early and late repolarization regions (CC, 0.88, 0.79, and 0.86; MAE, 8, 19, and 22 ms). However, the early repolarizing region was slightly overestimated in size. Despite this, the gradient from early to late recovery appeared to be accurately captured.
Figure 3. Comparison of recorded and ECGI repolarization times.
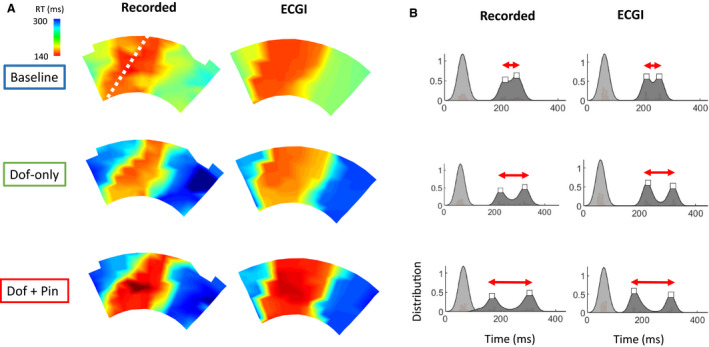
A, Recorded and ECGI reconstructed RT maps at baseline (blue) with no drug perfusion, with dofetilide‐only (green) perfusion in non‐LAD coronaries, and with additional perfusion of pinacidil (red) in the LAD (white dashed line). B, “Kernel” probability distributions fitted to recorded and ECGI activation (light gray) and RTs (dark gray) for these RT maps with the detected peaks of RT distributions (white square). ECGI indicates electrocardiographic imaging; LAD, left anterior descending artery; and RT, repolarization time.
Kernel probability distributions fitted to recorded RT histograms (Figure 3B) showed a distribution with 2 peaks (white squares), reflecting the regions of early and late RT. With drug perfusion, the peaks separate (red arrow), reflecting the increased global dispersion of repolarization. Visually, ECGI distributions closely matched those recorded, in terms of number and timings of peaks.
One‐to‐one comparison of T‐wave morphologies and RTs across all ex‐vivo data in all drug states shows that ECGI accurately reconstructed both (CC, 0.85 [0.52–0.96] for T‐wave morphologies; and CC, 0.73 [0.63–0.83] and MAE, 25 [19–31] ms for RT maps). ECGI reconstructed T waves and RTs were less accurate at the gradient border than in early or late recovery areas (Data S2). ECGI reconstructions were also consistent and stable on a beat‐to‐beat basis (Figure S3). The distribution of RTs were also compared using mean RT, std of RT, total RT dispersion, and the timings of peaks in kernel probability distributions (Figure 4). Linear regression analysis demonstrated that ECGI accurately reconstructs RT distributions, with strong correlations and low regression error compared with recorded values.
Figure 4. Linear regression plots of recorded and ECG‐derived mean repolarization time (mean RT; top left), std RT (top right), total RT dispersion (TRTD; bottom left), and kernel probability distribution peak timings (bottom right) from both in vivo (blue) and ex vivo (red) data.
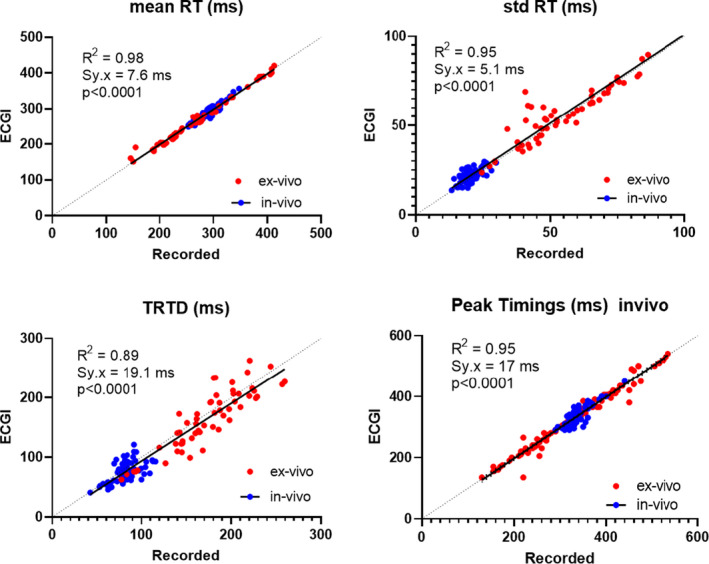
For all plots, there was no significant difference between regression fits for 5 in vivo and 9 ex vivo data sets (P>0.10). Data collected from 146 cardiac sequences.
Repolarization Gradients
Figure 5A presents ΔRT maps for the experiment in Figures 2 and 3. At baseline, recorded ΔRT demonstrates a slightly elevated gradient at the border of the LAD perfusion bed, with low meanΔRT, stdΔRT, and maxΔRT (Figure 5, 6). This gradient at the LAD perfusion border increased with dofetilide‐only perfusion along with ΔRT distribution statistics. Further increase was seen with dofetilide+pinacidil perfusion.
Figure 5. Evaluation of ECGI reconstructed RT gradients.
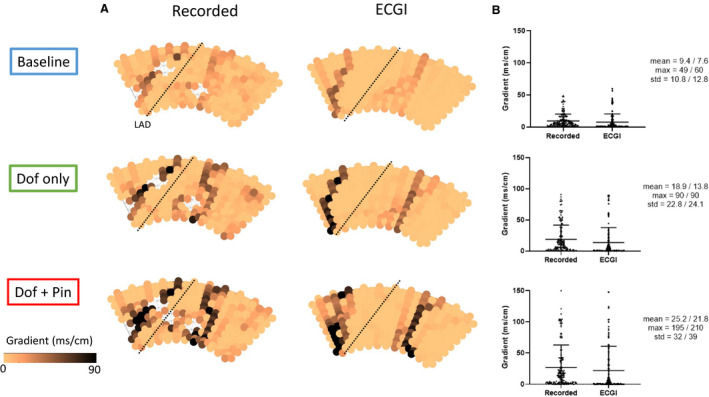
A, Recorded and ECGI reconstructed RT gradient maps at baseline (blue) with no drug perfusion, with dofetlide‐only (green) perfusion in non‐LAD coronaries, and with additional perfusion of pinacidil (red) in the LAD (black dashed line). B, Distribution of RT gradients with mean, max and SD from recorded/ECGI reconstructions respectively. ECGI indicates electrocardiographic imaging; LAD, left anterior descending artery; and RT, repolarization time.
Figure 6. Linear regression plots of repolarization time gradient (ΔRT) statistics including mean ΔRT (left), max ΔRT (middle) and std ΔRT (right) from both in vivo (blue) and ex vivo (red) data sets.

For all plots, there was no significant difference between regression fits for 5 in vivo and 9 ex vivo data sets (P>0.10). Data collected from 146 cardiac sequences. ECGI indicates electrocardiographic imaging; LAD, left anterior descending artery; and RT, repolarization time.
ECGI accurately captured the presence and increase in ΔRT with drug perfusion, although the high gradient at the perfusion border was slightly spatially shifted. The ECGI ΔRT distributions reflected those recorded with only small error in the meanΔRT, stdΔRT, and maxΔRT (Figure 5B; right‐hand values).
To determine degree of spatial shift in the high gradient border, the Euclidean distance was found between each recorded and ECGI electrode with a ΔRT >50 ms/mm (a cutoff enabling automated detection of the LAD perfusion border). Overall, the gradient was shifted by 8.3 [0–13.9]) mm, with no significant difference between hearts (P=0.10). In most cases, this shift was toward the area of late recovery, with ECGI tending to overestimate the size of the early recovery region and underestimate the late recovery region (Figure S4).
Despite this slight spatial mismatch, the distribution statistics for ΔRT (Figure 6) show that ΔRT is well reconstructed by ECGI. That is, ECGI accurately reconstructs the mean, max, and std of ΔRT, showing good correlation and low regression error compared with recorded values.
Human Donor Heart
Results for the human donor heart are presented in Figure S5. We found no significant difference between the accuracy of reconstructed T waves (CC, 0.89 [0.65–0.97]) or RT maps (CC, 0.69 [0.55–0.77]; and MAE, 31 [26–52] ms) with the human heart compared with those obtained with any pig heart (P>0.05).
In Vivo ECGI
In vivo sock (top) and ECGI (bottom) electrograms with RTs (vertical lines) are presented at electrodes marked on RT maps in Figure 7 for a representative in vivo experiment during left ventricular apical pacing. As with the ex vivo data, while the magnitudes of ECGI electrogram T waves were smaller than recorded, their morphology was generally well captured. The ECGI reconstructed RT map also corresponded well to that recorded (CC, 0.80), although the early and late repolarization regions appeared slightly spatially shifted. In these normal hearts, normal RT gradients were present in recorded maps, and were correctly represented with ECGI (Figure 7C).
Figure 7. Evaluation of ECGI reconstructed electrograms, RT and RT gradients (ΔRT) for a representative in vivo data set during left ventricular apical pacing.
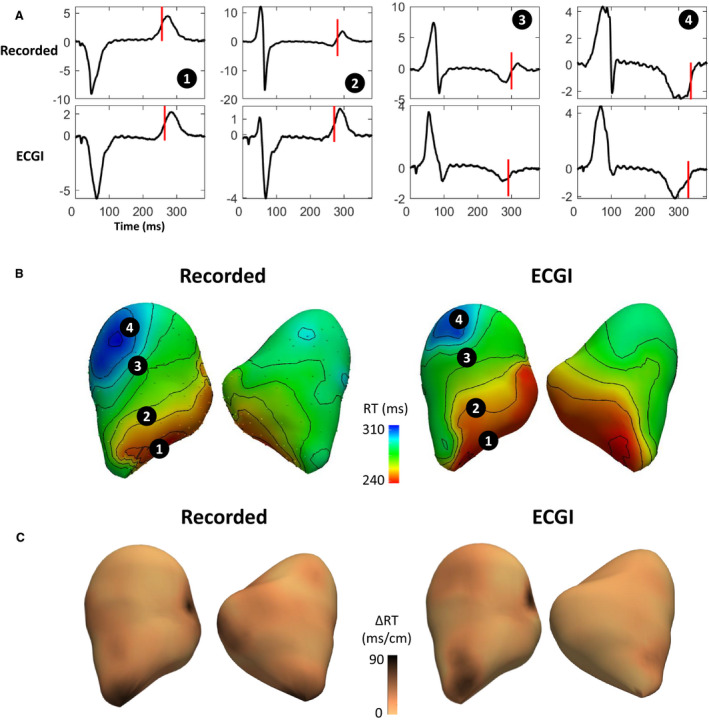
A, Recorded (top) and ECGI (bottom) reconstructed epicardial electrograms with RTs (vertical lines). Electrograms are located at electrodes marked on the recorded and ECG (B) RT maps with (C) ΔRT maps below. ECGI indicates electrocardiographic imaging; and RT, repolarization time.
One‐to‐one comparisons between ECGI reconstructions and recordings across all in vivo data demonstrated ECGI accurately reconstructed both T‐wave morphologies (CC, 0.86 [0.52–0.96]) and RT maps (CC, 0.76 [0.67–0.82]; and MAE, 10 [8–13] ms), with correlation values not significantly different to those seen ex vivo (P=0.08 and 0.76). The smaller MAE for in vivo data compared with ex vivo data reflects the shorter total RT dispersion in these hearts without repolarization abnormalities (Figure S2).
In Figures 4 and 6, comparison of ECGI and recorded RT and ΔRT distribution statistics with in vivo data were plotted alongside those for ex vivo data. In vivo recorded RT and ΔRT distribution values for these normal hearts were in a similar range to ex vivo hearts in control. Furthermore, the correspondence between in‐vivo recorded and ECGI values was similar to that seen with ex vivo data. For all metrics, a single regression line adequately fit both in vivo and ex vivo data (P>0.06).
Discussion
Our study demonstrates the accuracy of noninvasive ECGI for mapping repolarization abnormalities, including potentially critical repolarization time gradients, using comprehensive ex vivo and in vivo experimental data. The results of this study demonstrate that ECGI:
Accurately reconstructs the topology of electrogram T waves and repolarization maps in early and late RT regions, but not in the transition zones.
Detects the abbreviation and prolongation of both global and regional RTs.
Detects the location of abnormal repolarization regions.
Detects the presence of global repolarization dispersion and local repolarization gradients.
Previously, it was assumed that ECGI can provide accurate reconstructions during the repolarization phase of cardiac electrical activity. This has in part been justified through hybrid in vivo/in silico validation studies in the presence of repolarization abnormalities, 3 , 12 and more recently in in vivo and clinical validation studies limited to hearts with normal recovery. 13 , 14
Comparison With Previous Validation Studies
Two previous hybrid in vivo/in silico studies have evaluated ECGI in the presence of local ΔRTs. Experimental data were obtained from an epicardial sock from a dog 12 and a human heart. 3 Sock potentials were used in a forward model to simulate torso potentials, with gaussian noise and torso electrode location error added to simulate measurement noise before the inverse problem was solved. Their results demonstrated that 90% of reconstructed electrogram T waves had CC >0.8, surpassing the accuracy seen here with both ex vivo and in vivo data where only 60% of electrograms had a CC >0.8 using the same ECGI methods (Data S1). We believe this discrepancy in accuracy is attributable to 2 sources of error not incorporated into the hybrid models: (1) movement of the heart during contraction and (2) inaccuracies in segmentation of the heart. 15 While these hybrid in vivo/in silico studies evaluated ECGI in the presence of repolarization time gradients, direct validation of the ΔRTs was not performed. However, ECGI reconstructed activation‐recovery interval dispersion, as well as local changes in activation‐recovery interval over the gradient border were evaluated and found to very similar to those directly recorded, consistent with the results presented here.
Two previous studies reported validation of potential‐based ECGI formulations for repolarization mapping using experimental or clinical data. Cluitmans et al 13 evaluated ECGI reconstruction of T waves and recovery maps during pacing in healthy dogs. The results of this study strongly reflect those seen here with both ex vivo and in vivo data, with a median CC of 0.92 for T wave morphologies, and a CC of 0.73 for recovery maps. In a similar study, Graham et al 14 examined the accuracy of ECGI in 8 patients during pacing. They found that repolarization was recovered with a much lower accuracy than seen by us or in the dog model with a median CC of 0.57 [0.35–0.76] for T waves, and 0.55 [0.41–0.71] for RT maps with root mean square error of 51 [38–70] ms.
The different results are not likely attributable to species differences. We show that ECGI using a human donor heart showed no difference in accuracy to that seen using pig hearts. Rather, the difference may be attributable to the structural heart disease present in these patients, known to reduce the accuracy in ECGI reconstructions. 16 This difference may also be attributable to the difficulties in obtaining a true gold standard with clinical data. As highlighted by Graham and Orini 14 in their study, issues with aligning CARTO and ECGI geometries can have a drastic impact on the resulting CC and root mean square error values.
Our study has gone beyond these previous studies by (1) evaluating ECGI in the presence of abnormal repolarization gradients and (2) evaluating the accuracy of ECGI to reconstruct these gradients using a complete experimental data set.
Clinical Translation of Torso Tank Results
During the torso tank experiments the electrical properties of the extracardiac medium were homogeneous and lungs, bones, and other tissue inhomogeneities were absent. Previous validation studies have demonstrated a reduction in accuracy for ECGI when mapping epicardial activation in vivo and in clinics compared with previous studies in the torso tank, potentially attributable to the presence of tissue heterogeneities. 7 , 13 , 17 However, the strong correspondence seen here between ECGI results for ex vivo hearts in a drug‐free state and the in vivo hearts suggest the presence of inhomogeneous structures have little impact on the accuracy of ECGI for repolarization mapping. We presume that the impact of respiration may be important. By fixing the pericardium to the chest wall with the in vivo pig model, we have removed, to some extent, the normal movement of the heart during respiration. On the other hand, a previous study using ECGI in healthy individuals has demonstrated RT maps to be stable over time, 18 suggesting respiration has little impact for repolarization mapping. Taking all these considerations together, we feel that the results from this study can be translated to a clinical setting, allowing RT abnormalities to be studied with ECGI in patients, though interpretation of the results should take into consideration the spatial inaccuracies highlighted in this study.
Sources of Spatial Inaccuracies
This study demonstrated some spatial inaccuracies in ECGI repolarization maps, including a slight shift in the ΔRT (<1 cm), and an over‐ and underestimation of early and late repolarization regions. We suspect that these spatial inaccuracies are attributable to cardiac wall motion that is not taken into account by the static ECGI model. During systole, the ventricles undergo substantial torsional deformation, which is reversed in relaxation and early diastole. 19 Before recovery, therefore, the 3‐dimensional locations of ventricular epicardial surface landmarks are different than those assumed by ECGI (on the basis of heart imaging in diastole), potentially causing the shift and rotation of ΔRTs. The rapid reversal of torsional deformation during recovery may explain why ECGI tends to overestimate the size of early repolarization regions (and underestimate late repolarization). Using a dynamic heart model created through ECG‐gated magnetic resonance imaging or computed tomography images may help to reduce this error.
Clinical Relevance
Initial studies using ECGI have identified the presence of repolarization‐based abnormalities in various electrical diseases, including prolonged global recovery and steep gradients in patients with long QT, 5 marked abbreviation of global recovery and steep gradients in early repolarization syndrome, 3 steep ΔRTs in the right ventricular outflow tract of patients with Brugada syndrome, 4 local regions of abnormal repolarization in idiopathic ventricular fibrillation survivors that appear with exercise. 6
Until now, there has been little work to confirm the accuracy of ECGI to reconstruct these repolarization‐based substrates. This is particularly important given recent work showing the limitations of ECGI in mapping conduction‐based abnormalities. ECGI had previously been used to detect lines of conduction block and abnormal epicardial breakthroughs locations 4 , 6 , 20 previously postulated as providing the substrate and trigger, respectively, for arrhythmia in patients with electrical diseases. However, recent experimental and clinical validation studies 7 , 10 , 21 have demonstrated that these conduction‐based abnormalities often arise as an artefact in ECGI activation maps, and their presence should be confirmed through contact mapping.
The results of this study confirm that ECGI can accurately detect repolarization‐based abnormalities previously seen in clinical studies, including prolonged or abbreviated global repolarization and its dispersion, the location of abnormal regions of repolarization (although smaller or larger than reality), and the presence and magnitude of local repolarization gradients (although potentially spatially shifted). Furthermore, given that a stable regularization parameter is chosen, ECGI reconstruction of T‐wave morphologies and repolarization maps is consistent and stable on a beat‐to‐beat basis and comparable to sock recordings (Data S3), meaning the dynamic of these anomalies can be accurately assessed at rest and under stress.
Limitations
This study assessed a specific potential‐based ECGI formulation. In our online supplement, we demonstrate that this method reconstructs T waves, RTs and ΔRTs better than other common potential‐based methods (section S1). However, the absolute improvements in all metrics were minimal, and we suspect no drastic improvements in accuracy are achievable using other epicardial potential‐based formulations. Our potential‐based ECGI methods are also limited to solving the potentials at the epicardial surface, while an important contributor to arrhythmogenesis may actually be transmural dispersion of repolarization. The accuracy of ECGI for mapping the presence of large transmural repolarization dispersion remains unclear. Alternative ECGI methods using alternative cardiac source models may allow for further improvements in accuracy and would allow the mapping of transmural gradients. 22
The ability of ECGI to reconstruct small, localized repolarization abnormalities was not investigated, as the model of repolarization abnormalities was limited by size of the LAD perfusion bed.
Unlike in humans, the pig T wave is not concordant. However, validation using a human donor heart has demonstrated that this makes no difference on ECGI accuracy.
Conclusions
We have demonstrated that ECGI is highly applicable for mapping potentially critical repolarization abnormalities, including the prolongation/abbreviation of global repolarization and its dispersion, the location of abnormal repolarization regions, and the presence of local gradients. This noninvasive approach can be applied to quantifying abnormal repolarization‐based substrates in patients to help in diagnosis, risk stratification, and therapy evaluation.
Sources of Funding
This work was supported by the French National Research Agency (ANR‐10‐IAHU04‐LIRYC), La Fondation Coeur et Artères (FCA14T2), the European Research Council under the European Union's Seventh Framework Programme (FP/2007‐2013), the Leducq Foundation Transatlantic Network of Excellence RHYTHM Transatlantic Network (16CVD02), a Veni grant from the Netherlands Organization for Scientific Research (TTW 16772), and Programme Grant 09/067 from the Health Research Council of New Zealand.
Disclosures
Dr Cluitmans is employed part‐time by Philips Research. The remaining authors have no disclosures to report.
Supporting information
(J Am Heart Assoc. 2021;10:e020153. DOI: 10.1161/JAHA.120.020153.)
Supplementary Material for this article is available at https://www.ahajournals.org/doi/suppl/10.1161/JAHA.120.020153
For Sources of Funding and Disclosures, see page 11.
See Editorial by Rudy
References
- 1. Bear LR, Cuculich PS, Bernus O, Efimov I, Dubois R. Introduction to noninvasive cardiac mapping. Card Electrophysiol Clin. 2015;1–16. DOI: 10.1016/j.ccep.2014.11.015. [DOI] [PubMed] [Google Scholar]
- 2. Cluitmans M, Brooks D, MacLeod RS, Doessel O, Guillem M, Van Dam P, Svehlikova J, He B, Sapp J, Wang L, et al. Validation and opportunities of electrocardiographic imaging: from technical achievements to clinical applications. Front Physiol. 2018;1305. DOI: 10.3389/fphys.2018.01305. [DOI] [PMC free article] [PubMed] [Google Scholar]
- 3. Zhang J, Hocini M, Strom M, Cuculich PS, Cooper DH, Sacher F, Haïssaguerre M, Rudy Y. The electrophysiological substrate of early repolarization syndrome: noninvasive mapping in patients. JACC Clin Electrophysiol. 2017;894–904. DOI: 10.1016/j.jacep.2016.12.017. [DOI] [PMC free article] [PubMed] [Google Scholar]
- 4. Zhang J, Sacher F, Hoffmayer K, O’Hara T, Strom M, Cuculich P, Silva J, Cooper D, Faddis M, Hocini M, et al. Cardiac electrophysiological substrate underlying the ECG phenotype and electrogram abnormalities in brugada syndrome patients. Circulation. 2015;1950–1959. DOI: 10.1161/CIRCULATIONAHA.114.013698. [DOI] [PMC free article] [PubMed] [Google Scholar]
- 5. Vijayakumar R, Silva JNA, Desouza KA, Abraham RL, Strom M, Sacher F, Van Hare GF, Haissaguerre M, Roden DM, Rudy Y. Electrophysiologic substrate in congenital long QT syndrome: noninvasive mapping with electrocardiographic imaging (ECGI). Circulation. 2014;1936–1943. DOI: 10.1161/CIRCULATIONAHA.114.011359. [DOI] [PMC free article] [PubMed] [Google Scholar]
- 6. Leong KMW, Ng FS, Roney C, Cantwell C, Shun‐Shin MJ, Linton NWF, Whinnett ZI, Lefroy DC, Davies DW, Harding SE, et al. Repolarization abnormalities unmasked with exercise in sudden cardiac death survivors with structurally normal hearts. J Cardiovasc Electrophysiol. 2018;115–126. DOI: 10.1111/jce.13375. [DOI] [PubMed] [Google Scholar]
- 7. Duchateau J, Sacher F, Pambrun T, Derval N, Chamorro‐Servent J, Denis A, Ploux S, Hocini M, Jaïs P, Bernus O, et al. Performance and limitations of noninvasive cardiac activation mapping. Heart Rhythm. 2018;435–442. DOI: 10.1016/j.hrthm.2018.10.010. [DOI] [PubMed] [Google Scholar]
- 8. Aras K, Good W, Tate J, Burton B, Brooks D, Coll‐Font J, Doessel O, Schulze W, Potyagaylo D, Wang L, et al. Experimental data and geometric analysis repository—EDGAR. J Electrocardiol. 2015;975–981. DOI: 10.1016/j.jelectrocard.2015.08.008. [DOI] [PMC free article] [PubMed] [Google Scholar]
- 9. Bear LR, Cheng LK, LeGrice IJ, Sands GB, Lever NA, Paterson DJ, Smaill BH. Forward problem of electrocardiography. Circ Arrhythm Electrophysiol. 2015;677–684. DOI: 10.1161/CIRCEP.114.001573. [DOI] [PubMed] [Google Scholar]
- 10. Bear LR, Huntjens PR, Walton R, Bernus O, Coronel R, Dubois R. Cardiac electrical dyssynchrony is accurately detected by noninvasive electrocardiographic imaging. Heart Rhythm. 2018;1058–1069. DOI: 10.1016/j.hrthm.2018.02.024. [DOI] [PubMed] [Google Scholar]
- 11. Coronel R, Wilms‐Schopman FJ, Opthof T, Janse MJ. Dispersion of repolarization and arrhythmogenesis. Heart Rhythm. 2009;537–543. DOI: 10.1016/j.hrthm.2009.01.013. [DOI] [PubMed] [Google Scholar]
- 12. Ghanem RN, Burnes JE, Waldo AL, Rudy Y. Imaging dispersion of myocardial repolarization, II: noninvasive reconstruction of epicardial measures. Circulation. 2001;1306–1313. DOI: 10.1161/hc3601.094277. [DOI] [PubMed] [Google Scholar]
- 13. Cluitmans MJM, Bonizzi P, Karel JMH, Das M, Kietselaer BLJH, de Jong MMJ, Prinzen FW, Peeters RLM, Westra RL, Volders PGA. In‐vivo validation of electrocardiographic imaging. JACC Clin Electrophysiol. 2017;1–11. DOI: 10.1016/j.jacep.2016.11.012. [DOI] [PubMed] [Google Scholar]
- 14. Graham AJ, Orini M. Simultaneous comparison of electrocardiographic imaging and epicardial contact mapping in structural heart disease. Circ Arrhythm Electrophysiol. 2019;1–10. DOI: 10.1161/CIRCEP.118.007120. [DOI] [PubMed] [Google Scholar]
- 15. Cheng LK, Bodley JM, Pullan AJ. Effects of experimental and modeling errors on electrocardiographic inverse formulations. IEEE Trans Biomed Eng. 2003;23–32. DOI: 10.1109/TBME.2002.807325. [DOI] [PubMed] [Google Scholar]
- 16. Sapp JL, Dawoud F, Clements JC, Horacek B, Horácek BM. Inverse solution mapping of epicardial potentials: quantitative comparison with epicardial contact mapping. Circ Arrhythm Electrophysiol. 2012;1001–1009. DOI: 10.1161/CIRCEP.111.970160. [DOI] [PubMed] [Google Scholar]
- 17. Bear LR, LeGrice IJ, Sands GB, Lever NA, Loiselle DS, Paterson DJ, Cheng LK, Smaill BH. How accurate is inverse electrocardiographic mapping? Circ Arrhythm Electrophysiol. 2018;e006108. DOI: 10.1161/CIRCEP.117.006108. [DOI] [PubMed] [Google Scholar]
- 18. Blom LJ, Groeneveld SA, Wulterkens BM, van Rees B, Nguyen UC, Roudijk RW, Cluitmans M, Volders PGA, Hassink RJ. Novel use of repolarization parameters in electrocardiographic imaging to uncover arrhythmogenic substrate. J Electrocardiol. 2020;116–121. DOI: 10.1016/j.jelectrocard.2020.02.003. [DOI] [PubMed] [Google Scholar]
- 19. Young AA, Cowan BR. Evaluation of left ventricular torsion by cardiovascular magnetic resonance. J Cardiovasc Magn Reson. 2012;1–10. DOI: 10.1186/1532-429X-14-49. [DOI] [PMC free article] [PubMed] [Google Scholar]
- 20. Andrews CM, Srinivasan NT, Rosmini S, Bulluck H, Orini M, Jenkins S, Pantazis A, McKenna WJ, Moon JC, Lambiase PD, et al. Electrical and structural substrate of arrhythmogenic right ventricular cardiomyopathy determined using noninvasive electrocardiographic imaging and late gadolinium magnetic resonance imaging. Circ Arrhythm Electrophysiol. 2017;e005105. DOI: 10.1161/CIRCEP.116.005105. [DOI] [PMC free article] [PubMed] [Google Scholar]
- 21. Bear LR, Bouhamama O, Cluitmans M, Duchateau J, Walton RD, Abell E, Belterman C, Haissaguerre M, Bernus O, Coronel R, et al. Advantages and pitfalls of noninvasive electrocardiographic imaging. J Electrocardiol. 2019;S15–S20. DOI: 10.1016/j.jelectrocard.2019.08.007. [DOI] [PubMed] [Google Scholar]
- 22. van der Waal J, Meijborg V, Schuler S, Coronel R, Oostendorp T. In silico validation of electrocardiographic imaging to reconstruct the endocardial and epicardial repolarization pattern using the equivalent dipole layer source model. Med Biol Eng Comput. 2020;1739–1749. DOI: 10.1007/s11517-020-02203-y. [DOI] [PMC free article] [PubMed] [Google Scholar]
- 23. Wang Y, Rudy Y. Application of the method of fundamental solutions to potential‐based inverse electrocardiography. Ann Biomed Eng. 2006;1272–1288. DOI: 10.1007/s10439-006-9131-7. [DOI] [PMC free article] [PubMed] [Google Scholar]
- 24. Rudy Y, Messinger‐Rapport BJ. The inverse problem in electrocardiography: solutions in terms of epicardial potentials. Crit Rev Biomed Eng. 1988;215–268. [PubMed] [Google Scholar]
- 25. Tikhonov A, Arsenin V. Solution of Ill‐Posed Problems. Washington, DC: John Wiley & Sons; 1977. [Google Scholar]
- 26. Hansen PC, O’Leary DP, O’Leary DP. The use of the L‐curve in the regularization of discrete ill‐posed problems. SIAM J Sci Comput. 1993;1487–1503. DOI: 10.1137/0914086. [DOI] [Google Scholar]
- 27. Colli‐Franzone PC, Guerri L, Tentoni S, Viganotti C, Baruffi S, Spaggiari S, Taccardi B. A mathematical procedure for solving the inverse potential problem of electrocardiography. Analysis of the time‐space accuracy from in vitro experimental data. Math Biosci. 1985;353–396. DOI: 10.1016/0025-5564(85)90106-3. [DOI] [Google Scholar]
- 28. Rosenbaum DS, Jackson LE, Smith JM, Garan H, Ruskin JN, Cohen RJ. Electrical alternans and vulnerability to ventricular arrhythmias. N Engl J Med. 1994;235–241. DOI: 10.1056/NEJM199401273300402. [DOI] [PubMed] [Google Scholar]
- 29. Adam DR, Smith JM, Akselrod S, Nyberg S, Powell AO, Cohen RJ. Fluctuations in T‐wave morphology and susceptibility to ventricular fibrillation. J Electrocardiol. 1984;209–218. DOI: 10.1016/S0022-0736(84)80057-6. [DOI] [PubMed] [Google Scholar]
Associated Data
This section collects any data citations, data availability statements, or supplementary materials included in this article.


