Supplemental Digital Content is available in the text.
Keywords: body mass index, demography, obesity, prevalence, socioeconomic factors, waist circumference
Background:
China has seen a burgeoning epidemic of obesity in recent decades, but few studies reported nationally on obesity across socio-demographic subgroups. We sought to assess the prevalence and socio-demographic associations of obesity nationwide.
Methods:
We assessed the prevalence of overall obesity (body mass index ≥28 kg/m2) and abdominal obesity (waist circumference ≥85/90 cm for women/men) among 2.7 million community-dwelling adults aged 35 to 75 years in the China PEACE Million Persons Project from 2014 to 2018 and quantified the socio-demographic associations of obesity using multivariable mixed models.
Results:
Age-standardized rates of overall and abdominal obesity were 14.4% (95% CI, 14.3%–14.4%) and 32.7% (32.6%–32.8%) in women and 16.0% (15.9%–16.1%) and 36.6% (36.5%–36.8%) in men. Obesity varied considerably across socio-demographic subgroups. Older women were at higher risk for obesity (eg, adjusted relative risk [95% CI] of women aged 65–75 versus 35–44 years: 1.29 [1.27–1.31] for overall obesity, 1.76 [1.74–1.77] for abdominal obesity) while older men were not. Higher education was associated with lower risk in women (eg, adjusted relative risk [95% CI] of those with college or university education versus below primary school: 0.47 [0.46–0.48] for overall obesity, 0.61 [0.60–0.62] for abdominal obesity) but higher risk in men (1.07 [1.05–1.10], 1.17 [1.16–1.19]).
Conclusions:
In China, over 1 in 7 individuals meet criteria for overall obesity, and 1 in 3 for abdominal obesity. Wide variation exists across socio-demographic subgroups. The associations of age and education with obesity are significant and differ by sex. Understanding obesity in contemporary China has broad domestic policy implications and provides a valuable international reference.
What Is Known
Obesity is a global epidemic and has accelerated in China over the past decades, leaving the country with the largest number of obese individuals in the world.
With rapid socio-demographic transformations, China sees immense heterogeneity within its population of 2.7 million.
What the Study Adds
This study researched 2.7 million participants in China and found that more than 1 in 7 individuals meet criteria for overall obesity and 1 in 3 meet criteria for abdominal obesity.
It also showed that wide variation in obesity prevalence exists across socio-demographic subgroups and that the associations of age and education with obesity are significant and differ by sex.
These findings provide a sobering update on the current state of obesity in China, fill the knowledge gaps of obesity across socio-demographic subgroups, and provide a valuable international reference on obesity epidemiology.
Obesity is a global epidemic. More than 2 billion people are overweight or obese worldwide, and 62% of the population with obesity live in developing countries.1 Over the past decades, Asia has seen substantial increases in obesity.2 In 2014, China became home to the greatest number of obese women and men, totaling 90 million obese individuals and accounting for 14% of the world’s obesity based on body mass index (BMI).3 Furthermore, as central or visceral adiposity becomes increasingly recognized as a key cardiometabolic risk indicator beyond BMI,4 research suggests that the prevalence of abdominal obesity in China reached 32% in 2013 to 2014.5
As China’s rising obesity epidemic occurs in the context of its rapid economic and demographic shifts,6 understanding its current state of obesity helps inform health care policies in China and potentially other countries that undergo similar socioeconomic and epidemiological transitions.7 In addition, while culprits of obesity at the individual level are known to include unhealthy dietary changes (eg, increased consumption of energy-dense food) and reduced physical activities (eg, associated with occupational shift),8,9 interventions at the population level require understanding the heterogeneity within 1.4-billion Chinese people and warrant large-scale research to assess obesity across broad socio-demographic subgroups. For example, by 2014, across Chinese provinces, overall obesity rates had differed by about 20% points and abdominal obesity rates by over 30% points.5 However, current literature has limited reports on obesity across socio-demographic subgroups at the national level (Supplement I in the Data Supplement). This knowledge gap may partly result from a limitation of nationally representative studies, whereby potential sampling variability becomes a concern for analyses of subgroups that have very small sample sizes.10
In this study, we report obesity prevalence and risks in China from 2014 to 2018, using one of its largest and most recent health surveys—China Patient-centered Evaluative Assessment of Cardiac Events Million Persons Project.11 By analyzing 2.7 million participants in Million Persons Project, we aim to describe the prevalence of obesity and associated characteristics in women and men across broad socio-demographic subgroups.
Methods
Data Access Statement
The data are not available to other researchers at this time.
Project Design
The China Patient-centered Evaluative Assessment of Cardiac Events Million Persons Project protocol has been described previously.11 From September 2014 to November 2018, we sampled 189 regions (114 rural counties, 75 urban districts) in all 31 provinces of Mainland China to reflect geographic, ethnic, and economic diversity across the country. Within each region, about 5 rural towns or urban sub-districts were sampled based on their size, population stability, and local capacity to execute the study protocol. Participants were recruited by local staff via extensive publicity campaigns on television and in newspapers and enrolled if they were aged 35 to 75 years and currently registered in the selected region’s Hukou (an official record identifying residents in the region). Participants were then screened in person for health risks with collection of past medical, medication, family, and social histories and measurement of height, weight, and waist circumference (WC) among other anthropometric and biochemical assessments. Specifically, height and weight were measured to the nearest 0.1 kg or cm, while participants wore light clothes but no shoes or caps. WC was measured midway on skin between the iliac crest and the lower rib margin using a soft tape. Of note, because WC was not collected during the first year of study, we excluded all participants during that period in all WC-related analyses. This project complied with the Declaration of Helsinki and was approved by the central ethics committee at the China National Center for Cardiovascular Disease and the Institutional Review Board at Yale University. All enrolled participants provided informed consent.
Study Variables
Based on Chinese expert consensus on obesity-related hypertension management,12 we categorized BMI (calculated as weight in kilograms divided by height in meters squared) into underweight (BMI <18.5 kg/m2), normal weight (18.5–23.9 kg/m2), overweight (24.0–27.9 kg/m2), and obese (≥28.0 kg/m2) and defined (1) overall obesity as BMI ≥28.0 kg/m2 for both women and men and (2) abdominal obesity as WC ≥85 cm for women or WC ≥90 cm for men. We assessed 12 socio-demographic factors that are potentially associated with obesity and available in China Patient-centered Evaluative Assessment of Cardiac Events Million Persons Project, including age group (35–44, 45–54, 55–64, 65–75 in years), sex, ethnicity (Han, non-Han), marital status (married, others), education (below primary school, primary school, middle school, high school, college, or university), occupation (farmer, nonfarmer), annual household income (<10000, 10000–<50000, ≥50000 in RMB; 7 RMB was ≈1 USD during the study period), residence (urban, rural), geographic region (Western, Central, Eastern), health insurance, current smoking, and current drinking, in addition to 5 self-reported comorbidities (hypertension, dyslipidemia, diabetes, myocardial infarction, and stroke).
Statistical Analyses
We calculated the prevalence of overall and abdominal obesity by sex and as a sensitivity analysis determined the age-standardized prevalence at the national level by adjusting observation weights to match the age distributions in the 2010 Chinese Census.13 In addition, we reported descriptive statistics of obesity by socio-demographic factors and comorbidities and developed multivariable mixed models (with random effects to account for geographic autocorrelation) to quantify the association of socio-demographic factors with obesity. Lastly, we examined the prevalence of obesity in population subgroups that were defined by combinations of the 12 studied socio-demographic factors (details in Methods in the Data Supplement) and illustrated the probability densities of obesity prevalence in the subgroups with ≥500 people. Analyses were conducted with SAS 9.3 (SAS Institute Inc, Cary, NC) and R 3.02 (The R Foundation for Statistical Computing, Vienna, Austria).
Results
Of 2 660 666 enrolled participants September 2014 to November 2018, 43 654 (1.6%) were excluded from BMI analysis because of missing data; of 2 270 593 enrolled participants from 2015 to 2018, 18 016 (0.8%) were excluded from WC analysis because of missing data (Figure I in the Data Supplement). Among women, 15.8% met criteria for overall obesity and 37.6% for abdominal obesity. Among men, 15.0% met criteria for overall obesity and 36.3% for abdominal obesity. About 39% of women and men with abdominal obesity also met criteria for overall obesity (Figure II in the Data Supplement). Figure 1 shows distributions of BMI and WC in women and men. Using the 2010 Chinese Census data, we report age-standardized rates of overall and abdominal obesity to be 14.4% (95% CI, 14.3%–14.4%) and 32.7% (32.6%–32.8%) in women and 16.0% (15.9%–16.1%) and 36.6% (36.5%–36.8%) in men.
Figure 1.
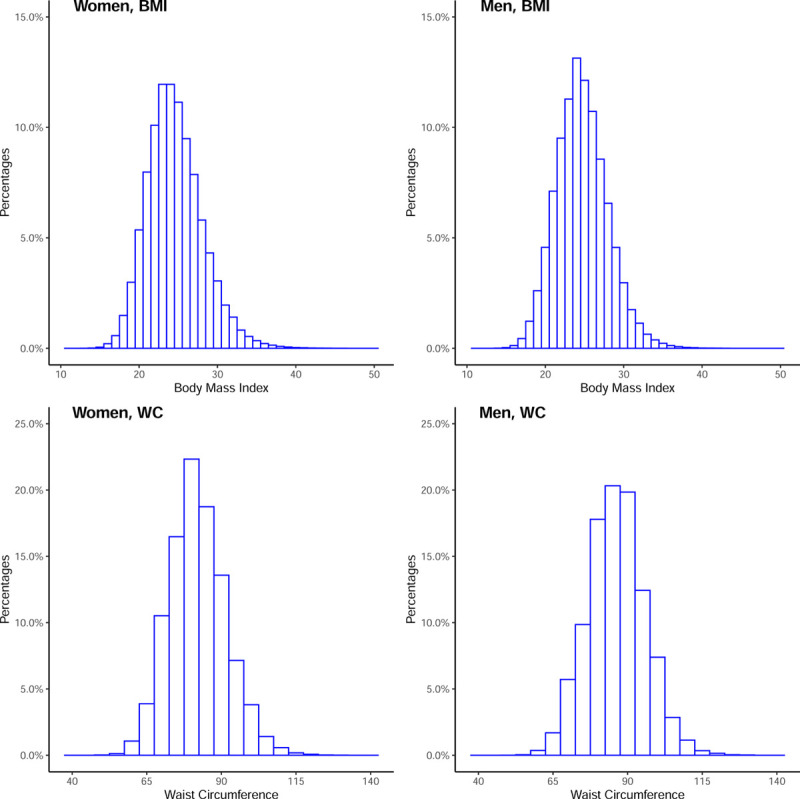
Distribution of body mass index (BMI) and waist circumference (WC) in women and men. Less than 0.1% of data (N=1816) represented BMI >50 kg/m2, BMI <10 kg/m2, WC >140 cm, or WC <40 cm and were not shown on the histograms above.
Compared with individuals with normal weight, women with overall obesity had higher prevalence of hypertension, dyslipidemia, diabetes, stroke, and myocardial infarction with percent differences in prevalence of 30.4, 16.1, 6.0, 1.4, and 0.4, respectively; men with overall obesity had higher prevalence by 29.9, 31.2, 5.8, 1.4, and 0.7 (Table 1 and Table 2). Higher prevalence of these comorbidities was also observed in women and men with abdominal obesity compared with those without (Table 3 and Table 4).
Table 1.
Distributions of Body Mass Index by Socio-Demographic Factors and Comorbidities in Women
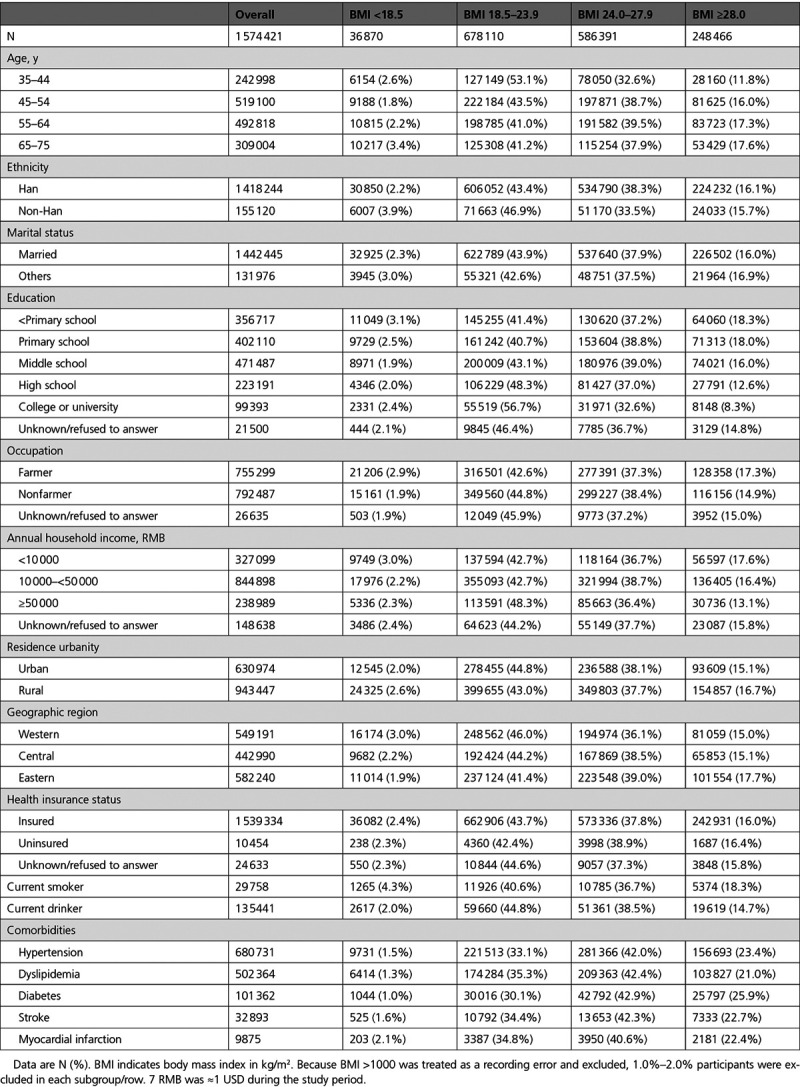
Table 2.
Distributions of Body Mass Index by Socio-Demographic Factors and Comorbidities in Men
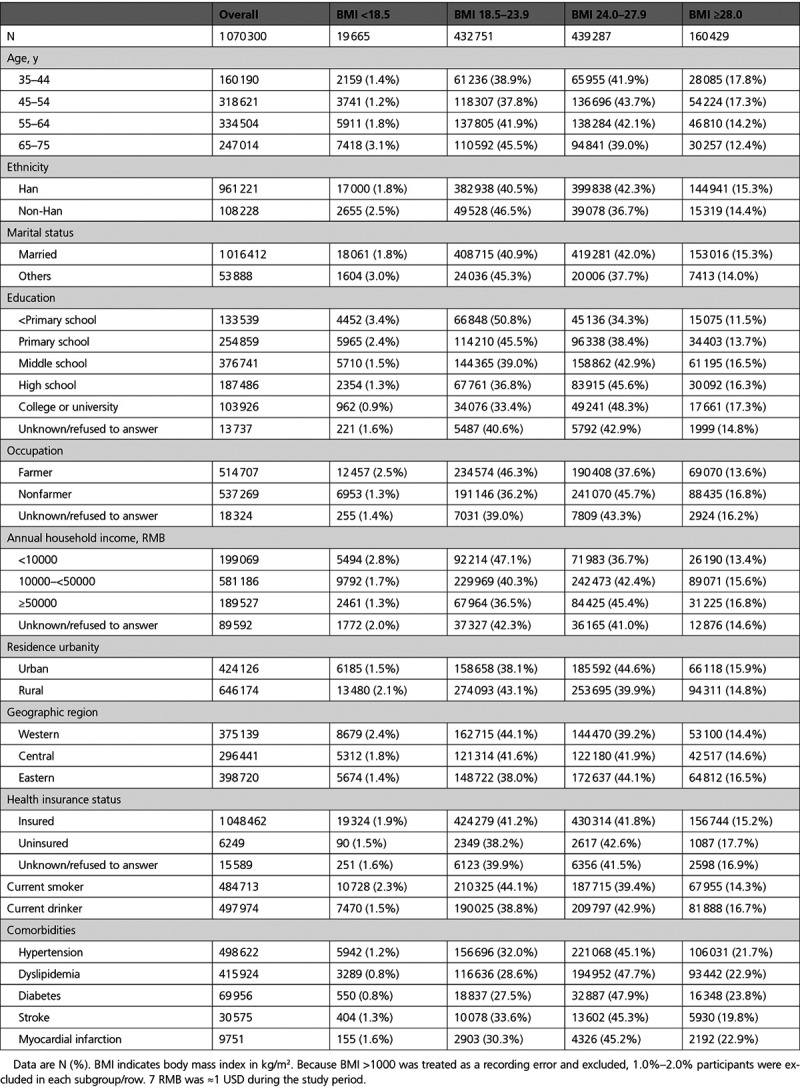
Table 3.
Distributions of Waist Circumference by Socio-Demographic Factors and Comorbidities in Women
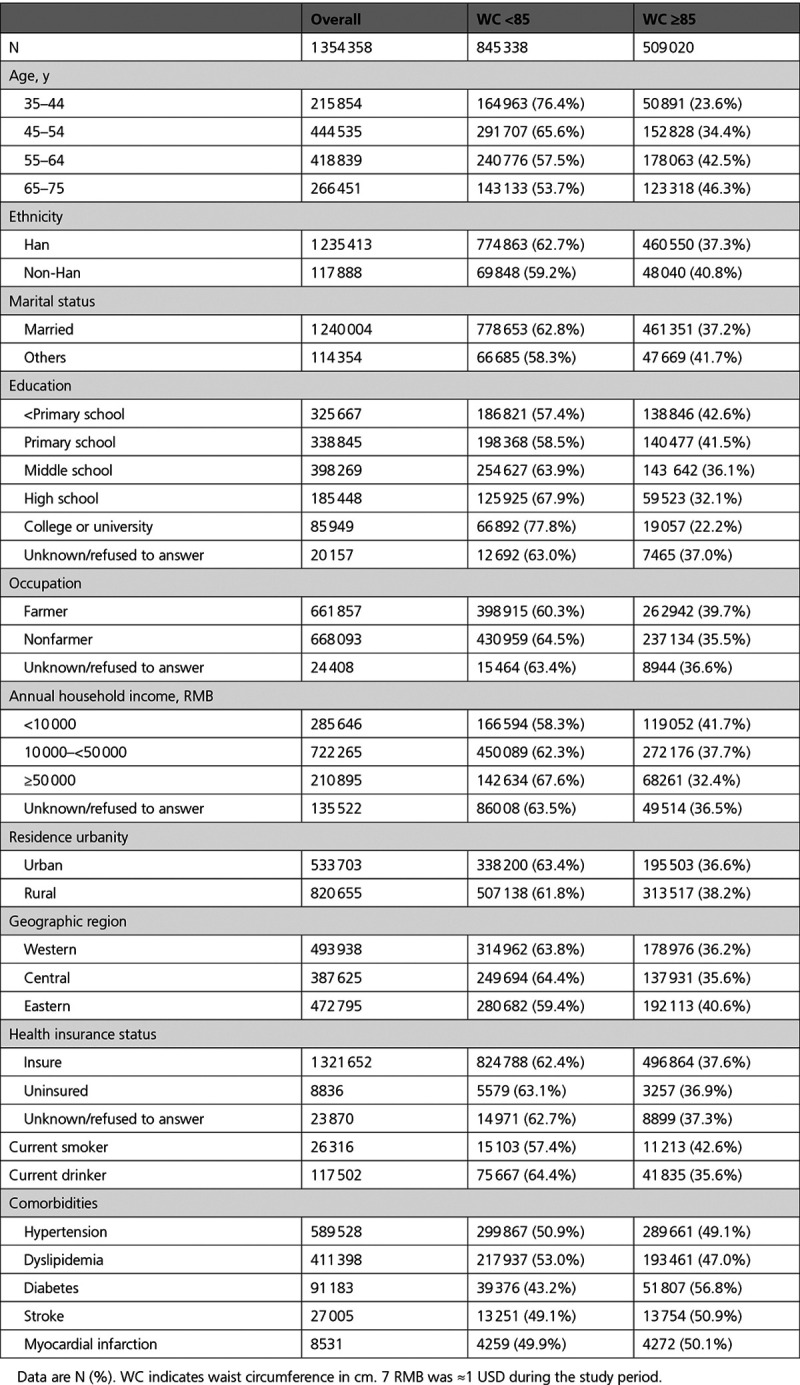
Table 4.
Distributions of Waist Circumference by Socio-Demographic Factors and Comorbidities in Men
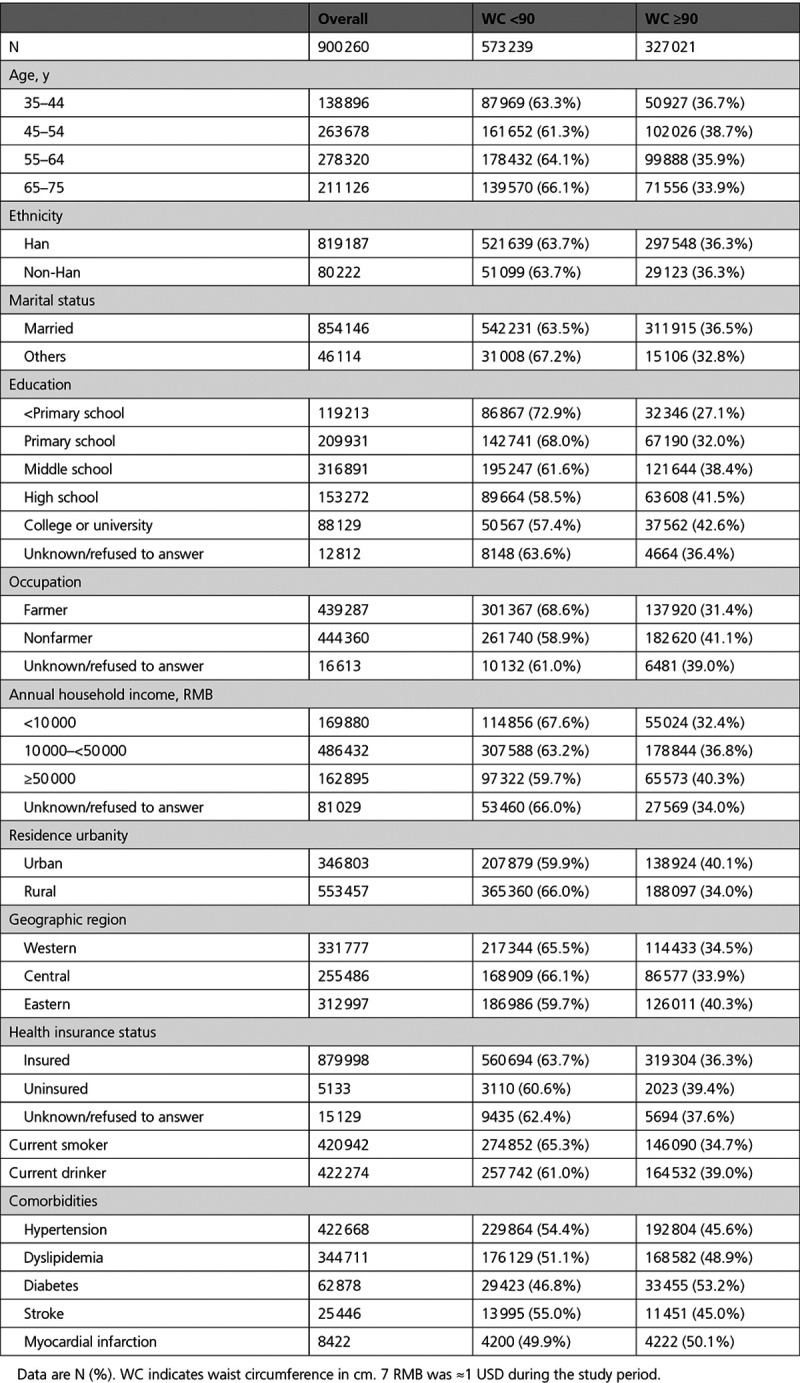
Distributions of BMI in socio-demographic subgroups of women and men were shown in Table 1 and Table 2; distributions of WC were shown in Table 3 and Table 4. In multivariable-adjusted models, older women were at substantially higher risks for overall and abdominal obesity while older men were not (Figure 2). For example, compared with women aged 35 to 44 years, those aged 65 to 75 years were 29% and 76% more likely to meet criteria for overall and abdominal obesity, whereas men aged 65 to 75 years were 26% less likely to meet criteria for overall obesity compared with those aged 35 to 44 years. Interestingly, the abdominal obesity rates in subpopulations of women aged 65 to 75 years were evidently higher than those in subpopulations of women aged 35 to 45 years, while the overall and abdominal obesity rates in subpopulations of men aged 35 to 44 and 65 to 75 years overlapped considerably (Figure 3).
Figure 2.
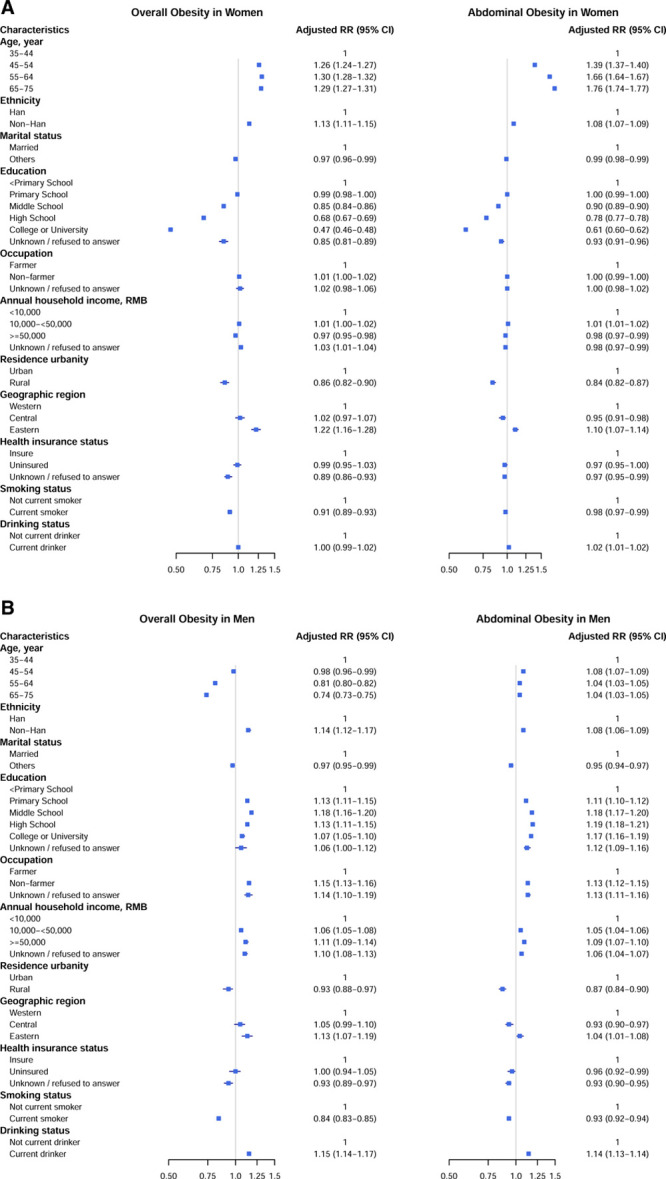
Multivariable-adjusted relative risks (RR) for overall and abdominal obesity in (A) women and (B) men. All variables are mutually adjusted in log-binomial models with community/village-specific random effects. For analysis of abdominal obesity in men, Poisson-binomial models were used to achieve convergence. 7 RMB was ≈1 USD during the study period.
Figure 3.
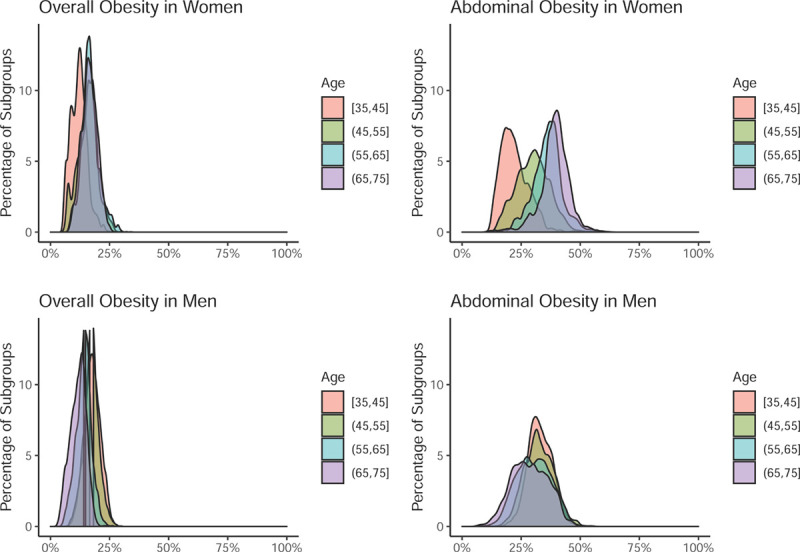
Prevalence of obesity across population subgroups with ≥500 people each. This figure illustrates the distribution of obesity prevalence among 337 956 population subgroups that were defined by different combinations of the 12 studied socio-demographic factors and that had a minimal size of 500 people (details in Methods in the Data Supplement). For example, the top right panel shows that among women aged 65–75 y, about half (the right half of the purple curve) of population subgroups had a prevalence of abdominal obesity above 40% (x axis).
Other factors associated with obesity were notable for ethnicity, education, annual household income, and current smoking and drinking status. Overall, non-Han people were at higher adjusted risks for obesity (Figure 2). For both overall and abdominal obesity, higher education was associated with lower adjusted risks in women but higher risks in men (Figure 2). For example, women with college or university education were associated with 3.46 (3.37–3.54) cm smaller WC than those with below primary school education, while men with college or university education were associated with 1.36 (1.26–1.46) cm larger WC than those with below primary school education (Table in the Data Supplement). For both overall and abdominal obesity, among all annual household income categories, women with annual household income of 10 000 to <50 000 RMB were at the highest adjusted risk, while men with annual household income ≥50 000 RMB were at the highest adjusted risk (Figure 2). Lastly, for both women and men, current smoking was associated with lower adjusted risks for obesity, while current drinking was associated with higher adjusted risks for obesity (Figure 2), although the associations were smaller in magnitude among women than men (Table in the Data Supplement).
Discussion
In this study of 2.7 million Chinese adults from 2014 to 2018, we report >15% women and men with overall obesity and over 35% with abdominal obesity. We further show that the significant associations of age and education with obesity differ by sex and that considerable heterogeneity in obesity prevalence exists across socio-demographic subgroups. Our results unequivocally document abdominal obesity as a highly prevalent phenotype in China and demonstrate sex differences in age and education as potential risk factors for obesity.
Studying obesity epidemiology is crucial to population health. BMI is strongly associated with higher incidence of ischemic stroke and diabetes in China,14,15 and for a given BMI, mainland Chinese have higher odds of comorbidities than White people in the US.16 In our study, the prevalence of hypertension, dyslipidemia, diabetes, stroke, and myocardial infarction in the overall obese population is about twice that in the normal weight population. In addition, WC is important for obesity research in China, because many high-WC Asians at what is considered a normal BMI (<25 kg/m2) in Western studies are at higher risks for cardiometabolic diseases.4,17 Our study finds an alarmingly high prevalence of abdominal obesity at over 35%, more than twice the prevalence of overall obesity based on BMI alone.
For domestic comparison, our results among adults aged 35 to 75 years are similar to estimates based on the most recently published, nationally representative data. For example, the China Chronic Disease and Risk Factor Surveillance data suggest that among adults aged 18 years or older in 2013 to 2014, prevalence of overall and abdominal obesity were 14% and 31% in men and 14% and 32% in women,5 and the China Physical Fitness Surveillance Center data suggest that among Chinese adults aged 35 to 59 years in 2014, prevalence of overall and abdominal obesity were 14% to 15% and 25% to 37%, respectively.18 For international comparison, take the United States as an example: in 2015 to 2016, rates of overall and abdominal obesity were 41% and 69% among females and 38% and 48% among males19; before that, overall obesity had appeared stabilized from 2003 to 2012,20 while abdominal obesity had continued climbing.21 Given the prevalent burden of abdominal obesity in China and perhaps globally, WC should be considered as a routine measure in clinical services, a meaningful target in preventive health care, and an important metric in public health policy.
One other important finding of this study is the strong, positive association of age groups with BMI and WC in women but the strong, negative association of age groups with BMI in men. This pattern is not widely reported or characterized in the literature. One possible biological explanation is that postmenopausal women tend to accumulate more abdominal fat due to the deficiency of estrogen, which normally reduces visceral fat by modulating adipose tissue metabolism and leptin responsiveness.22 Our study also finds that the association of education with obesity differs by sex. This interesting pattern has been noted in the literature, and a recent study of Chinese monozygotic twins suggests that genetic and shared environmental factors confound the (negative) association between education and BMI in females and that unique environmental correlations between education and BMI were only significant in males.23 While future research should examine how education may affect obesity differently in different demographics, increasing educational attainment and reducing inequality remains a top public health priority as lower educational level has been shown to be the leading modifiable risk factor for death worldwide and the second for cardiovascular disease in middle-income countries.24
One notable complex finding of our study is on the relationship between household income and obesity for several reasons. First, data from 1991 to 2011 in China suggest that socioeconomic status positively affected BMI trajectories in males but not females, a reflection of social disparity.25 Our study similarly found positive associations between household income and obesity in men but not women and may add to this literature. Second, increasing household income could exhibit both deleterious effects of nutritional excess and protective effects of improved dietary quality. For example, the negative income elasticity of demand for inferior goods supports that increasing household income may reduce demand for staple food like rice and potato in favor of substitutes with higher dietary quality and diversity. Third, annual household income may misrepresent long-term household resource, which more reliably determines nutritional status. For example, when Russia experienced rapid economic decline followed by a drastic rebound in 1996 to 2000, population nutritional status was affected by long-term household resource but resilient to short-term fluctuation.26 Therefore, favorable dietary changes and an imperfect household resource measure may obscure the link between income and obesity in our study.
Understanding the state of obesity in China has implications for the world. Current global trends predict obesity prevalence of 18% in men and 21% in women by 2025.3 In health trajectory forecasts of 195 countries and territories for 2016 to 2040, rising BMI will slow down the global progress in extending life expectancy and by 2040 become the leading risk factor for years of life lost in 76 countries, followed by tobacco in 48 and high blood pressure in 25; because rising BMI is amenable to population-level interventions, ample room exists for both improvement and deterioration of future health trajectories.27 In high-income countries, abdominal obesity is the third leading modifiable risk factor for death with a population attributable fraction of 11%.24 In low-income and middle-income countries, nutritional transition has followed similar patterns that high-income countries experienced in the past, but it has occurred faster and earlier relative to their levels of socioeconomic development.28 In addition, socioeconomic advancement in low-income populations may increase cardiometabolic disease risk even at levels that do not substantially affect high-income populations.29 In fact, over the past 3 decades, over half of the global rise in BMI was due to increases in BMI in rural areas in low- and middle-income countries.30 Interpreting our results in this context highlights the urgency to address the rising obesity epidemic globally and particularly in emerging economies via early, proactive, multi-level interventions.
Several limitations apply to our study. First, timely recruitment of 2.7 million participants across China came with the trade-off of fully representative sampling. For example, compared with the underlying population, rural participants could be healthier (eg, healthy worker effect) or less healthy (eg, participation in research to fulfill unmet healthcare needs). However, our main results closely resemble age-standardized prevalence estimates using the 2010 Chinese Census data and 2 most recently published, independent reports based on nationally representative data from 2014.5,18 Second, we do not currently have diet and physical activity data on all participants to interrogate their associations with obesity at the individual level; instead, we focus on understanding socio-demographic factors in China to address obesity at the population level. Third, given its cross-sectional design, this study lacks data to assess BMI and WC patterns over time or establish causal determinants of obesity, although a longitudinal study on a similar scale is unprecedented.
In summary, we estimated the prevalence of obesity and its socio-demographic associations in China and report more than one in 7 individuals with overall obesity and one in 3 with abdominal obesity. We show that wide variation in obesity prevalence exists across socio-demographic subgroups and that the associations of age and education with obesity are significant and differ by sex. Understanding the current state of obesity in China has broad implications on public health policy in China and in other emerging economies.
Acknowledgments
We thank all study participants for their participation. We appreciate all provincial and regional officers and research staff for their collection of data and list members of the provincial coordinating offices of the China Patient-centered Evaluative Assessment of Cardiac Events Million Persons Project (Supplement II in the Data Supplement). We also appreciate the project teams at the National Center for Cardiovascular Diseases for their contributions to project design and operations, particularly Yang Yang, Jingwei Yang, Jianlan Cui, Wei Xu, Bo Gu, Xi Li, and Hui Zhong for data collection. We also appreciate Yale New Haven Hospital Center for Outcomes Research and Evaluation for their contributions to project design.
Sources of Funding
This work was supported by the National Key Research and Development Program from the Ministry of Science and Technology of China (2017YFC1310801); the Major Public Health Service Project from the Ministry of Finance and National Health Commission of China; and the 111 Project from the Ministry of Education of China (B16005).
Disclosures
Dr Mu reports personal fees from HealthCare Royalty Partners outside the submitted work. Dr Y. Lu is supported by the National Heart, Lung, and Blood Institute (K12HL138037) and the Yale Center for Implementation Science. Dr Spatz receives support from the Centers for Medicare and Medicaid Services to develop and maintain performance measures used in public reporting programs and from the Food and Drug Administration to support projects within the Yale-Mayo Clinic Center of Excellence in Regulatory Science and Innovation (CERSI); receives support from the National Institute on Minority Health and Health Disparities (U54MD010711-01) to study precision-based approaches to diagnosing and preventing hypertension and the National Institute of Biomedical Imaging and Bioengineering (R01EB028106-01) to study a cuff-less blood pressure device. In the past three years, Harlan Krumholz received expenses and/or personal fees from UnitedHealth, IBM Watson Health, Element Science, Aetna, Facebook, the Siegfried and Jensen Law Firm, Arnold and Porter Law Firm, Martin/BaughmanLaw Firm, F-Prime, and the National Center for Cardiovascular Diseases in Beijing. He is a co-founder of Refactor Health and HugoHealth, and had grants and/or contracts from the Centers for Medicare & Medicaid Services, Medtronic, the U.S. Food and Drug Administration, Johnson & Johnson, and the Shenzhen Center for Health Information. The other authors report no conflicts.
Supplemental Materials
Supplements I and II
Expanded Methods
Figures I and II
Table
Supplementary Material
Footnotes
L. Mu and J. Liu contributed equally.
H.M. Krumholz and X. Zheng contributed equally.
The Data Supplement is available at https://www.ahajournals.org/doi/suppl/10.1161/CIRCOUTCOMES.120.007292.
This article was sent to Dennis T. Ko, MD, Senior Guest Editor, for review by expert referees, editorial decision, and final disposition.
Contributor Information
Lin Mu, Email: lin.mu@yale.edu.
Jiamin Liu, Email: jiamin.liu@fwoxford.org.
Guohai Zhou, Email: gzhou5@bwh.harvard.edu.
Chaoqun Wu, Email: chaoqun.wu@fwoxford.org.
Bowang Chen, Email: bowang.chen@fwoxford.org.
Yuan Lu, Email: jiapeng.lu@fwoxford.org.
Jiapeng Lu, Email: jiapeng.lu@fwoxford.org.
Xiaofang Yan, Email: xiaofang.yan@fwoxford.org.
Zhihong Zhu, Email: zhihong.zhu@fwoxford.org.
Khurram Nasir, Email: knasir@houstonmethodist.org.
Erica S. Spatz, Email: erica.spatz@yale.edu.
Harlan M. Krumholz, Email: harlan.krumholz@yale.edu.
References
- 1.Ng M, Fleming T, Robinson M, Thomson B, Graetz N, Margono C, Mullany EC, Biryukov S, Abbafati C, Abera SF, et al. Global, regional, and national prevalence of overweight and obesity in children and adults during 1980-2013: a systematic analysis for the Global Burden of Disease Study 2013. Lancet. 2014;384:766–781. doi: 10.1016/S0140-6736(14)60460-8 [DOI] [PMC free article] [PubMed] [Google Scholar]
- 2.Ramachandran A, Snehalatha C. Rising burden of obesity in Asia. J Obes. 2010;2010:868573. doi: 10.1155/2010/868573 [DOI] [PMC free article] [PubMed] [Google Scholar]
- 3.NCD Risk Factor Collaboration (NCD-RisC). Trends in adult body-mass index in 200 countries from 1975 to 2014: a pooled analysis of 1698 population-based measurement studies with 19.2 million participants. Lancet. 2016;387:1377–1396. doi: 10.1016/S0140-6736(16)30054-X [DOI] [PMC free article] [PubMed] [Google Scholar]
- 4.Hiuge-Shimizu A, Kishida K, Funahashi T, Ishizaka Y, Oka R, Okada M, Suzuki S, Takaya N, Nakagawa T, Fukui T, et al. Reduction of visceral fat correlates with the decrease in the number of obesity-related cardiovascular risk factors in Japanese with Abdominal Obesity (VACATION-J Study). J Atheroscler Thromb. 2012;19:1006–1018. doi: 10.5551/jat.12963 [DOI] [PubMed] [Google Scholar]
- 5.Zhang X, Zhang M, Zhao Z, Huang Z, Deng Q, Li Y, Pan A, Li C, Chen Z, Zhou M, et al. Geographic variation in prevalence of adult obesity in China: results from the 2013-2014 National Chronic Disease and risk factor surveillance. Ann Intern Med. 2020;172:291–293. doi: 10.7326/M19-0477 [DOI] [PubMed] [Google Scholar]
- 6.Wu Y, Benjamin EJ, MacMahon S. Prevention and control of cardiovascular disease in the rapidly changing economy of China. Circulation. 2016;133:2545–2560. doi: 10.1161/CIRCULATIONAHA.115.008728 [DOI] [PMC free article] [PubMed] [Google Scholar]
- 7.Popkin BM. Synthesis and implications: China’s nutrition transition in the context of changes across other low- and middle-income countries. Obes Rev. 2014;15(suppl 1):60–67. doi: 10.1111/obr.12120 [DOI] [PMC free article] [PubMed] [Google Scholar]
- 8.Batis C, Sotres-Alvarez D, Gordon-Larsen P, Mendez MA, Adair L, Popkin B. Longitudinal analysis of dietary patterns in Chinese adults from 1991 to 2009. Br J Nutr. 2014;111:1441–1451. doi: 10.1017/S0007114513003917 [DOI] [PMC free article] [PubMed] [Google Scholar]
- 9.Ng SW, Howard AG, Wang HJ, Su C, Zhang B. The physical activity transition among adults in China: 1991-2011. Obes Rev. 2014;15(suppl 1):27–36. doi: 10.1111/obr.12127 [DOI] [PMC free article] [PubMed] [Google Scholar]
- 10.Ford ES, Li C, Zhao G, Tsai J. Trends in obesity and abdominal obesity among adults in the United States from 1999-2008. Int J Obes (Lond). 2011;35:736–743. doi: 10.1038/ijo.2010.186 [DOI] [PubMed] [Google Scholar]
- 11.Lu J, Xuan S, Downing NS, Wu C, Li L, Krumholz HM, Jiang L. Protocol for the China PEACE (Patient-centered Evaluative Assessment of Cardiac Events) Million Persons Project pilot. BMJ Open. 2016;6:e010200. doi: 10.1136/bmjopen-2015-010200 [DOI] [PMC free article] [PubMed] [Google Scholar]
- 12.Hypertension Study Group of Chinese Society of Cardiology of Chinese Medical Association. Chinese expert consensus on obesity-related hypertension management. Zhonghua Xin Xue Guan Bing Za Zhi. 2016;44:212–219. doi: 10.3760/cma.j.issn.0253-3758.2016.03.006 (in Chinese) [DOI] [PubMed] [Google Scholar]
- 13.National Bureau of Statistics of China. 2010 Population Census of People’s Republic of China. Accessed March 5, 2020. http://www.stats.gov.cn/english/Statisticaldata/CensusData/rkpc2010/indexch.htm
- 14.Chen Z, Iona A, Parish S, Chen Y, Guo Y, Bragg F, Yang L, Bian Z, Holmes MV, Lewington S, et al. ; China Kadoorie Biobank collaborative group. Adiposity and risk of ischaemic and haemorrhagic stroke in 0·5 million Chinese men and women: a prospective cohort study. Lancet Glob Health. 2018;6:e630–e640. doi: 10.1016/S2214-109X(18)30216-X [DOI] [PMC free article] [PubMed] [Google Scholar]
- 15.Bragg F, Tang K, Guo Y, Iona A, Du H, Holmes MV, Bian Z, Kartsonaki C, Chen Y, Yang L, et al. ; China Kadoorie Biobank (CKB) Collaborative Group. Associations of general and central adiposity with incident diabetes in Chinese men and women. Diabetes Care. 2018;41:494–502. doi: 10.2337/dc17-1852 [DOI] [PMC free article] [PubMed] [Google Scholar]
- 16.He W, Li Q, Yang M, Jiao J, Ma X, Zhou Y, Song A, Heymsfield SB, Zhang S, Zhu S. Lower BMI cutoffs to define overweight and obesity in China. Obesity (Silver Spring). 2015;23:684–691. doi: 10.1002/oby.20995 [DOI] [PubMed] [Google Scholar]
- 17.WHO Expert Consultation. Appropriate body-mass index for Asian populations and its implications for policy and intervention strategies. Lancet. 2004;363:157–163. doi: 10.1016/S0140-6736(03)15268-3 [DOI] [PubMed] [Google Scholar]
- 18.Tian Y, Jiang C, Wang M, Cai R, Zhang Y, He Z, Wang H, Wu D, Wang F, Liu X, et al. BMI, leisure-time physical activity, and physical fitness in adults in China: results from a series of national surveys, 2000-14. Lancet Diabetes Endocrinol. 2016;4:487–497. doi: 10.1016/S2213-8587(16)00081-4 [DOI] [PubMed] [Google Scholar]
- 19.Centers for Disease Control and Prevention. Chronic Kidney Disease Surveillance System—United States. Accessed March 5, 2020. https://nccd.cdc.gov/ckd/TopicHome/BurdenOfRiskFactors.aspx
- 20.Ogden CL, Carroll MD, Kit BK, Flegal KM. Prevalence of childhood and adult obesity in the United States, 2011-2012. JAMA. 2014;311:806–814. doi: 10.1001/jama.2014.732 [DOI] [PMC free article] [PubMed] [Google Scholar]
- 21.Ford ES, Maynard LM, Li C. Trends in mean waist circumference and abdominal obesity among US adults, 1999-2012. JAMA. 2014;312:1151–1153. doi: 10.1001/jama.2014.8362 [DOI] [PMC free article] [PubMed] [Google Scholar]
- 22.Lovejoy JC, Sainsbury AStock Conference 2008 Working Group. Sex differences in obesity and the regulation of energy homeostasis. Obes Rev. 2009;10:154–167. doi: 10.1111/j.1467-789X.2008.00529.x [DOI] [PubMed] [Google Scholar]
- 23.Liao C, Gao W, Cao W, Lv J, Yu C, Wang S, Li C, Pang Z, Cong L, Dong Z, et al. Association of educational level and marital status with obesity: a study of Chinese twins. Twin Res Hum Genet. 2018;21:126–135. doi: 10.1017/thg.2018.8 [DOI] [PubMed] [Google Scholar]
- 24.Yusuf S, Joseph P, Rangarajan S, Islam S, Mente A, Hystad P, Brauer M, Kutty VR, Gupta R, Wielgosz A, et al. Modifiable risk factors, cardiovascular disease, and mortality in 155 722 individuals from 21 high-income, middle-income, and low-income countries (PURE): a prospective cohort study. Lancet. 2020;395:795–808. doi: 10.1016/S0140-6736(19)32008-2 [DOI] [PMC free article] [PubMed] [Google Scholar]
- 25.Fang C, Liang Y. Social disparities in body mass index (BMI) trajectories among Chinese adults in 1991-2011. Int J Equity Health. 2017;16:146. doi: 10.1186/s12939-017-0636-5 [DOI] [PMC free article] [PubMed] [Google Scholar]
- 26.Stillman S, Thomas D. Nutritional status during an economic crisis: evidence from Russia. Econ J. 2008;118:1385–1417. [Google Scholar]
- 27.Foreman KJ, Marquez N, Dolgert A, Fukutaki K, Fullman N, McGaughey M, Pletcher MA, Smith AE, Tang K, Yuan CW, et al. Forecasting life expectancy, years of life lost, and all-cause and cause-specific mortality for 250 causes of death: reference and alternative scenarios for 2016-40 for 195 countries and territories. Lancet. 2018;392:2052–2090. doi: 10.1016/S0140-6736(18)31694-5 [DOI] [PMC free article] [PubMed] [Google Scholar]
- 28.Popkin BM. The shift in stages of the nutrition transition in the developing world differs from past experiences! Public Health Nutr. 2002;51A205–214. doi: 10.1079/PHN2001295 [DOI] [PubMed] [Google Scholar]
- 29.Godfrey KM, Gluckman PD, Hanson MA. Developmental origins of metabolic disease: life course and intergenerational perspectives. Trends Endocrinol Metab. 2010;21:199–205. doi: 10.1016/j.tem.2009.12.008 [DOI] [PubMed] [Google Scholar]
- 30.NCD Risk Factor Collaboration (NCD-RisC). Rising rural body-mass index is the main driver of the global obesity epidemic in adults. Nature. 2019;569:260–264. doi: 10.1038/s41586-019-1171-x [DOI] [PMC free article] [PubMed] [Google Scholar]
Associated Data
This section collects any data citations, data availability statements, or supplementary materials included in this article.


