

Abstract
Household heating using wood stoves is common practice in many rural areas of the United States (US) and can lead to elevated concentrations of indoor fine particulate matter (PM2.5). We collected 6-day measures of indoor PM2.5 during the winter and evaluated household and stove-use characteristics in homes at three rural and diverse study sites. The median indoor PM2.5 concentration across all homes was 19 μg/m3, with higher concentrations in Alaska (median=30, minimum=4, maximum=200, n=10) and Navajo Nation homes (median=29, minimum=3, maximum=105, n=23) compared to Montana homes (median=16, minimum=2, maximum=139, n=59). Households that had not cleaned the chimney within the past year had 65% higher geometric mean PM2.5 compared to those with chimney cleaned within 6 months (95% confidence interval [CI]: −1, 170). Based on a novel wood stove grading method, homes with low-quality and medium-quality stoves had substantially higher PM2.5 compared to homes with higher-quality stoves (186% higher [95% CI: 32, 519] and 161% higher; [95% CI:27, 434], respectively). Our findings highlight the need for, and complex nature of, regionally-appropriate interventions to reduce indoor air pollution in rural wood-burning regions. Higher quality stoves and behavioral practices such as regular chimney cleaning may help improve indoor air quality in such homes.
Keywords: Indoor air pollution, Wood stove, Biomass burning, Particulate matter, Stove use, Rural health
Introduction
Exposure to fine particulate matter air pollution (PM2.5; airborne particles less than 2.5 μm in aerodynamic diameter) from the combustion of biomass fuels is an important global risk factor for morbidity and mortality (Stanaway et al. 2018). However, much of the research on health effects and exposure characterization from biomass fuel combustion has been related to stoves used for domestic cooking purposes in lower- and middle-income countries. In the United States (US), approximately 12.7 million homes burn wood fuel as a primary or secondary heating source (U.S. Energy Information Agency 2015).
Previous studies indicate that the use of wood stoves for heating can result in indoor PM2.5 concentrations that often exceed health-based ambient air quality standards from the US Environmental Protection Agency (EPA; 35 μg/m3 over a 24-hr period, 12 μg/m3 annual mean) (US EPA 2016). Mean indoor PM2.5 concentrations of 51 μg/m3 (standard deviation [sd] = 32, n = 16) (Ward and Noonan 2008) and 45 μg/m3 (sd = 33, n = 21) (Noonan et al. 2012) have been reported in wood stove households in rural Montana. Mean PM2.5 concentrations of 29 μg/m3 (sd = 30, n = 84) were reported in rural homes throughout Montana, Idaho, and Alaska (Semmens et al. 2015). Other studies have reported similar, although highly variable, indoor PM2.5 concentrations in wood stove homes across the US (Noonan et al. 2012; Singleton et al. 2017; Ward et al. 2011) and other developed countries (Allen et al. 2009; Wyss et al. 2016).
There have been interventions aimed at lowering indoor PM2.5 concentrations in homes that heat with wood stoves, but results have been inconsistent. A wood stove changeout program in Libby, Montana reported 71% lower indoor PM2.5 concentrations following the replacement of older wood stoves with new EPA-certified models (Ward and Noonan 2008). In a separate study, a wood stove changeout had no impact on indoor PM2.5 concentrations, although indoor PM2.5 was 66% lower compared to placebo homes following an air filtration intervention (McNamara et al. 2017; Ward et al. 2017). A review of studies showed that indoor PM2.5 concentrations were 23% to 92% lower with the use of portable air purifiers compared to control across a number of different study settings, although only 3 studies in the review took place in homes with indoor wood burning (Cheek et al. 2020).
Some factors have been identified that help explain the complexity towards understanding indoor air pollution exposures in homes that use wood stoves. For example, associations have been observed between socioeconomic status, size of the home, and age of wood prior to burning and indoor PM2.5 concentrations (Semmens et al. 2015). However, the household, cultural, and behavioral factors among households that rely on wood stoves for heating are complex (Champion et al. 2017; Rokoff et al. 2017; Singleton et al. 2017). Further research is needed to readily identify households at risk for elevated indoor PM2.5 concentrations in order to implement and evaluate culturally appropriate interventions.
We evaluated household and stove-use characteristics alongside measures of indoor PM2.5 within the framework of a randomized intervention trial called KidsAIR (Kids Air Quality Interventions for Reducing Respiratory Infections). KidsAIR was a three-arm post-only randomized trial in households from rural Alaska (AK), Navajo Nation in Arizona and New Mexico (NN), and Western Montana (WMT) that used wood stoves for heating. As the two intervention arms (i.e., education and air filtration) were designed to reduce indoor PM2.5 concentrations, the analyses presented here are focused on homes from the control arm of the study, providing baseline exposure measures and overall characteristics of participating homes. Our aims were to measure PM2.5 concentrations and evaluate household and stove-use characteristics that influence indoor PM2.5 in rural Western US homes that used wood stoves for heating.
Methods
Study design and setting
A description of the methods for KidsAIR has been published previously (Noonan et al. 2019). The overall aims of the KidsAIR trial were to assess the effect of the interventions on PM2.5 concentrations in study households and incidence of lower respiratory tract infection among children under 5 years of age who lived in the households. Eligibility criteria for the trial included households in the three study areas that used a wood stove as a primary heating source and had at least one child under five years of age. Participants were recruited over a 4-year study period and followed for two consecutive winter seasons.
Interventions were implemented prior to the first winter, following a post-only study design that is consistent with other similar studies (Mortimer et al. 2017; Smith et al. 2011). Households in the trial were randomized into three treatment arms. The tested interventions were an education arm to promote efficient burning practices and an air filtration arm that deployed an air filtration unit in the same room as the wood stove. Following community recommendations, different approaches were employed in the control arm across the study areas. A placebo, or sham, filtration unit was used in two study areas (WMT and NN) and no intervention was used in the third study area (AK). The control filtration units were the same as those used in the air filtration arm but fitted with placebo rather than high efficiency filters. As with the air filtration arm, the placebo filters were changed out monthly during the study period.
Participants provided written informed consent prior to participation in the study. Participants were compensated for the time they spent performing study tasks and reimbursed for the cost of electricity to use the air filtration units within their homes. After completing the study, all households received the educational tools as well as the air filtration units used in the Tx1 and Tx2 study arms. The KidsAIR study was approved by the University of Montana IRB, the University of Alaska Fairbanks IRB, the University of New Mexico Health Sciences Center Human Research Protection Office and Human Research Review Committee, the Navajo Nation Human Research Review Board and the Yukon-Kuskokwim Health Corporation (YKHC) Human Studies Committee and Executive Board.
Exposure assessment
Real-time mass concentrations of PM2.5 were measured using a light-scattering aerosol monitor (DustTrak 8530, TSI, USA) during the first winter of the study for each household. The DustTrak was placed 1 to 1.5 meters above ground level in the room where the wood stove was located and sampled continuously over a 6-day period at 60-second time intervals. The DustTrak instruments were factory calibrated annually and cleaned and zero calibrated according to manufacturer standards prior to each sampling event. We also assessed DustTrak performance by collocating the instruments alongside a certified BAM 1020 Continuous Particulate Monitor (Met One Instruments, Inc, USA). DustTraks that did not track with the BAM monitor were sent to be factory calibrated prior to the next use. A correction factor of 1.65 was applied to the PM2.5 concentrations due to source-specific differences in wood smoke measurements, as described previously (McNamara et al. 2011).
DustTrak sampling data were assessed for data quality and completeness for each individual home in the study. Two homes were excluded from analysis due to large periods of missing data that were likely due to power failures in the home. One home was excluded from analysis due to instrument malfunction that led to negative PM2.5 values being recorded throughout the majority of the sampling period. Finally, one home was excluded from analysis due to instrument malfunction that led to an extended period of extremely high PM2.5 values. Sampling data from all other homes passed quality control and were included in the analysis.
Covariates
Wood stove quality and usage
Wood stoves (Figure 1) were graded for quality by an expert wood stove consultant independent of our study team who had no other involvement in the study. The consultant assessed photos of the wood stove, stovepipe, chimney, and wood storage methods taken at each household during the exposure sampling event. Stove photos were evaluated using a pre-defined criterion that assessed wood supply, stove and chimney system, and wood stove operation and maintenance (see Supplemental Materials). Evaluations were totaled across these criteria with total scores ranging from 0 (lowest quality) to 100 (highest quality) points and graded as “high-quality” (90–100 points), “medium-quality” (60–89 points), or “low-quality” (<60 points). Wood stove quality was also assessed through participant self-report of the stove age and if the stove was an EPA certified model.
Figure 1: Examples of wood heating stoves from the KidsAIR Study.
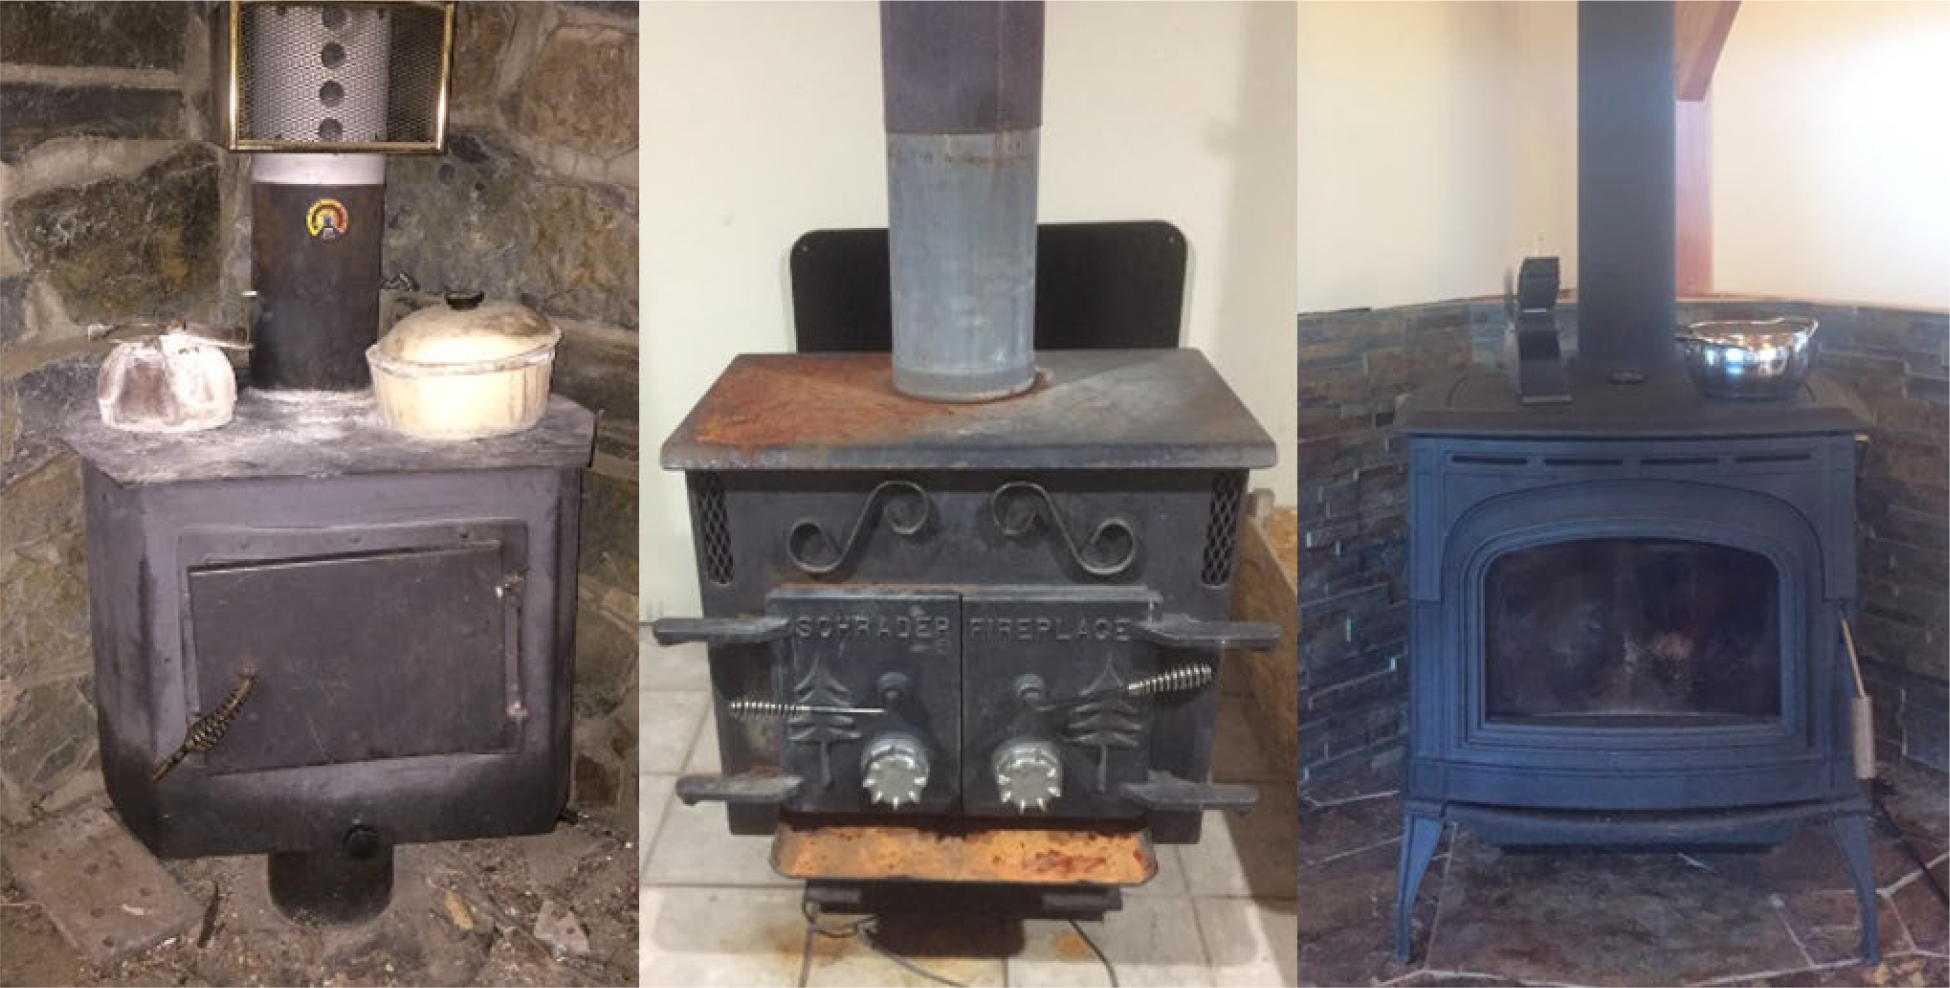
From left to right, photos represent examples of low-, medium-, and high-quality stoves that were scored using the wood stove grading system in the KidsAIR Study. The grading system also incorporated items not pictured here, including wood supply, chimney system, and wood stove operation and maintenance.
Multiple methods were used to characterize wood stove usage throughout the study. During the 6-day PM2.5 sampling period, participants self-reported the amount they used their stove compared to typical use during the winter (light burning, average burning, heavy burning, no burning). Participants also self-reported typical wood stove practices during the winter season: wood type burned; wood collection method (harvest yourself, purchase, other); length of time between wood collection and burning (<3 months versus 3+ months); and number of cords of wood burned per year in the wood stove. In addition, stove use was monitored during the winter using temperature logging devices (iButton DS1921G, Thermochron, Australia or LogTag UTRIX-16, OnSolution, Australia). Temperature loggers were placed near the wood stoves and measured temperatures at 20-minute intervals throughout the entire winter. Readings from the temperature loggers were used to identify heating events, defined by temperature increases (2.5-, 5-, or 7.5-degree Celsius) over a 20-minute period.
Wood fuel moisture content was measured using a pin-type moisture meter (MMD4E, General Tools and Instruments, USA) during the sampling period and at other household visits throughout the winter season.
Household activity and characteristics
Demographic and household characteristics were assessed at the start of the winter period using in-home questionnaires completed by an adult resident. Variables included age, sex, and race/ethnicity of adult and child(ren), as well as household income, adult education, and number of residents in the home. Household characteristics included type of residence (house, mobile, apartment, other), size (square meters, levels, bedrooms), year the home was built, and number of windows in the home. Other factors that could influence PM2.5 exposures within the home were assessed, including smoking status of residents, primary and secondary heating methods, presence of furnace or fireplace, number of pets living in the home, time since the chimney was cleaned, and presence of mold or damp areas. Homes were also categorized by Rural-Urban Commuting Area (RUCA) Codes matched to the zip code of each study household. RUCA codes were collapsed into a 3-category variable for analysis: Metropolitan (RUCA codes 1 or 2), Small Town (RUCA codes 7, 8, or 9), and Rural (RUCA codes 10+) (WWAMI Rural Health Research Center 2020).
A household activity questionnaire was completed by an adult in the home during each day of the 6-day PM2.5 sampling period to assess factors that could impact the measured PM2.5 concentrations. Questions included use of household appliances (electric, gas, oil, propane, other), whether tobacco smoking or other burning (incense, candles, kerosene) had occurred in the home, whether doors and windows were left open, and whether household cleaning had occurred (sweeping, dusting, vacuuming).
Minimum and maximum values of indoor temperature and relative humidity were measured during each 6-day PM2.5 sampling period (ITH-10, Inkbird Tech. Co, Ltd, PRC). Ambient temperature and PM2.5 concentrations during indoor PM2.5 sampling were collected from the weather station (National Climatic Data Center 2020) and EPA monitor (EPA 2020) nearest to the study household.
Statistical analysis
Statistical analysis was performed using R version 3.6.2 (The R Foundation for Statistical Computing, Vienna, Austria). Descriptive statistics (n, mean, standard deviation [sd], minimum [min], median, maximum [max]) for study variables were calculated for all households and by study area (AK, NN, WMT). Indoor concentrations of PM2.5, ambient temperature, and ambient PM2.5 concentrations were averaged over the 6-day sampling period for each home. Household activity variables (e.g., smoking, cleaning) that were collected once per day during the sampling period were summed to produce a single value for the sampling period for each home. Wood moisture content was collected multiple times throughout the winter in some homes; the moisture content sample collected closest to the indoor PM2.5 sampling event was used for statistical analyses.
Univariate associations were assessed between indoor PM2.5 concentrations and covariates using simple linear regression models for all study households and separately for the 3 study areas. Linear model assumptions were assessed for all models, and indoor PM2.5 concentrations were natural-log transformed to meet assumptions. Estimates are presented as percent difference in geometric mean PM2.5 (for categorical covariates) or percent change in geometric mean PM2.5 (for continuous covariates).
A multivariable linear model to evaluate indoor concentrations of PM2.5 was selected using household and stove-use characteristics described previously as predictors. Given the large number of potential predictors in the dataset, the number of candidate predictors for the multivariable model selection process was narrowed. First, when variables described similar characteristics (e.g., caregiver education and household income), only the variable with the strongest univariate association with indoor PM2.5 was used in order to avoid collinearity in the multivariable model. Next, variables were formally assessed for collinearity using the mctest (Imdad and Aslam 2018) package. Similar variables were selected out one-by-one until all variables had a variable inflation factor of less than 5 (Imdad and Aslam 2018). When choosing between variables with collinearity, the variable with the strongest univariate association with indoor PM2.5 was kept.
Based on the variables chosen for the model selection process, only 39 of 101 homes had a complete dataset that could be used in a model selection process. Data missingness was assessed for trends and patterns: indoor PM2.5 concentrations were compared between homes that were and were not missing individual covariates, and indoor PM2.5 concentrations and household characteristics were compared between homes with no missing data versus any missing data (Sterne et al. 2009). Given the missing data, we performed multiple imputation using the mice package. The mice package uses Fully Conditional Specification to impute data for each variable with a separate model (Stef van Buuren and Groothuis-Oudshoorn 2011). Continuous variables were imputed using predictive mean matching, binary variables were imputed using logistic regression, and ordered categorical variables were imputed using proportional odds models. The imputed datasets were used for model averaging and selection using the MAMI package (Schomaker and Heumann 2014). For model averaging, a weighted parameter average was calculated from parameter estimates of candidate models using AIC criteria. Weights were assigned to parameters for each candidate model using exponential AIC; parameters from better models according to AIC criteria received higher weights. (Schomaker and Heumann 2014). A variable was selected for the final model if it was selected (using lowest AIC selection criteria) in at least one of the imputed datasets. A variable importance factor was calculated as the sum of the model averaging weights from the models that contained that variable, averaged over the 10 imputed datasets (Schomaker and Heumann 2014).
Results
A total of 101 homes were in the control arm during the first winter of sampling and are included in the following results. Demographic, household, and wood stove characteristics are presented for all study households and by study area in Table 1. Survey respondents, who were caregivers of the children enrolled in the study, were primarily female (90%). Caregivers in WMT were generally white (90%) and had a college degree (60%), as compared to caregivers in NN and AK who were primarily American Indian or Alaska Native (96% and 91%, respectively) and had a high school education or less (54% and 73%, respectively). Similar to demographic characteristics, household and wood stove characteristics were generally more similar for AK and NN households compared to WMT households (Table 1). Homes in WMT were larger than AK and NN homes based on number of levels and bedrooms in the homes. Caregivers in WMT self-reported that their wood stoves were generally older than in AK and NN: 35%, 18%, and 11%, respectively, reported having stoves older than 15 years. However, more WMT households waited 3+ months after harvesting before burning their wood fuel (71%) compared to AK (18%) or NN (21%) households, and more of the wood stoves received a grade of “high-quality” or “medium-quality” in WMT (66%) compared to AK (55%) or NN (39%).
Table 1:
Demographic, household, and wood stove characteristics
| All Households (n=101) | Alaska (n=11) | Navajo Nation (n=28) | Western Montana (n=62) | |
|---|---|---|---|---|
| Demographic characteristics | n (%) or mean (sd) n, min, median, max | |||
| Caregiver sex | ||||
| Female | 91 (90) | 10 (91) | 22 (79) | 59 (95) |
| Male | 10 (10) | 1 (9) | 6 (21) | 3 (5) |
| Caregiver race | ||||
| AI/AN | 38 (38) | 10 (91) | 27 (96) | 1 (2) |
| Asian | 1 (1) | 1 (9) | 0 (0) | 0 (0) |
| White | 56 (55) | 0 (0) | 0 (0) | 56 (90) |
| More than 1 race | 6 (6) | 0 (0) | 1 (4) | 5 (8) |
| Caregiver education | ||||
| High school or less | 33 (33) | 8 (73) | 15 (54) | 10 (16) |
| Some college | 28 (28) | 2 (18) | 11 (39) | 15 (24) |
| College degree | 40 (40) | 1 (9) | 2 (7) | 37 (60) |
| Household income | ||||
| Less than $20,000 | 35 (35) | 8 (73) | 20 (71) | 7 (11) |
| $20,000-$49,999 | 34 (34) | 1 (9) | 8 (29) | 25 (40) |
| $50,000+ | 32 (32) | 2 (18) | 0 (0) | 30 (48) |
| Children under 5 years of age in household | 1.5 (0.7) 100 | 1.7 (1.2) 11 | 1.6 (0.8) 28 | 1.3 (0.5) 61 |
| 1.0, 1.0, 5.0 | 1.0, 1.0, 5.0 | 1.0, 1.0, 4.0 | 1.0, 1.0, 2.0 | |
| Rural-Urban Commuting Area Codes | ||||
| Metropolitan | 19 (19) | 0 (0) | 0 (0) | 19 (31) |
| Small town | 34 (34) | 0 (0) | 23 (82) | 11 (18) |
| Rural area | 34 (34) | 4 (36) | 1 (4) | 29 (47) |
| Household characteristics | n (%) or mean (sd) n, min, median, max | |||
| Levels in home | ||||
| 1 | 64 (63) | 10 (91) | 27 (96) | 27 (44) |
| 2 + | 35 (35) | 1 (9) | 1 (4) | 33 (53) |
| 2.8 (1.1) 99 | 2.3 (1.1) 11 | 2.2 (1.1) 28 | 3.2 (1.0) 60 | |
| Bedrooms in home | 0.0, 3.0, 6.0 | 0.0, 2.0, 4.0 | 0.0, 2.0, 4.0 | 1.0, 3.0, 6.0 |
| Age of home | ||||
| Built before 1985 | 52 (51) | 4 (36) | 11 (39) | 37 (60) |
| Built 1985 or later | 45 (45) | 6 (55) | 16 (57) | 23 (37) |
| Pets in home | ||||
| 0 | 24 (24) | 6 (55) | 14 (50) | 4 (6) |
| 1 | 24 (24) | 3 (27) | 4 (14) | 17 (27) |
| 2 + | 51 (50) | 2 (18) | 10 (36) | 39 (63) |
| Wood stove characteristics | n (%) | |||
| Age of stove | ||||
| < 6 years | 31 (31) | 8 (73) | 9 (32) | 14 (23) |
| 6 to 15 years | 34 (34) | 1 (9) | 16 (57) | 17 (27) |
| 16 + years | 27 (27) | 2 (18) | 3 (11) | 22 (35) |
| Unknown | 5 (5) | 0 (0) | 0 (0) | 5 (8) |
| Chimney last cleaned | ||||
| < 6 months ago | 41 (41) | 5 (45) | 16 (57) | 20 (32) |
| 6 to 12 months ago | 27 (27) | 3 (27) | 6 (21) | 18 (29) |
| 12 + months ago | 28 (28) | 3 (27) | 6 (21) | 19 (31) |
| Wood collect method | ||||
| Harvest yourself | 61 (60) | 9 (82) | 19 (68) | 33 (53) |
| Purchase/other | 32 (32) | 0 (0) | 6 (21) | 26 (42) |
| Wood collect timeframe | ||||
| < 3 months before burning | 42 (42) | 7 (64) | 19 (68) | 16 (26) |
| 3 + months before burning | 52 (51) | 2 (18) | 6 (21) | 44 (71) |
| Wood stove grade | ||||
| High-quality | 8 (8) | 1 (9) | 1 (4) | 6 (10) |
| Medium-quality | 49 (49) | 5 (45) | 10 (36) | 35 (56) |
| Low-quality | 24 (24) | 4 (36) | 14 (50) | 8 (13) |
n = number of homes or observations; sd = standard deviation; min = minimum; max = maximum
Wood stove and household exposure metrics and activities are presented in Table 2. Indoor PM2.5 concentrations over the 6-day sampling periods were generally high throughout all study households (Table 2, Figure 2), with mean concentrations of 31.8 μg/m3 (sd=35.7) and median concentrations of 19.0 μg/m3 across 92 homes with sampling data. Households in AK had the highest concentrations (mean = 55.7 μg/m3, sd = 62.4, median = 29.6), followed by NN (mean = 38.4 μg/m3, sd = 31.7, median = 29.0), and WMT (mean = 25.3 μg/m3, sd = 29.2, median = 15.5). Households in the NN area had lower wood moisture content and indoor humidity, higher ambient temperature, and lower ambient PM2.5 compared to households in the AK and WMT areas (Table 2). Over the 6-day sampling period, 21 of the 92 homes with PM2.5 sampling data (23%) had mean PM2.5 concentrations higher than the US EPA’s 24-hour ambient standard of 35 μg/m3 (Table 3). Sixty-four homes (70%) had mean PM2.5 concentrations higher than the EPA annual standard of 12 μg/m3. A higher percentage of the homes from AK and NN had concentrations that exceeded the 24-hour and annual air quality standards than from WMT (Table 3). Table 3 also shows the percentage of 1-minute indoor PM2.5 observations that exceeded EPA standards over the 6-day sampling periods. Across all study areas, 39% of the 1-minute PM2.5 observations exceeded the annual standard of 12 μg/m3 and 16% of the observations exceeded the 24-hour standard of 35 μg/m3. Homes in AK had a higher percentage of 1-minute PM2.5 concentrations that exceeded both EPA standards than NN and WMT.
Table 2:
Indoor and ambient exposure metrics and household activity characteristics
| All Households (n=101) | Alaska (n=11) | Navajo Nation (n=28) | Western Montana (n=62) | |
|---|---|---|---|---|
| Exposure variable | n, mean (sd) min, median, max | |||
| Mean indoor PM2.5 concentration over sampling period (μg/m3) | n=92 | n=10 | n=23 | n=59 |
| 31.8 (35.7) | 55.7 (62.4) | 38.4 (31.7) | 25.3 (29.2) | |
| 1.7, 19.0, 200.1 | 4.3, 29.6, 200.1 | 3.2, 29.0, 105.0 | 1.7, 15.5, 139.1 | |
| Mean indoor PM2.5 sampling days | n=92 | n=10 | n=23 | n=59 |
| 5.8 (0.8) | 5.5 (1.5) | 5.8 (0.8) | 5.9 (0.5) | |
| 1.1, 6.0, 7.0 | 1.1, 6.0, 6.0 | 2.4, 6.0, 6.0 | 2.7, 6.0, 7.0 | |
| Self-reported burn-level compared to typical winter period: n (%) | ||||
| No/light burning | 19 (19) | 6 (55) | 3 (11) | 10 (16) |
| Average burning | 58 (57) | 2 (18) | 13 (46) | 43 (69) |
| Heavy burning | 17 (17) | 1 (9) | 9 (32) | 7 (11) |
| Heating events over sampling period: 2.5-degree Celsius increase over 20-minute period | n=65 | n=3 | n=14 | n=48 |
| 16 (11) | 11 (4) | 24 (15) | 13 (9) | |
| 5, 12, 54 | 8, 10, 16 | 7, 18, 54 | 5, 11, 35 | |
| Heating events over sampling period: 5-degree Celsius increase over 20-minute period | n=65 | n=3 | n=14 | n=48 |
| 11 (8) | 7 (1) | 16 (12) | 9 (6) | |
| 3, 7, 47 | 6, 7, 7 | 6, 11, 47 | 3, 6, 27 | |
| Heating events over sampling period: 7.5-degree Celsius increase over 20-minute period | n=65 | n=3 | n=14 | n=48 |
| 9 (6) | 7 (1) | 12 (10) | 8 (3) | |
| 3, 6, 42 | 6, 7, 7 | 5, 8, 42 | 3, 6, 20 | |
| Wood moisture content closest to PM2.5 sampling period (%) | n=90 | n=9 | n=23 | n=58 |
| 11.0 (4.5) | 13.9 (2.9) | 6.0 (0.6) | 12.5 (4.1) | |
| 5.0, 10.8, 27.0 | 10.7, 13.5, 18.6 | 5.0, 6.1, 7.4 | 5.3, 11.8, 27.0 | |
| Home activity: self-reported smoking (mean days during PM2.5 sampling) | n=85 | n=9 | n=23 | n=53 |
| 0.3 (1.2) | 0.0 (0.0) | 0.4 (1.4) | 0.3 (1.2) | |
| 0.0, 0.0, 6.0 | 0.0, 0.0, 0.0 | 0.0, 0.0, 6.0 | 0.0, 0.0, 6.0 | |
| Home activity: open doors (mean days during PM2.5 sampling) | n=85 | n=9 | n=23 | n=53 |
| 1.5 (2.0) | 2.1 (2.5) | 2.3 (2.4) | 1.0 (1.7) | |
| 0.0, 0.0, 6.0 | 0.0, 2.0, 6.0 | 0.0, 2.0, 6.0 | 0.0, 0.0, 6.0 | |
| Home activity: open windows (mean days during PM2.5 sampling) | n=85 | n=9 | n=23 | n=53 |
| 1.6 (2.1) | 2.4 (2.7) | 2.1 (2.3) | 1.2 (1.8) | |
| 0.0, 0.0, 6.0 | 0.0, 1.0, 6.0 | 0.0, 1.0, 6.0 | 0.0, 0.0, 6.0 | |
| Home activity: sweeping, dusting, vacuuming (mean days during PM2.5 sampling) | n=86 | n=9 | n=23 | n=54 |
| 3.4 (2.0) | 5.2 (1.1) | 4.4 (1.8) | 2.6 (1.7) | |
| 0.0, 3.0, 6.0 | 3.0, 6.0, 6.0 | 0.0, 5.0, 6.0 | 0.0, 2.0, 6.0 | |
| Maximum indoor temperature during PM2.5 sampling (degrees Celsius) | n=71 | n=3 | n=21 | n=47 |
| 29.4 (6.1) | 39.0 (1.7) | 31.5 (6.2) | 27.9 (5.5) | |
| 11.1, 29.4, 42.9 | 37.9, 38.1, 41.0 | 21.6, 31.3, 42.9 | 11.1, 27.2, 38.3 | |
| Maximum humidity during PM2.5 sampling (%) | n=71 | n=3 | n=21 | n=47 |
| 38.9 (14.3) | 40.3 (4.5) | 30.5 (15.3) | 42.9 (12.3) | |
| 13.0, 40.0, 91.0 | 36.0, 40.0, 45.0 | 13.0, 29.0, 63.0 | 20.0, 42.0, 91.0 | |
| Mean ambient temperature during PM2.5 sampling (degrees Celsius) | n=87 | n=4 | n=24 | n=59 |
| −3.9 (6.4) | 1.6 (3.0) | 1.9 (5.3) | −6.6 (5.0) | |
| −16.7, −3.9, 11.6 | −0.9, −.7, 5.9 | −5.3, 1.6, 11.6 | −16.7, −6.4, 2.7 | |
| Mean ambient PM2.5 during indoor PM2.5 sampling (μg/m3) | n=87 | n=10 | n=18 | n=59 |
| 3.9 (3.3) | 4.6 (5.2) | 1.6 (0.8) | 4.4 (3.1) | |
| 0.0, 3.1, 14.2 | 0.5, 2.8, 14.1 | 0.8, 1.4, 3.4 | 0.0, 4.0, 14.2 | |
n = number of homes or observations; sd = standard deviation; min = minimum; max = maximum; PM2.5 = fine particulate matter
Figure 2: Mean household concentrations of indoor fine particulate matter over sampling periods of up to 6 days during the winter.
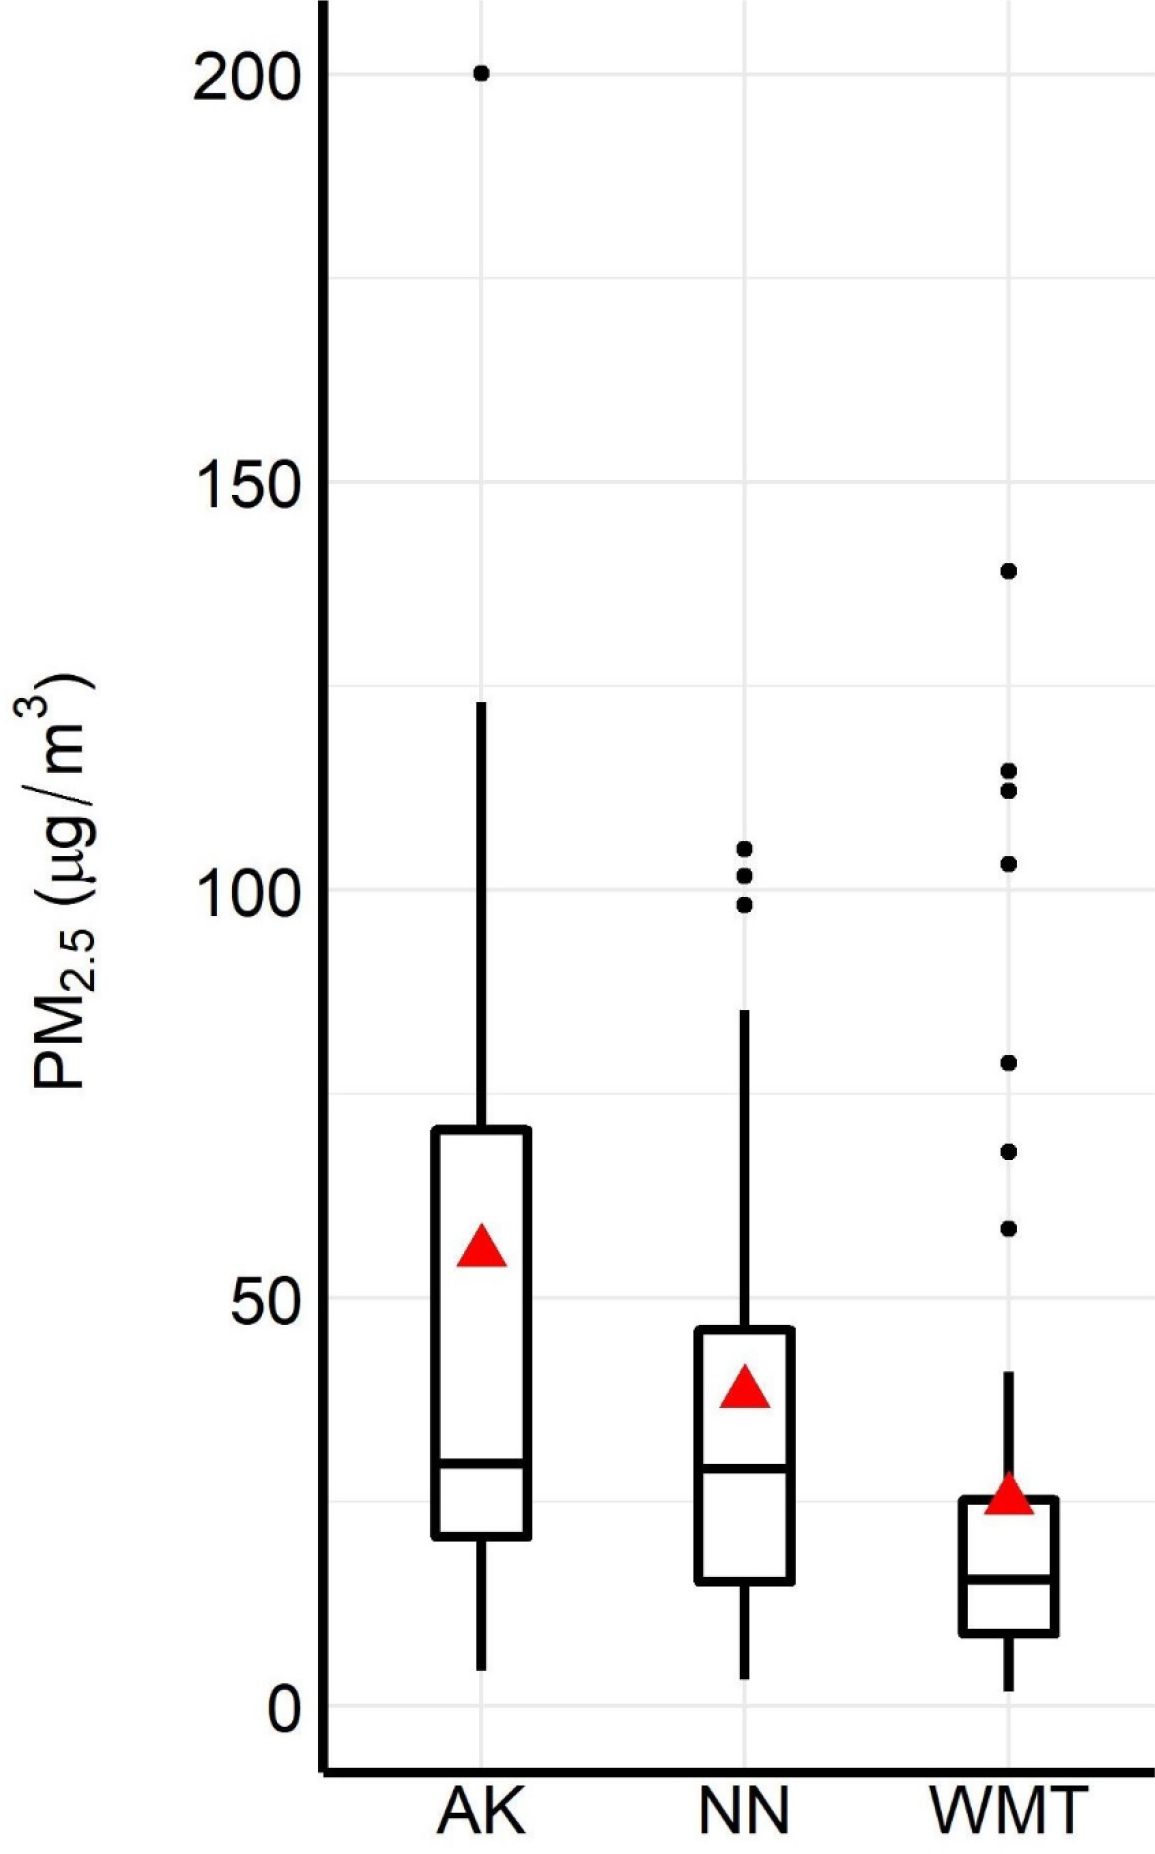
PM2.5 = fine particulate matter; AK = Alaska study area; NN = Navajo Nation study area; WMT = Western Montana study area. Triangles indicate mean values.
Table 3:
Indoor PM2.5 concentrations above National Ambient Air Quality Standards
| All Households (n=92) | Alaska (n=10) | Navajo Nation (n=23) | Western Montana (n=59) | |
|---|---|---|---|---|
| Percentage of 1-minute PM2.5 concentrations greater than NAAQS over 6-day sampling periods | ||||
| 12 μg/m3 (EPA annual standard) | 39% | 53% | 32% | 39% |
| 35 μg/m3 (EPA 24-hour standard) | 16% | 28% | 15% | 14% |
| Homes with mean PM2.5 concentrations greater than NAAQS over 6-day sampling periods | ||||
| 12 μg/m3 (EPA annual standard) | 64 (70%) | 8 (80%) | 19 (83%) | 37 (63%) |
| 35 μg/m3 (EPA 24-hour standard) | 21 (23%) | 4 (40%) | 8 (35%) | 9 (15%) |
PM2.5 = fine particulate matter; n = number of homes; NAAQS = National Ambient Air Quality Standard; EPA = United States Environmental Protection Agency
Univariate associations between mean indoor PM2.5 concentrations and covariates are reported in Table 4. For all study households, income, caregiver race, levels in the home, wood collection time prior to burning, and stove grade were some of the covariates with the highest univariate associations with indoor PM2.5 concentrations. For example, homes with 2+ levels had 47% lower geometric mean PM2.5 concentrations compared to homes with 1 level (95% confidence interval [CI]: −64, −21). Stoves graded as “medium-quality” had 161% higher geometric mean PM2.5 concentrations compared to stoves graded as “high-quality” (95% CI: 27, 434); similarly, stoves graded as “low-quality” had 186% higher geometric mean PM2.5 concentrations compared to stoves graded as “high-quality” (95% CI: 32, 519). Univariate associations for WMT homes are also presented in Table 4. With few exceptions, associations between mean indoor PM2.5 concentrations and covariates were similar in magnitude and direction for WMT homes compared to all study homes (Table 4). Small sample sizes and sparse data led to wide confidence intervals and unreliable estimates for many of the univariate associations from the AK and NN study areas. Results from these households are presented in Table S3 and should be interpreted with caution.
Table 4:
Univariate analysis results between indoor fine particulate matter and covariates
| All households (n=101) | Western Montana (n=62) | |||||
|---|---|---|---|---|---|---|
| Variable | n | estimatea (95% CI) | p-value | n | estimatea (95% CI) | p-value |
| Caregiver education | ||||||
| High school or less | 28 | Ref | 9 | Ref | ||
| Some college | 26 | −9 (44, 48) | 0.72 | 15 | 57 (−23, 223) | 0.21 |
| College degree | 38 | −51 (−69, −23) | 0.00 | 35 | −20 (−58, 51) | 0.48 |
| Household income | ||||||
| Less than $20,000 | 28 | Ref | 5 | Ref | ||
| $20,000-$49,999 | 33 | −53 (−70, −27) | 0.00 | 24 | −49 (−78, 18) | 0.11 |
| $50,000+ | 31 | −64 (−77, −44) | 0.00 | 30 | −62 (−83, −12) | 0.02 |
| Caregiver race | ||||||
| White | 55 | Ref | 55 | Ref | ||
| Non-white | 37 | 88 (28, 177) | 0.00 | 4 | 147 (1, 505) | 0.05 |
| Total residents | ||||||
| <5 | 54 | Ref | 39 | Ref | ||
| 5+ | 37 | 50 (0, 123) | 0.05 | 19 | 6 (−36, 75) | 0.82 |
| Residents with age <5 years | ||||||
| 1 | 60 | Ref | 39 | Ref | ||
| 2+ | 31 | −13 (−43, 33) | 0.52 | 19 | −27 (−55, 20) | 0.21 |
| Resident smokes | ||||||
| No | 62 | Ref | 40 | Ref | ||
| Yes | 20 | 57 (−3, 155) | 0.07 | 9 | 49 (−22, 185) | 0.22 |
| Home type | ||||||
| House | 78 | Ref | 51 | Ref | ||
| Other | 12 | 56 (−13, 181) | 0.13 | 6 | 95 (−8, 317) | 0.08 |
| Year home built | ||||||
| <1985 | 46 | Ref | 35 | Ref | ||
| 1985+ | 42 | −4 (−36, 45) | 0.85 | 22 | −20 (−51, 30) | 0.37 |
| Home area (square meters) | ||||||
| <139 (n=41) | 43 | Ref | 18 | Ref | ||
| 139+ (n=44) | 37 | −27 (−53, 13) | 0.16 | 34 | −22 (−54, 31) | 0.33 |
| Levels in home | ||||||
| 1 | 57 | Ref | 26 | Ref | ||
| 2+ | 33 | −47 (−64, −21) | 0.00 | 31 | −41 (−62, −6) | 0.03 |
| Bedrooms in home | ||||||
| <3 | 32 | Ref | 12 | Ref | ||
| 3+ | 58 | 7 (−30, 63) | 0.74 | 45 | 13 (−37, 103) | 0.67 |
| Windows in home | ||||||
| <10 | 40 | Ref | 10 | Ref | ||
| 10+ | 50 | −38 (−58, −9) | 0.02 | 47 | −18 (−56, 54) | 0.54 |
| Pets in home | ||||||
| <2 | 42 | Ref | 19 | Ref | ||
| 2+ | 48 | −16 (−44, 25) | 0.38 | 38 | 42 (−13, 134) | 0.16 |
| Pets in home (furry) | ||||||
| <2 | 47 | Ref | 23 | Ref | ||
| 2+ | 42 | −14 (−43, 28) | 0.44 | 33 | 40 (−12, 123) | 0.15 |
| Secondary heating in home | ||||||
| Electric | 36 | Ref | 25 | Ref | ||
| Other | 36 | −23 (−51, 19) | 0.24 | 26 | −17 (−50, 39) | 0.48 |
| Wood stove | 18 | 35 (−22, 132) | 0.28 | 6 | −10 (−60, 105) | 0.80 |
| Stove age | ||||||
| <6 years | 28 | Ref | 12 | Ref | ||
| 6 to 15 years | 30 | 62 (−1, 167) | 0.06 | 17 | 109 (7, 307) | 0.03 |
| 16+ years | 26 | 5 (−38, 76) | 0.86 | 22 | 37 (−27, 158) | 0.32 |
| Do not know | 5 | 19 (−53, 200) | 0.70 | 5 | 79 (−30, 358) | 0.22 |
| Stove is EPA certified | ||||||
| Yes | 23 | Ref | 16 | Ref | ||
| No | 13 | 30 (−33, 151) | 0.43 | 7 | 85 (−16, 305) | 0.12 |
| Do not know | 52 | 38 (−14, 121) | 0.18 | 32 | 39 (−18, 136) | 0.22 |
| Chimney last cleaned | ||||||
| <6 months ago | 38 | Ref | 20 | Ref | ||
| 6 to 12 months ago | 26 | 15 (−29, 84) | 0.57 | 18 | 26 (−27, 116) | 0.39 |
| 12+ months ago | 23 | 65 (−1, 170) | 0.05 | 16 | 110 (21, 267) | 0.01 |
| Home – fireplace | ||||||
| Yes | 5 | Ref | 5 | Ref | ||
| No | 84 | 136 (−1, 462) | 0.05 | 51 | 97 (−14, 354) | 0.11 |
| Home – furnace | ||||||
| Yes | 15 | Ref | 14 | Ref | ||
| No | 75 | 25 (−27, 114) | 0.41 | 43 | 18 (−32, 104) | 0.56 |
| Burn level | ||||||
| No/Light burning | 19 | Ref | 10 | Ref | ||
| Average burning | 55 | 1 (−39, 67) | 0.98 | 41 | 3 (−46, 95) | 0.94 |
| Heavy burning | 16 | 19 (−38, 126) | 0.60 | 7 | 6 (−57, 160) | 0.89 |
| Wood collect time | ||||||
| <3 months | 40 | Ref | 15 | Ref | ||
| 3+ months | 50 | −34 (−55, −2) | 0.04 | 43 | −25 (−56, 28) | 0.29 |
| Wood collect method | ||||||
| Harvest yourself | 59 | Ref | 32 | Ref | ||
| Purchase/other | 30 | −1 (−35, 50) | 0.94 | 25 | −5 (−40, 52) | 0.84 |
| Wood cords burned per year | ||||||
| Per 1 cord increase | 86 | 3 (−4, 11) | 0.41 | 54 | 5 (−7, 17) | 0.44 |
| Smoking occurred during PM2.5 sampling | ||||||
| 0 days | 76 | Ref | 48 | Ref | ||
| 1 + days | 5 | 220 (40, 632) | 0.01 | 3 | 239 (19, 861) | 0.02 |
| Windows were open during PM2.5 sampling | ||||||
| 0 days | 41 | Ref | 28 | Ref | ||
| 1 + days | 40 | 17 (−22, 76) | 0.44 | 23 | −4 (−41, 57) | 0.87 |
| Doors were open during PM2.5 sampling | ||||||
| 0 days | 46 | Ref | 33 | Ref | ||
| 1 + days | 35 | 65 (11, 145) | 0.01 | 18 | 19 (−29, 98) | 0.51 |
| Sweeping/dusting/vacuuming during PM2.5 sampling | ||||||
| < 3 days | 31 | Ref | 27 | Ref | ||
| 3 + days | 51 | 37 (−10, 108) | 0.14 | 25 | 1 (−39, 68) | 0.96 |
| Wood moisture content | ||||||
| < 10.5 % | 43 | Ref | 20 | Ref | ||
| 10.5 + % | 47 | −19 (−45, 19) | 0.28 | 38 | −7 (−44, 52) | 0.76 |
| Max indoor temperature (C) | ||||||
| Per 5-degree increase | 67 | 16 (−6, 44) | 0.16 | 44 | 9 (23, 55) | 0.62 |
| Min indoor temperature (C) | ||||||
| Per 5-degree increase | 67 | 6 (−13, 31) | 0.55 | 44 | 8 (−20, 45) | 0.62 |
| Max indoor humidity (%) | ||||||
| Per 5% increase | 66 | −4 (−11, 4) | 0.35 | 43 | −7 (−18, 5) | 0.23 |
| Min indoor humidity (%) | ||||||
| Per 5% increase | 66 | −3 (−16, 12) | 0.69 | 43 | −5 (−21, 15) | 0.62 |
| Stove-use events: 2.5C temp change over 20 minutes | 65 | 1 (−1, 3) | 0.27 | 48 | 1 (−2, 4) | 0.72 |
| Stove-use events: 5C temp change over 20 minutes | 65 | 1 (−1, 4) | 0.32 | 48 | 2 (−3, 7) | 0.45 |
| Stove-use events: 7.5C temp change over 20 minutes | 65 | 3 (−1, 7) | 0.19 | 48 | 4 (−4, 13) | 0.33 |
| Ambient PM2.5 | ||||||
| Per 5 μg/m3 increase | 90 | −7 (−21, 11) | 0.43 | 58 | 10 (−13, 38) | 0.44 |
| Ambient temperature | ||||||
| Per 2.8-degree C increase | 86 | 7 (−4, 19) | 0.24 | 59 | −9 (−22, 7) | 0.26 |
| Wood stove grade | ||||||
| High-quality | 7 | Ref | 5 | Ref | ||
| Medium-quality | 47 | 161 (27, 434) | 0.01 | 35 | 132 (2, 426) | 0.04 |
| Low-quality | 21 | 186 (32, 519) | 0.01 | 7 | 195 (8, 705) | 0.04 |
| Rural-Urban Commuting Area Codes | ||||||
| Metropolitan | 19 | Ref | 19 | Ref | ||
| Small town | 33 | 18 (−32, 106) | 0.55 | 11 | −23 (−61, 52) | 0.44 |
| Rural area | 33 | 8 (−38, 89) | 0.77 | 29 | −6 (−45, 59) | 0.81 |
n = number of homes or observations; CI = confidence interval; PM2.5 = fine particulate matter
Estimates are presented as percent difference in geometric mean PM2.5 (for categorical covariates) or percent change in geometric mean PM2.5 (for continuous covariates).
A summary of missing data is described in the Supplemental Materials. Among the variables from Table 5 that were used in the multivariable analysis and model selection, and including indoor PM2.5, there was 10% missing data across all study areas combined. NN (10%) and AK (16%) study areas had more missing data than WMT (8%). Data from the AK and NN study areas had small sample sizes (n=11 and n=28, respectively) that resulted in sparse observations for a number of variables with missing data. Such sparse data made imputation infeasible, and performing subsequent analysis on imputed datasets may have led to biased results for the AK and NN study areas (Kleinke 2018; McNeish 2016). As a result, multiple imputation and subsequent model averaging and selection were only conducted on households in the WMT study area. We imputed 10 full datasets from the WMT study area for further analysis (Hayati Rezvan et al. 2015). Patterns in data missingness are reported in the Supplemental Results (Tables S1 and S2), and potential reasons for missing data are reviewed in the Discussion section below.
Table 5:
Multivariable analysis results from full model using imputed data and selected model from model averaging for Western Montana homes
| Variable | Multivariable associations | Model selection | Variable Importanceb |
|---|---|---|---|
| estimatea (95% CI) | estimatea (95% CI) | ||
| Household income | |||
| < $20,000 (n=7) | Ref | Ref | |
| $20,000 - $50,000 (n=25) | −11 (−49, 56) | −9 (−49, 62) | |
| $50,000 + (n=30) | −14 (−55, 64) | −13 (−59, 87) | 0.30 |
| Residents smoke | |||
| No (n=48) | Ref | Ref | |
| Yes (n=14) | 20 (−32, 111) | 34 (−35, 173) | 0.53 |
| Levels in home | |||
| 1 (n=29) | Ref | Ref | |
| 2 + (n=33) | −9 (−39, 35) | −8 (−43, 48) | 0.42 |
| Home square meters | |||
| < 139 (n=25) | Ref | Ref | |
| 139 + (n=37) | −37 (−65, 14) | −39 (−68, 13) | 0.85 |
| Pets in home | |||
| < 2 (n=21) | Ref | NA | |
| 2 + (n=41) | 4 (−22, 39) | NA | 0.32 |
| Chimney cleaned | |||
| < 6 months (n=23) | Ref | Ref | |
| 6 – 12 months (n=18) | 60 (−6, 171) | 70 (0, 187) | |
| 12 + months (n=21) | 148 (36, 354) | 159 (47, 359) | 0.98 |
| Stove age | |||
| < 6 years (n=14) | Ref | Ref | |
| 6 – 15 years (n=19) | 14 (−34, 95) | 6 (−34, 71) | |
| 16 + years (n=24) | 2 (−25, 38) | 1 (−17, 23) | |
| Do not know (n=5) | −1 (−38, 60) | 0 (−21, 27) | 0.29 |
| Wood collection | |||
| < 3 months (n=16) | Ref | NA | |
| 3 + months (n=46) | −1 (−24, 30) | NA | 0.29 |
| Home fireplace | |||
| Yes (n=6) | Ref | Ref | |
| No (n=56) | 42 (−34, 206) | 59 (−32, 275) | 0.63 |
| Wood stove grade | |||
| High-quality (n=10) | Ref | Ref | |
| Medium-quality (n=40) | 68 (−27, 286) | 73 (−26, 302) | |
| Low-quality (n=12) | 152 (−28, 784) | 160 (−23, 782) | 0.83 |
| Mean ambient temperature (n=62) | |||
| Per 2.8 C increase | −6 (−20, 11) | −8 (−24, 11) | 0.55 |
| Mean ambient PM2.5 (n=62) | |||
| Per 5 μg/m3 increase | 4 (−15, 27) | 1 (−10, 15) | 0.39 |
| Heating events per day during PM2.5 sampling period (n=62) | |||
| 7.5 C increase over 20 min | −1 (−6, 4) | 0 (−4, 3) | 0.37 |
n = number of homes or observations; CI = confidence interval; PM2.5 = fine particulate matter
Estimates are presented as percent difference in geometric mean PM2.5 (for categorical covariates) or percent change in geometric mean PM2.5 (for continuous covariates).
Variable Importance is the average of the weights (based on AIC criteria) from the models that contained the variable during the model selection process.
Multivariable associations and model selection results are presented in Table 5. Time since the chimney was last cleaned, square meters of the home, stove grade, and fireplace in the home were the most important predictors of indoor PM2.5 concentrations in the multivariable model, with each having a variable importance of > 0.6. Stove age, pets in the home, household income, wood collection time prior to burning, mean ambient PM2.5, and heating events per day were the least important predictors of indoor PM2.5 concentrations, with a variable importance of less than 0.4. In the final model, homes that reported having their chimney cleaned 12+ months before the sampling period had geometric mean indoor PM2.5 concentrations that were 159% higher than homes that had the chimney cleaned <6 months before sampling (95% CI: 47, 359). Homes with area over 139 square meters (1500 square feet) had 39% lower geometric mean indoor PM2.5 compared to homes with area under 139 square meters (95% CI: −68, 13). Homes with stoves graded as low-quality (160%, 95% CI: −23, 782) or medium-quality (73%, 95% CI: −26, 302) had higher geometric mean indoor PM2.5 compared to homes with stoves graded as high-quality. The R-square for a linear model using imputed data for the selected variables was 0.48.
Discussion
We have reported indoor PM2.5 concentrations and associations with demographic, household, and stove-use characteristics in rural US households that used wood stoves as a primary heating method. The households in our study, which were control homes in a randomized field trial, had elevated concentrations of indoor PM2.5 measured over a 6-day sampling period: mean = 31.8 μg/m3, sd = 35.7, median = 19.0. Seventy percent of the homes had mean PM2.5 concentrations that exceeded US EPA annual standards for ambient PM2.5 concentrations (12 μg/m3), and 23% of the homes had concentrations that exceeded the 24-hr standard (35 μg/m3). Further, 76% of the participants self-reported that their wood stove burning level during PM2.5 sampling was either average or lower compared to typical burning throughout the winter season, indicating that the homes in our study likely experienced high levels of indoor PM2.5 over the entire winter season. Our results demonstrate the need for effective interventions to reduce PM2.5 concentrations in rural homes with wood stoves. In addition, we observed a wide range of sociodemographic and stove-use characteristics that were associated with indoor PM2.5, highlighting the complex milieu surrounding interventions to reduce indoor air pollution in such homes.
Previous studies involving homes with wood stoves have reported indoor PM2.5 concentrations similar to those reported here. The ARTIS (The Asthma Randomized Trial of Indoor Wood Smoke) study in rural Montana, Idaho, and Alaska reported mean indoor concentrations of 28.8 μg/m3 (sd=28.5) and 29.1 μg/m3 (sd=30.1) from separate 48-hour sampling visits that took place in 96 homes pre-intervention (Semmens et al. 2015). In the evaluation of a wood-stove changeout program in Western Montana, mean indoor PM2.5 concentrations of 45.0 μg/m3 (sd=33.0) were observed during 24-hour exposure sampling of 21 homes that used wood stoves prior to stove change-out (Noonan et al. 2012). Other, similar indoor PM2.5 concentrations have been reported in studies throughout North America (Allen et al. 2009; Singleton et al. 2017; Ward and Noonan 2008; Ward et al. 2011) and Europe (Wyss et al. 2016).
Our study, along with others that have reported similar findings, highlights the need for interventions that can effectively lower indoor PM2.5 concentrations in homes with wood stoves across a wide spectrum of settings. There are numerous hurdles in addressing this issue, including identifying cost-effective and widely available interventions. Nearly 13 million homes in the US alone use wood fuel as a primary or secondary heating source (U.S. Energy Information Agency 2015). Identifying homes to target for interventions is a difficult task, as accurate indoor PM2.5 measurement is a time-consuming and expensive task to conduct. Our results provide guidance on which specific activities and physical parameters contribute most to elevated indoor PM2.5 concentrations from wood stoves and have the most potential for targeted intervention. For example, households in our study with only one level had substantially higher PM2.5 concentrations (mean=39 μg/m3, sd=38, median=25) compared to households with multiple levels (mean=21 μg/m3, sd=29, median=13). Targeting smaller homes for interventions such as air filtration devices may not only reach individuals at risk for higher indoor PM2.5 exposures, but may also be a more efficient use of air filtration devices by using them in homes with lower volume of air to filter. We also observed that residents who dried their wood fuel 3+ months (mean=26 μg/m3, sd=36, median=16) compared to <3 months (mean=37 μg/m3, sd=33, median=27) prior to burning had homes with lower indoor PM2.5 concentrations, as did residents who had cleaned the chimney <6 months prior to sampling (mean=25 μg/m3, sd=25, median=19) compared to 12+ months prior to sampling (mean=47 μg/m3, sd=51, median=24). Best-burn practices, including drying wood fuel and cleaning chimneys, were included in the education arm of the KidsAIR study. The effectiveness of such interventions will be evaluated in future analyses.
Based on the associations we observed, self-reported age of the wood stove and whether or not the stove was EPA certified did not appear to be reliable predictors of indoor PM2.5 concentrations. However, we observed strong associations between indoor PM2.5 concentrations and our novel method of grading stoves based on stove quality/operation and wood supply criteria. Homes with poorly graded stoves had substantially higher PM2.5 concentrations (medium- or low-quality mean=29 μg/m3, sd=30, median=20) relative to stoves graded as high-quality (mean=9 μg/m3, sd=6, median=8). Our stove grade criteria could be used in future research as an easy-to-implement method of identifying homes at risk of high indoor air pollution exposures. Presence of a fireplace and homes with residents who smoked were also associated with higher indoor PM2.5 concentrations and could be points of emphasis in educational interventions. Caregiver education level and household income were also associated with higher concentrations of indoor PM2.5 and could be used as simple indicators to help identify households at higher risk of high indoor air pollution. Particularly in the AK study area, small samples sizes and sparse data made it difficult to compare associations across the 3 study areas. Although confidence intervals for associations in the NN study area were wide, there were similar associations between a number of covariates and indoor PM2.5 concentrations for the NN and WMT homes. Specifically, wood stove grade, time between wood collection and burning, and smoking in the household all had associations with indoor PM2.5 of similar magnitude for NN (Table S3) and WMT (Table 4) homes. In general, associations between covariates and indoor PM2.5 were not as strong for AK or NN compared to WMT, with limited sample sizes in AK and NN likely contributing towards this discrepancy.
We have also demonstrated that relatively simple measurements can reasonably predict indoor concentrations of PM2.5 in homes with wood stoves. In the final multivariable model for the WMT study area, time since the chimney was cleaned, stove grade, and area (square meters) of the home all had strong associations with mean indoor PM2.5 concentrations. Similar models have been used to assess household air pollution in the context of biomass stoves used for cooking (Clark et al. 2010); however, cookstove-related research often takes place in lower- and middle-income countries where cultural and stove-use characteristics are much different than in the homes we have assessed. Similar to the univariate associations already discussed, our multivariable model could be used as a method to target homes which are at risk for high indoor PM2.5 concentrations.
Missing data was a potential weakness in our study that led to sparse data, particularly for the AK and NN areas of the study that already had small sample sizes. Missing data were typically due to instrument malfunction or incomplete surveys, some of which was a result of the rural locations of the study households. Access to study households was challenging during the winter season, particularly in the more remote study regions. Infrastructure also impacted communication with study participants and occasionally led to power outages that resulted in missing air pollution sampling data.
Although some amount of lost data is common in field studies, we also acknowledge that missing data may have impacted our results. Analyses using data from AK and NN resulted in estimates with wide confidence intervals that should be interpreted with caution (Table S3). The WMT study area had a larger sample size with less sparse data, which made it more feasible to use multiple imputation and conduct a multivariable analysis for the WMT study households (Table 5). A key assumption in multiple imputation is that data are Missing at Random (MAR); if data are Missing Not at Random (MNAR), imputed results can be biased (Hayati Rezvan et al. 2015; Sterne et al. 2009). Although it is not possible to confirm the MAR assumption since we cannot know about data that were not collected, it is still valuable to evaluate patterns in missing data prior to analysis (Hayati Rezvan et al. 2015). Our assessment of missing data did not reveal any obvious trends. Summary statistics for households with missing data were generally similar to households without missing data, and PM2.5 concentrations were generally similar in households with missing data compared to households without missing data (Tables S1 and S2).
Many of the sociodemographic and stove-use characteristics that we assessed were self-reported by study participants, which could be viewed as a weakness of our study. Results that are based on self-report should be interpreted with some caution, as even non-differential misclassification of a multi-level variable can bias results either toward or away from the null depending on level and magnitude of misclassification. However, we do not expect that misclassification from self-report was differential with regard to measured PM2.5 concentrations, and that any resulting bias was likely minimal. Although the optical sampling method (DustTrak 8530, TSI, USA) we used to measure PM2.5 concentrations is not an EPA approved Federal Reference or Equivalency Method, we used previous work to apply a correction factor that accounts for the wood fuel source of the indoor air pollution (McNamara et al. 2011). In addition, the DustTrak instrument we used to measure PM2.5 allowed us to take continuous measurements over 6-day periods and to assess temporal trends that cannot be evaluated using filter-based PM2.5 measures. Future studies could improve on ours by conducting further quantitative assessments of ventilation rates within the homes and burn efficiency of the wood stoves. Outdoor measurements of PM2.5 to pair with the indoor measurements would also allow us to make better estimates of infiltration efficiency and ventilation issues within the homes in future research.
Conclusion
In this manuscript, we report on elevated concentrations of indoor PM2.5 measured over 6-day sampling periods during the winter months within rural US households that use wood stoves for heating. The overall results from the KidsAIR study on the effectiveness of education and air filtration interventions are forthcoming, but results presented here provide important information to guide strategies for limiting exposure to an air pollutant with well-documented adverse impacts on health. In addition to PM2.5 concentrations, we have reported numerous sociodemographic, household, and stove-use characteristics across a diverse population from three rural US regions. The associations we have observed highlight important predictors of indoor PM2.5 concentrations within these wood burning homes, and may help identify susceptible subgroups to target for future analyses and intervention studies with the overall goal of protecting the health of residents that use this universal and common source of home heating.
Supplementary Material
Practical Implications.
Nearly 13 million homes in the United States use wood stoves as a primary or secondary heating source, yet few studies have explored the relationship between indoor fine particulate matter (PM2.5) concentrations and household and stove-use characteristics in such homes. Seventy percent of the homes in our study had mean indoor PM2.5 concentrations which exceeded health-based annual ambient air pollution standards from the United States Environmental Protection Agency (12 μg/m3). Numerous household and stove-use characteristics were associated with indoor PM2.5 concentrations. Our results highlight the complex environment surrounding indoor air pollution and the need for effective intervention strategies in rural homes that use wood stoves for heating.
Acknowledgements
The authors thank the many families that chose to participate in this research. The project also benefited from the strong support of community leaders and local research assistants from all study locations, the Navajo Nation Human Research Review Board, Mark Kindred, Dr. Joseph Klejka, Emily Weiler, Carolyn Hester, Kathrene Conway, Becky Smith, Josephine Watson, Justina Yazzie, Doris Tsinnijinnie, Monica Begay, Malcolm Benally, and Kenlynn Henry. The wood stove photos from Figure 1 are courtesy of Emily Weiler.
Funding statement
The study is funded by the National Institute of Environmental Health Sciences (NIEHS), 1R01ES022649. Development of the educational intervention was also supported by NIEHS, 1R01ES022583. Additional support was provided by the National Institutes of Health Office of the Director Environmental Influences on Child Health Outcomes IDeA States Pediatric Clinical Trials Network (8UG1OD024952), the National Institute of General Medical Sciences (1P20GM130418), and the Navajo Birth Cohort Study Pediatric Cohort in Environmental influences on Child Health Outcomes (NBCS/ECHO) UG3/UH3OD023344, NIH Office of the Director. The content is solely the responsibility of the authors and does not necessarily represent the official views of the National Institutes of Health.
Footnotes
Conflict of interest disclosure
The authors declare no competing interests.
Ethics approval statement
The KidsAIR study was approved by the University of Montana IRB, the University of Alaska Fairbanks IRB, the University of New Mexico Health Sciences Center Human Research Protection Office and Human Research Review Committee, the Navajo Nation Human Research Review Board and the Yukon-Kuskokwim Health Corporation (YKHC) Human Studies Committee and Executive Board.
Participant consent statement
Participants provided written informed consent prior to participation in the study. Participants were compensated for the time they spent performing study tasks and reimbursed for the cost of electricity to use the air filtration units within their homes.
References
- Allen RW, Leckie S, Millar G, Brauer M. 2009. The impact of wood stove technology upgrades on indoor residential air quality. Atmos Environ 43:5908–5915. [Google Scholar]
- Champion WM, Charley PH, Klein B, Stewart K, Solomon PA, Montoya LD. 2017. Perception, culture, and science: A framework to identify in-home heating options to improve indoor air quality in the navajo nation. Sci Total Environ 580:297–306. [DOI] [PubMed] [Google Scholar]
- Cheek E, Guercio V, Shrubsole C, Dimitroulopoulou S. 2020. Portable air purification: Review of impacts on indoor air quality and health. Sci Total Environ. [DOI] [PubMed] [Google Scholar]
- Clark ML, Reynolds SJ, Burch JB, Conway S, Bachand AM, Peel JL. 2010. Indoor air pollution, cookstove quality, and housing characteristics in two honduran communities. Environ Res 110:12–18. [DOI] [PubMed] [Google Scholar]
- EPA U. 2020. Airdata air quality monitors. Available: https://epa.maps.arcgis.com/apps/webappviewer/index.html [accessed March 31, 2020.
- Hayati Rezvan P, Lee KJ, Simpson JA. 2015. The rise of multiple imputation: A review of the reporting and implementation of the method in medical research. BMC Med Res Methodol 15:30. [DOI] [PMC free article] [PubMed] [Google Scholar]
- Imdad MU, Aslam M. 2018. Mctest: Multicollinearity diagnostic measures.
- Kleinke K 2018. Multiple imputation by predictive mean matching when sample size is small. Methodology 14:3–15. [Google Scholar]
- McNamara ML, Noonan CW, Ward TJ. 2011. Correction factor for continuous monitoring of wood smoke fine particulate matter. Aerosol Air Qual Res 11:316–323. [DOI] [PMC free article] [PubMed] [Google Scholar]
- McNamara ML, Thornburg J, Semmens EO, Ward TJ, Noonan CW. 2017. Reducing indoor air pollutants with air filtration units in wood stove homes. Sci Total Environ 592:488–494. [DOI] [PMC free article] [PubMed] [Google Scholar]
- McNeish D 2016. Missing data methods for arbitrary missingness with small samples. Journal of Applied Statistics 44:24–39. [Google Scholar]
- Mortimer K, Ndamala CB, Naunje AW, Malava J, Katundu C, Weston W, et al. 2017. A cleaner burning biomass-fuelled cookstove intervention to prevent pneumonia in children under 5 years old in rural malawi (the cooking and pneumonia study): A cluster randomised controlled trial. The Lancet 389:167–175. [DOI] [PMC free article] [PubMed] [Google Scholar]
- National Climatic Data Center. 2020. Nndc climate data online. Available: https://www7.ncdc.noaa.gov/CDO/cdoselect.cmd?datasetabbv=GSOD&countryabbv=&georegionabbv= [accessed March 31, 2020.
- Noonan CW, Navidi W, Sheppard L, Palmer CP, Bergauff M, Hooper K, et al. 2012. Residential indoor pm2.5 in wood stove homes: Follow-up of the libby changeout program. Indoor Air 22:492–500. [DOI] [PMC free article] [PubMed] [Google Scholar]
- Noonan CW, Semmens EO, Ware D, Smith P, Boyer BB, Erdei E, et al. 2019. Wood stove interventions and child respiratory infections in rural communities: Kidsair rationale and methods. Contemp Clin Trials 89:105909. [DOI] [PMC free article] [PubMed] [Google Scholar]
- Rokoff LB, Koutrakis P, Garshick E, Karagas MR, Oken E, Gold DR, et al. 2017. Wood stove pollution in the developed world: A case to raise awareness among pediatricians. Curr Prob Pediatr Ad 47:123–141. [DOI] [PMC free article] [PubMed] [Google Scholar]
- Schomaker M, Heumann C. 2014. Model selection and model averaging after multiple imputation. Computational Statistics & Data Analysis 71:758–770. [Google Scholar]
- Semmens EO, Noonan CW, Allen RW, Weiler EC, Ward TJ. 2015. Indoor particulate matter in rural, wood stove heated homes. Environ Res 138:93–100. [DOI] [PMC free article] [PubMed] [Google Scholar]
- Singleton R, Salkoski AJ, Bulkow L, Fish C, Dobson J, Albertson L, et al. 2017. Housing characteristics and indoor air quality in households of alaska native children with chronic lung conditions. Indoor Air 27:478–486. [DOI] [PubMed] [Google Scholar]
- Smith KR, McCracken JP, Weber MW, Hubbard A, Jenny A, Thompson LM, et al. 2011. Effect of reduction in household air pollution on childhood pneumonia in guatemala (respire): A randomised controlled trial. The Lancet 378:1717–1726. [DOI] [PubMed] [Google Scholar]
- Stanaway JD, Afshin A, Gakidou E, Lim SS, Abate D, Abate KH, et al. 2018. Global, regional, and national comparative risk assessment of 84 behavioural, environmental and occupational, and metabolic risks or clusters of risks for 195 countries and territories, 1990–2017: A systematic analysis for the global burden of disease study 2017. Lancet (London, England) 392:1923–1994. [DOI] [PMC free article] [PubMed] [Google Scholar]
- Stef van Buuren Groothuis-Oudshoorn K. 2011. Mice: Multivariate imputation by chained equations in r. Journal of Statistical Software 45:1–67. [Google Scholar]
- Sterne JA, White IR, Carlin JB, Spratt M, Royston P, Kenward MG, et al. 2009. Multiple imputation for missing data in epidemiological and clinical research: Potential and pitfalls. BMJ 338:b2393. [DOI] [PMC free article] [PubMed] [Google Scholar]
- U.S. Energy Information Agency. 2015. Residential energy consumption survey. 2015 recs survey data. Available: https://www.eia.gov/consumption/residential/data/2015/ [accessed February 12, 2020.
- US EPA. 2016. Naaqs table. Available: https://www.epa.gov/criteria-air-pollutants/naaqs-table [accessed February 19th, 2020.
- Ward T, Noonan C. 2008. Results of a residential indoor pm(2.5) sampling program before and after a woodstove changeout. Indoor Air 18:408–415. [DOI] [PubMed] [Google Scholar]
- Ward T, Boulafentis J, Simpson J, Hester C, Moliga T, Warden K, et al. 2011. Lessons learned from a woodstove changeout on the nez perce reservation. Sci Total Environ 409:664–670. [DOI] [PubMed] [Google Scholar]
- Ward TJ, Semmens EO, Weiler E, Harrar S, Noonan CW. 2017. Efficacy of interventions targeting household air pollution from residential wood stoves. J Expo Sci Environ Epidemiol 27:64–71. [DOI] [PMC free article] [PubMed] [Google Scholar]
- WWAMI Rural Health Research Center. 2020. Code definitions: Version 2.0 Available: https://depts.washington.edu/uwruca/ruca-codes.php [accessed August 11th, 2020.
- Wyss AB, Jones AC, Bolling AK, Kissling GE, Chartier R, Dahlman HJ, et al. 2016. Particulate matter 2.5 exposure and self-reported use of wood stoves and other indoor combustion sources in urban nonsmoking homes in norway. Plos One 11:e0166440. [DOI] [PMC free article] [PubMed] [Google Scholar]
Associated Data
This section collects any data citations, data availability statements, or supplementary materials included in this article.