Abstract
Break-induced replication (BIR) repairs one-ended double strand breaks (DSBs) similar to those formed by replication collapse or telomere erosion, and it has been implicated in the initiation of genome instability in cancer and other human disease1,2. Previous studies have defined the enzymes required for BIR1–5; however, understanding of initial and extended BIR synthesis as well as how the migrating D-loop proceeds through known replication roadblocks has been precluded by technical limitations. Here, using a newly developed assay, we demonstrate that BIR synthesis initiates soon after strand invasion and proceeds slower than S-phase replication. Without primase, leading strand synthesis is initiated efficiently, but fails to proceed beyond 30 kb, suggesting that primase is needed for stabilization of the nascent leading strand. DNA synthesis can initiate in the absence of Pif1 or Pol32 but does not proceed efficiently. We demonstrate that interstitial telomeric DNA disrupts and terminates BIR progression. Also, BIR initiation is suppressed by transcription proportionally to the transcription level. Collisions between BIR and transcription lead to mutagenesis and chromosome rearrangements at levels that exceed instabilities induced by transcription during normal replication. Together, these results provide fundamental insights into the mechanism of BIR and on how BIR contributes to genome instability.
Unlike S-phase replication that initiates at origins, BIR begins at chromosome breaks with strand invasion of a single DNA end into a homologous sequence. Then, a migrating replication bubble is formed in which uncoupled leading and lagging strand synthesis proceed through the telomere, leading to conservative inheritance of new DNA4–10. The inability to discriminate between defects associated with initiation, elongation, or completion of BIR has limited our knowledge of the efficiency, kinetics and genetics of different phases of this process. Moreover, the field has lacked an understanding of how the migrating D-loop proceeds within a template region that is known to destabilize the regular replication fork, such as repetitive DNA or sites of active transcription. We address these questions using a newly developed droplet digital (dd) PCR-based approach that allows the study of each of the discrete phases of DNA synthesis during BIR with high resolution.
BIR is slower than S-phase replication
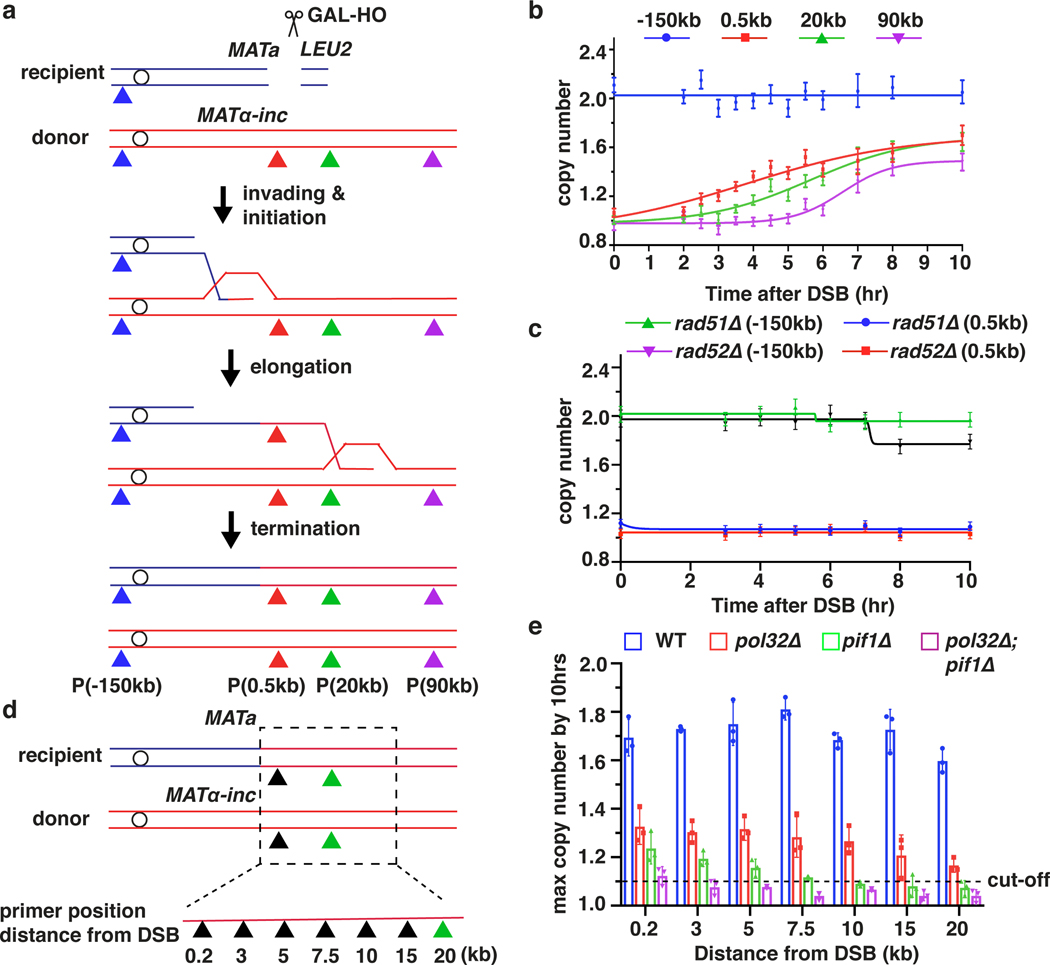
To determine the kinetics of BIR, we developed a new Assay for Monitoring BIR Elongation Rate (AMBER). AMBER combines a DNA purification technique that preserves DNA synthesis intermediates (a derivative of a recently developed DLE method measuring D-loop extension11,12) with ddPCR for sensitive and quantitative detection of BIR synthesis along the entire template chromosome length. BIR was assayed in an established yeast system where BIR repairs DSBs induced by HO endonuclease in a truncated chromosome III (Fig. 1a). DNA isolated from samples collected at time points following DSB induction was analyzed by ddPCR (See Methods). Pairs of primers with fluorophore probes were designed at 0.5 kb, 20 kb, or 90 kb positions telomere proximal to the DSB along the donor chromosome III (Fig. 1a). Evidence of DNA synthesis was defined as an increase in donor DNA copy number of at least 1.1x normalized to the value of the ACT1 control locus. An additional pair of primers specific for EMC1 on the left arm of both copies of chromosome III constituted a control readout of 2 copies (Fig. 1a, P(−150kb)).
Figure 1. The dynamics, efficiency and rate of BIR synthesis determined by AMBER.
a, Schematic of BIR progression in disomic chromosome (Chr) III strain (AM1003) showing primer sets used for AMBER (see Methods). DSB is introduced into the recipient (top, blue) ChrIII by GAL-HO and repair occurs by copying the donor (bottom, red) ChrIII. Colored triangles: positions of primer sets with distance from MATα-inc indicated. b, DNA synthesis detected by AMBER. A Boltzmann sigmoidal 43 was used to fit the data (here and also most of figures generated from AMBER) and to determine (i) the time when 50% synthesis occurs and (ii) the rate of synthesis (the slope) at this time (V50) in this experiment for 0.5 kb, 20 kb and 90 kb (2.2 at 3.8hr, 1.5 at 5.6hr and 0.7 at 6.5hr respectively). c, AMBER analysis in rad51Δ and rad52Δ cells. b and c each represents one out of three independent biological repeats that showed similar results (see Supplementary Table 5 for other repeats). Mean values of target to reference (ACT1) loci ratios were calculated by Poisson distribution based on 10,000 droplets with error bars representing upper and lower Poisson 95%CI. (see Methods). d, Positions of primers used to characterize BIR in pol32Δ, pif1Δ, and pol32Δ pif1Δ indicated by triangles. e, The extent of DNA synthesis measured by AMBER in pol32Δ, pif1Δ, and pol32Δ pif1Δ at 10hr after galactose addition. The means ± SD are indicated (n=3 independent biological repeats).
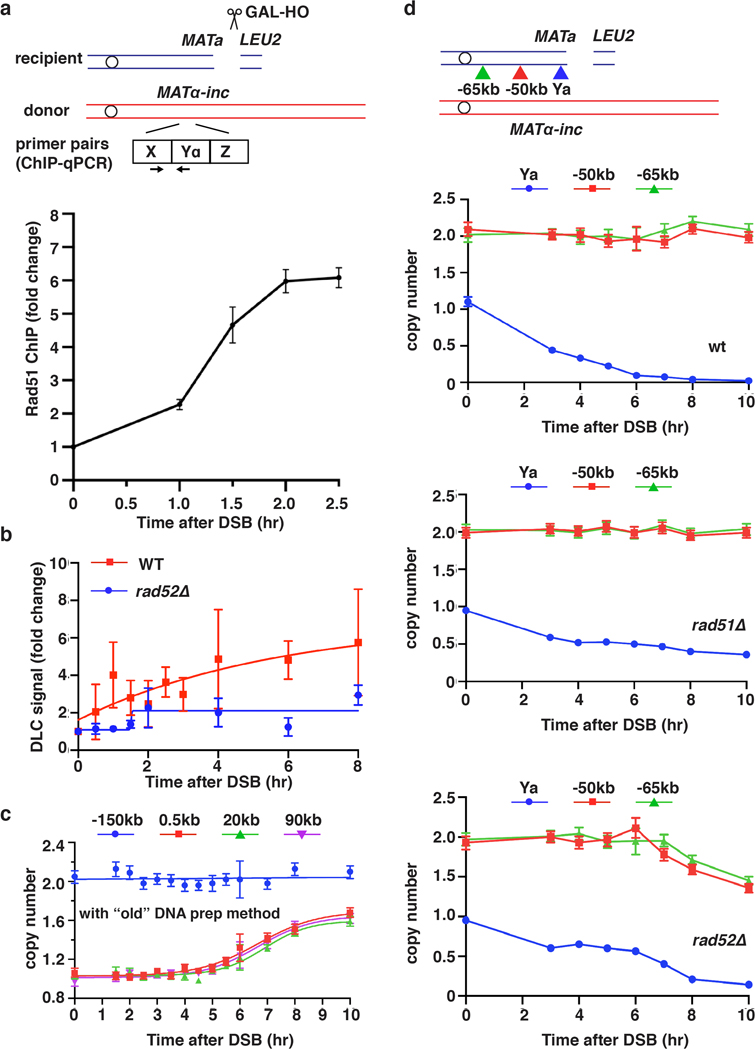
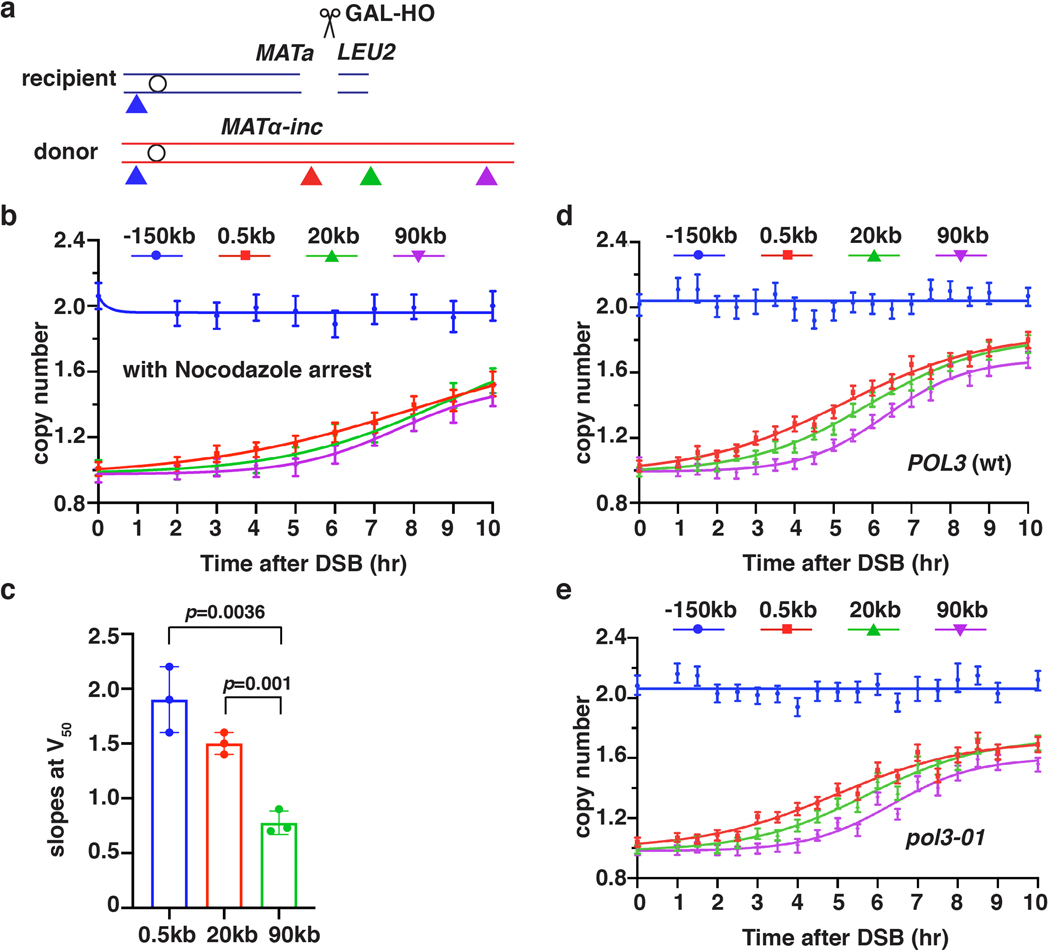
BIR synthesis of the first 500 bp was detected by ddPCR 2.5 hours post-DSB induction (Fig. 1b), about 1 hour after initial strand invasion (detected by ChIP of Rad51 loading onto the donor chromosome III (reflecting strand invasion), or by D-loop capture (DLC) 12 (Extended Data Fig. 1a, b)). The longer delays in BIR synthesis previously reported4,6,8,13 are likely due to use of a different method of DNA preparation that does not preserve DNA synthesis intermediates (Extended Data Fig. 1c). Copy number at 0.5 kb increased at subsequent time points and reached ~1.7x by 10 hours (Fig. 1b). Synthesis through the 20-kb and 90-kb positions was detected as soon as 3.5 hours and 5.5 hours post-galactose addition, respectively, and increased over time to about 1.5–1.7x (Fig. 1b). The copy number at the control EMC1 locus remained at ~2x for the duration of the time course (Fig. 1b). As expected, no BIR synthesis was detected in rad51Δ or rad52Δ mutants (Fig.1c, Extended Data Fig. 1d), which are both defective for BIR3, confirming that the DNA copy number gain resulted from BIR repair. By comparing the time required to detect DNA synthesis 0.5 kb from the DSB (initiation; 1.1x increase at 2.5 hours) and 90 kb from the DSB (completion; 1.1x increase at 5.5 hours), we calculated the average rate of BIR synthesis to be 0.5 kb/minute, approximately 6-fold slower than that of S-phase replication14. This BIR rate was calculated in G2/M checkpoint-arrested cells3,6 (see Methods) and was similar to the rate of BIR in cells pre-arrested at G2/M by nocodazole prior to DSB induction (Extended Data Fig. 2a, b). We further determined that the rate of copy number increase (slope) at the time when BIR synthesis reached 50% of the total for each chromosome position decreased along the donor chromosome (see legend to Fig. 1b and Extended Data Fig. 2c). Thus, the speed of BIR synthesis increases as it progresses, consistent with prior reports suggesting a transition from less to more processive DNA synthesis during BIR4,6,13,15. Interestingly, in a pol3–01 mutant, which has been suggested to support higher BIR processivity due to the lack of Polδ exonuclease activity16, the kinetics of BIR was similar to wild type cells (Extended Data Fig. 2d, e).
Analysis of BIR elongation in mutants
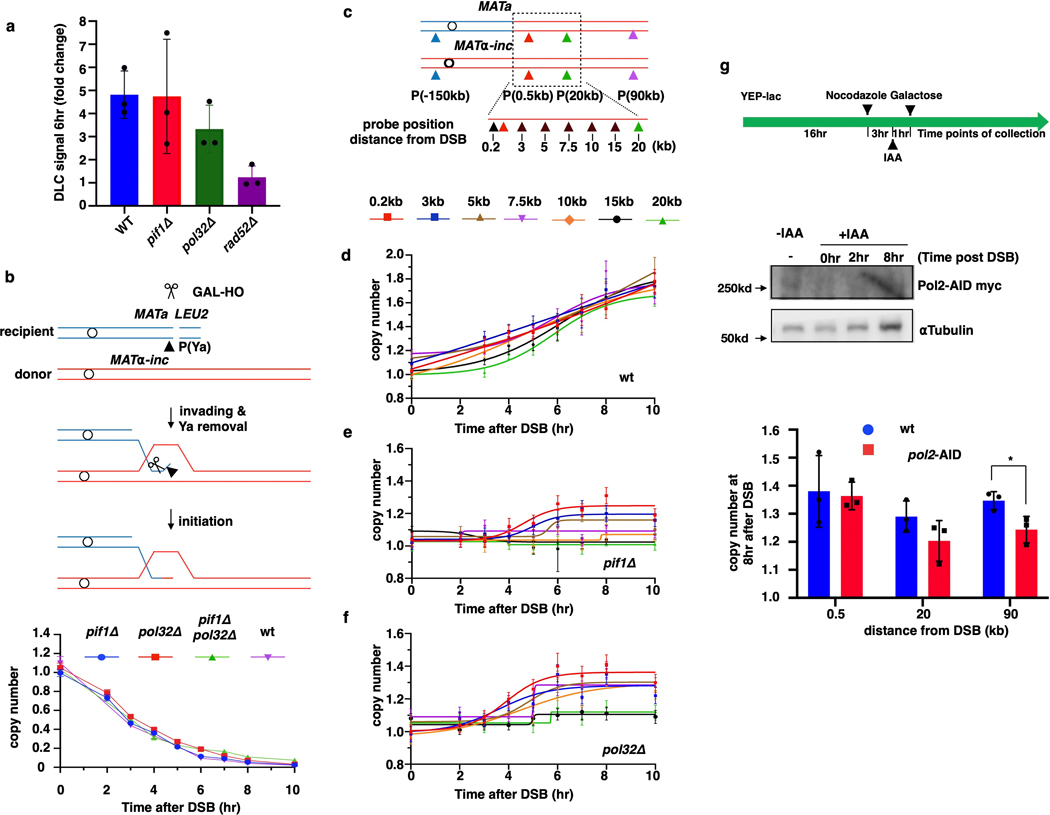
Pif1 helicase and Pol32, a non-essential subunit of Polδ, promote BIR synthesis 4,5, but the specific step for which they are required in cells remains unclear. Here, we report that pif1Δ and pol32Δ are proficient in strand invasion (Extended Data Fig. 3a, b) and initiate BIR synthesis (albeit somewhat less efficiently than in wild type (0.2 kb position)), but are deficient in long-range synthesis. Specifically, in pif1Δ, almost no synthesis was detected at or beyond the 5-kb position, while, in pol32Δ, BIR synthesis was detected up to 15 kb beyond the DSB (Fig. 1d, e and Extended Data Fig. 3c–f). Interestingly, in pol32Δ pif1Δ double mutants, no initial synthesis occurred, (Fig. 1e), suggesting that Pol32 can promote at least some DNA synthesis in the absence of Pif1 and vice versa. In addition, we observed only a mild defect at 90 kb following AID-degron inactivation of Polε (Extended Data Fig. 3g), consistent with the primary role of Polδ in BIR4,17.
Primase stabilizes long leading strand
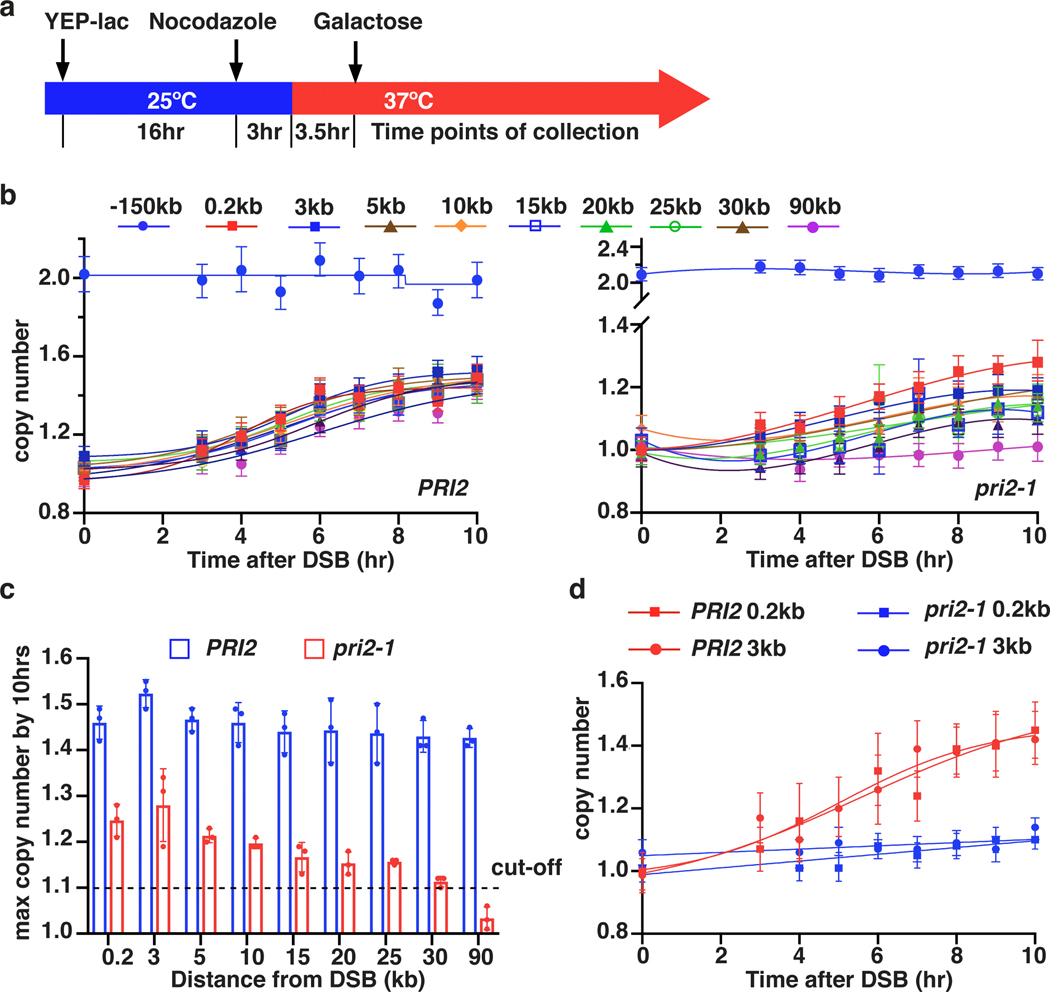
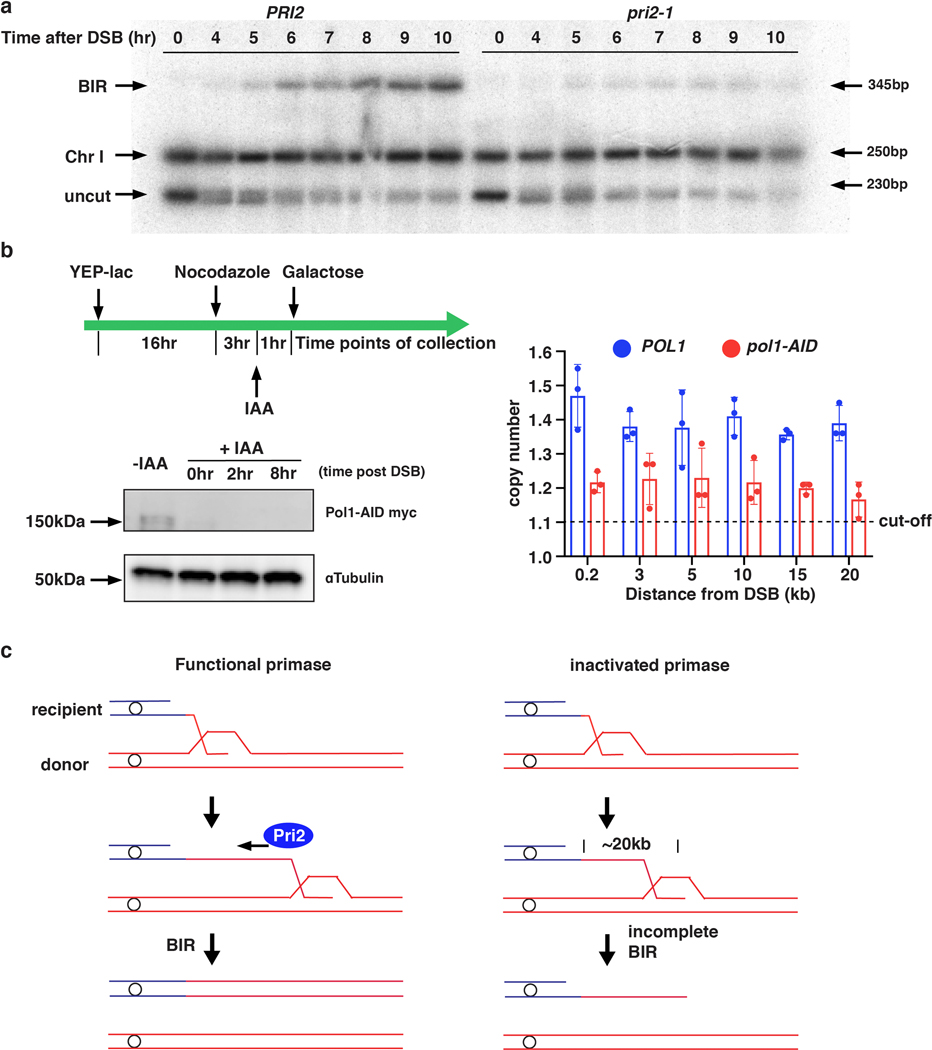
Unlike S-phase DNA replication, BIR synthesis is asynchronous: the leading strand primed at the 3’-OH end accumulates as long ssDNA as the D-loop migrates 5,7, while the lagging strand eventually utilizes the leading strand as the template7,8. However, the extent to which lagging strand synthesis can be delayed after the leading strand is synthesized remains unknown. We analyzed BIR repair by CHEF gel electrophoresis in pri2–1 cells in which primase was inactivated at 37° C18 (Fig. 2a, Methods) and observed a profound defect in formation of full-length BIR products (Extended Data Fig. 4a), consistent with published reports 4,17. However, AMBER analysis of BIR progression demonstrated that BIR synthesis was successfully initiated in pri2–1, albeit with reduced efficiency compared to wild type cells (Fig. 2b, c). Also, while the full-length BIR product was detected in wild type cells, the furthest synthesis detected in the pri2–1 mutant cultures was at 25 kb (Fig. 2b, c). Similar results were obtained when another subunit of Polα-primase complex, Pol1, was inactivated (Extended Data Fig. 4b). Importantly, S1 nuclease treatment of DNA prior to ddPCR eliminated all copy number increases in pri2–1 but not in wild type cells (Fig. 2d), supporting that new DNA detected upon primase inactivation was single stranded and accumulated during leading strand synthesis. Together, our results support a model in which the uncoupling of leading and lagging strand BIR synthesis is limited to up to 20–30 kb. We propose that primase-deficient cells can use the 3’ invading strand as a primer to successfully initiate BIR leading strand synthesis; however, stable extension of the leading strand requires primase, likely for synthesis of Okazaki fragments (Extended Data Fig. 4c).
Figure 2. Primase is required to stabilize long leading strand ssDNA.
a, Schematic of experiment in PRI2 (wt) and pri2–1 temperature-sensitive mutant. b, DNA synthesis in PRI2 (wt) (left) and pri2–1 (right) detected by AMBER. c, The extent of DNA synthesis in pri2–1 measured at 10hr as compared to wt. The means ± SD (n=3 independent biological repeats) are indicated. d, AMBER analysis of PRI2 (wt) and pri2–1 following treatment with S1-nuclease. b and d each represents one out of three independent biological repeats that showed similar results (see Supplementary Table 5 for other repeats). Mean values of target to reference (ACT1) loci ratios were calculated by Poisson distribution based on 10,000 droplets with error bars representing upper and lower Poisson 95%CI.
Interstitial telomeres interrupt BIR
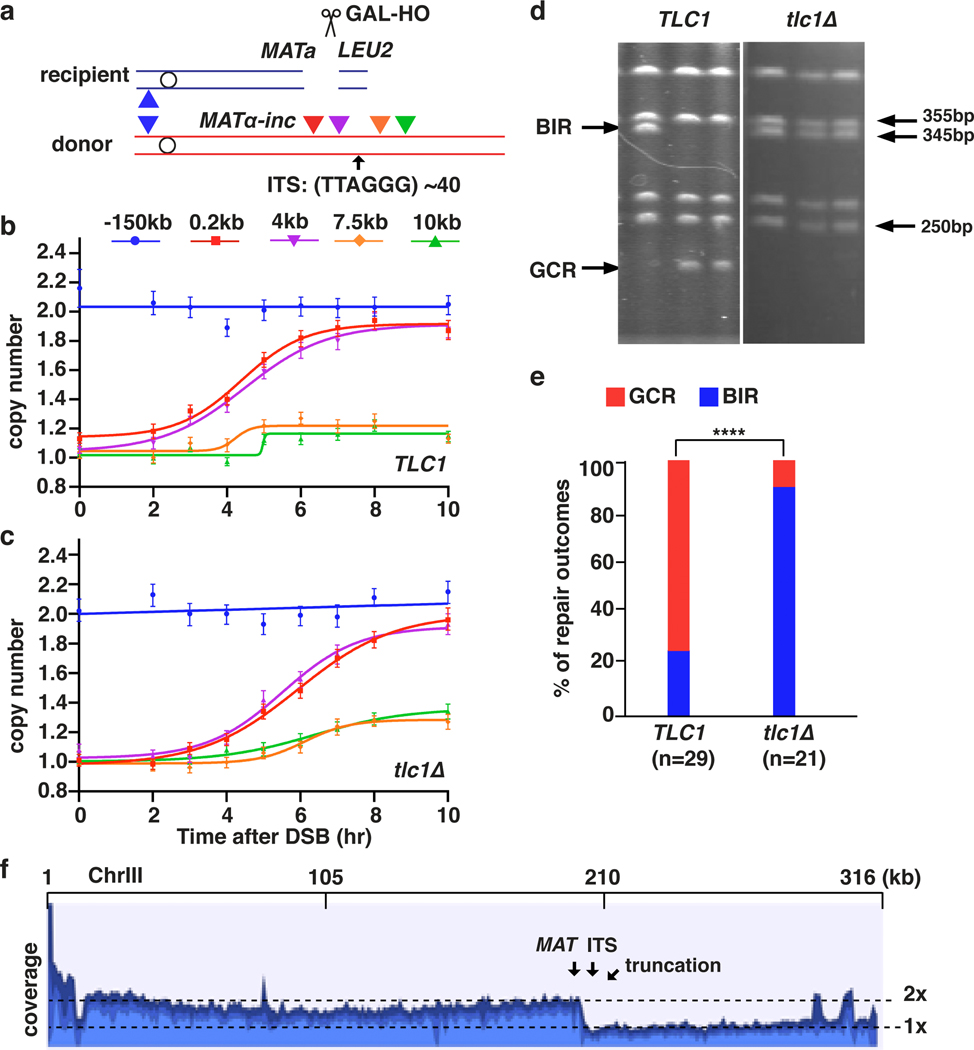
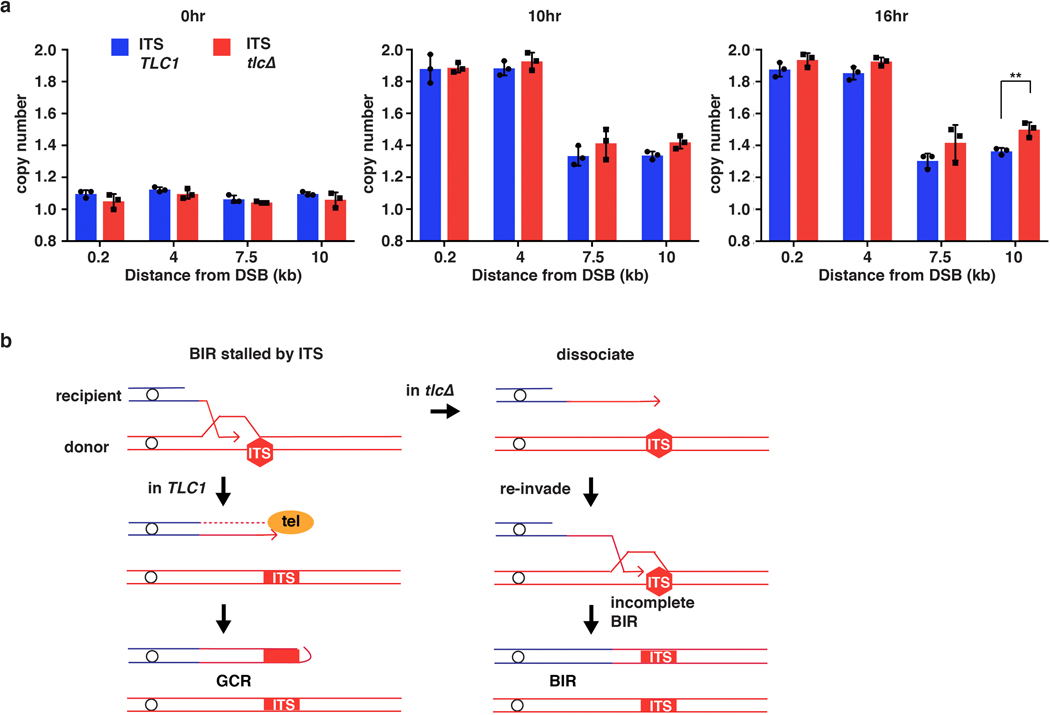
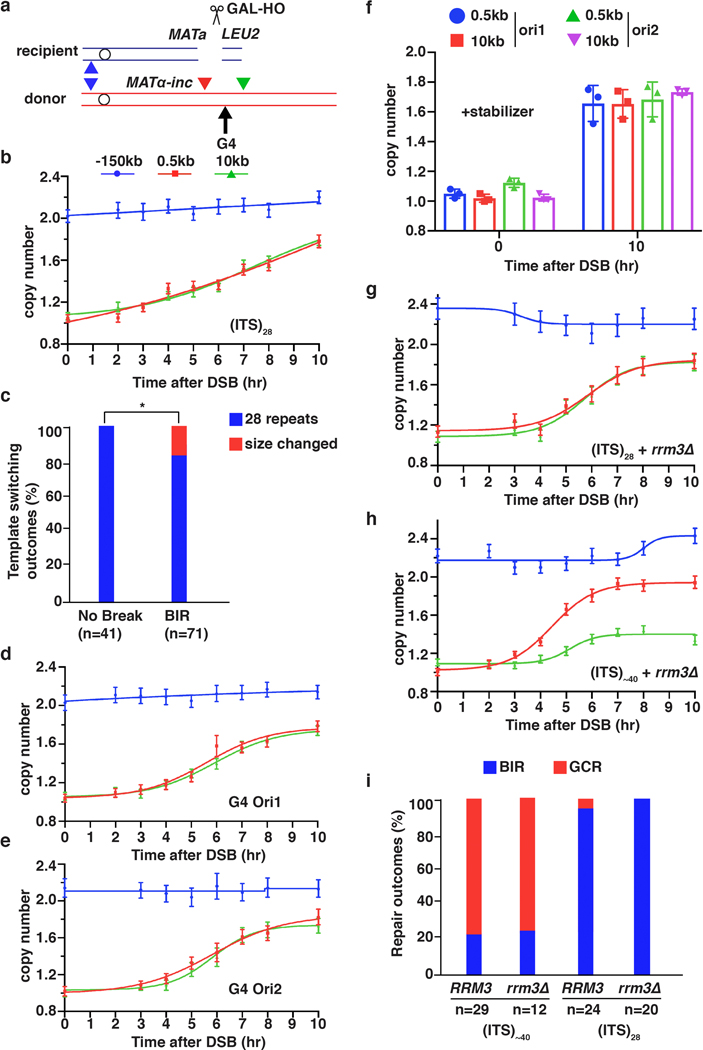
Interstitial telomere sequences (ITSs) are known to promote genetic instabilities linked to human diseases19. To study the impact of ITSs on BIR, we inserted a sequence containing human telomere repeats in the donor copy of chromosome III 6 kb centromere distal to MATα-inc (Fig. 3a). Our observation of robust DNA synthesis before but not downstream of the ITS support that BIR was interrupted within this region (Fig. 3b). CHEF electrophoresis analysis of DSB repair outcomes (see Methods) revealed that only ~24% (7/29) of DSBs repaired using BIR, while 76% (22/29) of DSBs resulted in a gross chromosome rearrangement (GCR) (Fig. 3d, e). Whole-genome sequencing of five of the GCR events demonstrated that they were all truncated at the position of ITS and stabilized by addition of yeast telomeres (Fig. 3f), which was further confirmed by PCR (see Methods). Because we engineered the ITS region with non-yeast telomeres, truncated BIR products could not be formed by template switching to natural yeast telomeres, and therefore likely resulted from de novo telomere addition. When TLC1, which encodes the RNA component of telomerase, was deleted, BIR synthesis was still defective beyond the ITS for more than 10 hours after DSB induction (Fig. 3c). However, after 16 hours, synthesis beyond the ITS was increased compared to wild type (Extended Data Fig. 5a), and eventually most cells completed BIR to the end of the chromosome (Fig. 3d, e). We conclude that ITSs stall and disrupt BIR, and telomerase can efficiently stabilize BIR aborted at ITSs by de novo telomere addition (Extended Data Fig. 5b). The ability of ITSs to interrupt DNA synthesis showed repeat-length dependence, as AMBER analysis indicated that reducing the number of telomere repeats from ~40 to 28 alleviated BIR blockage (Extended Data Fig. 6a, b). Nevertheless, even at this reduced length, ITSs still promoted genetic instability that was specific to BIR, with a higher frequency of ITS repeat contractions detected among BIR events compared to no-DSB controls (Extended Data Fig. 6c). BIR interruption at ITSs might be promoted by either a protein bound to ITS or by formation of secondary DNA structures. The former is more likely because BIR easily progressed through another, non-ITS, G4-forming sequence20 inserted in either orientation at the same location, even in the presence of the G4-stabilizing agent, Phen-DC321 (Extended Data Fig. 6d–f). In addition, deletion of RRM3, known to unwind G4 structures22, did not exacerbate BIR disruption upon encountering either (ITS)~40 or (ITS)28 ( (Extended Data Fig. 6g–i).
Figure 3. Interstitial telomere sequence (ITS) interrupts BIR.
a, Human ITS inserted at 6 kb centromere-distal to site of strand invasion in the donor Chr III. Positions of primers before (0.2 kb and 4 kb centromere-distal from MATα-inc) and after (7.5 kb and 10 kb centromere-distal from MATα-inc) ITS are indicated. b, AMBER analysis using primers (indicated) in TLC1 (wt) and c, tlc1Δ. b and c each represents one out of three independent biological repeats that showed similar results (see Supplementary Table 5 for other repeats). Mean values of target to reference (ACT1) loci ratios were calculated by Poisson distribution based on 10,000 droplets with error bars representing upper and lower Poisson 95%CI. d, Examples of DSB repair outcomes analyzed by CHEF electrophoresis in TLC1 (left) and tlc1Δ (right). e, Fraction of GCRs identified similar to d, n=29 individual samples for TLC1 and n=21 individual samples for tlc1Δ from 3 independent biological repeats. (****=statistically significant difference (p=4e-6) by Chi-square test (two-sided, df=1)). f, Coverage of Illumina sequencing reads for GCR outcomes. Sites of MAT and ITS insertion are indicated. 2x-coverage peaks near 300kb position result from the presence of additional copies of the corresponding sequences in the genome.
Transcription blocks BIR initiation
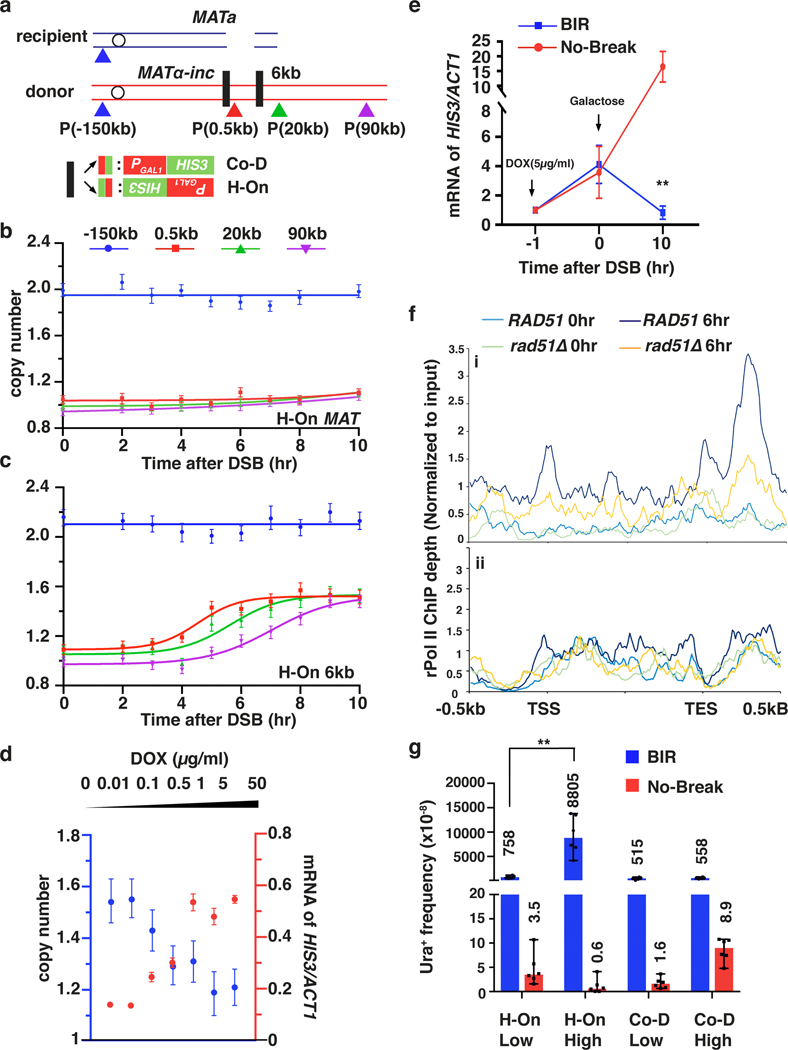
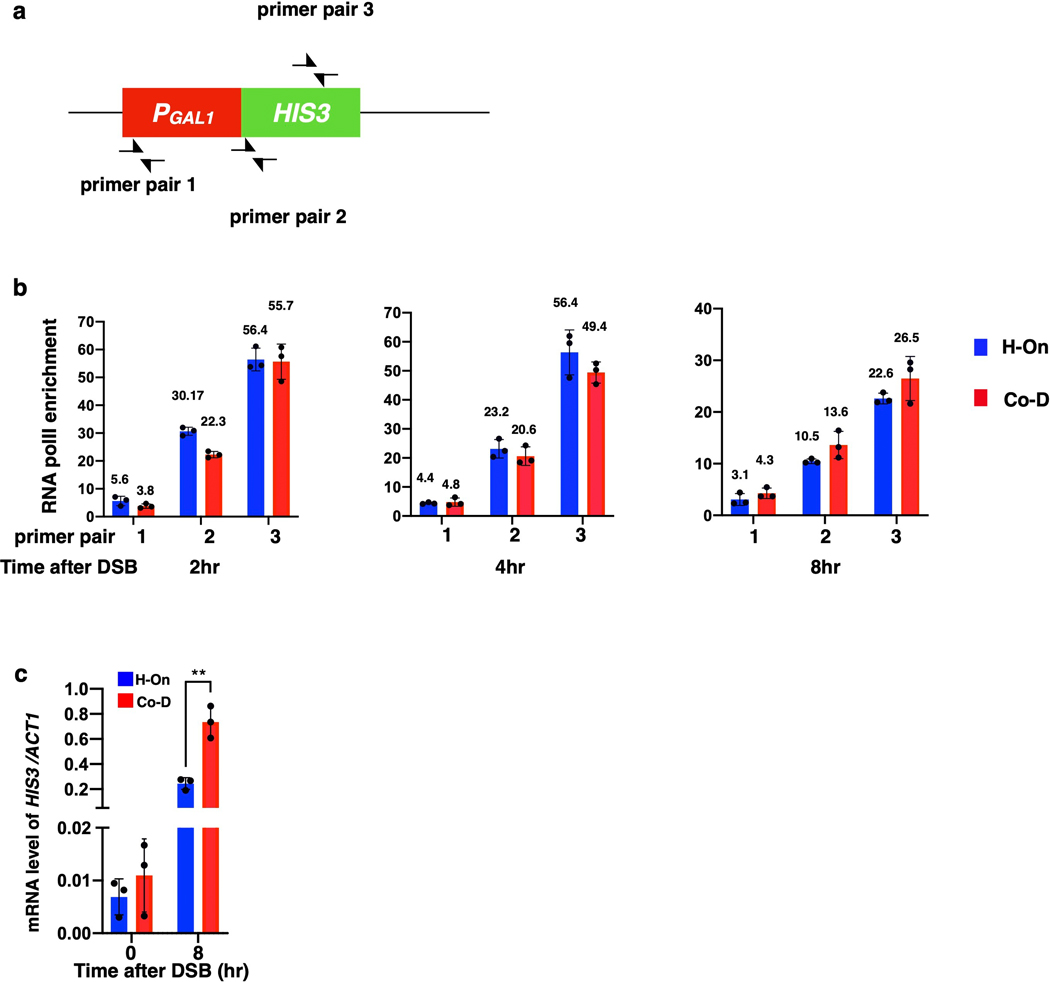
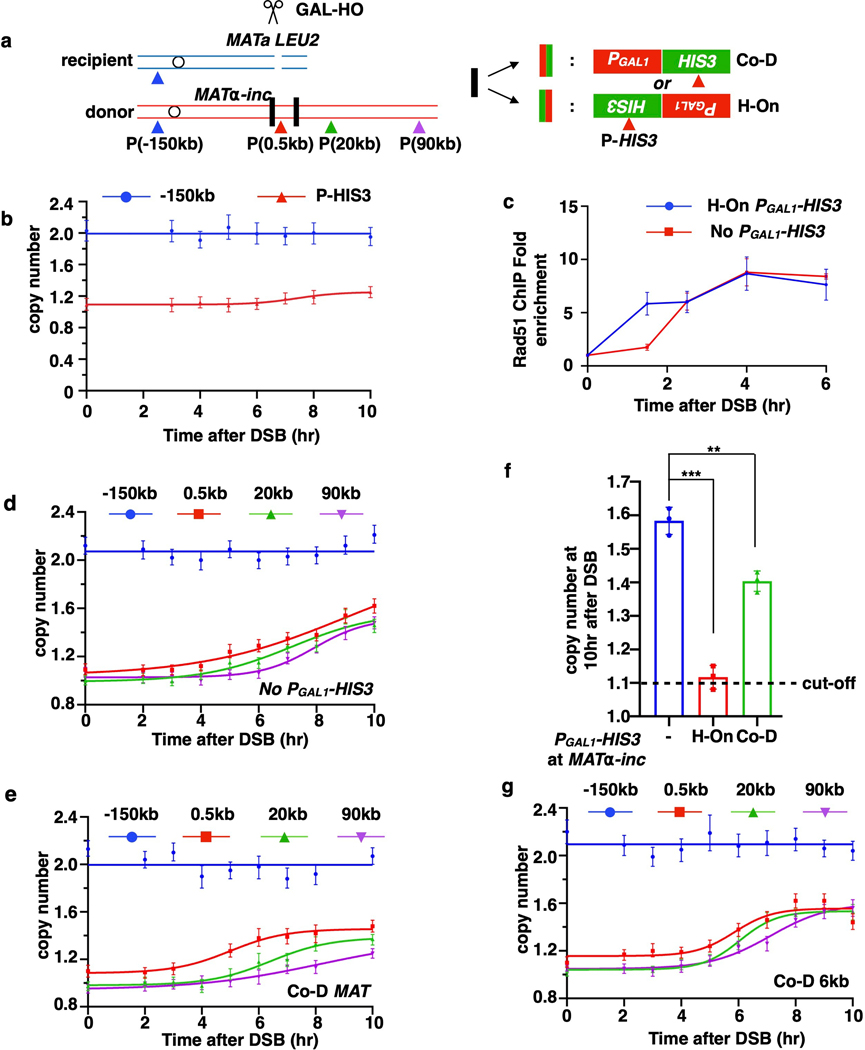
It is well established that collisions between the regular replication fork and transcription machinery can result in fork collapse, and BIR is a proposed mechanism to recover such collapsed replication forks 23–28. This would require that BIR can both successfully initiate at the site of collision between replication and transcription, as well as successfully traverse the highly transcribed unit. To test this, we inserted HIS3 under the control of the unidirectional GAL1 promoter 29 into MATα-inc of the donor chromosome III, which is near the site of BIR strand invasion, in opposite orientations: head-on (H-On) or co-directional (Co-D) with respect to BIR progression (Fig. 4a). Similar transcription efficiency for both orientations was confirmed by RNA-PolII chromatin immunoprecipitation (ChIP) (Extended Data Fig. 7a, b).
Figure 4. Highly transcribed units interfere with BIR.
a, PGAL1-HIS3 or PTET(on)-HIS3 inserted at MATα-inc or at 6 kb position in two orientations. b, c, AMBER analysis in strains with H-On PGAL1-HIS3 at MATα-inc (b) and at 6kb (c). d, BIR synthesis negatively correlates with transcription level at PTET(on)-HIS3. Amount of doxycycline (DOX) added to induce transcription is indicated. Blue, BIR synthesis at 0.5-kb 10hr post-DSB induction; red, mRNA levels of PTET(on)-HIS3 1hr after addition of doxycycline (just before DSB induction by galactose). b, c, and d, each represents one out of three independent biological repeats that showed similar results (see Supplementary Table 5 for other repeats). Mean values of target to reference (ACT1) loci ratios were calculated by Poisson distribution based on 10,000 droplets with error bars representing upper and lower Poisson 95%CI. e, mRNA level of HIS3 11hr after addition of 5μg/ml doxycycline to cells with or without DSB. The means ± SD (n=3 independent biological repeats) are indicated. Asterisks indicate statistical significance (p=0.0065) determined by t-test (two tailed). f, rPolII enrichment at transcription end site (TES) detected by ChIP-seq for all H-On genes (i), but not in (ii) Co-D genes located on donor ChrIII within 30 kb centromere distal to MAT. X-axis: transcription start site (TSS), TES, and 500 bp flanking regions. Y axis: the mean value of rPolII depth. g, The effect of transcription on BIR-associated mutagenesis measured as Ura+ frequency resulting from BIR synthesizing across PURA3:ura3–29 (“low” transcription) or PGAL1:ura3–29 (“high” transcription) in either the H-On or Co-D orientation (in respect to BIR) inserted 6 kb centromere distal to the DSB. GAL-HO cut site eliminated in the no-break control strains. The medians and 95% CI of mutation frequencies are indicated (n=6 independent biological repeats). **p=0.0022 determined by the Mann-Whitney U-test (two-tailed). (See Supplementary Table 2).
AMBER analysis detected no BIR-specific DNA synthesis within or beyond the H-On-orientated PGAL1-HIS3 sequence through the entire time course (Fig. 4b; Extended Data Fig. 8a,b), while strand invasion was efficient (Extended Data Fig. 8c). Additionally, the frequency of abnormal DSB repair products was greatly increased (Extended Data Fig. 9a, b). Thus, transcription in H-On orientation blocks initiation of BIR synthesis.
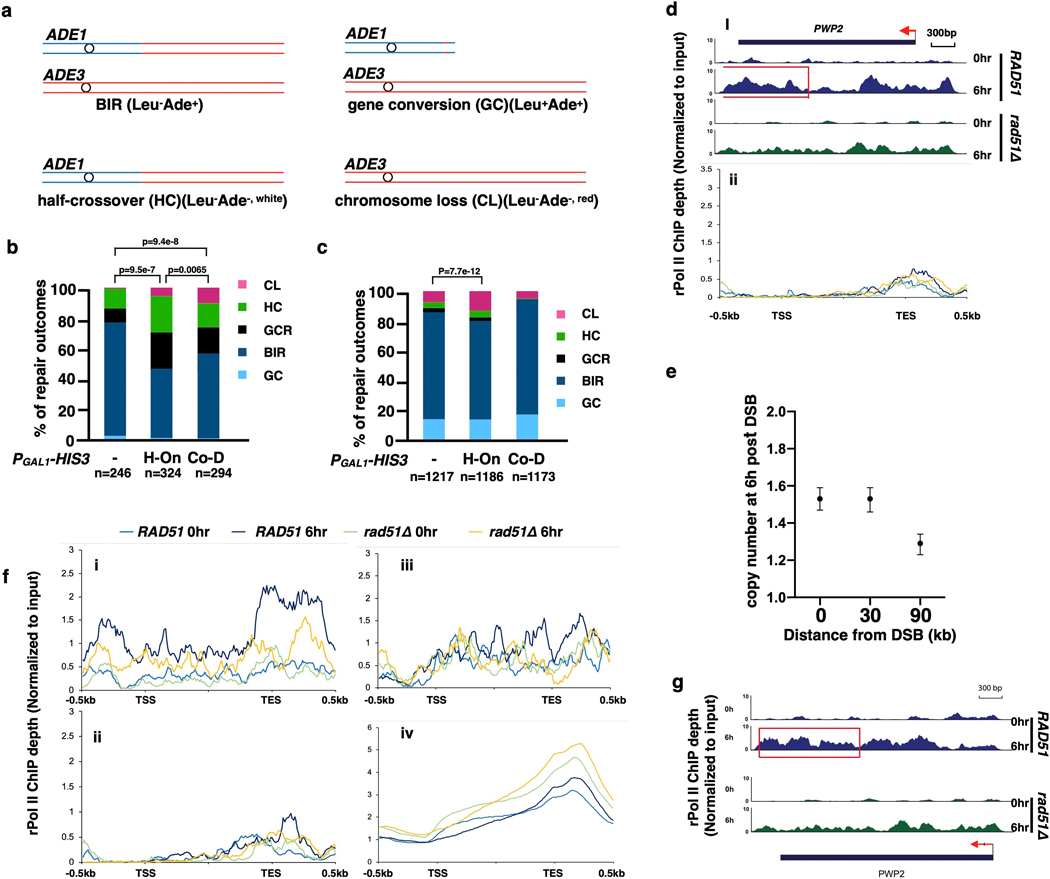
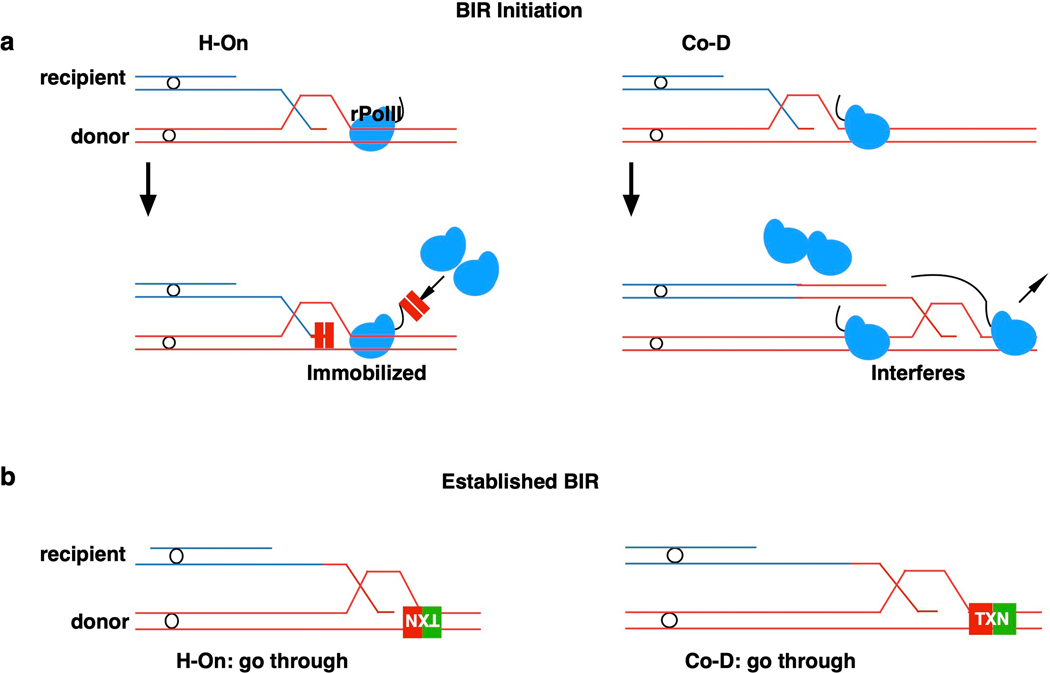
Similarly, when we inserted H-On oriented PTET (on)-HIS3, where the level of transcription was regulated by the amount of doxycycline added, the level of BIR synthesis showed inverse correlation with the amount of doxycycline (Fig. 4d). Strikingly, the high level of HIS3 mRNA that was detected 1 hour after addition of doxycycline decreased following BIR induction and was 25-fold lower in strains with a DSB compared to no-DSB controls 10 hours following galactose addition (Fig. 4e). Based on this, we propose that initiation of BIR and H-On transcription reciprocally block one another. This idea was further supported by much lower accumulation of HIS3 mRNA in strains with H-On- versus Co-D-oriented PGAL1-HIS3 8 hours after DSB induction, while ChIP confirmed similar rPolII binding in both orientations (Extended Data Fig. 7a–c). Together, we propose that initiation of BIR leads to immobilization of rPolII on DNA, which in turn blocks the progression of both BIR and further transcription. The resulting “stuck intermediates” may eventually be resolved, as evidenced by the presence of some BIR outcomes among survivors (Extended Data Fig. 9a, b). PGAL1-HIS3 inserted in the Co-D-orientation also decreased initial DNA synthesis and increased the number of abnormal DSB repair outcomes versus wild type, albeit not as strongly as in H-On-orientation (Extended Data Fig. 8d–f, Extended Data Fig. 9b). Together, our findings suggest that initiation of BIR synthesis is strongly impaired when it occurs in close proximity to actively transcribed areas.
Collision of BIR with transcription
When PGAL1-HIS3 was inserted further away (6 kb) from the site of invasion in either orientation, no evident BIR synthesis defect was detected by AMBER (Fig. 4a, c, Extended Data Fig. 8g). This could be because established BIR synthesis has less trouble traversing transcription units, or because initiation of BIR leads to a global change in transcription along the entire template. To distinguish between these possibilities, we compared rPolII distribution on the donor chromosome III before and 6 hours after DSB induction in strains proficient and deficient (rad51Δ) for BIR. At 6 hours, when more than a half of the cells had completed the first 30 kb, but few had cells completed 90 kb of BIR synthesis (Extended Data Fig. 9e), rPolII had accumulated in the TES regions of several H-On transcription genes within the first 30 kb of BIR in wild type cells, but not in rad51Δ cells (Fig. 4 f(i,), Extended Data Fig. 9d(i), f(i), g). rPolII accumulation was not observed from 60 kb downstream of the strand invasion site through the end of donor Chromosome III (Extended Data Fig. 9d(ii), f(ii)), likely because BIR had not yet passed through this region in the majority of the cells. rPolII accumulation was not observed in Co-D-oriented genes (Fig. 4f(ii), Extended Date Fig. 9d f(iii)), and it was specific to chromosome III genes (Extended Data Fig. 9f (iv)). Thus, BIR appears to have only a localized effect on transcription regulation. Our data suggest that established BIR can progress through transcribed genes, but active transcription in the H-On orientation may promote transient stalling of BIR. In further support of this, PGAL1-HIS3 at the 6-kb position increased the level of abnormal DSB repair outcomes in the H-On but not in the Co-D orientation (Extended Data Fig. 9c, Supplementary Table 1). Also, high transcription in H-On orientation strongly increased the rate of BIR-associated mutagenesis, measured by the PGal1-ura3–29 reporter (see Methods) inserted at the same chromosomal position (Fig. 4a, g, Supplementary Table 2).
In summary, BIR is slower and more susceptible to mutations and instability at roadblocks when compared to normal replication (Fig. 4g, Supplementary Table 1). Thus, the purported role for BIR in the recovery of collapsed replication forks at fragile sites3,24,25,27 would seem paradoxical. We propose that initiation of BIR can be adjusted by extensive DNA resection, 3’-end degradation or fork reversal to initiate BIR away from the highly transcribed site or other impediment. Once initiated, BIR can traverse transcribed regions, although traversing transcription units in H-On orientation promotes mutations and chromosomal rearrangements (Extended Data Fig. 10a, b).
METHODS
Media and strains.
All yeast strains (Supplementary Table 3) were isogenic to AM100330, which is a chromosome III disomic strain with the following genotype: MATa-LEU2-tel/MATα-inc ade1 met13 ura3 leu2–3,112/leu2 thr4 hmlΔ∷ADE1/hmlΔ∷ADE3 hmrΔ∷HYG ade3∷GAL-HO FS2Δ∷NAT/FS2). AM5658 is a pri2-1 derivative of AM1003 and is constructed by the pop-in-pop-out method using the YlpA16 plasmid 31 digested with HpaI (NEB R0105S). The pri2–1 mutation was confirmed phenotypically (temperature sensitivity) as well as by Sanger sequencing. The strains containing AID-tagged POL1 gene, AM3701, and the strain containing AID-tagged POL2 gene, AM3706, were constructed by inserting AID sequence at C-terminus of POL1 and of POL2, respectively, into strain AM3067 (derivative of AM2161; see Supplementary Table 3) that contains ADH-OsTIR32. The insertion of AID tag and ADH-OsTIR were confirmed by PCR and by the defective growth on media containing 2.5mM IAA. To study the effect of transcription on BIR, the PGAL1-HIS3 unit was constructed by ligating PCR fragments containing the GAL1 promoter (a truncated version of GAL1/GAL10 based on 29) and HIS3 coding region with the HindIII-digested pGP564 plasmid using the NEBuilder kit (NEB: E5520S). The PGAL1-HIS3 construct has been inserted into derivatives of AM1003 at different positions in two orientations using the delitto perfetto approach33 or CRISPR-Cas916. Specifically, two AM1003 derivatives containing the LYS2 gene under its native promoter at MATα-inc in two orientations were used. We first replaced the LYS2 gene with a lys2- PCORE cassette, where PCORE contains the URA3 and G418 markers, and selected Ura+, G418r, and Lys− transformants. Next, we deleted the native HIS3 gene on chromosome XV by replacement with a BleoR cassette. We then transformed the derivative strains with a PCR product containing PGAL1-HIS3 amplified using 80bp long homology primers homologous to the lys2 gene to replace PCORE by selecting for FOAr and G418s, which allowed us to obtain two strains with two orientations of PGAL1-HIS3 corresponding to orientations of two original LYS2 cassettes. To insert PGAL1-HIS3 at the 6kb position, a CRISPR-Cas9 plasmid targeting this position was built and co-transformed with a PCR fragment containing the PGAL1-HIS3 construct and 80bp long homology to both sides of the CRISPR-Cas9 target cut site in two orientations. Successful insertion of PGAL1-HIS3 was confirmed by PCR and phenotypically by observing growth of transformants on synthetic media without histidine that was dependent on the presence of galactose as the only source of carbon. Similarly, ura3–29 reporter under GAL1 or URA3 promoter was inserted into 6kb position in two orientations in the same way as described for PGAL1-HIS3 at this position. To determine how transcriptional level affects BIR stalling, GAL1 promoter in PGAL1-HIS3 in AM5299 is replaced by TET (on) promoter using a PCR product containing TET promoter and activator. Transformants were selected by synthetic media without histidine and containing 5μg/ml doxycycline.
AM5582 is a strain containing ~250–300bp human ITSs (ITS)~40 including ~40 telomere repeats from the pSP73.pSty11 plasmid34 inserted 6kb centromere-distal from MATα-inc. The number of telomere repeats was estimated by PCR using two primers (one primer specific to KANMX locus and another specific to PER1 gene located centromere distal to ITS). AM6068 is a strain containing human (ITS)28 (28 telomere repeats confirmed by sequencing) at the same place as AM5582 introduced by using CRISPR-Cas9 similar to16. The deletions of RRM3, RAD51, and RAD52 genes were constructed by transformation with DNA fragments containing ~ 200bp homology to corresponding genes flanking either Bleor or KANMX cassette, while transformation with a fragment containing ~200bp homology to TLC1 or PIF1 flanking BSD cassette (Invitrogen) was used to obtain the deletion of TLC1 or PIF1 gene. The sequences of all the oligos in this work are available upon request.
AM6026 is strain containing a G-quadruplex sequence that can form G4 structure during BIR leading strand synthesis. The G4-forming sequence is 750bp Sau3AI fragment from pT7-Sμ35 inserted into the BglII site of a LYS2 gene placed at 6kb centromere-distal from MATα-inc by CRISPR-Cas9 targeted integration. AM6026 strain was constructed using pop-in-pop-out allele replacement of LYS2 with HpaI linearized plasmids harboring the aforementioned lys2-G4 cassettes and the URA3 gene described in20,36. The strain AM6081 contains a sequence that can form G4 structure during BIR lagging strand synthesis which was inserted at the 6kb position by co-transforming with CRISPR-Cas9 plasmid targeting at this position and with PCR product of pT7-Sμ containing the G4 sequence and 80bp homology to the target site.
To study GCRs caused by a highly transcribed gene during normal (S-phase) DNA replication, we generated haploid strains containing PGAL-HIS3 cassette at MAT or NO-GAL-HIS3 control by losing of truncated (MATa) chromosome in AM5299, AM5301, and AM1411 (see Supplementary Table 3 for genotypes).The resulting strains (AM6082-AM6084) contained full-length chromosome III, hml::ADE3, hmr::HPH, as well as lys2 insertion at MAT with or without PGAL1-HIS3. These strains were crossed to the AM814 (MATα-inc that contained normal length chromosome III). The resulting diploids were named AM6088-AM6090. We also generated strains containing PGAL1-HIS3 cassette 6kb centromere distal to MAT or NO-PGAL1-HIS3 control by the loss of truncated (MATa) chromosome in AM5644, AM5646, and AM1003. The resulting strains (AM6085-AM6087) contained full-length chromosome III, MAT α-inc hml::ADE3, hmr::HPH. These strains we crossed to the SSA-repair outcome of YMV80 (hmlΔ::ADE1 mataΔ::hisG hmrΔ ::ADE1 leu2 ade3::GAL::HO ade1 lys5 ura3–52)37. The resulting diploids were named AM6091-AM6093. (See Supplementary Table 3 for the genotypes of these diploids).
Rich media (Yeast extract-peptone- dextrose (YEPD)), synthetic complete media, YEP-Raffinose, YEP-Galactose, and YEP-Lac media were prepared as described in38. Antibiotics were added to YEPD after autoclaving at concentrations described in38. All cultures were grown at 30°C unless specifically indicated.
Analysis of BIR efficiency.
DSBs were induced by HO endonuclease in asynchronous cell populations, which led to G2/M cell cycle arrest within 2–3 hours. BIR then proceeds in a synchronized culture of G2/M-arrested cells. To follow BIR dynamics, cells were grown in liquid lactate medium to log phase, and upon DSB induction samples were collected at 0.5- to 2-hour intervals for up to 10 hours. BIR efficiency was determined genetically and by physical analysis in time-course experiments using CHEF gel electrophoresis followed by Southern hybridization using ADE1-specific probe as previously described38. The efficiency of BIR by both methods was calculated based on results of at least three independent experiments.
Mutagenesis assay.
To determine mutation frequency associated with BIR, yeast strains were grown from individual colonies with agitation in liquid synthetic media lacking leucine for approximately 20 hrs, diluted 20-fold with fresh YEP-Lac, and grown to logarithmic phase for approximately 16 hrs until cell density reached ~ 5×10⁶ cells ml−1. To measure the frequency of Ura+ cells, samples were plated at appropriate concentrations on YEPD and on uracil drop-out media where glucose was substituted for 2% galactose. The frequencies of mutagenesis were calculated similar to described in39–41.
Analysis of GCR (chromosome loss) associated with vegetative growth (S-phase replication).
Diploid strains (AM6088-AM6090 and AM6091-AM6093) were grown in YEP-Lac media overnight, then plated onto YEP-Galactose plates and incubated at 30°C for 3–4 days. After that, plates were replica plated to selective media (YEPD with 0.5g/L hygromycin) for AM6088-AM6090 to determine the frequency of chromosome loss by the frequency of hygromycin-sensitive colonies or to synthetic media without adenine for AM6091-AM6093 to determine the frequency of chromosome loss by the frequency of Ade− colonies.
D-loop capture (DLC) assay experiments
were performed as described in 11. (See Supplementary Table 4 for primers).
PCR analysis of GCRs in ITS strain
were performed using primers specific to yeast telomere sequence (as in 42) and to the KANMX locus centromere proximal to the ITS insertion. Formation of 0.5- to ~1-kb PCR products was indicative of de novo telomere addition that led to the formation of truncated BIR products.
Whole Genomic Sequencing
analysis were performed using QIAGEN CLC Genomics Workbench 20.
The analysis of BIR kinetics by AMBER (Assay for Monitoring BIR Elongation Rate).
Time course experiment.
Yeast cells were grown overnight in synthetic leucine drop-out media, transferred to YEP-Lac and incubated for ~16 hours, until cell density reached ~ 5×10⁶ cells ml−1. An aliquot (50ml) was taken for analysis of pre-DSB copy number (“0 hour”) and galactose was added to a final concentration of 2% to induce HO endonuclease in the remainder of the culture. DSBs were induced by HO endonuclease in asynchronous cell populations, which leads to G2/M cell cycle arrest within 2–3 hours. BIR then proceeds in a synchronized culture of G2/M- arrested cells. To arrest cells at G2/M prior to the DSB, nocodazole (0.015 mg ml−1) was added, and the cells were further incubated with aeration for ~3 hours (until more than 95% of cells were arrested at G2/M stage). 50ml aliquot of cells were collected at different intervals following the break, cells were washed with sterile water with or without 0.1% sodium azide, and stored at −80°C. The experiments involving pri2–1 mutants and the PRI2 (wt) control were performed similarly, but with several modifications. Specifically, cells were grown in YEP-Lac at 25°C until cell density reached ~ 5×10⁶ cells ml−1, when nocodazole (0.015 mg ml−1) was added, and the cells were further incubated with aeration for ~3 hours. Cultures were then transferred to 37°C and incubated for 3.5 hours that was sufficient for deactivation of primase in the pri2–1 mutant. After this point, pre-DSB samples were collected and HO endonuclease was induced by addition of galactose similarly to described before. In experiments involving strains containing PTET(on)-HIS3, cells were grown in 1L of YEP-Lac media for 16 hours, and then aliquoted into eight 250ml flasks (100 ml of culture in each flask), and doxycycline was added into flasks to the following concentrations: 0, 0.01, 0.1, 0.5, 1, 5, 50 μg/ml respectively. 50ml of cells were removed from each flask following incubation at 30°C for 1 hour, and galactose was added to the remaining cultures to the final concentration of 2% to induce DSB. Then, following 10 hours of incubation after galactose addition, another 50ml aliquot were collected from each culture. An additional 100ml was used as no-break control, which was treated with 5μg/ml doxycycline but without addition of galactose. The obtained aliquot were used to prepare DNA for AMBER and mRNA extraction.
DNA preparation.
Cells are resuspended in spheroplasting buffer11 with 250μg/ml 20T zymolyase and incubated at 37ºC for 10 minutes to digest the cell wall. 2.5×10⁵ cells are then centrifuged at 3000rpm for 2 minutes and all remaining liquid removed. Cells were resuspended with 400μl 1x NEB Cutsmart buffer (B7204S) (or S1 digestion buffer for pri2–1 ssDNA digest experiment (Thermo Fisher, EN0321)). Then 4μl of 10% SDS was added and the mixture was incubated at 60°C for 15 minutes. The mixture was placed on ice and 50μl of 10% triton X-100 is added. 20μl of RNase (10mg/ml) was added and incubated at 37°C for 30 minutes (For pri2–1 ssDNA digest experiment, 20μl RNase (10mg/ml) and 10μl 1:10000 diluted S1 enzyme together were incubated at 25°C for 30 minutes instead). Next, 20μl protease K (10mg/ml) was added and incubated at 60°C for 30 minutes. The mixture was placed on ice, 0.5ml phenol-chloroform was added and the mixture was vortexed for 1 minute followed with centrifuged at 13,000rpm for 15 minutes. The aqueous phase was taken and added to 0.5ml phenol-chloroform, and mixed by inverting. Centrifugation of the mixture was repeated, and the aqueous phase was taken. DNA was precipitated by adding 35μl 3M sodium acetate (PH5.2) and 0.35ml isopropanol, incubating at room temperature for 30 minutes. Centrifugation at 13,000 rpm for 20 minutes pellets the DNA and the supernatant was removed. The pellet was resuspended in 0.2ml NaCl solution (0.2M). The DNA was precipitated by addition of 0.8ml ice cold 100% ethanol and incubated at −20°C for 20 minutes followed by centrifugation at 13,000 rpm for 20 minutes. After removing the supernatant, the pellet was washed by adding 0.5ml 80% ethanol and centrifugated at 13,000 rpm for 5 minutes. The ethanol was removed and the pellet was dried completely before resuspending in 100μl of molecular grade water for later use. The purified DNA has been quantified using Quant-iT PicoGreen dsDNA Assay Kit (Invitrogen, P11496), and stored at −20°C until used.
ddPCR.
PCR reaction mix was assembled in the following way: 10μl 2x “Supermix for probe” (Biorad, 1863026), 1μl of 20x primer mix for the target locus (containing primers and fluorescent probe (IDT)), 1μl of 20x primer mix for the ACT1 locus, 1–2μl of DNA diluted to appropriate concentration, and molecular grade water was added to the total volume of 20μl. Next, the reaction mix and 70μl of oil (Biorad, 1863005) were added to a Droplet Generation Cartridge (Biorad, 1864008), where droplets were generated. Standard two-step Biorad ddPCR protocol was employed for ddPCR. The copy numbers for target locus were calculated by normalizing its DNA concentrations to the concentration for ACT1 locus (chromosome VI). The means and 95% CIs were calculated for individual experiments by QuantaSoft from BioRad. The copy number for positions located centromere-distal to MATα-inc started from 1x before BIR and was expected to increase to up-to 2x by the end of BIR. The copy number for EMC1 gene located at 45kb position (left arm of chromosome III (positions according to Saccharomyces genome database)) was expected to stay at 2x and was used as a control. The best fitting BIR curves were generated by Boltzmann sigmoidal equation43. The threshold for BIR synthesis was established at 0.1x increase based on the error level of ddPCR that was calculated from experiment where no change in copy number was expected. In particular, the copy number of the EMC1 gene (that was not affected by BIR) demonstrated ± 0.1 variation. Additionally, the variation of copy number for BIR-specific probes in rad51Δ and rad52Δ mutants, where BIR cannot occur, following DSB induction proved to be within 0.1x limit.
Analysis of HIS3 mRNA level.
The extraction of mRNA was conducted using Trizol reagent (Thermo Fisher 15596026) and RNeasy kit from Qiagen (74104) and RNase-Free DNase Set kit from Qiagen (79254). The cDNA was produced using iScript cDNA Synthesis Kit (BioRad, 1708890). The levels of HIS3 mRNA were measured by ddPCR using HIS3 specific primer sets (see Supplementary Table 4) and normalized to ACT1 using the same primer sets as in AMBER.
ChIP-qPCR.
Cells were cultured in YEP-Raffinose liquid media overnight at 30°C to a final density of 1×10⁷ cells per ml. DSBs were induced as described above. Formaldehyde (1% final concentration) was used to crosslink DNA-protein complexes. Crosslinking reactions were quenched after 12 min by the addition of glycine (125 mM) and reactions were continued for another 5 min. Cells were collected by centrifugation and washed first with TBS (125 mM Tris-HCl [pH 7.4], 130 mM NaCl, 5 mM KCl, 0.9 mM CaCl2 and 0.5 mM MgCl2 ) supplemented with glycine (125 mM) and a second time with TBS alone and stored at −80°C. Cells were lysed with glass beads on a bead beater for 6 minutes in lysis buffer (50 mM HEPES [pH 7.5], 1 mM EDTA, 140 mM NaCl, 1% Triton X-100, 0.1% Sodium deoxycholate, 1 mg/ml bacitracin, 1mM benzamidine, and 1 mM PMSF). Genomic DNA was sheared to an average size of 0.5 kb by sonication (Misonix Sonicator 3000). Cell debris was removed by centrifugation at 14000 RPM and supernatant was incubated overnight with anti-RNA Polymerase II Rpb1 antibody (BioLegend, 664912), or anti-Rad51 antibody (a gift from Patrick Sung) at 4°C, followed by the addition of protein G-Agarose beads (Roche, 11243233001) for Rpb1 or protein A-Agarose beads (Roche, 11719408001) for Rad51 and continued incubation for 4 hrs. Beads were then washed twice with lysis buffer, twice with high salt lysis buffer (lysis buffer with 500 mM NaCl), twice with wash buffer (10 mM Tris-HCl [pH 8.0], 1 mM EDTA, 250 mM LiCl, 0.5% Sodium deoxycholate and 0.5% Igepal CA-630) and twice with 1xTE. DNA-protein complexes were eluted by incubating beads with 250 μl of elution buffer (50 mM Tris-HCl [pH8.0], 10 mM EDTA and 1% SDS) for 30 min at 65°C. Reverse crosslinking was carried out overnight at 65°C, followed by protease K treatment and phenol-chloroform purification. Purified DNA was analyzed by qPCR using the PowerUp SYBR Green Master Mix (Applied Biosystems). Enrichment was normalized to the ACT1 locus.
ChIP-seq.
Rpb1-ChIP was performed as mentioned above with minor modifications. DNA was sheared to an average size of 0.3 kb and Dynabeads Protein G (Invitrogen, 10003D) was used for immunoprecipitation. After phenol-chloroform purification, DNA was further cleaned up by AMPure XP beads (1.5x ratio, Beckman Coulter, A63881). Libraries were constructed using the ThruPLEX Plasma-seq Kit (Takara Bio, R400679) and sequenced by the Illumina NextSeq 500 System. For data analysis, first raw reads were first trimmed using fastp version 0.20.1 to remove adaptors and low-quality reads44, then mapped to the genome using bowtie2 version 2.2.4 with default parameters45. Duplicate reads were removed by samtools version 1.10 markdup function with -r parameter 46. Peaks were called using macs2 version 2.2.7.1 callpeak function with -B -g 1.2e7 -q 0.01 parameters using input as background control 46. Signal tracks were generated using mac2 bdgcmp function with -m ppois parameter using input as a background control. Metagene plot were generated using deeptools version 3.5.0 computeMatrix scale-regions with –upstream 500 –binSize 10 –downstream 500 –missingDataAsZero –averageTypeBins mean –skipZeros parameters 47.
Antibodies
The Anti-Rad51 antibody (1:300 for dilution) used in Rad51 ChIP was a gift received from Dr. Patrick Sung, UT Health San Antonio produced in his lab. Anti-myc antibody (9B11, 1:1,000 for dilution) used for Western Blots was purchased from Cell Signaling Technology (Danvers, MA). Anti-alpha-Tubulin antibody (#4A1, 1:1,000 for dilution) was purchased from Developmental Studies Hybridoma Bank (DSHB) at the University of Iowa (Iowa City, IA). HRP-conjugated goat-anti-mouse IgG (#115–035-003, 1:10,000 for dilution) was from Jackson ImmunoResearch Laboratories (West Grove, PA). Anti-RNA Polymerase II Rpb1 antibody (BioLegend, 664912, 1:100 for dilution) was used for rPolII ChIP qPCR experiment and also rPolII-seq experiment.
Extended Data
Extended Data Figure 1. Kinetics of DSB repair.
a, Strand invasion measured by Rad51 ChIP followed by qPCR. Forward primer is shared by donor and recipient at X region, and reverse primer is unique to the Yα region in the donor. The means ± SD (n=3 independent biological repeats) are indicated. b, Strand invasion measured by DLC assay. DLC signal is normalized to ARG4 and then compared to 0hr by fold changes. The means ± SD (n=3 independent biological repeats) are indicated. c, DNA synthesis detected by ddPCR using traditional DNA preparation protocol (see Methods). d, AMBER analysis of DNA clipping or degradation using primers located centromere proximal to MATa in wt (top), rad51Δ (middle), or rad52Δ (bottom) following DSB induction. In rad52Δ the rate of DNA degradation was >8kb/hr, much higher than in wt and rad51Δ. c and d each represents one out of three independent biological repeats that showed similar results (see Supplementary Table 6 for other repeats). Mean values of target to reference (ACT1) loci ratios were calculated by Poisson distribution based on 10,000 droplets with error bars representing upper and lower Poisson 95%CI.
Extended Data Figure 2. Kinetics of BIR synthesis.
a, Schematic of primers (triangles) used for AMBER analyses (similar to Fig. 1a). b, DNA synthesis detected by AMBER in a time course designed as described in Fig. 1b, but with nocodazole addition 3 hours prior to DSB induction (0hr). The data represent one experiment that was similar to 3 experiments presented in Fig. 2b. c, Slopes of BIR at the time when 50 percent of the cells had completed BIR (V50) at the indicated chromosomal position based on three independent experiments (n=3), including the one shown in Fig. 1b. The means ± SD (error-bars) are indicated. Statistics is determined by two-tailed t-test with p value indicated. d, AMBER analysis of POL3 (wt), and e, pol3–01. b, d and e each represents one out of three independent biological repeats that showed similar results (see Supplementary Table 6 for other repeats). Mean values of target to reference (ACT1) loci ratios were calculated by Poisson distribution based on 10,000 droplets with error bars representing upper and lower Poisson 95%CI.
Extended Data Figure 3. BIR synthesis in pif1Δ, pol32Δ, and pol2-AID.
a, Strand invasion in pif1Δ and pol32Δ mutants 6h post DSB measured by DLC assay. DLC signal is normalized to ARG4 and compared to 0hr by fold changes. The means ± SD (n=3 independent biological repeats) are indicated. b, Kinetics of Ya disappearance in wt, pif1Δ, pol32Δ and pif1Δ pol32Δ. c, Schematic of primers used for AMBER analyses. d-f, AMBER analysis of BIR synthesis in wt (PIF1, POL32) (d), in pif1Δ (e), and pol32Δ (f). d-f each represents one out of three independent biological repeats that showed similar results (see Supplementary Table 6 for other repeats). Mean values of target to reference (ACT1) loci ratios were calculated by Poisson distribution based on 10,000 droplets with error bars representing upper and lower Poisson 95%CI. g, AMBER analysis of BIR synthesis following inactivation of Polε (pol2-degron) with schematic of analysis (top), degradation of AID-tagged Pol2 verified by Western Blot (middle) and calculation of copy number (bottom). The means ± SD (n=3 independent biological repeats) are indicated. * represents significant difference (p=0.0351) determined by t-test, two-tailed).
Extended Data Figure 4. Primase defect leads to defective long leading strand synthesis.
a, CHEF electrophoresis analysis of DSB repair in PRI2 (wt) and temperature-sensitive pri2–1 mutant followed by Southern blot analysis using ADE1-specific probe (one representative experiment from n=3 independent biological repeats). BIR: BIR repair product; HC: half-crossover resulting from fusion between fragments of recipient and donor Chromosome III (see Extended Data Fig. 9a for details); ChrI: Chromosome I; Uncut: full-length recipient chromosome. b, Top: Schematic of experiment to characterize BIR progression following depletion of Pol1 (pol1-degron) by addition of IAA. Bottom left: Degradation of AID-tagged Pol1 verified by Western Blot. Bottom right: AMBER analysis of BIR synthesis. The means ± SD (n=3 independent biological repeats) indicated by error bars. c, Proposed model explaining the role of primase and Okazaki fragment synthesis in stabilization of leading strand.
Extended Data Figure 5. BIR stalls inside ITS.
a, AMBER analysis of BIR synthesis in TLC1 and tlc1Δ cells traversing (ITS)~40, similar to Fig. 3b, c, but with nocodazole added 6hr post DSB. The means ± SD (n=3 independent biological repeats) are indicated. **Statistical significance is determined by t-test (two- tailed), p=0.0053. b, Proposed model of BIR interruption at ITS followed by telomerase-mediated de novo telomere addition.
Extended Data Figure 6. G4 -forming sequence does not block BIR progression.
a, A G4-forming sequence or (TTAGGG)28 was inserted at the 6-kb position. The colors indicating positions are kept the same in panels b, d, e, g and h. b, AMBER analysis of BIR through (ITS)28 inserted at the 6 kb position. c, Sanger sequencing analysis of repair outcomes of BIR that traversed (ITS)28 show change in ITS copy number resulting from template switching. (Sample sizes (n) are indicated. * = statistically significant difference (p=0.0288) determined by Chi-square test (two-sided, df=1)). d, AMBER analysis of BIR through sequence that can form G4 structure during leading strand (Ori1) synthesis and e, during lagging strand (Ori2) synthesis. f, AMBER analysis of BIR through G4-forming sequences similar to d and e, but in the presence of G4-stabilizing drug, Phen-DC3. The means ± SD (n=3 independent biological repeats) indicated by error-bars. g, h, AMBER analysis of BIR synthesis in rrm3Δ mutant through (ITS)28 (g) and through (ITS)~40 (h). i, genetic analysis of GCR in (g) and (h) performed similar to Fig. 3d, e. Sample sizes (n) are indicated. b, d, e, g and h each represents one out of three independent biological repeats that showed similar results (see Supplementary Table 6 for other repeats). Mean values of target to reference (ACT1) loci ratios were calculated by Poisson distribution based on 10,000 droplets with error bars representing upper and lower Poisson 95%CI.
Extended Data Figure 7. Initiation of BIR immobilizes rPolII on H-On transcribed genes.
a, Location of primer pairs homologous to GAL1 promoter (pair 1), TSS (transcription start site) (pair 2) and the middle of HIS3 gene (pair 3) used for qPCR (see Supplementary Table 4 for primer sequences). b, RNA PolII enrichment at PGAL1-HIS3 in H-On and Co-D orientations measured at indicated times following galactose addition. The means of rPolII enrichment ± SD indicated by error-bars (n=3 independent biological experiments). c, Transcription levels of PGAL1-HIS3 8 hr post-DSB detected by HIS3-specific primers and normalized to ACT1 mRNA control. The means ± SD (n=3 independent biological repeats), indicated by error-bars. (**= statistically significant difference (p=0.0033) determined by t test, two tailed).
Extended Data Figure 8. Interference between BIR and transcription.
a, Schematic of PGAL1-HIS3 inserted at MATα-inc in H-On or Co-D orientations with respect to BIR progression. The same primer pairs were used for AMBER analysis as described in Fig. 1a, although their actual positions along the BIR track (donor chromosome) are shifted by insertion of PGAL1-HIS3. b, AMBER analysis of experiment in Fig. 4b using primers located in HIS3 gene. c, Strand invasion kinetics for experiment shown in d and Fig. 4b assessed by Rad51 ChIP followed by qPCR using primers amplifying the junction region with the forward primer targeting a donor and recipient shared region while the reverse primer targeting donor-specific region. The means ± SD (n=3 independent biological repeats) are indicated. d, AMBER analysis of AM1411 (the NO-PGAL1-HIS3 control strain used for experiments shown in Fig. 4b, and Extended Data Fig. 8e) containing insertion of lys2 under its native promoter at MATα-inc to match the experimental strains in mating type and in the presence of insertion at MATα-inc. e, AMBER analysis in strain with PGAL1-HIS3 inserted at MATα-inc in Co-D orientation. f, The amount of BIR synthesis detected at 10 hr using 0.5 kb primers in strains with or without PGAL1-HIS3. The means ± SD (n=3 independent biological repeats) are indicated. Asterisks indicate statistically significant difference determined by two-tailed t-test (***: p=1.12e-4; **: p=0.0035) g, AMBER analysis of BIR progression in strains with PGAL1-HIS3 inserted 6 kb centromere distal from MAT in Co-D orientation. b, d, e, and g each represents one out of three independent biological repeats that showed similar results (see Supplementary Table 6 for other repeats). Mean values of target to reference (ACT1) loci ratios were calculated by Poisson distribution based on 10,000 droplets with error bars representing upper and lower Poisson 95% CI.
Extended Data Figure 9. BIR is interrupted by transcription.
a, Products of DSB repair as distinguished by genetic markers. b, Distribution of DSB repair outcomes for strains with and without PGAL1-HIS3 inserted at MATα-inc. c, the same as in b, but for strains with PGAL1-HIS3 inserted at 6kb position. In b and c, sample sizes (from 3 biological repeats) are indicated (see Methods for details). Statistical comparisons are performed using Chi-square test (two-sided, df=1); p values are indicated. d, (i) rPolII enrichment at TES detected by ChIP-seq for PWP2 gene located 20kb centromere distal to MAT. Red rectangle: BIR-promoted accumulation of rPolII at TES; (ii) rPolII distribution for all H-On genes located on donor chromosome III between 60 and 90 kb centromere distal to MAT. Data from the same experiment as shown in Fig. 4f. e, AMBER analysis of BIR synthesis from the same samples as in Fig. 4f (n=1, mean values of ratios between target and reference (ACT1) loci are calculated using Poisson distribution based on 10,000 droplets with error bars representing upper and lower Poisson 95%CI.). f, independent repeat of experiment shown in Fig. 4f. Metagene plot showing the distribution of normalized rPolII-ChIP-seq reads along chromosome III. i) At genes located within 0–30kb centromere distal of the MAT locus (n=10) in H-On direction; ii) at genes located within 60–90kb centromere distal to the MAT locus in H-On orientation (n=11); iii) at genes located within 0–30kb centromere distal to the MAT locus in Co-D orientation (n=9); iv) at all the genes except genes on chromosome III (n=2950). Transcription start site (TSS), transcription end site (TES) and 500 bp flanking regions were plotted. Y axis showing the mean value of rPolII depth. g, Example of BIR-caused rPolII re-distribution in yeast gene PWP2 located on chrIII (data from same experiment in Extended Data Fig. 9f). The panels show normalized rPolII ChIP-seq reads from RAD51 (wild type) (top) and rad51Δ (bottom). Red rectangle: BIR-promoted rPolII accumulation.
Extended Data Figure 10. Model of highly transcribed region interfering BIR.
a, Model of the block of BIR initiation by transcription. Left: For H-On transcription, BIR immobilizes rPolII, which leads to the block of BIR and transcription. Right: Co-D transcription also interferes with BIR initiation. b, Established BIR can traverse transcription units in both orientations, even though it is associated with transient accumulation of rPolII at TES and leads to increased level of GCRs and mutagenesis in H-On orientation.
Supplementary Material
Acknowledgements
We thank the Genomic and RNA Profiling Core at Baylor College of Medicine for library preparation and NGS service. We thank Youri Pavlov for advice on Western blot analysis. We thank James Haber for sharing plasmids and yeast strains for this research. We are thankful to Nayun Kim for sharing the plasmids containing G4-forming sequences. We thank Patrick Sung for the gift of anti-Rad51 antibody. We thank Conrad Nieduszynski, and Marc Wold for suggestions on this project. We thank Sarit Smolikove, for the helpful comments on the manuscript. This work was supported by the NIH grants R35GM127006 to A.M., and by GM080600, GM125650 to G.I., and R01AG052507 to W.D.
Footnotes
Competing Interests Statement
The authors declare no financial or other competing interest.
Data Availability
The Whole Genome Sequencing raw data is deposited to the NCBI Sequence Read Archive database: https://www.ncbi.nlm.nih.gov/Traces/study/?acc=PRJNA671607&o=acc_s%3Aa. The rPolII ChIP sequencing data is deposited to the NCBI Gene Expression Omnibus (GSE159384 https://www.ncbi.nlm.nih.gov/geo/query/acc.cgi?acc=GSE159384). All data generated and analyzed in this paper are available from corresponding author upon request.
References:
- 1.Anand RP, Lovett ST & Haber JE Break-induced DNA replication. Cold Spring Harb Perspect Biol 5, a010397, doi: 10.1101/cshperspect.a010397 (2013). [DOI] [PMC free article] [PubMed] [Google Scholar]
- 2.Llorente B, Smith CE & Symington LS Break-induced replication: what is it and what is it for? Cell Cycle 7, 859–864, doi: 10.4161/cc.7.7.5613 (2008). [DOI] [PubMed] [Google Scholar]
- 3.Sakofsky CJ & Malkova A. Break induced replication in eukaryotes: mechanisms, functions, and consequences. Crit Rev Biochem Mol Biol 52, 395–413, doi: 10.1080/10409238.2017.1314444 (2017). [DOI] [PMC free article] [PubMed] [Google Scholar]
- 4.Lydeard JR, Jain S, Yamaguchi M & Haber JE Break-induced replication and telomerase-independent telomere maintenance require Pol32. Nature 448, 820–823 (2007). [DOI] [PubMed] [Google Scholar]
- 5.Wilson MA et al. Pif1 helicase and Poldelta promote recombination-coupled DNA synthesis via bubble migration. Nature 502, 393–396, doi: 10.1038/nature12585 (2013). [DOI] [PMC free article] [PubMed] [Google Scholar]
- 6.Malkova A, Naylor ML, Yamaguchi M, Ira G & Haber JE RAD51-dependent break-induced replication differs in kinetics and checkpoint responses from RAD51-mediated gene conversion. Molecular and cellular biology 25, 933–944 (2005). [DOI] [PMC free article] [PubMed] [Google Scholar]
- 7.Saini N et al. Migrating bubble during break-induced replication drives conservative DNA synthesis. Nature 502, 389–392 (2013). [DOI] [PMC free article] [PubMed] [Google Scholar]
- 8.Donnianni RA & Symington LS Break-induced replication occurs by conservative DNA synthesis. Proc Natl Acad Sci U S A 110, 13475–13480, doi: 10.1073/pnas.1309800110 (2013). [DOI] [PMC free article] [PubMed] [Google Scholar]
- 9.Lydeard JR et al. Break-induced replication requires all essential DNA replication factors except those specific for pre-RC assembly. Genes Dev 24, 1133–1144, doi: 10.1101/gad.1922610 (2010). [DOI] [PMC free article] [PubMed] [Google Scholar]
- 10.Ruff P, Donnianni RA, Glancy E, Oh J & Symington LS RPA Stabilization of Single-Stranded DNA Is Critical for Break-Induced Replication. Cell Rep 17, 3359–3368, doi: 10.1016/j.celrep.2016.12.003 (2016). [DOI] [PMC free article] [PubMed] [Google Scholar]
- 11.Piazza A, Koszul R & Heyer WD A Proximity Ligation-Based Method for Quantitative Measurement of D-Loop Extension in S. cerevisiae. Methods Enzymol 601, 27–44, doi: 10.1016/bs.mie.2017.11.024 (2018). [DOI] [PMC free article] [PubMed] [Google Scholar]
- 12.Piazza A et al. Dynamic processing of displacement loops during recombinational DNA repair. Molecular cell 73, 1255–1266. e1254 (2019). [DOI] [PMC free article] [PubMed] [Google Scholar]
- 13.Jain S et al. A recombination execution checkpoint regulates the choice of homologous recombination pathway during DNA double-strand break repair. Genes & Development 23, 291–303 (2009). [DOI] [PMC free article] [PubMed] [Google Scholar]
- 14.Raghuraman M et al. Replication dynamics of the yeast genome. Science 294, 115–121 (2001). [DOI] [PubMed] [Google Scholar]
- 15.Smith CE, Llorente B & Symington LS Template switching during break-induced replication. Nature 447, 102–105, doi: 10.1038/nature05723 (2007). [DOI] [PubMed] [Google Scholar]
- 16.Anand R, Beach A, Li K & Haber J. Rad51-mediated double-strand break repair and mismatch correction of divergent substrates. Nature 544, 377–380, doi: 10.1038/nature22046 (2017). [DOI] [PMC free article] [PubMed] [Google Scholar]
- 17.Donnianni RA et al. DNA polymerase delta synthesizes both strands during break-induced replication. Molecular Cell 76, 371–381. e374 (2019). [DOI] [PMC free article] [PubMed] [Google Scholar]
- 18.Francesconi S et al. Mutations in conserved yeast DNA primase domains impair DNA replication in vivo. Proceedings of the National Academy of Sciences 88, 3877–3881 (1991). [DOI] [PMC free article] [PubMed] [Google Scholar]
- 19.Aksenova AY & Mirkin SM At the Beginning of the End and in the Middle of the Beginning: Structure and Maintenance of Telomeric DNA Repeats and Interstitial Telomeric Sequences. Genes (Basel) 10, doi: 10.3390/genes10020118 (2019). [DOI] [PMC free article] [PubMed] [Google Scholar]
- 20.Kim N & Jinks-Robertson S. Guanine repeat-containing sequences confer transcription-dependent instability in an orientation-specific manner in yeast. DNA Repair (Amst) 10, 953–960, doi: 10.1016/j.dnarep.2011.07.002 (2011). [DOI] [PMC free article] [PubMed] [Google Scholar]
- 21.Piazza A et al. Genetic instability triggered by G-quadruplex interacting Phen-DC compounds in Saccharomyces cerevisiae. Nucleic Acids Res 38, 4337–4348, doi: 10.1093/nar/gkq136 (2010). [DOI] [PMC free article] [PubMed] [Google Scholar]
- 22.Geronimo CL & Zakian VA Getting it done at the ends: Pif1 family DNA helicases and telomeres. DNA Repair (Amst) 44, 151–158, doi: 10.1016/j.dnarep.2016.05.021 (2016). [DOI] [PMC free article] [PubMed] [Google Scholar]
- 23.Beck CR et al. Megabase Length Hypermutation Accompanies Human Structural Variation at 17p11.2. Cell 176, 1310–1324 e1310, doi: 10.1016/j.cell.2019.01.045 (2019). [DOI] [PMC free article] [PubMed] [Google Scholar]
- 24.Hu Q et al. Break-induced replication plays a prominent role in long-range repeat-mediated deletion. EMBO J 38, e101751, doi: 10.15252/embj.2019101751 (2019). [DOI] [PMC free article] [PubMed] [Google Scholar]
- 25.Li S & Wu X. Common fragile sites: protection and repair. Cell Biosci 10, 29, doi: 10.1186/s13578-020-00392-5 (2020). [DOI] [PMC free article] [PubMed] [Google Scholar]
- 26.Macheret M et al. High-resolution mapping of mitotic DNA synthesis regions and common fragile sites in the human genome through direct sequencing. Cell Res, doi: 10.1038/s41422-020-0358-x (2020). [DOI] [PMC free article] [PubMed] [Google Scholar]
- 27.Costantino L & Koshland D. Genome-wide Map of R-Loop-Induced Damage Reveals How a Subset of R-Loops Contributes to Genomic Instability. Mol Cell 71, 487–497 e483, doi: 10.1016/j.molcel.2018.06.037 (2018). [DOI] [PMC free article] [PubMed] [Google Scholar]
- 28.Minocherhomji S et al. Replication stress activates DNA repair synthesis in mitosis. Nature 528, 286–290, doi: 10.1038/nature16139 (2015). [DOI] [PubMed] [Google Scholar]
- 29.Johnston M & Davis R. Sequences that regulate the divergent GAL1-GAL10 promoter in Saccharomyces cerevisiae. Molecular and cellular biology 4, 1440–1448 (1984). [DOI] [PMC free article] [PubMed] [Google Scholar]
- 30.Deem A et al. Defective break-induced replication leads to half-crossovers in Saccharomyces cerevisiae. Genetics 179, 1845–1860 (2008). [DOI] [PMC free article] [PubMed] [Google Scholar]
- 31.Holmes AM & Haber JE Double-strand break repair in yeast requires both leading and lagging strand DNA polymerases. Cell 96, 415–424 (1999). [DOI] [PubMed] [Google Scholar]
- 32.Morawska M & Ulrich HD An expanded tool kit for the auxin-inducible degron system in budding yeast. Yeast 30, 341–351, doi: 10.1002/yea.2967 (2013). [DOI] [PMC free article] [PubMed] [Google Scholar]
- 33.Storici F & Resnick MA Delitto perfetto targeted mutagenesis in yeast with oligonucleotides. Genet Eng (N Y) 25, 189–207 (2003). [PubMed] [Google Scholar]
- 34.Griffith J, Bianchi A & de Lange T. TRF1 promotes parallel pairing of telomeric tracts in vitro. J Mol Biol 278, 79–88, doi: 10.1006/jmbi.1998.1686 (1998). [DOI] [PubMed] [Google Scholar]
- 35.Tian M & Alt FW Transcription-induced cleavage of immunoglobulin switch regions by nucleotide excision repair nucleases in vitro. J Biol Chem 275, 24163–24172, doi: 10.1074/jbc.M003343200 (2000). [DOI] [PubMed] [Google Scholar]
- 36.Yadav P et al. Topoisomerase I plays a critical role in suppressing genome instability at a highly transcribed G-quadruplex-forming sequence. PLoS Genet 10, e1004839, doi: 10.1371/journal.pgen.1004839 (2014). [DOI] [PMC free article] [PubMed] [Google Scholar]
- 37.Vaze MB et al. Recovery from checkpoint-mediated arrest after repair of a double-strand break requires Srs2 helicase. Mol Cell 10, 373–385, doi: 10.1016/s1097-2765(02)00593-2 (2002). [DOI] [PubMed] [Google Scholar]
- 38.Elango R, Kockler Z, Liu L & Malkova A. in Investigation of break-induced replication in yeast. Methods in enzymology Vol. 601, 161–203 (Elsevier, 2018). [DOI] [PubMed] [Google Scholar]
- 39.Deem A et al. Break-induced replication is highly inaccurate. PLoS Biol 9, e1000594, doi: 10.1371/journal.pbio.1000594 (2011). [DOI] [PMC free article] [PubMed] [Google Scholar]
- 40.Sakofsky CJ et al. Translesion Polymerases Drive Microhomology-Mediated Break-Induced Replication Leading to Complex Chromosomal Rearrangements. Mol Cell 60, 860–872, doi: 10.1016/j.molcel.2015.10.041 (2015). [DOI] [PMC free article] [PubMed] [Google Scholar]
- 41.Elango R et al. Repair of base damage within break-induced replication intermediates promotes kataegis associated with chromosome rearrangements. Nucleic Acids Res 47, 9666–9684, doi: 10.1093/nar/gkz651 (2019). [DOI] [PMC free article] [PubMed] [Google Scholar]
- 42.Chung WH, Zhu Z, Papusha A, Malkova A & Ira G. Defective resection at DNA double-strand breaks leads to de novo telomere formation and enhances gene targeting. PLoS Genet 6, e1000948, doi: 10.1371/journal.pgen.1000948 (2010). [DOI] [PMC free article] [PubMed] [Google Scholar]
- 43.Batrakou DG, Heron ED & Nieduszynski CA Rapid high-resolution measurement of DNA replication timing by droplet digital PCR. Nucleic acids research 46, e112-e112 (2018). [DOI] [PMC free article] [PubMed] [Google Scholar]
- 44.Chen S, Zhou Y, Chen Y & Gu J fastp: an ultra-fast all-in-one FASTQ preprocessor Bioinformatics 34, i884-i890 (2018). [DOI] [PMC free article] [PubMed] [Google Scholar]
- 45.Langmead B & Salzberg SL Fast gapped-read alignment with Bowtie 2. Nat Methods 9, 357–359, doi: 10.1038/nmeth.1923 (2012). [DOI] [PMC free article] [PubMed] [Google Scholar]
- 46.Li H et al. The Sequence Alignment/Map format and SAMtools. Bioinformatics 25, 2078–2079, doi: 10.1093/bioinformatics/btp352 (2009). [DOI] [PMC free article] [PubMed] [Google Scholar]
- 47.Zhang Y et al. Model-based analysis of ChIP-Seq (MACS). Genome Biol 9, R137, doi: 10.1186/gb-2008-9-9-r137 (2008). [DOI] [PMC free article] [PubMed] [Google Scholar]
Associated Data
This section collects any data citations, data availability statements, or supplementary materials included in this article.


