Abstract
Ki67, a nuclear proliferation-related protein, is heavily used in anatomic pathology but has not become a companion diagnostic or a standard-of-care biomarker due to analytic variability in both assay protocols and interpretation. The International Ki67 Working Group in breast cancer has published and has ongoing efforts in the standardization of the interpretation of Ki67, but they have not yet assessed technical issues of assay production representing multiple sources of variation, including antibody clones, antibody formats, staining platforms, and operators. The goal of this work is to address these issues with a new standardization tool. We have developed a cell line microarray system in which mixes of human Karpas 299 or Jurkat cells (Ki67+) with Sf9 (Spodoptera frugiperda) (Ki67−) cells are present in incremental standardized ratios. To validate the tool, six different antibodies, including both ready-to-use and concentrate formats from six vendors, were used to measure Ki67 proliferation indices using IHC protocols for manual (bench-top) and automated platforms. The assays were performed by three different laboratories at Yale and analysed using two image analysis software packages, including QuPath and Visiopharm. Results showed statistically significant differences in Ki67 reactivity between each antibody clone. However, subsets of Ki67 assays using three clones performed in three different labs show no significant differences. This work shows the need for analytic standardization of the Ki67 assay and provides a new tool to do so. We show here how a cell line standardization system can be used to normalize the staining variability in proliferation indices between different antibody clones in a triple negative breast cancer cohort. We believe that this cell line standardization array has the potential to improve reproducibility among Ki67 assays and laboratories, which is critical for establishing Ki67 as a standard-of-care assay.
Introduction
Ki67 is a nuclear protein antigen that is expressed in all mammalian cells during all phases of the cell cycle, but it is strongly downregulated in the G0 phase (1). This characteristic has made Ki67 a critical biomarker for assessing proliferation in clinical specimens (2, 3). Ki67 proliferative index (PI) is defined as the percentage of positively stained cells within the total number of malignant cells (3) and is an extensively characterized biomarker of breast cancer prognosis (4-6). The Ki67 proliferative index has been shown to be both a predictive and prognostic biomarker in patients with breast cancer in clinical practice (7, 8). Many studies have indicated that a high Ki67 PI is positively correlated with a pathological complete response (pCR) to chemotherapy (9, 10). Yerushalmi et al. also showed that Ki67 index is of significant prognostic factor for disease-free and overall survival (11). However, threshold values for stratifying high and low Ki67 risk groups are not clearly defined and vary between laboratories, ranging from 10% to 50% (12). The cut-off value declared at the St Gallen Consensus Meeting distinguishing between luminal A and luminal B breast cancer subtypes was 14% (13) , while the cut-off suggested for high Ki67 labeling index (LI) conducted on a BIG-1-98 cohort was 11% (6). On the other hand, Tan et al. reported that 30% was a significant cut-off for Ki67 positive expression in predicting pCR (14). These varying Ki67 cut-off values indicate the difficulty in setting a specific Ki67 cut-off for routine use as a standard-of-care biomarker with clinical utility. As a consequence, the Tumor Marker Guidelines Committee of American Society of Clinical Oncology states that there is not enough evidence to support the routine use of Ki67 as a prognostic biomarker in breast cancer diagnosis (15).
Another key limitation of Ki67 as a biomarker is the lack of interlaboratory reproducibility in Ki67 measurements due to multiple sources of variations, including antibody clones, antibody formats, staining methods, testing personnel, and staining platforms. Several studies have compared the staining of various Ki67 antibody clones using different autostainer platforms (16, 17). Significant variations among antibody, format, and stainer platform combinations were reported. We also found in our study that the proliferation index indicated by different antibodies, even within a single lab, is subject to substantial variation. The method of analysis also leads to substantial variation between institutions. The range of analytic variables and assay performance show the need for standardization of a Ki67 measurement system for the determination of proliferative index.
Here, we developed a Ki67 standardization cell line microarray (CMA) system using a mixture of human Karpas 299 or Jurkat cells (Ki67+) with insect Sf9 (Ki67−) cells in defined incremental ratios ranging from 0% to 100%. Sf9 cells, derived from the “fall armyworm”, are sufficiently evolutionarily far from humans that common human antibodies do not react with Sf9 Ki67. Our goal was to provide a system to assess the sensitivity and reproducibility of Ki67 assays that provides a linear, inexhaustible standard that is easy to use by both high and low resourced institutions and shows very high accuracy and reproducibility. Such a tool may be useful as a standardization control for Ki67 assays when measuring proliferative indices in human tissues in real-world clinical settings. We describe the development of a cell line microarray (CMA), validate it in multiple labs with multiple antibodies, and show how its use standardizes antibodies to reveal the prognostic value of Ki67 in a triple negative breast cancer (TNBC) cohort.
Materials and methods
Cell line microarray (CMA)
Karpas 299, Jurkat and Sf9 cell lines were purchased from the American Type Culture Collection (ATCC, VA, USA). Karpas 299 cells were grown in Dulbecco’s Modified Eagle’s Medium (Thermo Fisher Scientific), Jurkat cells were grown in RPMI 1640 Medium (Thermo Fisher Scientific) with 10% Fetal bovine serum (Thermo Fisher Scientific) at 37 °C with 5% CO2 and Sf9 cells were grown in Grace's Insect Medium Supplemented (GIBCO/Invitrogen) at 27 °C without CO2. Two Ki67 CMAs from Array Science (Sausalito, CA, USA) representing Karpas 299 + Sf9 cells and Jurkat + Sf9 cells blocks were tested to compare the staining performance between labs and different antibody clones. Prior to mixing, the cell populations were counted in triplicate using a hemocytomer and digital-image based cell counter (Corning). One microarray was constructed to contain cores with ratios of Karpas 299 to Sf9 cells, including: 30%, 20%, 10%, 5% and 0%. A CMA of Sf9+Karpas 299 was constructed as a pilot version to test the practical application of the standardization array while Sf9+Jurkat CMA was constructed Karpas was found to be less than 100% Ki67 positive. It is more likely that the Karpas version will be commercialized. The second microarray contained cores with ratios of Jurkat to Sf9 cells, including: 100%, 30%, 20%, 10%, 5% and 0%. Each core was represented in triplicate on both CMAs. Data from both CMAs are included in this work.
Patient cohort and tissue microarray (TMA)
Formalin-fixed, Paraffin-embedded (FFPE) tumor specimens (N = 107) represented in a tissue microarray (TMA) with TNBC were analyzed in this study. Yale TMA (YTMA-341) contains the tissue specimens from 107 patients with tumors resected between 2000 and 2012 and comprehensive annotation. Table 1 shows the clinicopathologic characteristics of the patients included in YTMA-341. All tissue samples were collected with the approval from the Yale Human Investigation Committee protocol #9505008219. Written informed consent, or in some cases waiver of consent, was obtained from all patients with the approval of the Yale Human Investigation Committee.
Table 1.
Details of antibody clones, format, staining platforms used and their recommended concentrations for IHC protocol.
| Antibody Clone | Format | Staining Platform | Recommended Concentrations |
|---|---|---|---|
| 30-9 | Ready-to-Use | Manual, Leica Bond autostainer, Ventana autostainer | |
| MIB1 | Concentrate | Manual, Leica Bond autostainer | 1:75-1:150 (1:100 was used) |
| MM1 | Concentrate | Manual, Leica Bond autostainer | (1:200) |
| SP6 | Concentrate | Manual, Leica Bond autostainer | (1:200) |
| 8D5 | Concentrate | Manual, Leica Bond autostainer | (1:400) |
| 1297A | Concentrate | Manual, Leica Bond autostainer | 3-15 μg/mL (3μg/1:33 was used) |
Antibodies and immunohistochemistry (IHC)
Six commercially available Ki67 antibody clones in either concentrate (conc) or ready-to-use (RTU) formats, including MIB-1; conc (Dako), MM1; conc (Leica), SP6; conc (Thermofisher Scientific), 8D5; conc (Cell Signaling Technology), 1297A; conc (Novus Biologicals Inc.) and 30-9; RTU (Ventana) were tested. A Ki67 IHC manual staining protocol was performed as previously described (18). Briefly, using a bench-top protocol, the paraffin-embedded CMA and TMA slides were first deparaffinized, the Ki67 antigens were retrieved in a PT module using citrate buffer (pH 6.0) and the slides were incubated with six monoclonal Ki67 antibodies at their recommended concentrations prior to incubating in hematoxylin and DAB to detect IHC reactivity. IHC assays using the six antibodies at their recommended dilutions were performed by Lab 1 using IHC protocols for manual bench-top staining. DAB staining of five Ki67 clones, MIB-1, MM1, 8D5, SP6 and 30-9, was performed by all three labs using IHC protocols for manual bench-top and Leica Bond autostainer (Leica, UK). Details of the antibodies and their recommended concentrations by the vendors are shown in Table 2. Lab 1 performed antibody optimization by titrating across a 2-log concentration range. The optimal titer was determined by calculating signal-to-noise ratio of five different concentrations tested for five different antibodies as previously described (19, 20). The optimal concentration was often, but not always, near the vendor-recommended concentration (Supplementary Fig. 1). The staining of TNBC cohort YTMA-341 in parallel with the standardization array was performed using the optimal concentrations of MIB-1 and 1297A clones.
Table 2.
Clinicopathological characteristics of TNBC cohort YTMA-341
| Characteristic | Categories | N (%) | Total (%) |
|---|---|---|---|
| Age | 54 (29-84) | 37 (24.5) | |
| Stage | I | 43 (28.5) | 118 (78.1) |
| II | 57 (37.7) | ||
| III | 14 (9.3) | ||
| IV | 4 (2.6) | ||
| Neoadjuvant chemotherapy | Yes | 9 (6.0) | 126 (83.5) |
| No | 117 (77.5) | ||
| Surgery | Yes | 133 (88.1) | 134 (88.8) |
| No | 1 (0.7) | ||
| Adjuvant chemotherapy | Yes | 82 (54.3) | 109 (72.2) |
| No | 27 (17.9) | ||
| Postsurgical radiotherapy | Yes | 65 (43.0) | 111 (73.5) |
| No | 46 (30.5) | ||
| Disease recurrence | Yes | 27 (17.9) | 119 (78.8) |
| No | 92 60.9) | ||
| Death (all cause) | Yes | 43 (28.5) | 137 (90.8) |
| No | 94 (62.3) |
Digital bioimage analysis (DIA) on Ki67 IHC images
The Aperio ScanScope XT platform (Leica Biosystems, Wetzlar, Germany) slide scanner was used at ×20 to digitize the slides. Two DIA platforms QuPath (open-source software (21)) and Visiopharm (Visiopharm Integrator System, Hoersholm, Denmark) were used to assess the percentage of Ki67 positive cells on the stained slides. After setting the optimal color deconvolution, nucleus DAB optical density (OD) mean of DAB positive cells were detected using positive cell detection with thresholds of 1+, 2+ and 3+ to detect varying intensities of Ki67 positive cells in the QuPath DIA platform. The Visiopharm DIA platform segments Ki67 negative nuclei from total nuclei count where positive fraction can be separated. The total Ki67 positive fraction is then calculated by subtracting count negative nuclei from count total nuclei. Ki67 proliferation indices (PIs) on both DIA platforms were calculated as (positive nuclei/total nuclei) ×100.
Statistical analysis
Statistical analyses were performed using GraphPad Prism 8.3.1 (GraphPad Software Inc., CA, USA) and R. studio 1.2.5033 (Inc., Boston, MA). One-way ANOVA was performed to compare two or more groups. Post hoc Bonferroni’s multiple comparisons test was performed when ANOVA results were significant. The cut-point for MIB-1 staining in the TNBC cohort was determined using X-tile cut-point finder (22). Kaplan-Meier plots were generated using survival and survminer R packages. Statistical significance was represented as (*) P < 0.05 or ns (not significant). All data are shown as mean ± standard deviation (SD). The reproducibility between different blocks and analyses done by two DIA platforms was estimated using Coefficient of Determination (R2) in R. studio.
Results
Performance of staining using CMA between different antibodies and laboratories
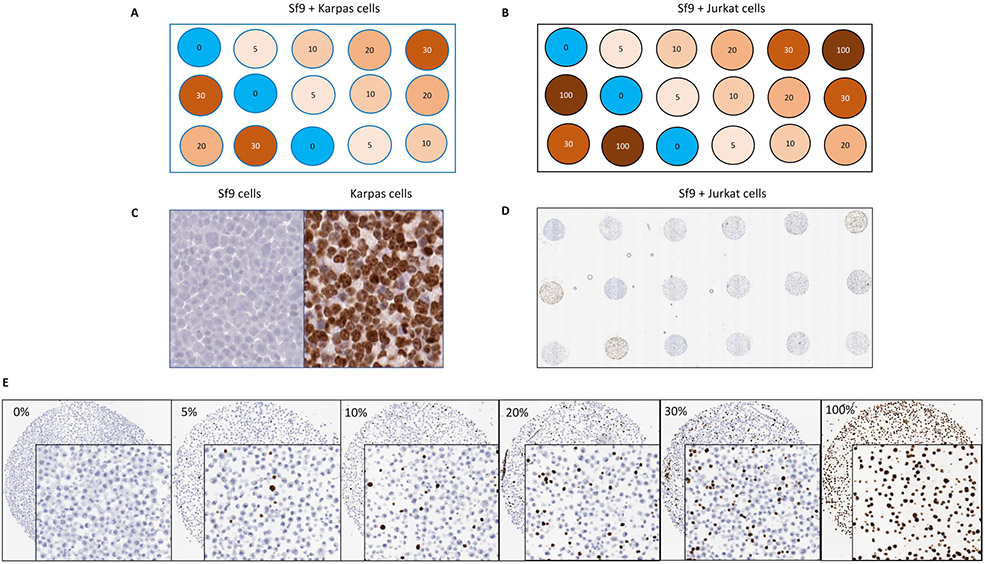
A Ki67 standardization cell line microarray system was developed in this study by mixing human Karpas 299 or Jurkat cells (Ki67+) with Sf9 (Ki67−) cells in defined incremental ratios. The purpose of developing a microarray with defined concentrations Ki67 positive cells was to assess the technical sensitivity and linearity of Ki67 assays, not the interpretation or reading. A schematic diagram of the Karpas 299 CMA with ratios from 0-30% and Jurkat CMA with ratios from 0-100% is shown in Fig. 1a and 1b. The distribution of Karpas 299 or Jurkat cells expressing Ki67 in an incremental ratio was subject to ultimately standardize the dynamic ranges of Ki67 positivity in human tissue samples and the placement of three technical replicates within CMA was to account for variation in measuring the uneven staining of the experiments. The lack of antibody cross reactivity was demonstrated between insect and human Ki67, which results in the absence of Ki67 visualization in Sf9 cells (Fig. 1c). By contrast, there is nearly 80% Ki67 expression in Karpas 299 cells. Fig. 1d is a low power image of the Sf9 + Jurkat cell array stained with MIB-1, and Fig. 1e is a higher magnification composite image of representative cores from the same Sf9 + Jurkat cell array with progressively higher Ki67 reactivity with increased concentration of Jurkat cells.
Fig. 1.
Ki67 index CMA. (a) Schematic proposed map indicating the percentage of Ki67 positivity in Sf9 + Karpas 299 cells index CMA. (b) Schematic proposed map indicating the percentage of Ki67 positivity in Sf9 + Jurkat cells index CMA. (c) Lack of antibody cross reactivity between insect and human Ki67. (d) Low power image of the Sf9 + Jurkat cell array stained with MIB-1. (e) Higher magnification image of representative cores from the same Sf9 + Jurkat cell array with progressively higher Ki67 reactivity with increased concentration of Ki67+ Jurkat cells.
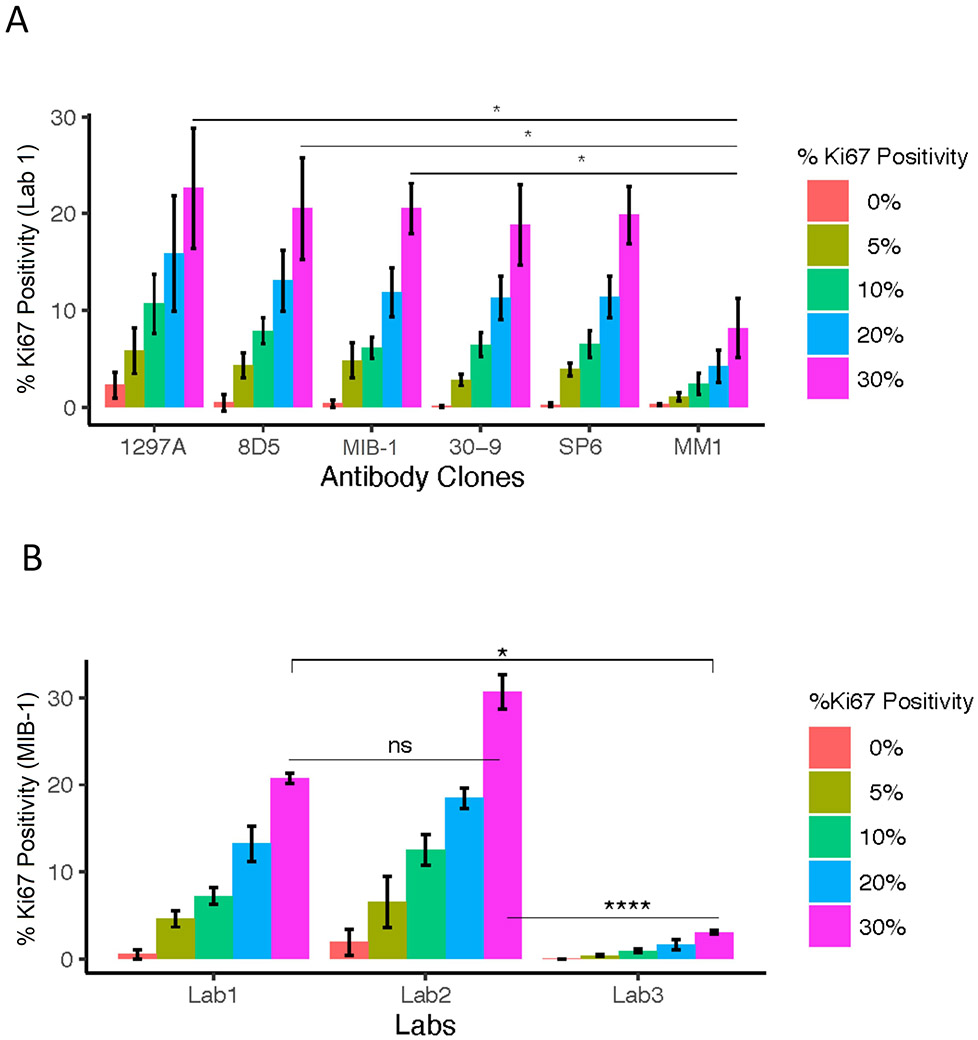
We then tested the sensitivity of the Sf9 + Karpas 299 CMA construction using both for manual (bench-top) and automated platforms (Fig. 2a). We found the sensitivity depended on which antibody was used for the analysis. At the vendor recommended concentrations of all antibodies, using the 30% concentration of Karpas 299 cores within the standardization array, the 1297A clone stained by Lab 1 showed ~29%, 8D5 clone showed ~27%, MIB-1, 30-9 and SP6 clones showed ~25% respectively, whereas MM1 clone showed only 11%. Next, we tried to determine if this variability was a function of the antibody selection or of the lab in which it was performed. The comparison of the staining of MIB-1 by using the Ki67 standardization array is shown in Fig. 2b. Although the Ki67 PIs detected by Lab 1 and Lab 2 are not significantly different, the comparison between either Lab 1 and Lab 3 (P < 0.05*) or Lab 2 and Lab 3 (P < 0.0001****) is significantly different. The demonstration of staining variability among the three Labs using a Sf9 + Karpas 299 CMA standardization array indicates that staining by different operators is one source of variability. The largest variance was seen in the 1297A clone which showed high background staining.
Fig. 2.
Comparison of antibody performance between six clones and staining performance between three different labs using three antibody clones at Yale University. (a) Staining performance of six clones at their recommended concentrations on Ki67 index CMA. (b) Staining performance of three different operators using MIB-1 clone at their recommended concentrations on Ki67 index CMA. One-way ANOVA was performed to compare the performance in pairwise. Statistically significant results were represented as (*)P < 0.05 or (**)P < 0.01 or (***)P < 0.001 or (****)P < 0.0001; ns (not significant) or ns (not significant). All data were shown as mean ± standard deviation (SD).
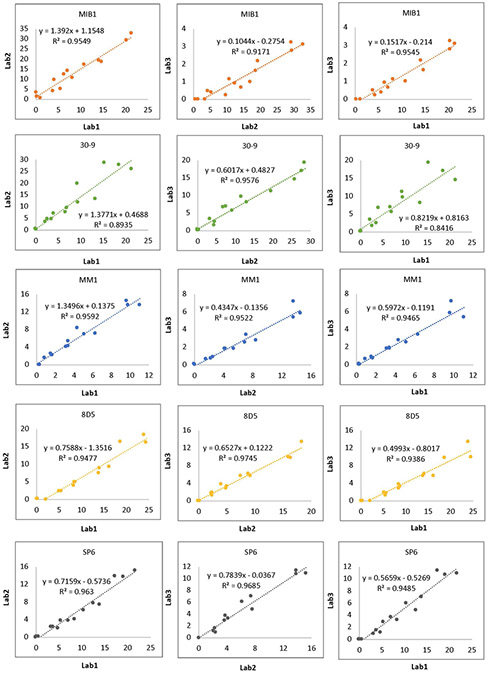
The inter-operator concordance of the Ki67 reactivity between three labs was estimated using pairwise comparative analysis of the performance of each antibody, including the slope and coefficient of determination (R2), and is depicted on each pairwise comparison for 5 different antibodies (Fig. 3). Note that regression as measured by R2 was quite good for each pair (mostly above 0.9), but that the slope of the regression lines is highly variable which reflects the differences in sensitivity of the staining reactions and subsequent effects on the accuracy of the PI. While the highs are generally high, and lows are generally low for each antibody for each lab, these findings could explain why “by eye” examinations of Ki67 assays can appear acceptable, but actually be highly variable.
Fig. 3.
Staining performance of five clones at their recommended concentrations on Ki67 index CMA. To determine the concordance of the staining by different operators, pairwise comparative analysis of each antibody performance stained by each lab was performed and coefficient of determination (R2) and the equation of the line, including the slope, were depicted on each pairwise comparison.
To fulfill the vision of this CMA being used as a standardization tool within and between labs, it must be shown that production lots of the tool are essentially identical. To test the block to block reproducibility, we stained slides from the two different blocks that were produced at different times by the vendor (Array Science) using the same Ki67 clones and concentrations. Using two well behaved Ki67 assays, Fig. 4a shows that the concordance of the Ki67 standardization arrays produced by Array Science was high with coefficients of determination (R2) value 0.97 for 8D5 clone and 0.94 for SP6 clone.
Fig. 4.
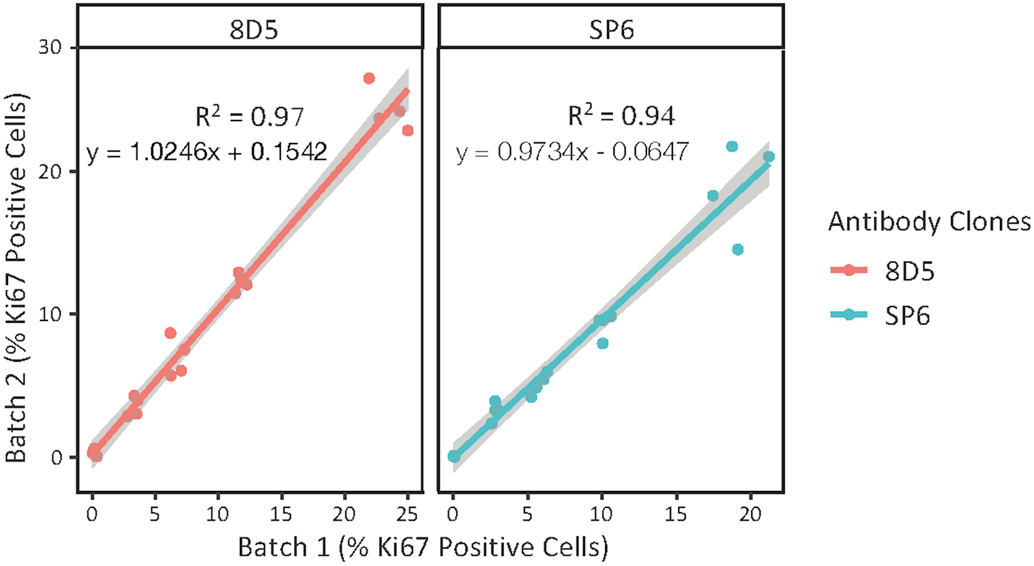
Identification of the concordance of the index array between two different blocks produced at different times showing the coefficient of determination (R2), the slopes and intercepts for clones 8D5 and SP6 with 95% confidence intervals shown in the gray areas of each plot. The staining was performed by Lab 1 using manual protocol.
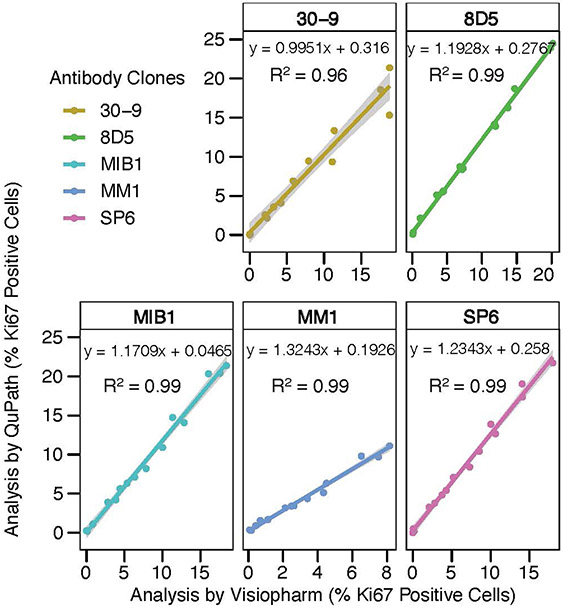
To investigate whether the stained Ki67 standardization array slides can be read equivalently by multiple image analysis software packages, we analyzed the Ki67 PIs using the QuPath open source software and the commercially available Visiopharm image analysis package. Our results indicate that the two DIA platforms perform essentially identically in detecting Ki67 PIs with a coefficient of determination (R2) value of 0.99 for 8D5, MIB-1, MM1 and SP6 concentrated clones and 0.96 for 30-9 RTU clone (Fig. 5). This indicates that calculating Ki67 PIs using the Ki67 standardization array is software independent. However, we noted that the detection of percent of Ki67 positive cells was slightly lower using the Visiopharm DIA platform. Accessing the reading modality of Ki67 positivity by different DIA platforms using multiple antibody clones as well as staining methods might provide the differences in detection of % positive cells.
Fig. 5.
The concordance of data analyses using two different DIA platforms. Coefficient of determination (R2), the slopes and intercepts were displayed for the comparison of each clone analyzed by both DIA platforms (QuPath and Visiopharm). The staining was performed by Lab 1 using manual protocol.
Functional application of the Ki67 CMA
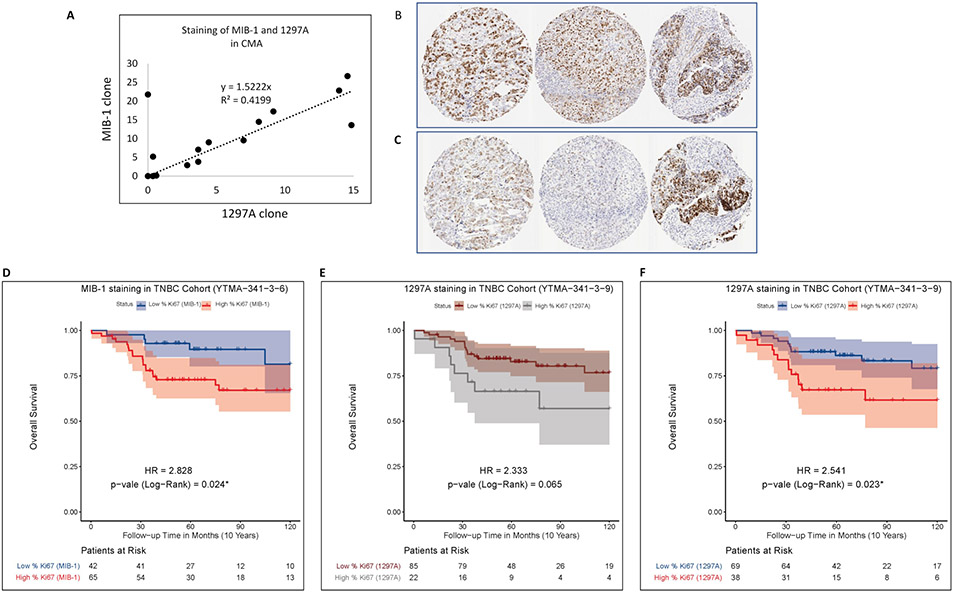
Finally, to demonstrate the functional application of the Ki67 standardization, we stained index array slides in parallel with human TNBC tissues (YTMA-341) using two different antibodies: MIB-1 and 1297A. We then normalized Ki67 staining intensities between assays using the CMA as a standardization tool. Since the standardization array is entirely cell line based, the purpose of parallel staining is to demonstrate how the staining of two different antibodies varies in the context of actual tumors with tumor stroma and adjacent normal tissue and how the CMA can be used to normalize the signal between the two antibodies. The PIs of the TNBC array stained by MIB-1 is higher than that of the TNBC array stained by 1297A. Low resolution digital images of staining comparison between MIB-1 and 1297A are shown in Supplementary Fig. 2. With the cut-point of 13 that stratifies Ki67 low and high, high MIB-1 expression shows significant association with worse survival in the TNBC cohort (HR = 2.8, P = 0.024*) (Fig. 6d). Using the same cut-point in the staining of TNBC cohort with 1297A shows a non-significant association (HR = 2.3, P = 0.07) (Fig. 6e). The CMA staining with 1297A was then normalized to the CMA staining of MIB-1, and the normalization factor of 1297A clone (y = 1.5222x) from the index array was applied to the TNBC cohort (Fig. 6a). The normalized result is illustrated in the survival curves showing Ki67 expression as visualized by 1297A. Now high expression (>13) in the TNBC cohort is significantly associated with the poor survival (HR = 2.5, P = 0.023*) (Fig. 6f). This assessment illustrates the value of a Ki67 standardization system to normalize the staining between different antibody clones. A similar normalization may be envisioned between laboratories in the future.
Fig. 6.
Parallel staining of CMA and TNBC-TMA (YTMA-341) using MIB-1 and 1297A. (a) Normalization of the staining variability between MIB-1 and 1297A. (b) Representative images of YTMA-341 cores stained by MIB-1 and (c) 1297A. (d) Overall survival of TNBC cohort according to the staining of MIB-1 with cut-point =13.05. (e) and (f) Overall survival of TNBC cohort according to the staining of 1297A with cut-point =13.05 before normalization (c) and after normalization (d).
Discussion
The use of nuclear Ki67 proliferative indices is increasingly recognized as a valuable predictive and prognostic marker in breast cancer (9, 23). Yet the lack of standardization or uniformity in the technical performance or interpretation of the Ki67 IHC assay has led to highly variable results, to which we attribute its lack of broad adoption as either standard-of-care or an FDA approved companion diagnostic test (24). Here, we have focused on the technical aspects of the Ki67 assay and described a new tool for standardization with hope that it may improve the reproducibility of proliferative index determinations. We tested our Ki67 standardization array system using various commercially available Ki67 antibody clones in three different labs at Yale and identified differences in the performance of technical personnel, antibody clones, and DIA analysis. Consistent with the results of Røge et al., our findings indicate that clone 30-9 in RTU format provides the highest PIs on the standardization array, whereas clone MM1 in concentrated format gives a statistically significantly lower PI score among the six clones tested (16). We also observed that staining of the cell line microarray with the 1297A clone gives the highest background staining. The optimized concentration of MM1 clone (1:25 dilution) stained approximately 15% of cells at 30% Karpas 299 cores (Supplementary Fig. 1). Ki67 PI is measured using the MIB-1 clone more often than other clones on paraffin embedded tissue sections (11) and it was shown that MIB-1 staining gives 3.3% higher PI than the mean core PI as compared to the staining of SP6 and MM1 clones on Leica Bond autostainer platform (16). Although we consistently observed that PI scores for widely used clones MIB-1 and SP6 were significantly higher than MM1 clone among 30% Karpas 299 cores, the MIB-1 clone stained approximately 4% positive cells in the 100% Sf9 cores where there should be no Ki67 positive cells present, indicating high background staining with this widely used antibody clone. These observations, as well as those of many others, show the need for a standardization tool for the technical aspects of the assessment of Ki67.
To illustrate the technical application of the Ki67 standardization array as a tool for calibration of staining performance to enabling the use of a common cut-point for Ki67 for clinical trials and diagnostic assays, we showed the comparison of two antibodies on a single TNBC cohort. We assessed the effectiveness of the standardization array for normalization of proliferative indices between clones MIB-1 and 1297A on TMA slides. The staining of MIB-1, in both the standardization array and the TNBC cohort array, shows a higher PI than that of 1297A. The difference in the staining patterns of these two clones prevents the determination of a single cut-point in stratification of Ki67 low and high groups in the TNBC cohort. We show that the cut-point of 13, where high MIB-1 is significantly associated with worse survival shows no significant survival difference in the same cohort with 1297A. After normalization using standardization array we observed an increase in 1297A PIs (22 vs 38 patients in the high category) (Figs. 6e, 6f), which created a significant association of high Ki67 expression, now assessed by 1297A, with worse survival. This application demonstrates the value of a standardization system for different antibody clones but could be also used for different labs or different operators.
There are a number of limitations to this study. First, and perhaps most significant, is that this work does not address the interpretation/reading of the assay. It has been shown many times, perhaps most comprehensively by Polley et al (3, 25), that the reading of Ki67 assays is a significant source of variability. The International Working Group for Ki67 in Breast Cancer has been working on this for 10 years and their work will be summarized in an upcoming publication. Since the interpretation issue is being addressed by that group (of which some of these authors are participants), the issue of interpretation is not considered here. A second limitation of this work is that all the experiments in this study were conducted by three labs within one institution. While these results already show a glimpse of technical variability, the topic would be better addressed with a prospective, statistically powered multi-institutional study. Such a study is in the planning stages. In future work, we plan to assess the ability of multiple labs with various image analysis platforms (or perhaps even by eye) to standardize their “systems” before reading a series of unknown test Ki67 slides (where “system” is defined as the antibody, the autostainer and the reading modality). Finally, we note that we have not addressed the counterstain issue. Given the fact that over-calling of Ki67 PIs can occur when nuclear counterstaining is weak (3), it is possible that counterstaining should also be considered in the use of a standardization tool. However, we feel that the degree of counterstaining is more likely to affect interpretation, and we will address this issue in the future when we are testing the tool in a real-world setting.
In summary, we have developed a Ki67 standardization tool by mixing highly positive cells into non-reactive insect cell populations at defined ratios. We have validated the reproducibility of the Ki67 standardization array by comparing proliferative index values between independently constructed arrays, as stained by various antibodies and analyzed on different DIA platforms. This indicates that a Ki67 standardization array constructed by mixing Sf9 and Karpas 299 or Jurkat cell lines can be used as part of a quality control system for the technical aspects of the Ki67 IHC assay. In future studies, we plan to evaluate the use of Ki67 control arrays to standardize the whole technical Ki67 system within multiple institutions and then to determine PI concordance in a prospectively designed, multi-institutional setting using different assays with different IHC protocols, stainer platforms and DIA platforms of choice.
Supplementary Material
Acknowledgements
We would like to thank Lori Charette, Amos Brooks and the team at the Yale Pathology Tissue Service and Developmental Histology Facility for production of the high-quality tissue sections and IHC staining.
Funding
This work was supported by the Breast Cancer Research Foundation (DLR).
Footnotes
Conflict of interest
David L. Rimm has served as an advisor for Astra Zeneca, Agendia, Amgen, BMS, Cell Signaling Technology, Cepheid, Daiichi Sankyo, Novartis, GSK, Konica Minolta, Merck, NanoString, PAIGE.AI, Perkin Elmer, Roche, Sanofi, Ventana and Ultivue. Amgen, Cepheid, Konica Minolta, NavigateBP, NextCure, and Lilly, and fund research in his lab.
Contributor Information
Thazin Nwe Aung, Department of Pathology, Yale University School of Medicine, New Haven, CT, USA.
Balazs Acs, Department of Oncology and Pathology, CCK, Karolinska Institutet, R8:04, 17176, Stockholm, Sweden.; Department of Clinical Pathology and Cytology, Karolinska University Laboratory, Stockholm, Sweden..
Jonathan Warrell, Department of Molecular Biophysics and Biochemistry, Program in Computational Biology and Bioinformatics, Yale University, New Haven, USA.
Yalai Bai, Department of Pathology, Yale University School of Medicine, New Haven, CT, USA.
Patricia Gaule, Department of Pathology, Yale University School of Medicine, New Haven, CT, USA.
Sandra Martinez-Morilla, Department of Pathology, Yale University School of Medicine, New Haven, CT, USA.
Ioannis Vathiotis, Department of Pathology, Yale University School of Medicine, New Haven, CT, USA.
Saba Shafi, Department of Pathology, Yale University School of Medicine, New Haven, CT, USA.
Myrto Moutafi, Department of Pathology, Yale University School of Medicine, New Haven, CT, USA.
Mark Gerstein, Department of Molecular Biophysics and Biochemistry, Program in Computational Biology and Bioinformatics, Yale University, New Haven, USA.
Benjamin Freiberg, Visiopharm Corp, Westminster, CO, USA.
Regan Fulton, Array Science, LLC, Sausalito, CA, USA.
David L Rimm, Department of Pathology, Yale University School of Medicine, New Haven, CT, USA.
References
- 1.Gerdes J, Lemke H, Baisch H, Wacker H-H, Schwab U, Stein H. Cell cycle analysis of a cell proliferation-associated human nuclear antigen defined by the monoclonal antibody Ki-67. The journal of immunology. 1984;133(4):1710–5. [PubMed] [Google Scholar]
- 2.Gerdes J, Stein H, Pileri S, Rivano M, Gobbi M, Ralfkiaer E, et al. Prognostic relevance of tumour-cell growth fraction in malignant non-Hodgkin's lymphomas. The Lancet. 1987;330(8556):448–9. [DOI] [PubMed] [Google Scholar]
- 3.Dowsett M, Nielsen TO, A’Hern R, Bartlett J, Coombes RC, Cuzick J, et al. Assessment of Ki67 in breast cancer: recommendations from the International Ki67 in Breast Cancer working group. J Natl Cancer Inst. 2011;103(22):1656–64. [DOI] [PMC free article] [PubMed] [Google Scholar]
- 4.Mandard AM, Denoux Y, Herlin P, Duigou F, van de Vijver MJ, Clahsen PC, et al. Prognostic value of DNA cytometry in 281 premenopausal patients with lymph node negative breast carcinoma randomized in a control trial: multivariate analysis with Ki-67 index, mitotic count, and microvessel density. Cancer. 2000;89(8):1748–57. [DOI] [PubMed] [Google Scholar]
- 5.Clahsen P, Van de Velde C, Duval C, Pallud C, Mandard A-M, Delobelle-Deroide A, et al. The utility of mitotic index, oestrogen receptor and Ki-67 measurements in the creation of novel prognostic indices fornode-negative breast cancer. Eur J Surg Oncol. 1999;25(4):356–63. [DOI] [PubMed] [Google Scholar]
- 6.Viale G, Giobbie-Hurder A, Regan MM, Coates AS, Mastropasqua MG, Dell'Orto P, et al. Prognostic and predictive value of centrally reviewed Ki-67 labeling index in postmenopausal women with endocrine-responsive breast cancer: results from Breast International Group Trial 1-98 comparing adjuvant tamoxifen with letrozole. J Clin Oncol. 2008;26(34):5569. [DOI] [PMC free article] [PubMed] [Google Scholar]
- 7.Sahin AA, Ro JY, El-Naggar AK, Ordonez NG, Ayala AG, Ro J, et al. Ki-67 immunostaining in node-negative stage I/II breast carcinoma. Significant correlation with prognosis. Cancer. 1991;68(3):549–57. [DOI] [PubMed] [Google Scholar]
- 8.Domagala W, Markiewski M, Harezga B, Dukowicz A, Osborn M. Prognostic significance of tumor cell proliferation rate as determined by the MIB-1 antibody in breast carcinoma: its relationship with vimentin and p53 protein. Clin Cancer Res. 1996;2(1):147–54. [PubMed] [Google Scholar]
- 9.Brown JR, DiGiovanna MP, Killelea B, Lannin DR, Rimm DL. Quantitative assessment Ki-67 score for prediction of response to neoadjuvant chemotherapy in breast cancer. Lab Invest. 2014;94(1):98–106. [DOI] [PubMed] [Google Scholar]
- 10.Fasching PA, Heusinger K, Haeberle L, Niklos M, Hein A, Bayer CM, et al. Ki67, chemotherapy response, and prognosis in breast cancer patients receiving neoadjuvant treatment. BMC Cancer. 2011;11(1):486. [DOI] [PMC free article] [PubMed] [Google Scholar]
- 11.Yerushalmi R, Woods R, Ravdin PM, Hayes MM, Gelmon KA. Ki67 in breast cancer: prognostic and predictive potential. The lancet oncology. 2010;11(2):174–83. [DOI] [PubMed] [Google Scholar]
- 12.Hsu DW, Louis DN, Efird JT, Hedley-Whyte ET. Use of MIB-1 (Ki-67) immunoreactivity in differentiating grade II and grade III gliomas. J Neuropathol Exp Neurol. 1997;56(8):857–65. [DOI] [PubMed] [Google Scholar]
- 13.Goldhirsch A, Wood WC, Coates AS, Gelber RD, Thürlimann B, Senn H-J, et al. Strategies for subtypes—dealing with the diversity of breast cancer: highlights of the St Gallen International Expert Consensus on the Primary Therapy of Early Breast Cancer 2011. Ann Oncol. 2011;22(8):1736–47. [DOI] [PMC free article] [PubMed] [Google Scholar]
- 14.Tan Q-X, Qin Q-H, Yang W-P, Mo Q-G, Wei C-Y. Prognostic value of Ki67 expression in HR-negative breast cancer before and after neoadjuvant chemotherapy. Int J Clin Exp Pathol. 2014;7(10):6862. [PMC free article] [PubMed] [Google Scholar]
- 15.Harris L, Fritsche H, Mennel R, Norton L, Ravdin P, Taube S, et al. American Society of Clinical Oncology 2007 update of recommendations for the use of tumor markers in breast cancer. J Clin Oncol. 2007;25(33):5287–312. [DOI] [PubMed] [Google Scholar]
- 16.Røge R, Nielsen S, Riber-Hansen R, Vyberg M. Impact of Primary Antibody Clone, Format, and Stainer Platform on Ki67 Proliferation Indices in Breast Carcinomas. Appl Immunohistochem Mol Morphol. 2019;27(10):732–9. [DOI] [PubMed] [Google Scholar]
- 17.Vörös A, Csörgő E, Kővári B, Lázár P, Kelemen G, Rusz O, et al. Different methods of pretreatment Ki-67 labeling index evaluation in core biopsies of breast cancer patients treated with neoadjuvant chemotherapy and their relation to response to therapy. Pathology & Oncology Research. 2015;21(1):147–55. [DOI] [PubMed] [Google Scholar]
- 18.Acs B, Pelekanou V, Bai Y, Martinez-Morilla S, Toki M, Leung SC, et al. Ki67 reproducibility using digital image analysis: an inter-platform and inter-operator study. Lab Invest. 2019;99(1):107–17. [DOI] [PubMed] [Google Scholar]
- 19.Gustavson MD, Rimm DL, Dolled-Filhart M. Tissue microarrays: leaping the gap between research and clinical adoption. Per Med. 2013;10(5):441–51. [DOI] [PubMed] [Google Scholar]
- 20.MacNeil T, Vathiotis IA, Martinez-Morilla S, Yaghoobi V, Zugazagoitia J, Liu Y, et al. Antibody validation for protein expression on tissue slides: a protocol for immunohistochemistry. Biotechniques. 2020(0). [DOI] [PMC free article] [PubMed] [Google Scholar]
- 21.Bankhead P, Loughrey MB, Fernández JA, Dombrowski Y, McArt DG, Dunne PD, et al. QuPath: Open source software for digital pathology image analysis. Sci Rep. 2017;7(1):1–7. [DOI] [PMC free article] [PubMed] [Google Scholar]
- 22.Camp RL, Dolled-Filhart M, Rimm DL. X-tile: a new bio-informatics tool for biomarker assessment and outcome-based cut-point optimization. Clin Cancer Res. 2004;10(21):7252–9. [DOI] [PubMed] [Google Scholar]
- 23.Stuart-Harris R, Caldas C, Pinder S, Pharoah P. Proliferation markers and survival in early breast cancer: a systematic review and meta-analysis of 85 studies in 32,825 patients. The Breast. 2008;17(4):323–34. [DOI] [PubMed] [Google Scholar]
- 24.Harris LN, Ismaila N, McShane LM, Andre F, Collyar DE, Gonzalez-Angulo AM, et al. Use of biomarkers to guide decisions on adjuvant systemic therapy for women with early-stage invasive breast cancer: American Society of Clinical Oncology Clinical Practice Guideline. J Clin Oncol. 2016;34(10):1134. [DOI] [PMC free article] [PubMed] [Google Scholar]
- 25.Polley MY, Leung SC, McShane LM, Gao D, Hugh JC, Mastropasqua MG, et al. An international Ki67 reproducibility study. J Natl Cancer Inst. 2013;105(24):1897–906. [DOI] [PMC free article] [PubMed] [Google Scholar]
Associated Data
This section collects any data citations, data availability statements, or supplementary materials included in this article.


