Abstract
Purpose
To organize a multi-institute knee MRI segmentation challenge for characterizing the semantic and clinical efficacy of automatic segmentation methods relevant for monitoring osteoarthritis progression.
Materials and Methods
A dataset partition consisting of three-dimensional knee MRI from 88 retrospective patients at two time points (baseline and 1-year follow-up) with ground truth articular (femoral, tibial, and patellar) cartilage and meniscus segmentations was standardized. Challenge submissions and a majority-vote ensemble were evaluated against ground truth segmentations using Dice score, average symmetric surface distance, volumetric overlap error, and coefficient of variation on a holdout test set. Similarities in automated segmentations were measured using pairwise Dice coefficient correlations. Articular cartilage thickness was computed longitudinally and with scans. Correlation between thickness error and segmentation metrics was measured using the Pearson correlation coefficient. Two empirical upper bounds for ensemble performance were computed using combinations of model outputs that consolidated true positives and true negatives.
Results
Six teams (T1–T6) submitted entries for the challenge. No differences were observed across any segmentation metrics for any tissues (P = .99) among the four top-performing networks (T2, T3, T4, T6). Dice coefficient correlations between network pairs were high (> 0.85). Per-scan thickness errors were negligible among networks T1–T4 (P = .99), and longitudinal changes showed minimal bias (< 0.03 mm). Low correlations (ρ < 0.41) were observed between segmentation metrics and thickness error. The majority-vote ensemble was comparable to top-performing networks (P = .99). Empirical upper-bound performances were similar for both combinations (P = .99).
Conclusion
Diverse networks learned to segment the knee similarly, where high segmentation accuracy did not correlate with cartilage thickness accuracy and voting ensembles did not exceed individual network performance.
See also the commentary by Elhalawani and Mak in this issue.
Keywords: Cartilage, Knee, MR-Imaging, Segmentation
© RSNA, 2020
Summary
A multi-institute challenge for knee MRI segmentation was organized, in which a generalized framework for characterizing and evaluating the semantic and clinical efficacy of automatic segmentation methods was validated on six networks submitted to the challenge.
Key Points
■ Among the six assessed networks for knee MRI segmentation, segmentation performance with respect to ground truth segmentations was comparable, and Dice coefficient correlations between network pairs were high (>0.85).
■ The performance of the majority-vote ensemble, which generated labels by using the majority labels (four of six) across binarized segmentations, had comparable accuracy to that of the top-performing networks (P = .99).
■ Estimates in femorotibial longitudinal cartilage thickness change for all networks had negligible bias and a 95% CI range within the range of observable thickness changes.
Introduction
Osteoarthritis affects more than 30 million adults and is the leading cause of chronic disability in the United States (1). The current reference standard for osteoarthritis detection is radiography, which can detect only late-stage osteoarthritis changes owing to its lack of sensitivity to soft-tissue degeneration (2). MRI provides excellent soft-tissue contrast, and recent studies have shown that morphologic and compositional changes in the articular cartilage and meniscus are potential imaging biomarkers for early osteoarthritis (3). Accurately measuring such tissue properties relies on high-quality tissue segmentations, for which the reference standard is a manual approach. However, manual annotations can be both time-consuming and prone to interreader variation; thus, there is interest in automated cartilage and meniscal MRI segmentation techniques.
Convolutional neural networks (CNNs) have shown great potential for automating segmentation; however, comparing the performance of different networks is a challenge owing to heterogeneous partitions of different datasets (ie, different holdout splits). Data standardization for semantic segmentation of knee MRI has been explored in previous organizational challenges, such as the Medical Image Computing and Computer Assisted Intervention SKI10 challenge, which provided 1.5-T and 3.0-T MRI data for segmenting bone and cartilage in the femoral and tibial condyles (4). While this challenge was instrumental in creating one of the first standardized datasets for knee segmentation, curated datasets that standardize scan contrasts and field strengths and that include additional tissue compartments could be useful for future research. Previous studies have shown that changes in meniscus and patellar cartilage morphology are correlated with osteoarthritis progression (5,6). Larger initiatives, such as the Osteoarthritis Initiative, have standardized protocols for imaging these soft tissues and have publicly shared expert-annotated segmentations for a subset of scans. Different automatic segmentation methods have used different data partitions, however, making it difficult to accurately compare these methods (7–12). Different data partitions also preclude properly combining and evaluating predictions from multiple CNNs through model ensembles, which may be superior to a single top-performing model in medical imaging tasks (13).
Herein we describe the organization and results from the 2019 International Workshop on Osteoarthritis Imaging Knee Segmentation Challenge, which introduced a standardized partition for data in the Osteoarthritis Initiative. We present a framework to compare and evaluate the performance of challenge submission entries for segmenting articular (femoral, tibial, and patellar) cartilage and the meniscus. We also characterize the extent to which traditional segmentation metrics correlate with clinically relevant end points, such as cartilage thickness. Finally, we evaluate the potential for using an ensemble of networks and provide an exploratory analysis of how to empirically quantify upper bounds on segmentation performance. An abstract version of this work was included as part of the proceedings of the Osteoarthritis Research Society International 2020 World Congress (14).
Materials and Methods
Patient Overview
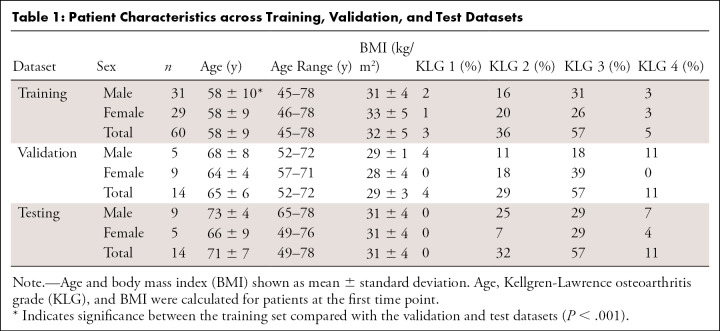
Data for this retrospective study originated from the Osteoarthritis Initiative (https://nda.nih.gov/oai), a longitudinal study of osteoarthritis progression, and were acquired between 2004 and 2006. In the Osteoarthritis Initiative, data were de-identified, and usage was approved by the institutional review board with informed consent from included patients. Men and women between the ages of 45 and 79 years who were at risk for symptomatic femoral-tibial knee osteoarthritis were included in the study. Patients with inflammatory arthritis, contraindication to 3-T MRI, or bilateral end-stage knee osteoarthritis were excluded. The dataset comprised 88 patients with Kellgren-Lawrence osteoarthritis grades 1–4 who underwent scanning at two time points (baseline and 1 year), resulting in 176 three-dimensional (3D) double-echo steady-state (DESS) volumes (15). These datasets have been used with different holdout splits in prior studies (7–12). In this study, we standardized these splits and compared performance with new outcome metrics. To determine data splits, we conducted a prospective power analysis based on prior work, which indicated that a power of 0.75 required a sample size (N) of 14 patients. The 88 patients were split into cohorts of 60 patients for training, 14 for validation, and 14 for testing, resulting in 120, 28, and 28 volumes for training, validation, and testing, respectively, with approximately equal distributions of Kellgren-Lawrence osteoarthritis grade, body mass index, and sex among all three groups (Table 1).
Table 1:
Patient Characteristics across Training, Validation, and Test Datasets
MRI Scan Parameters and Segmentations
Patients were scanned using 3-T Magnetom Trio scanners (Siemens Medical Solutions) and quadrature transmit/receive knee coils (USA Instruments) with DESS parameters as follows: field of view, 14 cm; resolution, 0.36 mm × 0.46 mm × 0.7 mm zero-filled to 0.36 mm × 0.36 mm × 0.7 mm; echo time, 5 msec; repetition time, 16 msec; and 160 slices (16). Three-dimensional sagittal DESS and corresponding segmentation masks for femoral, tibial, and patellar cartilage as well as the meniscus generated manually by a single expert reader at Stryker Imorphics were used in this study (17,18). A total of 28 160 segmented sections with four different tissue classes were included in this challenge.
Dataset Distribution
De-identified training and validation sets, which included labeled masks as reference segmentations, were shared with 29 researchers who requested access through the International Workshop on Osteoarthritis Imaging website. All participants were allowed to use training data from other sources and perform data augmentation. One week prior to the challenge, participants were provided with the test dataset, which consisted of scans without reference segmentations. All participants were asked to submit multilabel binarized masks for each scan in the test dataset along with an abstract with detailed CNN reporting categories, similar to the Checklist for Artificial Intelligence in Medical Imaging guidelines, as included in Appendix E1 (supplement) (19).
Challenge Entries
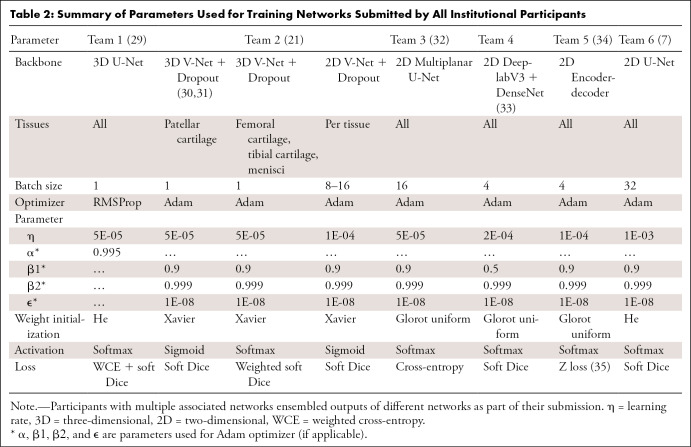
Five teams participated in the challenge, and a sixth team submitted an entry after the challenge. Teams were numbered by submission time; ordering does not reflect performance ranking. A summary of submissions is shown in Table 2. For detailed information on the six networks, see Appendix E2 (supplement).
Table 2:
Summary of Parameters Used for Training Networks Submitted by All Institutional Participants
Network Evaluation
Networks were evaluated on the unreleased ground truth test set segmentations. Evaluation metrics for the challenge were limited to average Dice score (range, 0–1) for all tissues separately. Additionally, three other pixelwise segmentation metrics were computed: volumetric overlap error (VOE) (range, 0–1), coefficient of variation (CV) (range, 0–∞), and average symmetric surface distance (ASSD) (range, 0–∞) in millimeters. For all metrics except Dice, a lower number indicated higher accuracy.
To compute the similarity in segmentation results between different networks, the pairwise Dice correlations among test set predictions from all networks were calculated. The Dice correlation (ρDice) between segmentation from network A (fA(x)) and network B (fB(x)) was defined as in Equation (1):
 |
.
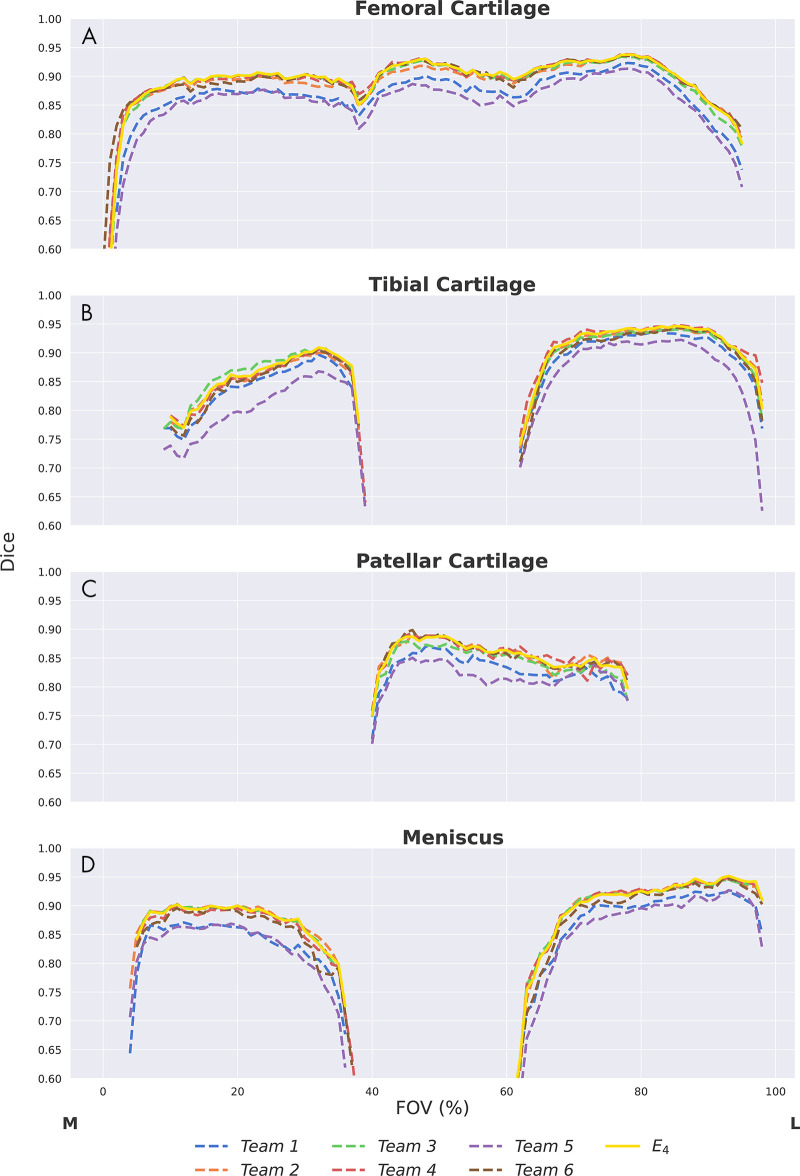
Depthwise region of interest distribution plots, which display two-dimensional (2D) section-wise Dice accuracies calculated over normalized knee sizes in the through-plane (left-to-right) dimension, were used to visualize differences in segmentation performance from the medial to lateral compartment (7).
Cartilage Thickness
Cartilage thickness, a potential imaging biomarker for knee osteoarthritis progression that has been used as a primary end point in recent clinical trials, was also calculated for the three cartilage surfaces to assess the clinical efficacy and quality of automatic cartilage segmentations (20,21). Although evidence has shown the relevance of 3D shape changes of the meniscus and meniscal extrusion to osteoarthritis progression, changes in meniscal morphology do not follow similar progression trajectories of longitudinal thickness loss. As a result, only cartilage thickness was calculated (22,23). Cartilage thickness error was defined as the difference in the average thickness computed using the ground truth segmentation and the predicted segmentation. The correlation between pixelwise segmentation metrics (Dice, VOE, CV, and ASSD) and cartilage thickness error was measured using the Pearson correlation coefficient. A temporal change in cartilage thickness is the most common use of the thickness metrics; longitudinal thickness changes for all 14 patients in the test set from baseline to 1-year follow-up were compared between the automated approaches across all networks and the manually annotated labels (20).
Network Ensembles
In these experiments, we investigated how ensembles can be leveraged to improve prospective evaluation on unseen data and to empirically quantify performance bounds. We computed a majority-vote ensemble (E4), which generated labels by selecting the supermajority (four of six) label across binarized segmentations submitted by each team. Performance was compared with that of individual networks using the metrics described above.
Additionally, loss functions such as the Tversky loss tune the extent of false-positive and false-negative contributions to the final loss for mitigating class imbalance (24). In an additional exploratory analysis, we used ensembles of submitted networks to empirically evaluate the upper bounds of segmentation sensitivity (E*+) and specificity (E*−) that is possible to achieve using a combination of the six networks. Ensembles E*+ and E*− each consolidated true positives and true negatives from all networks, isolating errors in the segmentation to false negatives and false positives, respectively. Furthermore, using these upper-bound performance ensembles, we evaluated whether segmentation and cartilage thickness errors were lower for networks preferentially optimizing either for sensitivity or specificity. (See Appendix E3 [supplement] for information on ensemble upper bounds.)
Statistical Analysis
Statistical comparisons were conducted using Kruskal-Wallis tests and corresponding Dunn post hoc tests with Bonferroni correction (P < α = .05). All statistical analyses were performed using the SciPy (version 1.1.0; https://www.scipy.org/) library (25).
Data Availability
Training, validation, and testing partitions are available in Appendix E4 (supplement). Code and learned model weights for T1 (https://github.com/denizlab/2019_IWOAI_Challenge), T3 (https://github.com/perslev/MultiPlanarUNet), T5 (http://github.com/ali-mor/IWOAI_challenge), and T6 (http://github.com/ad12/DOSMA) have been made publicly available.
Results
Characteristics of Training, Validation, and Testing Datasets
No differences were observed in the distribution of Kellgren-Lawrence osteoarthritis grades (P = .51), body mass index (P = .33), and sex (P = .41) among the training, validation, and testing datasets (Table 1). The mean age of patients in the training set was lower than in the validation or testing sets (P < .001).
Challenge Entries
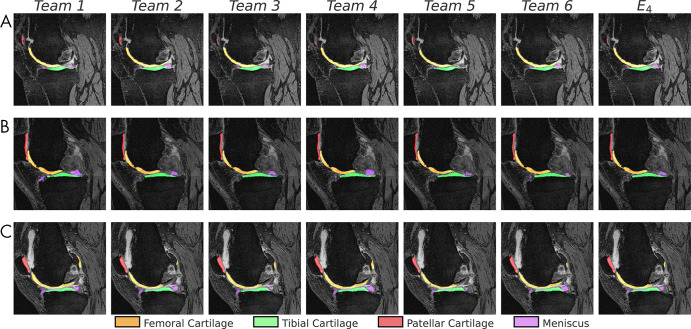
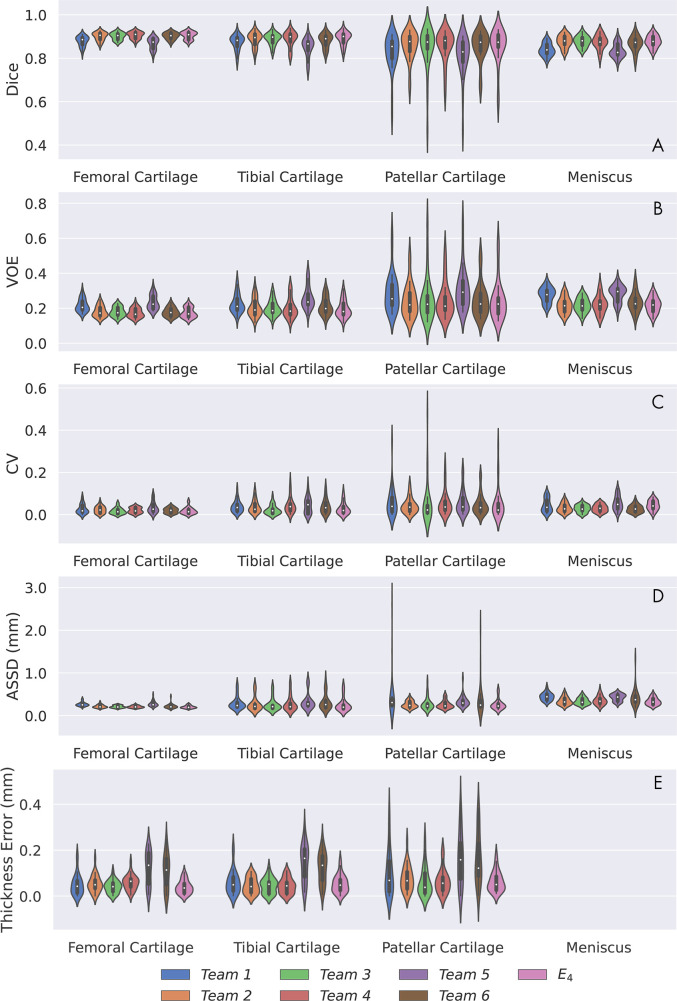
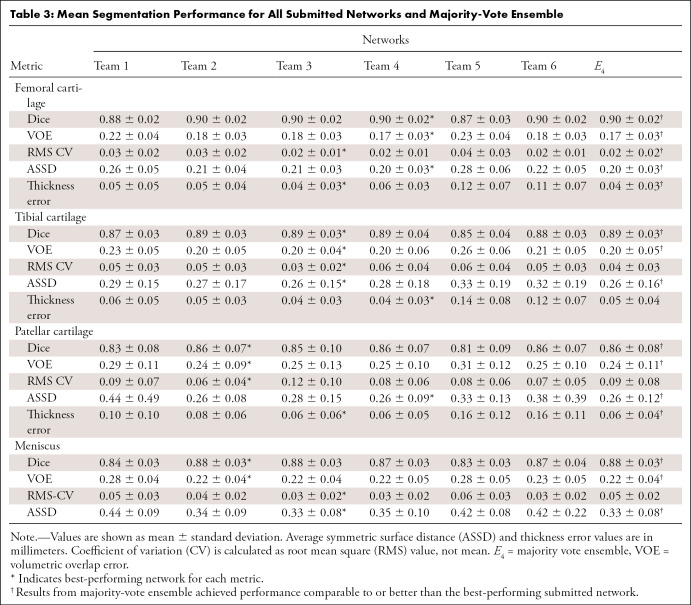
All networks produced nearly identical segmentations across varying Kellgren-Lawrence osteoarthritis grades (Fig 1), achieving high performance even in cases of osteoarthritis grade 3 or higher (Fig 1, B, C). Segmentations were similar around features such as osteophytes and had similar failure modes in transition regions between the medial and lateral condyles (Fig 1, B). Slight differences were observed in the posterior femoral condyle and near the anterior cruciate ligament insertion site on the femur (Fig 1, C). All networks achieved reasonably similar fidelity in segmenting all tissue structures as measured by standard segmentation metrics with respect to ground truth segmentations (Fig 2, A–D). For all segmentations, the mean Dice ranged from 0.81 to 0.90, the mean VOE ranged from 0.17 to 0.31, the root-mean-square CV ranged from 0.02 to 0.09, and the mean ASSD ranged from 0.20 mm to 0.44 mm (Table 3). For femoral, tibial, and patellar cartilage, thickness errors ranged from 0.04 mm to 0.16 mm. No differences were observed in Dice, CV, VOE, and ASSD for femoral cartilage (P = .99), tibial cartilage (P = .99), patellar cartilage (P = .99), and menisci (P = .99) among the four top-performing networks (T2, T3, T4, and T6). These four networks had lower ASSD and higher Dice for femoral cartilage (P < .05) in comparison with T1 and T5. Additionally, T2, T3, and T4 had higher Dice accuracy than T1 and T5 for tibial cartilage and meniscus (P < .05 for both). No differences were observed in CV for femoral cartilage (P = .14), tibial cartilage (P = .17), and patellar cartilage (P = .93). High variance in patellar cartilage segmentation was observed among all segmentation metrics, primarily due to one patient who was an outlier (Table 3).
Figure 1:
Sample segmentations (1.25× center zoom) of the lateral condyle in patients with Kellgren-Lawrence osteoarthritis grade 2 to 4 (A–C, respectively). The following tissues were segmented and colored: femoral cartilage (orange), tibial cartilage (green), patellar cartilage (red), and meniscus (purple). Segmentation differences appeared negligible among all networks, including the majority-vote ensemble (E4).
Figure 2:
Performance summary of networks submitted to segmentation challenge and majority-vote ensemble (E4) for all tissues as measured by, A, Dice overlap (Dice), B, volumetric overlap error (VOE), C, coefficient of variation (CV), D, average symmetric surface distance (ASSD, in millimeters), and, E, thickness error (in millimeters). Network performances are indicated by violin plots, which overlay distributions over box plots. Longer plots indicate larger variance in network performance among scans. Thickness metrics were not calculated for meniscus.
Table 3:
Mean Segmentation Performance for All Submitted Networks and Majority-Vote Ensemble
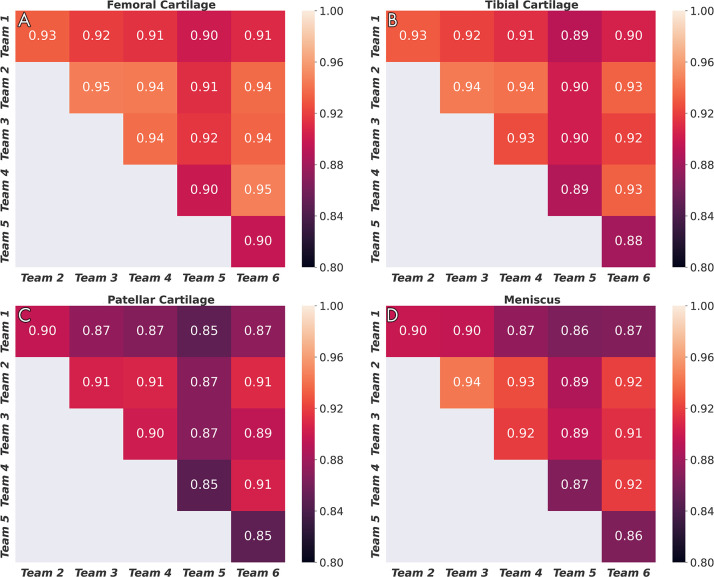
Dice correlations (ρDice) between pairs of networks were greater than 0.90 for femoral cartilage, 0.88 for tibial cartilage, 0.86 for menisci, and 0.85 for patellar cartilage (Fig 3). The top four networks demonstrated the strongest Dice correlations among femoral cartilage, tibial cartilage, and meniscus (ρDice > 0.94). The networks also displayed similar segmentation accuracy trends across DESS sections in the medial-lateral direction (Fig 4). All networks achieved higher Dice performance in the lateral condyle than in the medial condyle.
Figure 3:
Dice correlations among segmentations from different networks for, A, femoral cartilage, B, tibial cartilage, C, patellar cartilage, and, D, meniscus. Strong correlation was observed for femoral cartilage, tibial cartilage, and menisci, and moderately strong correlation was observed for patellar cartilage.
Figure 4:
Depthwise region of interest distribution for, A, femoral cartilage, B, tibial cartilage, C, patellar cartilage, and, D, meniscus. Segmentation accuracy using Dice as a function of section location from the medial (M) to the lateral (L) end. The field of view (FOV) was normalized (0%–100%) on the basis of the first and last section, with a ground truth segmentation in each scan. All networks have similar trends in performance across different regions of the knee. All networks share failure points at the intercondylar notch (∼40% FOV) and have considerably lower performance in the medial condyle.
Cartilage Thickness
Thickness errors from segmentations from T5 and T6 were worse than those achieved by other networks for all three cartilage surfaces (Fig 2, E) (P < .05) but were negligible among the other four networks (P = .99). Among these four networks, median percentage error in thickness estimates was approximately 5% for femoral and tibial cartilage. Median percentage error in patellar cartilage thickness estimates was larger and more variable (Fig E1 [supplement]). There was minimal systematic underestimation of cartilage thickness (femoral cartilage, −0.02 mm; tibial cartilage, −0.05 mm; patellar cartilage, −0.04 mm) (Fig 5, A–C). Bland-Altman limits of agreement 95% CIs (and ranges) were ± 0.18 mm (0.35 mm) for femoral cartilage, ± 0.17 mm (0.34 mm) for tibial cartilage, and ± 0.27 mm (0.54 mm) for patellar cartilage. Additionally, there was minimal bias in estimated longitudinal thickness changes between segmentations across all networks and ground truth masks (femoral cartilage, 0.00 mm; tibial cartilage, 0.03 mm; patellar cartilage, −0.01 mm) (Fig 5, D–F). Bland-Altman limits of agreement 95% CIs (and ranges) for longitudinal thickness changes were ± 0.09 mm (0.19 mm) for femoral cartilage, ± 0.10 mm (0.20 mm) for tibial cartilage, and ± 0.21 mm (0.42 mm) for patellar cartilage.
Figure 5:
Bland-Altman plots for, A, femoral, B, tibial, and, C, patellar cartilage thickness differences (per scan, Kellgren-Lawrence [KL] osteoarthritis grade computed at baseline) and, D–F, longitudinal thickness change (per patient, Kellgren-Lawrence osteoarthritis grade 2–4 at time point 1) for the six networks, compared with the ground truth. Positive difference values (y-axis) indicate overestimation of thickness or longitudinal thickness change. Negligible bias (dotted gray line) was observed for all three tissues among all networks for both metrics. The 95% limits of error (LoE) (between dashed gray lines) were broader for cross-sectional thickness difference than longitudinal differences. The LoE were relatively small for, D, femoral cartilage and, E, tibial cartilage compared with, F, patellar cartilage, indicating better longitudinal estimates. There was no systematic trend in networks underestimating or overestimating longitudinal thickness changes.
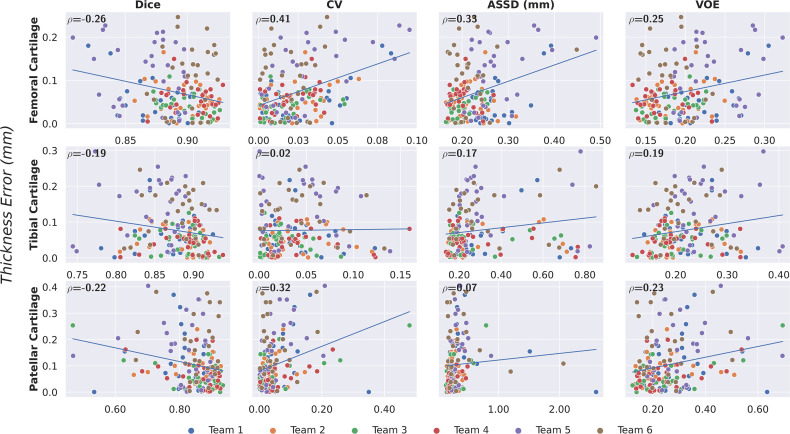
There was low correlation between pixelwise segmentation accuracy metrics, and cartilage thickness ranged from very weak to moderate (highest Pearson r = 0.41). Highest correlations between all pixelwise metrics and cartilage thickness were observed with femoral cartilage thickness (Pearson r > 0.25), while very weak correlation among these metrics was observed with tibial cartilage (Pearson r < 0.2) (Fig 6). The CV had the highest correlation with femoral and patellar cartilage thickness (Pearson r = 0.41 and 0.32, respectively).
Figure 6:
Correlation between pixelwise segmentation metrics and cartilage thickness error as measured with the Pearson correlation coefficient (ρ). Minimal correlation was observed for all tissues across networks, all of which achieved high segmentation performance. This may suggest that given high performance among models as measured by pixelwise segmentation metrics, there is a negligible difference in diagnostic metrics. ASSD = average symmetric surface distance, CV = coefficient of variation, VOE = volumetric overlap error.
Ensemble Comparison
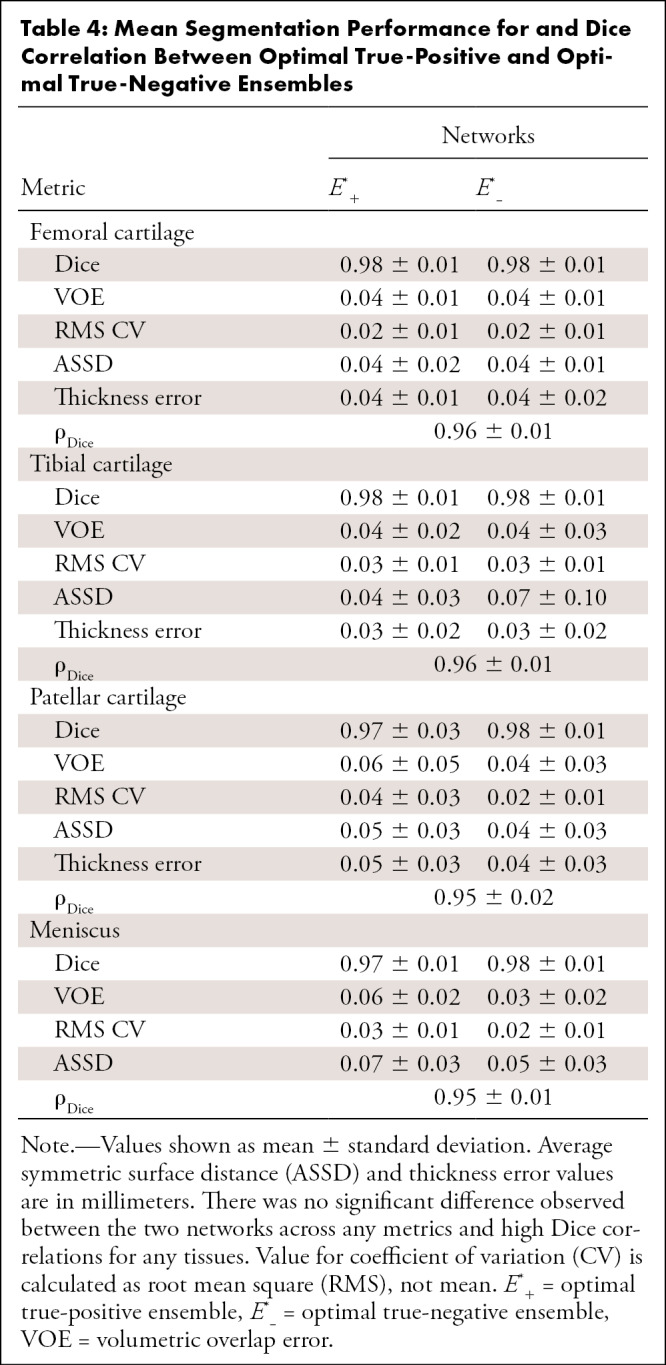
The majority-vote ensemble (E4) achieved similar performance to that of the submitted networks for both pixelwise and thickness metrics (Table 3). No performance difference was observed between the ensemble and the networks with the best performance for quantitative segmentation metrics (T2, T3, T4, and T6) as well as networks with the best performance for cartilage thickness (T1, T2, T3, and T4) (P = .99). The ensemble also displayed segmentation accuracy trends across DESS slices in the medial-to-lateral direction similar to those of the individual networks (Fig 4). Both optimal upper-bound ensemble networks (E*+ and E*−) performed better than the majority-vote ensemble in pixelwise metrics (P < .05) but not in thickness error (P = .99). No performance difference was observed between the two upper-bound ensemble networks for all tissues (P = .70) (Table 4). Dice correlations between segmentations from these two ensembles were 0.96, 0.96, 0.95, and 0.95 for femoral cartilage, tibial cartilage, patellar cartilage, and meniscus, respectively (Table 4).
Table 4:
Mean Segmentation Performance for and Dice Correlation Between Optimal True-Positive and Optimal True-Negative Ensembles
Discussion
In this study, we organized a knee MRI segmentation challenge consisting of a common MRI sequence (which contains information sensitive to soft-tissue degeneration in osteoarthritis) that could be used in prospective studies. We organized the Osteoarthritis Initiative segmentation data, standardized dataset splits with balanced demographics in an easy-to-use format, and developed a framework to compare and evaluate the performance of challenge submission networks for articular cartilage and meniscus segmentation. We showed that the submitted CNNs achieved similar performance in segmenting all tissues, independent of network architecture and training design. Although a high segmentation accuracy was achieved by all models and ensembles, only a weak correlation between segmentation accuracy metrics and cartilage thickness error was observed. Moreover, we explored how a network ensemble approach can be a viable technique for combining outputs from multiple high-performance networks and how simulated combinations of network outputs can be used to quantify performance bounds and error profiles for ensembles.
Despite the vast variety of network approaches, most methods achieved similar segmentation and thickness accuracy across all tissues and were comparable to other cartilage segmentation models (26). While some networks had significantly lower performance compared with submissions for other teams, all networks shared a high Dice correlation, suggesting strong concordance in volumetric similarity of the segmentations. In addition, near-identical sectionwise Dice accuracies and failure regions indicated that all networks systematically performed worse in the intercondylar notch and the medial compartment, which is more commonly affected in patients with osteoarthritis (27). The similarity in performance and limitations may suggest that independent networks, regardless of their design and training framework, learn to represent and segment the knee in similar ways. The performance similarities may also indicate that even the best-performing networks may be data limited and may gain minimal benefit from architecture and/or training protocol optimizations. In these scenarios, network design may be motivated by dataset size, where there likely exists a trade-off between using smaller networks that are less prone to overfitting on smaller datasets and building larger networks that can capture generalized image priors from larger datasets. Design choices may also be driven by practical limitations, such as computational resources and implementation complexity.
Owing to a similarity in learned image representations, the E4 voting ensemble performed similarly to the individual networks. When errors among models are minimally correlated, majority-voting ensembles can improve performance over best-performing individual networks. The minimal performance gain from E4 may indicate the high correlation among errors from individual networks, which was also observed in the high Dice correlations among network segmentations. This may also suggest that individual, high-accuracy knee segmentation models can achieve performance similar to that of their ensemble counterparts. In the case of models with relatively lower segmentation (T1 and T5) and thickness (T5 and T6) accuracy, the voting ensemble improved performance across all metrics, even though independently different sets of networks perform poorly across different metric types.
Moreover, empirically gauging performance of different models on new, unseen data is difficult, as it requires acquiring ground truth labels for comparison. In a prospective deployment of segmentation models without the availability of ground truth labels, ensembles can provide implicit regularization by limiting the effect of any arbitrary poorly performing network on the output. Furthermore, while voting ensembles may be an effective method for regularizing network outputs, training ensembles to learn relative spatial weightings among models may be a more exhaustive method for improving overall performance. In such cases, high-accuracy models with low concordance in errors could provide highly complementary information that may be useful in training ensembles.
The ensemble upper-bound computation may be helpful in empirically quantifying the extent to which ensembles can leverage variations in segmentation. While trivial segmentations (all 0s or all 1s) would saturate the upper bound, none of the six models presented trivial solutions. The performance between the optimized upper-bound ensembles, E*+ and E*−, was highly concordant in both pixelwise and thickness metrics. Ensembles E*+ and E*− isolated errors in the segmentation to false negatives and false positives, respectively. The concordance between the two ensembles may indicate that the incidence rate of false negatives and false positives is well balanced and that either error has an equal contribution to the overall error, reducing the need to artificially weight networks to account for class imbalance.
Additionally, thickness estimates across all networks were nearly identical despite differences in model architecture and training protocol. Beyond the high concordance in thickness estimates, thickness errors among the models were also sub-scan resolution, which is within the practical limits of thickness estimates measurable from the DESS scan. Median cartilage thickness errors were greater than 0.2 mm, roughly half the resolution of the DESS voxels among networks with high volumetric (VOE and ASSD) and overlap (Dice) performances. The magnitude of thickness errors was also slightly below observed 1-year changes in cartilage thickness (∼0.2–0.3 mm), which may indicate the usability of these models for prospective analysis of clinical DESS scans (28). While thickness errors are both sub-scan resolution and within the range of observable change, additional work toward reducing the high variability of these estimates may help make these networks more viable for clinical use.
Compared with cross-sectional thickness estimates, longitudinal thickness estimates had considerably lower variability, which may indicate that all networks systematically overestimate or underestimate cartilage thickness per patient. In the case of longitudinal estimates, this per-patient systematic bias may be largely mitigated, which reduces the error when evaluating longitudinal cartilage thickness changes. The consistency in estimation over time may suggest that these networks capture anatomic features that change minimally over time. The lack of bias and the limited variability in longitudinal estimates may indicate the usefulness of these networks to robustly estimate thickness changes in patients with osteoarthritis. The relative time-invariance of these features may also be useful for fine-tuning patient-specific networks on individual patient scans to perform more robustly on future scans of that patient.
The larger variance in thickness estimates compared with pixelwise metrics was further indicated by the stark difference in performance between the two types of metrics. Individual networks that performed best among pixelwise metrics (T2, T3, T4, and T6) did not necessarily perform the best in estimating thickness, and the reverse was also true. Even between optimal upper-bound ensembles (E*+ and E*−) and the majority-vote ensemble (E*+), where there was a significant difference in most segmentation metrics, there was no difference in the error of thickness estimates between the upper-bound and majority-vote ensembles.
Overall, the correlations between standard segmentation metrics and cartilage thickness were weak. These factors may suggest that using traditional evaluation metrics on high-performing models may not be predictive of differences in thickness accuracy outcomes among high-performance models. Small improvements in segmentation metrics among these models may not correspond to increased thickness accuracy. It may also indicate that information learned from pixel-level segmentation accuracy and tissue-level thickness accuracy metrics are somewhat complementary among these models. A loss function designed to optimize for a combination of segmentation and thickness accuracy may regularize model performance among both segmentation and clinical end points.
Despite the large set of networks, there were certain limitations in the study. All compared methods leveraged CNNs with minimal postprocessing. Additional non–deep learning approaches and practical considerations for postprocessing, such as conditional random smoothing fields, can be explored to further refine CNN outputs. Additionally, while the majority-vote ensemble simulated practical methods for combining outputs from different models with limited access to models, ensemble learning from model logits may improve accuracy by learning relative weighting among different models. However, ensemble learning would require access to model outputs from training data in addition to the testing data, which is challenging in the context of multi-institutional studies and will be the focus of future studies. Furthermore, the test set of 14 subjects scanned at two time points may be too small to conclusively detect variations in model performance. The availability of larger public datasets and future challenges will be essential to further investigate segmentation performance variability.
In this study, we standardized a dataset partition using an MRI sequence that can be prospectively deployed to train and evaluate knee segmentation algorithms. We established a generalized framework for interpreting the clinical usability of such segmentations beyond using long-standing segmentation metrics. Using deep learning–based segmentation algorithms from multiple institutions, we showed that networks with varying training paradigms achieved similar performance. Through these multiple networks, we demonstrated the efficacy of using majority-vote ensembles in cases of limited access to training resources or explicit network parameters. Moreover, among individual models achieving high segmentation performance, segmentation accuracy metrics were weakly correlated with cartilage thickness end points.
Acknowledgments
Acknowledgments
We would like to thank the IWOAI Segmentation Challenge Writing Group authors: Naji Khosravan, PhD, Department of Computer Science, University of Central Florida, Orlando, Fla; Drew Torigian, MD, Department of Radiology, University of Pennsylvania, Philadelphia, Pa; Jutta Ellermann, MD, and Mehmet Akcakaya, PhD, Department of Radiology, University of Minnesota, Minneapolis, Minn; Radhika Tibrewala, MS, Io Flament, MS, Matthew O’Brien, MS, and Sharmila Majumdar, PhD, Department of Radiology, University of California San Francisco, San Francisco, Calif; Kunio Nakamura, PhD, Department of Biomedical Engineering, Cleveland Clinic, Cleveland, Ohio; and Akshay Pai, PhD, Department of Computer Science, University of Copenhagen, Copenhagen, Denmark.
Supported by National Institutes of Health grants (R01 AR063643, R01 EB002524, K24 AR062068, and P41 EB015891, R00AR070902, R61AR073552, R01 AR074453); a National Science Foundation grant (DGE 1656518); grants from GE Healthcare and Philips (research support); and a Stanford University Department of Radiology Precision Health and Integrated Diagnostics Seed Grant. M.P. supported by a grant from the Independent Research Fund Denmark, project U-Sleep, project number 9131-00099B. C. Igel supported by a grant from the Danish Council for Independent Research for the project U-Sleep. Image data were acquired from the Osteoarthritis Initiative (OAI). The OAI is a public-private partnership composed of five contracts (N01-AR-2-2258, N01-AR-2-2259, N01-AR-2-2260, N01-AR-2-2261, N01-AR-2-2262) funded by the National Institutes of Health, a branch of the Department of Health and Human Services, and conducted by the OAI Study Investigators. Private funding partners include Merck Research Laboratories, Novartis Pharmaceuticals, GlaxoSmithKline, and Pfizer. Private sector funding for the OAI is managed by the Foundation for the National Institutes of Health.
This manuscript was prepared using an OAI public use dataset and does not necessarily reflect the opinions or views of the OAI investigators, the NIH, or the private funding partners.
Disclosures of Conflicts of Interest: A.D.D. Activities related to the present article: grants and travel support from the National Science Foundation, the National Institute of Arthritis and Musculoskeletal and Skin Diseases, the National Institute of Biomedical Imaging and Bioengineering, GE Healthcare, and Philips. Activities not related to the present article: grants from the National Institutes of Health. Other relationships: disclosed no relevant relationships. F.C. disclosed no relevant relationships. C. Iriondo disclosed no relevant relationships. A.M. disclosed no relevant relationships. S.J. disclosed no relevant relationships. U.B. disclosed no relevant relationships. M.P. Activities related to the present article: grant from the Independent Research Fund Denmark. Activities not related to the present article: disclosed no relevant relationships. Other relationships: disclosed no relevant relationships. C. Igel Activities related to the present article: grant from the Danish Council for Independent Research. Activities not related to the present article: disclosed no relevant relationships. Other relationships: disclosed no relevant relationships. E.B.D. Activities related to the present article: disclosed no relevant relationships. Activities not related to the present article: stockholder in Biomediq and Cerebriu. Other relationships: disclosed no relevant relationships. S.G. disclosed no relevant relationships. M.Y. disclosed no relevant relationships. X.L. disclosed no relevant relationships. C.M.D. Activities related to the present article: grant from the National Institute of Arthritis and Musculoskeletal and Skin Diseases. Activities not related to the present article: disclosed no relevant relationships. Other relationships: disclosed no relevant relationships. V.J. disclosed no relevant relationships. R.R. disclosed no relevant relationships. G.E.G. Activities related to the present article: grants from the National Institutes of Health. Activities not related to the present article: board member for HeartVista; consultant for Canon; grants from GE Healthcare. Other relationships: disclosed no relevant relationships. B.A.H. Activities related to the present article: grant from the National Institutes of Health. Activities not related to the present article: royalties from patents licensed by Siemens and GE Healthcare; stockholder in LVIS. Other relationships: disclosed no relevant relationships. V.P. disclosed no relevant relationships. A.S.C. Activities related to the present article: grants from the National Institutes of Health, GE Healthcare, and Philips. Activities not related to the present article: board member for BrainKey and Chondrometrics; consultant for Skope, Subtle Medical, Chondrometrics, Image Analysis Group, Edge Analytics, ICM, and Culvert Engineering; stockholder in Subtle Medical, LVIS, and BrainKey; travel support from Paracelsus Medical Private University. Other relationships: disclosed no relevant relationships.
Abbreviations:
- ASSD
- average symmetric surface distance
- CNN
- convolutional neural network
- CV
- coefficient of variation
- DESS
- double-echo steady-state
- 3D
- three-dimensional
- 2D
- two-dimensional
- VOE
- volumetric overlap error
Contributor Information
Arjun D. Desai, Email: arjundd@stanford.edu.
Collaborators: Naji Khosravan, Drew Torigian, Jutta Ellermann, Mehmet Akcakaya, Radhika Tibrewala, Io Flament, Matthew O’Brien, Sharmila Majumdar, Kunio Nakamura, and Akshay Pai
References
- 1.Cross M, Smith E, Hoy D, et al. The global burden of hip and knee osteoarthritis: estimates from the global burden of disease 2010 study. Ann Rheum Dis 2014;73(7):1323–1330. [DOI] [PubMed] [Google Scholar]
- 2.Chaudhari AS, Sandino CM, Cole EK, et al. Prospective Deployment of Deep Learning in MRI: A Framework for Important Considerations, Challenges, and Recommendations for Best Practices. J Magn Reson Imaging 2020. 10.1002/jmri.27331. Published online August 24, 2020. Accessed September 20, 2020. [DOI] [PMC free article] [PubMed]
- 3.Chaudhari AS, Kogan F, Pedoia V, Majumdar S, Gold GE, Hargreaves BA. Rapid Knee MRI Acquisition and Analysis Techniques for Imaging Osteoarthritis. J Magn Reson Imaging 2020;52(5):1321–1339. [DOI] [PMC free article] [PubMed] [Google Scholar]
- 4.Heimann T, Morrison BJ, Styner MA, Niethammer M, Warfield S. Segmentation of knee images: a grand challenge. In: MICCAI Workshop on Medical Image Analysis for the Clinic: A Grand Challenge, 2010; 207–214. http://www.ski10.org/ski10.pdf. [Google Scholar]
- 5.Draper CE, Besier TF, Gold GE, et al. Is cartilage thickness different in young subjects with and without patellofemoral pain?. Osteoarthritis Cartilage 2006;14(9):931–937. [DOI] [PubMed] [Google Scholar]
- 6.Emmanuel K, Quinn E, Niu J, et al. Quantitative measures of meniscus extrusion predict incident radiographic knee osteoarthritis: data from the Osteoarthritis Initiative. Osteoarthritis Cartilage 2016;24(2):262–269. [DOI] [PMC free article] [PubMed] [Google Scholar]
- 7.Desai AD, Gold GE, Hargreaves BA, Chaudhari AS. Technical Considerations for Semantic Segmentation in MRI using Convolutional Neural Networks. arXiv 1902.01977 [preprint] http://arxiv.org/abs/1902.01977. Posted February 5, 2019. Accessed February 5, 2020.
- 8.Norman B, Pedoia V, Majumdar S. Use of 2D U-net convolutional neural networks for automated cartilage and meniscus segmentation of knee MR imaging data to determine relaxometry and morphometry. Radiology 2018;288(1):177–185. [DOI] [PMC free article] [PubMed] [Google Scholar]
- 9.Ambellan F, Tack A, Ehlke M, Zachow S. Automated segmentation of knee bone and cartilage combining statistical shape knowledge and convolutional neural networks: data from the Osteoarthritis Initiative. Med Image Anal 2019;52(109):118. [DOI] [PubMed] [Google Scholar]
- 10.Gaj S, Yang M, Nakamura K, Li X. Automated cartilage and meniscus segmentation of knee MRI with conditional generative adversarial networks. Magn Reson Med 2020;84(1):437–449. [DOI] [PubMed] [Google Scholar]
- 11.Panfilov E, Tiulpin A, Klein S, Nieminen MT, Saarakkala S. Improving Robustness of Deep Learning Based Knee MRI Segmentation: Mixup and Adversarial Domain Adaptation. arXiv 1908.04126 [preprint] http://arxiv.org/abs/1908.04126. Posted August 12, 2019. Accessed February 5, 2020.
- 12.Chaudhari AS, Stevens KJ, Wood JP, et al. Utility of deep learning super-resolution in the context of osteoarthritis MRI biomarkers. J Magn Reson Imaging 2020;51(3):768–779. [DOI] [PMC free article] [PubMed] [Google Scholar]
- 13.Pan I, Thodberg HH, Halabi SS, Kalpathy-Cramer J, Larson DB. Improving Automated Pediatric Bone Age Estimation Using Ensembles of Models from the 2017 RSNA Machine Learning Challenge. Radiol Artif Intell 2019;1(6):e190053. [DOI] [PMC free article] [PubMed] [Google Scholar]
- 14.Desai A, Caliva F, Iriondo C, et al. A multi-institute automated segmentation evaluation on a standard dataset: findings from the International Workshop on Osteoarthritis Imaging segmentation challenge. Osteoarthritis Cartilage 2020;28(suppl 1):S304–S305. [Google Scholar]
- 15.Kellgren JH, Lawrence JS. Radiological assessment of osteo-arthrosis. Ann Rheum Dis 1957;16(4):494–502. [DOI] [PMC free article] [PubMed] [Google Scholar]
- 16.Peterfy CG, Schneider E, Nevitt M. The Osteoarthritis Initiative: report on the design rationale for the magnetic resonance imaging protocol for the knee. Osteoarthritis Cartilage 2008;16(12):1433–1441. [DOI] [PMC free article] [PubMed] [Google Scholar]
- 17.Balamoody S, Williams TG, Waterton JC, et al. Comparison of 3T MR scanners in regional cartilage-thickness analysis in osteoarthritis: a cross-sectional multicenter, multivendor study. Arthritis Res Ther 2010;12(5):R202. [DOI] [PMC free article] [PubMed] [Google Scholar]
- 18.Vincent G, Wolstenholme C, Scott I, Bowes M. Fully Automatic Segmentation of the Knee Joint using Active Appearance Models. In: MICCAI Workshop on Medical Image Analysis for the Clinic: A Grand Challenge, 2010; 224–230. http://www.ski10.org/data/2011-01-27-1131.pdf. [Google Scholar]
- 19.Mongan J, Moy L, Kahn CE. Checklist for Artificial Intelligence in Medical Imaging (CLAIM): A Guide for Authors and Reviewers. Radiol Artif Intell 2020;2(2):e200029. [DOI] [PMC free article] [PubMed] [Google Scholar]
- 20.Eckstein F, Collins JE, Nevitt MC, et al. Brief Report: Cartilage Thickness Change as an Imaging Biomarker of Knee Osteoarthritis Progression: Data from the Foundation for the National Institutes of Health Osteoarthritis Biomarkers Consortium. Arthritis Rheumatol 2015;67(12):3184–3189. [DOI] [PMC free article] [PubMed] [Google Scholar]
- 21.Iriondo C, Liu F, Calivà F, Kamat S, Majumdar S, Pedoia V. Towards Understanding Mechanistic Subgroups of Osteoarthritis: 8 Year Cartilage Thickness Trajectory Analysis. J Orthop Res 2020. 10.1002/jor.24849. Published online September 8, 2020. Accessed September 20, 2020. [DOI] [PubMed]
- 22.Wenger A, Wirth W, Hudelmaier M, et al. Meniscus body position, size, and shape in persons with and persons without radiographic knee osteoarthritis: quantitative analyses of knee magnetic resonance images from the Osteoarthritis Initiative. Arthritis Rheum 2013;65(7):1804–1811. [DOI] [PubMed] [Google Scholar]
- 23.Sharma L, Eckstein F, Song J, et al. Relationship of meniscal damage, meniscal extrusion, malalignment, and joint laxity to subsequent cartilage loss in osteoarthritic knees. Arthritis Rheum 2008;58(6):1716–1726. [DOI] [PubMed] [Google Scholar]
- 24.Tversky A. Features of similarity. Psychol Rev 1977;84(4):327–352. [Google Scholar]
- 25.Virtanen P, Gommers R, Oliphant TE, et al. SciPy 1.0: fundamental algorithms for scientific computing in Python. Nat Methods 2020;17(3):261–272 [Published correction appears in Nat Methods 2020;17(3):352.]. [DOI] [PMC free article] [PubMed] [Google Scholar]
- 26.Wirth W, Eckstein F, Kemnitz J, et al. Accuracy and longitudinal reproducibility of quantitative femorotibial cartilage measures derived from automated U-Net-based segmentation of two different MRI contrasts: data from the Osteoarthritis Initiative healthy reference cohort. MAGMA 2020. 10.1007/s10334-020-00889-7. Published online October 6, 2020. Accessed October 10, 2020. [DOI] [PMC free article] [PubMed]
- 27.Dieppe P, Lim K. Osteoarthritis and related disorders: clinical features and diagnostic problems. In: Klippel JH, Dieppe PA, eds. Rheumatology. 2nd ed. London, England: Mosby, 1998. [Google Scholar]
- 28.Wirth W, Larroque S, Davies RY, et al. Comparison of 1-year vs 2-year change in regional cartilage thickness in osteoarthritis results from 346 participants from the Osteoarthritis Initiative. Osteoarthritis Cartilage 2011;19(1):74–83. [DOI] [PMC free article] [PubMed] [Google Scholar]
- 29.Deniz CM, Xiang S, Hallyburton RS, et al. Segmentation of the Proximal Femur from MR Images using Deep Convolutional Neural Networks. Sci Rep 2018;8(1):16485. [DOI] [PMC free article] [PubMed] [Google Scholar]
- 30.Milletari F, Navab N, Ahmadi SA. V-Net: Fully Convolutional Neural Networks for Volumetric Medical Image Segmentation. In: 2016 Fourth International Conference on 3D Vision (3DV), Stanford, Calif, October 25–28, 2016. Piscataway, NJ: IEEE, 2016; 565–571. [Google Scholar]
- 31.Srivastava N, Hinton G, Krizhevsky A, Sutskever I, Salakhutdinov R. Dropout: a simple way to prevent neural networks from overfitting. J Mach Learn Res 2014;15(56):1929–1958. https://jmlr.org/papers/v15/srivastava14a.html. [Google Scholar]
- 32.Perslev M, Dam EB, Pai A, Igel C. One Network to Segment Them All: A General, Lightweight System for Accurate 3D Medical Image Segmentation. In: Shen D, Liu T, Peters TM, et al., eds. Medical Image Computing and Computer Assisted Intervention: MICCAI 2019. MICCAI 2019. Lecture Notes in Computer Science, vol 11765. Cham, Switzerland: Springer, 2019; 30–38. [Google Scholar]
- 33.Chen LC, Zhu Y, Papandreou G, Schroff F, Adam H. Encoder-Decoder with Atrous Separable Convolution for Semantic Image Segmentation. In: Ferrari V, Hebert M, Sminchisescu C, Weiss Y, eds. Computer Vision: ECCV 2018. ECCV 2018. Lecture Notes in Computer Science, vol 11211. Cham, Switzerland: Springer, 2018; 833–851. [Google Scholar]
- 34.Mortazi A, Karim R, Rhode K, Burt J, Bagci U. CardiacNET: Segmentation of Left Atrium and Proximal Pulmonary Veins from MRI Using Multi-view CNN. In: Descoteaux M, Maier-Hein L, Franz A, Jannin P, Collins D, Duchesne S, eds. Medical Image Computing and Computer-Assisted Intervention: MICCAI 2017. MICCAI 2017. Lecture Notes in Computer Science, vol 10434. Cham, Switzerland: Springer, 2017; 377–385. [Google Scholar]
- 35.de Brébisson A, Vincent P. The Z-loss: a shift and scale invariant classification loss belonging to the Spherical Family. arXiv 1604.08859 [preprint] http://arxiv.org/abs/1604.08859. Posted April 29, 2016. Accessed February 5, 2020.
Associated Data
This section collects any data citations, data availability statements, or supplementary materials included in this article.
Data Availability Statement
Training, validation, and testing partitions are available in Appendix E4 (supplement). Code and learned model weights for T1 (https://github.com/denizlab/2019_IWOAI_Challenge), T3 (https://github.com/perslev/MultiPlanarUNet), T5 (http://github.com/ali-mor/IWOAI_challenge), and T6 (http://github.com/ad12/DOSMA) have been made publicly available.


![Bland-Altman plots for, A, femoral, B, tibial, and, C, patellar cartilage thickness differences (per scan, Kellgren-Lawrence [KL] osteoarthritis grade computed at baseline) and, D–F, longitudinal thickness change (per patient, Kellgren-Lawrence osteoarthritis grade 2–4 at time point 1) for the six networks, compared with the ground truth. Positive difference values (y-axis) indicate overestimation of thickness or longitudinal thickness change. Negligible bias (dotted gray line) was observed for all three tissues among all networks for both metrics. The 95% limits of error (LoE) (between dashed gray lines) were broader for cross-sectional thickness difference than longitudinal differences. The LoE were relatively small for, D, femoral cartilage and, E, tibial cartilage compared with, F, patellar cartilage, indicating better longitudinal estimates. There was no systematic trend in networks underestimating or overestimating longitudinal thickness changes.](https://cdn.ncbi.nlm.nih.gov/pmc/blobs/a15e/8231759/9ca88dde60d4/ryai.2021200078fig5.jpg)
