eLife logoLink to eLife
. 2021 Jun 8;10:e62621. doi: 10.7554/eLife.62621

miR-125-chinmo pathway regulates dietary restriction-dependent enhancement of lifespan in Drosophila

Manish Pandey 1, Sakshi Bansal 1, Sudipta Bar 2, Amit Kumar Yadav 3, Nicholas S Sokol 4, Jason M Tennessen 4, Pankaj Kapahi 2,, Geetanjali Chawla 1,
Editors: Dario Riccardo Valenzano5, Jessica K Tyler6
PMCID: PMC8233039  PMID: 34100717

Abstract

Dietary restriction (DR) extends healthy lifespan in diverse species. Age and nutrient-related changes in the abundance of microRNAs (miRNAs) and their processing factors have been linked to organismal longevity. However, the mechanisms by which they modulate lifespan and the tissue-specific role of miRNA-mediated networks in DR-dependent enhancement of lifespan remains largely unexplored. We show that two neuronally enriched and highly conserved microRNAs, miR-125 and let-7 mediate the DR response in Drosophila melanogaster. Functional characterization of miR-125 demonstrates its role in neurons while its target chinmo acts both in neurons and the fat body to modulate fat metabolism and longevity. Proteomic analysis revealed that Chinmo exerts its DR effects by regulating the expression of FATP, CG2017, CG9577, CG17554, CG5009, CG8778, CG9527, and FASN1. Our findings identify miR-125 as a conserved effector of the DR pathway and open the avenue for this small RNA molecule and its downstream effectors to be considered as potential drug candidates for the treatment of late-onset diseases and biomarkers for healthy aging in humans.

Research organism: D. melanogaster

Introduction

Aging is characterized by a progressive decline in physiological function, which leads to an increased risk of chronic degenerative diseases and disabilities (Harman, 2003). Deregulated nutrient signaling is one of the key hallmarks of aging, and restricting nutrient intake or dietary restriction (DR) has been shown to enhance health and longevity in most species (Fontana and Partridge, 2015; Kapahi et al., 2017; Klass, 1977; Lin et al., 2002; López-Otín et al., 2013; McCay et al., 1989). More significantly, DR delays age-related pathologies such as diabetes, cardiovascular diseases, cancer, and neurodegenerative disorders (Anson et al., 2003; Klebanov, 2007; Kraus et al., 2019; Maswood et al., 2004; Mattison et al., 2012; Mattson and Wan, 2005; Wang et al., 2005). Emerging evidence from diverse model systems has implicated micro-ribonucleic acids (miRNAs) as critical components of signaling pathways that modulate lifespan by regulating mRNA turnover and translation (Boehm and Slack, 2005; Chawla et al., 2016; Liu et al., 2012; Verma et al., 2015). These 19–24 nucleotides long, single-stranded RNAs function by directing effector complexes to target mRNAs (Bartel, 2018). This recruitment of the miRNA ribonucleoprotein complexes (miRNPs) is facilitated by interactions between the miRNA and its target and results in silencing of the target mRNA (Guo et al., 2010; Kim, 2005). Since the interaction of a miRNA and its target occurs by imperfect base-pairing interactions, a single miRNA can target several mRNAs in a given context. Thus, these evolutionary conserved and dosage-sensitive effectors possess the key attributes to facilitate the complex metabolic reprogramming that occurs during DR. While studies in the C. elegans, mammalian cell culture, mouse, and primate model systems have reported regulation of miRNAs and their targets upon DR, there is no evidence to indicate whether the DR-mediated expression changes of the miRNAs and their downstream targets occur in the same tissue and whether modulating miRNA and their target mRNAs can result in lifespan extension by DR (Mercken et al., 2013; Pandit et al., 2014; Schneider et al., 2017; Zhang et al., 2019).

Our small RNAseq analysis of wild-type flies that were fed an AL and DR diet for 40 days identified let-7 and miR-125 to be upregulated by DR (to be published elsewhere). Here, we report that nutrient restriction in D. melanogaster upregulates let-7-Complex miRNAs (miR-100, let-7, and miR-125). Furthermore, let-7 and miR-125 loss-of-function mutations dampen the DR-dependent lifespan extension. The DR phenotype associated with loss of miR-125 is due to the derepression of its target, Chronologically Inappropriate Morphogenesis (chinmo). Our analysis reveals that chinmo codes for a nutrient-regulated transcription factor and its upregulation in the nervous system results in altered fat metabolism. Our analysis has also uncovered a previously unknown mechanism of nutrient-dependent post-translational control of Chinmo that may be linked to a novel nutrient-dependent non-nuclear role for this protein. Consistent with the miR-125 loss of function DR phenotype, increasing the dosage of human miR-125 in the fat body increased longevity. In summary, we have identified a conserved miRNA that mediates the effects of DR by promoting tissue-tissue communication demonstrating its potential as a DR mimetic agent.

Results

DR-dependent upregulation of let-7 and miR-125 increases lifespan

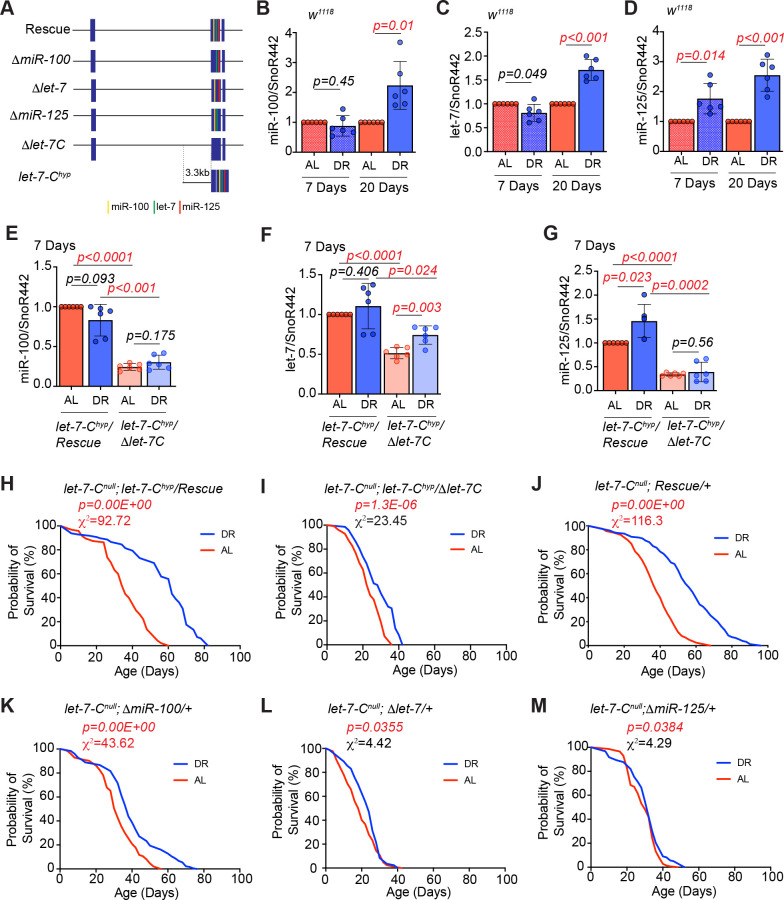
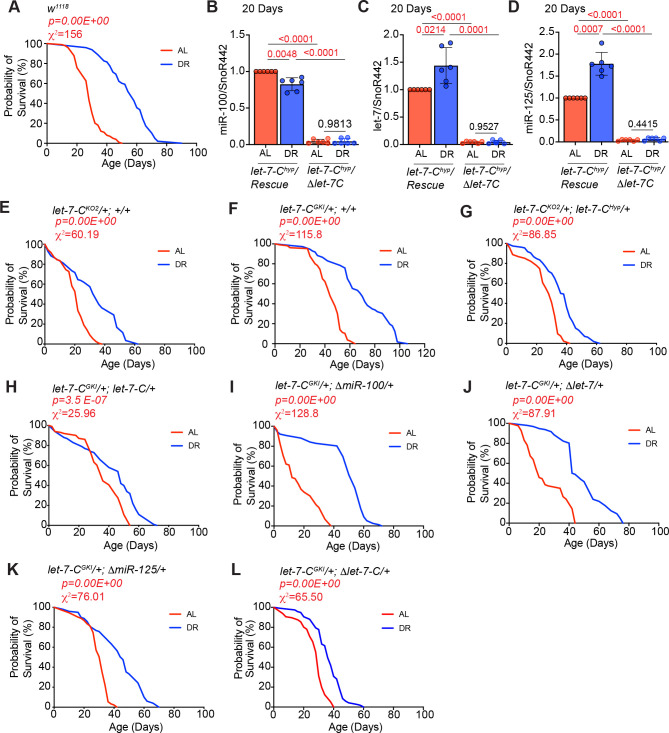
To examine whether let-7-Complex miRNAs mediate the effects of DR, we investigated whether DR affects the expression of these miRNAs in wild type (w1118) and let-7-C hypomorphic (let-7-Chyp) mutant. The let-7-C hypomorph (let-7-Chyp/Δlet-7-C: w1118; let-7-CGKI/let-7-CKO2, P{neoFRT}40A; P{w+, let-7-Cp3.3kb::cDNA} / {v+, let-7-C Δlet-7-C miRNAs}attP2) encodes the let-7-Complex cDNA driven by a 3.3 kb promoter fragment and a single copy of the ~18 kb let-7-C that lacks the mature miR-100, let-7 and miR-125 sequences in a transheterozygous let-7-Cnull mutant background (let-7-CKO2/let-7-CGKI) (Chawla et al., 2016; Chawla and Sokol, 2012; Sokol et al., 2008Figure 1A). The 3.3 kb enhancer fragment harbors three ecdysone response elements (EcREs) that we previously showed to be responsible for the developmental expression of the let-7-C primary transcript (Chawla and Sokol, 2012Figure 1A). The let-7-Chyp/Rescue (w1118; let-7-CGKI/let-7-CKO2, P{neoFRT}40A; P{w+, let-7-Cp3.3kb::cDNA} / {v+, let-7-C}attP2) line encodes a single copy of the let-7-Chyp and a single copy of the let-7-C wild-type transgene (Figure 1A). The let-7-Chyp/Δlet-7-C and let-7-Chyp/Rescue strains were generated by utilizing the crossing scheme represented in the supplement figure (Figure 1—figure supplement 1). Wild type (w1118), let-7-Chyp/Δlet-7-C, and the let-Chyp rescue flies were exposed to DR or AL conditions for 7 or 20 days, and quantitative reverse transcription polymerase chain reaction (qRT-PCR) analysis was performed with RNA extracted from whole animals. In young w1118 flies exposed to DR for 7 days, an increase in only miR-125 levels (176 ± 50%) was observed. Increasing the dietary restriction for 20 days led to a statistically significant increase in the levels of miR-100 (223 ± 80%), let-7 (171 ± 22%), and miR-125 (255 ± 54%) in w1118 flies (Figure 1B–D). Under AL conditions, young let-7-Chyp/Δlet-7-C mutants displayed lower levels of miR-100 (let-7-Chyp Rescue: AL = 100% and DR = 83.8 ± 19%; let-7-Chyp: AL = 24 ± 4% and DR = 30 ± 8%), let-7 (let-7-Chyp Rescue: AL = 100% and DR = 110 ± 28.5%; let-7-Chyp: AL = 51 ± 7% and DR = 74 ± 11.5%) and miR-125 (let-7-Chyp Rescue: AL = 100% and DR = 145.8 ± 32%; let-7-Chyp: AL = 34 ± 3.4% and DR = 39 ± 20%) relative to the let-Chyp rescue strain in AL and DR conditions (Figure 1E–G). Increasing the DR for 20 days led to an increase in the levels of let-7 (144 ± 32.5%) and miR-125 (178 ± 28%) in the let-7-Chyp rescue line. However, there was a significant decrease in the levels of miR-100 (AL = 5.7 ± 3.8% and DR = 3.6 ± 1.6%), let-7 (AL = 5.6 ± 2.9% and DR = 4.4 ± 3.6%) and miR-125 (AL = 3.3 ± 2.1% and DR = 4.5 ± 2.7%) in the let-7-Chyp mutants that were administered either AL or DR diet (Figure 1—figure supplement 2B–D). To examine whether the increase in let-7-C miRNAs was required for lifespan extension upon DR, we examined the survival of w1118, let-7-Chyp/Rescue, and let-7-Chyp/Δlet-7-C mutants fed an AL and DR diet (Figure 1H–I) (Figure 1—figure supplement 2A). Wild-type (w1118) flies fed a DR diet (blue line) lived significantly longer than wild-type flies that were fed an AL diet (red line) (p=0.00E + 00; Χ2 = 156) (Figure 1—figure supplement 2A). DR increased median lifespan by 50% in w1118 flies, by 42% in let-7-Chyp Rescue flies (p=0.00E + 00; Χ2 = 92.72) and by 17% in the let-7-Chyp mutant flies (p=1.30E-06; Χ2 = 23.45) (Figure 1, Figure 1—figure supplement 2A and Figure 1—source data 1). To confirm whether the DR phenotype was not due to the genetic background of the fly stocks used to prepare the experimental strains, the survival of the background strains (let-7-CGKI/+, let-7-CKO2/+, let-7-CKO2/+; let-7-Chyp/+ and let-7-CGKI/+; let-7-C/+) was measured under AL and DR conditions (Figure 1—figure supplement 2E–H and Figure 1—figure supplement 2—source data 1). Taken together, these data indicated that one or more of the let-7-C miRNAs were required for DR-mediated lifespan extension and a reduction in the levels of one or more of the miRNAs caused dampening of the DR-dependent increase in longevity.

Figure 1. let-7 and miR-125 are required for DR-dependent enhancement of lifespan.

(A) Schematic of the let-7-Complex (let-7-C) rescuing transgenes. The Drosophila let-7-Complex (let-7-C) locus is located on chromosome two and encodes a 2435 nucleotide long primary transcript that is processed into three evolutionary conserved miRNAs: miR-100, let-7 and miR-125. The let-7-C rescuing transgene includes a 17983 base-pair genomic fragment containing the let-7-C locus. The ΔmiR-100, Δlet-7, and ΔmiR-125 are derivatives of the let-7-C transgenes that lack the mature miR-100, let-7, and miR-125 sequences, respectively. The let-7-C hypomorph (let-7-Chyp) encodes the let-7-Complex cDNA driven by a 3.3 kb promoter fragment in a transheterozygous let-7-C null mutant background (let-7-CKO2/let-7-CGKI). The let-7-Chyp/Rescue line encodes a single copy of the let-7-Chyp and a single copy of the let-7-C wild-type transgene. The let-7-Chyp/Δlet-7-C line encodes a single copy of the let-7-Chyp and a single copy of the ~18 kb let-7-C that lacks the mature miR-100, let-7 and miR-125 sequences. The let-7-Cnull rescue line encodes a single copy of the ~18 kb let-7-C transgene in a let-7-C null mutant. (B-D) Quantitative RT-PCR of miR-100 (B), let-7 (C) and miR-125 (D) in wild-type (w1118) flies that were fed Ad libitum (AL) (pink pattern and pink solid bar) or DR diet (blue pattern and blue solid bar) for 7 days or 20 days. The levels of miR-100, let-7 and miR-125 increase upon 20d exposure to DR, while a significant increase in miR-125 is detected upon 7d of DR. Expression levels were normalized to SnoR442. Values are mean ± SD, n = 6. (E-G) Let-7-C hyp/Δlet-7-C flies express significantly reduced levels of miR-100, let-7, and miR-125 as compared to Let-7-C hyp rescue flies that were fed AL or DR diets for 7 days. For expression analysis of the rescue and mutant lines that were fed AL or DR diet for 20 days, please refer to Figure 1—figure supplement 2B-D. (H) The let-7-Chyp/Rescue flies show a significant increase in lifespan upon dietary restriction ( blue line; n = 97) as compared to let-7-Chyp/Rescue flies that were fed an ‘ad libitum’ diet ( red line; n = 95). (I) The let-7-Chyp mutants (AL, red line; n = 111 and DR, blue line; n = 72) display a reduced DR-dependent increase in lifespan compared to the rescue line. (J-M) Compared to the let-7-Cnull rescue flies (J) and ΔmiR-100 (K) flies, Δlet-7 (L) and ΔmiR-125 (M) flies displayed a significantly dampened DR-dependent lifespan extension upon DR (blue line) when compared to flies that were fed an AL diet (red line). For statistical comparison of survival curves, p values and Χ2 values were calculated with log rank test. Genotypes of strains used in this figure (B-D) w1118; (E-G, H) let-7-Cnull; let-7-Chyp/Rescue: w1118; let-7-CGKI/let-7-CKO2, P{neoFRT}40A; P{w+, let-7-Cp3.3kb::cDNA} / {v+, let-7-C}attP2; (E-G, I) let-7-Chyp//Δlet-7-C: w1118; let-7-CGKI/let-7-CKO2, P{neoFRT}40A; P{w+, let-7-Cp3.3kb::cDNA} / {v+, let-7-C Δlet-7-C miRNAs}attP2; (J) let-7-Cnull; Rescue/+: w1118; let-7-CGKI/let-7-CKO2, P{neoFRT}40A; {v+, let-7-C} attP2 /+; (K) let-7-Cnull; ΔmiR-100/+: w1118; let-7-CGKI/let-7-CKO2, P{neoFRT}40A; {v+, let-7-C ΔmiR-100} attP2 / +; (L) let-7-Cnull; Δlet-7: w1118; let-7-CGKI/let-7-CKO2, P{neoFRT}40A; {v+, let-7-C Δlet-7} attP2 / +; (M) let-7-Cnull; ΔmiR-125: w1118; let-7-CGKI/let-7-CKO2, P{neoFRT}40A; {v+, let-7-C ΔmiR-125} attP2 / +.

Figure 1—source data 1. Lifespan analysis of let-7-Complexhyp, let-7-Complexhyp rescue, let-7-Complexnull rescue, ΔmiR-100, Δlet-7, and ΔmiR-125 mutant lines.
Figure 1—source data 2. Survival proportions for strains used in Figure 1.

Figure 1.

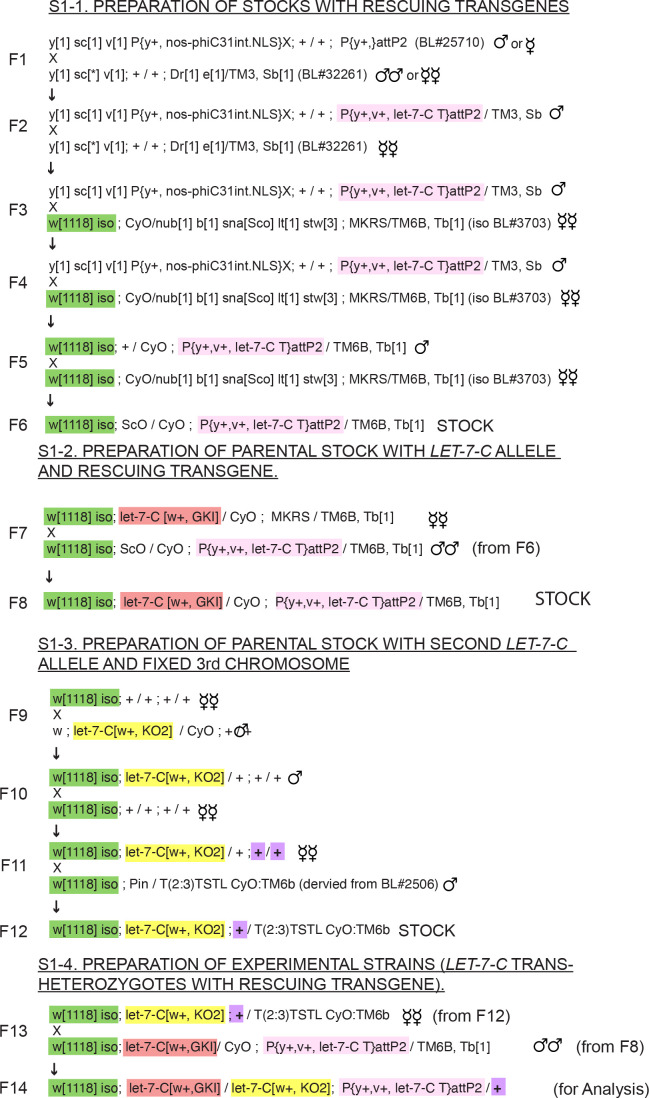
Figure 1—figure supplement 1. Scheme for generation of experimental strains used in Figures 1 and 2.

Figure 1—figure supplement 1.

This analysis compared flies that were generated using a scheme that ensured that they had identical genetic backgrounds. Flies that were analyzed (F14) were trans-heterozygous for two different let-7-C null alleles (dark pink and yellow), ensuring that phenotypes were not due to recessive mutations on either let-7-C mutant chromosome. In addition, third chromosomes that contained differing rescuing transgenes (light pink) were derived in parallel from the same population of flies. Finally, all flies had a common X-chromosome (green), derived from an isogenized stock. (S1-1) All rescuing transgenes, including the wildtype rescuing transgene as well as let-7 and miR-125 deleted versions, were injected into embryos from the same population of BL#25710. Resulting progeny were backcrossed twice to BL#32261 in order to select and balance vermillion+ transformants (F1 and F2). Single transformants were subsequently backcrossed to an isogenized version of BL#3703 three times (F3-F5) in order to make balanced stocks with isogenized X chromosomes (F6). (S1-2) Stocks with differing rescuing transgenes were crossed to the same population of a stock that contained the let-7-CKO2 chromosome, an isogenized X chromosome, and two 3rd chromosome balancers. The let-7-CKO2 stock used in F7 was generated in a similar fashion as the rescuing transgenes stocks, by backcrossing three times to an isogenized version of BL#3703. Resulting stocks (F8) had common X (green), 2nd (yellow) and 3rd (light pink) chromosomes and were used in F13 to generate the experimental strains. (S1-3) A second let-7-C allele, let-7-CGKI, was prepared by outcrossing twice to an isogenized stock, and then crossed to an isogenized stock containing a T (2:3) Cyo-TM6b compound chromosome. The let-7-C allele was selected based on mini-white, and the T (2:3) Cyo-TM6b balancer was selected based on the dominant Humoral marker. The resulting stock with a fixed second and third chromosome was amplified and used as the source for all virgins in the crosses that yielded the flies for analysis. (S1-4). Flies for analysis were generated by crossing virgins of the stock generated in F12 with males of stocks generated in F8 that harbored differing rescuing transgenes. For generation of the let-7-Chyp rescue and mutant line the let-7-Chyp transgenic was combined with let-7-CKO2 stock in the step S1-3. The remaining steps were similar to the scheme described.
Figure 1—figure supplement 2. Lifespan analysis controls and expression analysis of strains used in Figure 1.

Figure 1—figure supplement 2.

(A) w1118 flies show a significant increase in lifespan upon DR (blue line; n = 98; median lifespan = 58) as compared to w1118 flies that were fed an ‘ad libitum’ diet (red line; n = 99; median lifespan = 28). (B–D) Quantitative RT-PCR of miR-100 (B), let-7 (C) and miR-125 (D) in let-7-C hyp/Δlet-7-C and let-7-Chyp/Rescue flies that were fed AL or DR diet for 20 days. Let-7-C hyp/Δlet-7-C flies express dramatically reduced levels of miR-100, let-7, and miR-125 as compared to Let-7-C hyp rescue flies that are fed AL or DR diets for 7 days. Expression levels were normalized to SnoR442. Values are mean ± SD, n = 6. (E–M) Lifespan analysis to examine the effect of genetic background of strains used in Figure 1. Crosses were established between w1118 flies, and the background strains and the progeny were sorted into two groups (AL and DR). (E) Let-7-CKO2/+; +/+ flies live significantly longer on DR diet (AL, red line, n = 110, median lifespan = 22; DR, blue line, n = 113, median lifespan = 34). (F) Let-7-CGKI/+; +/+ flies live significantly longer on DR diet (AL, red line, n = 106, median lifespan = 44; DR, blue line, n = 112, median lifespan = 70). (G) Let-7-CKO2/+; let-7-Chyp/+ flies live significantly longer on DR diet (AL, red line, n = 139, median lifespan = 28; DR, blue line, n = 160, median lifespan = 40). (H) Let-7-CGKI/+; let-7-C/+ flies live significantly longer on DR diet (AL, red line, n = 102, median lifespan = 36; DR, blue line, n = 100, median lifespan = 48). (I) Let-7-CGKI/+; ΔmiR-100/+ flies live significantly longer on DR diet (AL, red line, n = 103, median lifespan = 12; DR, blue line, n = 79, median lifespan = 50). (J) Let-7-CGKI/+; Δlet-7/+ flies live significantly longer on DR diet (AL, red line, n = 83, median lifespan = 20; DR, blue line, n = 96, median lifespan = 43). (K) Let-7-CGKI/+; ΔmiR-125/+ flies live significantly longer on DR diet (AL, red line, n = 91, median lifespan = 32; DR, blue line, n = 100, median lifespan = 46). (M) Let-7-CGKI/+; Δlet-7-C/+ flies live significantly longer on DR diet (AL, red line, n = 96, median lifespan = 30; DR, blue line, n = 117, median lifespan = 36). For statistical comparison of survival curves, p values and Χ2 values were calculated with log rank test. Genotypes of strains used in this figure (A) w1118; (B-D) Let-7-Cnull; let-7-Chyp/Rescue: w1118; let-7-CGKI/let-7-CKO2, P{neoFRT}40A; P{w+, let-7-Cp3.3kb::cDNA} / {v+, let-7-C}attP2; (B-D) Let-7-Chyp//Δlet-7-C: w1118; let-7-CGKI/let-7-CKO2, P{neoFRT}40A; P{w+, let-7-Cp3.3kb::cDNA} / {v+, let-7-C Δlet-7-C miRNAs}attP2; (E) Let-7-CKO2/+; +/+: w1118; let-7-CKO2, P{neoFRT}40A/+; +/+; (F) let-7-CKO2/+; +/+: w1118; let-7-CGKI/+; +/+; (G) Let-7-CKO2/+; let-7-Chyp/+: w1118; let-7-CKO2, P{neoFRT}40A/+; P{w+, let-7-Cp3.3kb::cDNA}/+; (H) let-7-CGKI/+; let-7-C/+: w1118; let-7-CGKI/+; {v+, let-7-C}attP2/+; (I) let-7-CGKI/+; ΔmiR-100/+: w1118; let-7-CGKI/+; {v+, let-7-C ΔmiR-100} attP2 /+; (J) Let-7-CGKI/+; Δlet-7/+: w1118; let-7-CGKI/+;{v+, let-7-C Δlet-7} attP2 /+; (K) Let-7-CGKI/+; ΔmiR-125/+: w1118; let-7-CGKI/+; {v+, let-7-C ΔmiR-125} attP2 / +; (L) let-7-CGKI/+; Δlet-7-C/+: w1118; let-7-CGKI/+;{v+, let-7-C Δlet-7-C} attP2 /+.
Figure 1—figure supplement 2—source data 1. Lifespan analysis of let-7-Complexhyp, let-7-Complexhyp rescue, let-7-Complexnull rescue, ΔmiR-100, Δlet-7, and ΔmiR-125 mutant lines.
Figure 1—figure supplement 2—source data 2. Survival proportions for strains used in Figure 1.

To determine the specific contribution of miR-100, let-7, and miR-125 in DR-mediated enhancement of lifespan, we measured survival of genetically identical control and miR-100, let-7, and miR-125 null mutant flies reared on AL or DR diet (Figure 1J–M). The rescue and the mutant lines were generated by expressing a single copy of the wild type, ΔmiR-100, Δlet-7, or ΔmiR-125 transgene in a transheterozygous let-7-Cnull mutant background (let-7-CKO2/let-7-CGKI). The let-7-C rescuing (wild type) transgene encodes a 17983 base-pair genomic fragment containing the let-7-C locus. The ΔmiR-100, Δlet-7 and ΔmiR-125 are derivatives of the let-7-C transgenes that lack the mature miR-100, let-7 and miR-125 sequences, respectively. The genetic background of the control and mutant flies that were compared were identical and the crossing scheme used for the generation of these strains is described in our previous publication and the supplement figure (Figure 1—figure supplement 1Chawla et al., 2016). let-7-Cnull Rescue (p=0.00E + 00; Χ2 = 116.3) and ΔmiR-100 (p=0.00E + 00; Χ2 = 43.62) female flies fed a DR diet (blue line) lived significantly (let-7-Cnull Rescue DR: 47% increase median lifespan; ΔmiR-100 DR: 18.75% increase in median lifespan) longer than flies that were fed an AL diet (Figure 1J,K and Figure 1—source data 1). Δlet-7 mutants exhibited a significantly dampened lifespan extension when fed a DR diet (p=0.0355; Χ2 = 4.42). Though a 33% increase in median lifespan was observed, the DR-fed flies had a 4.7% decrease in maximum lifespan compared to the AL-fed flies (Figure 1L and Figure 1—source data 1). In contrast, ΔmiR-125 mutants failed to exhibit lifespan extension when fed a DR diet, and a 0% increase in median lifespan was observed for ΔmiR-125 flies (p=0.0384; Χ2 = 4.29) that were fed a DR diet (Figure 1M and Figure 1—source data 1). To confirm that the reduction in DR-dependent lifespan extension was specifically due to loss of let-7 and miR-125 and not an effect of the genetic background of the strains used, the survival of the background strains (let-7-CGKI/+, let-7-CKO2/+, let-7-CGKI/+; let-7-C/+, let-7-CGKI/+; ΔmiR-100, let-7-CGKI/+; Δlet-7, let-7-CGKI/+; ΔmiR-125, let-7-CGKI/+; Δlet-7-C) was measured under AL and DR conditions (Figure 1—figure supplement 2E–L and Figure 1—figure supplement 2—source data 1). A significant DR-dependent increase in lifespan was observed for all the lines tested. These data confirmed the requirement of miR-125 and let-7 in DR-dependent extension of lifespan.

miR-125 regulates DR by repressing chinmo

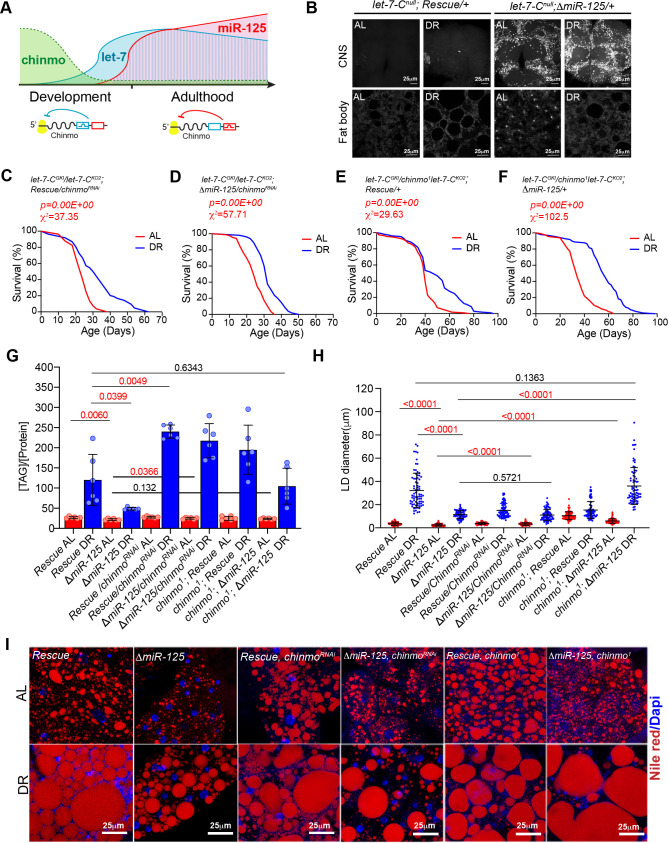
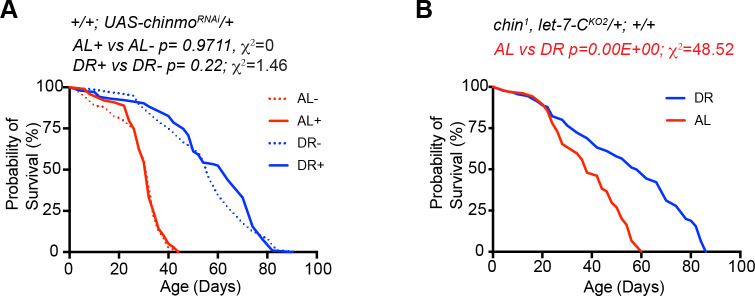
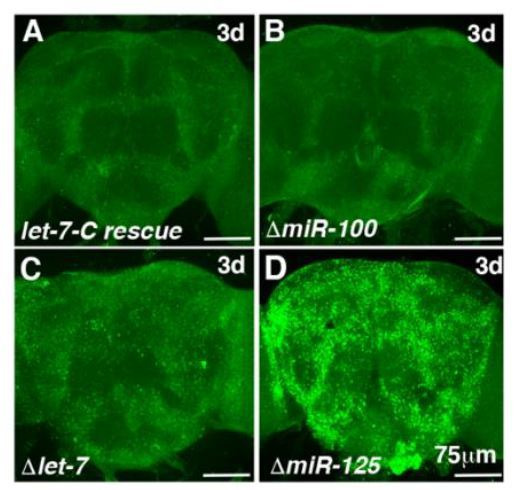
MicroRNAs function by repressing their target mRNAs. We had previously shown that two of the let-7-Complex miRNAs, miR-125 and let-7 differentially target the mRNA of a BTB-zinc finger protein-coding gene referred to as Chronologically Inappropriate Morphogenesis (chinmo) (Chawla et al., 2016; Zhu et al., 2006). The 3’ untranslated region of chinmo mRNA has several let-7 and miR-125-binding sites (Wu et al., 2012). The let-7-C miRNAs are not detected during early development but their upregulation during larval-to-pupal transition is mediated by transcriptional activation of the let-7-C primary transcript by the Ecdysone receptor and coincides with the downregulation of Chinmo (Chawla and Sokol, 2012; Wu et al., 2012). Let-7-C null mutants display defects in temporal transitions in mushroom body neuron identities due to elevated Chinmo levels (Wu et al., 2012). Our previously published functional and expression analysis of let-7 and miR-125 mutants showed that chinmo is differentially regulated by these two let-7-C miRNAs: with let-7 being the predominant repressor of chinmo during metamorphosis and miR-125 silencing chinmo in adulthood (Figure 2AChawla et al., 2016). Consistent with our previously published data, Chinmo is upregulated in the dissected adult brains of miR-125 null mutants that are fed an AL or DR diet for 5 days (Figure 2B, upper panels). To test whether the DR-dependent phenotypes of the miR-125 loss of function mutant were due to lack of post-transcriptional silencing of its previously validated target chinmo, we measured survival of strains in which dosage of chinmo was reduced genetically by a let-7-C Gal4 (let-7-CGKI) driven UAS chinmoRNAi transgene or a chinmo1 loss-of-function mutant in the let-7-C rescue flies and miR-125 mutants (Figure 2C–F and Figure 2—source data 1). Lowering chinmo levels suppressed the DR-dependent lifespan phenotypes of miR-125 mutants (Compare Figure 1M with Figure 2D and F). Although, reducing chinmo specifically in let-7-C expressing (let-7-C Gal4) cells was able to increase the median lifespan by 25% (compared to 0% in miR-125 mutants), a 41.3% increase in median lifespan was observed when chinmo levels were reduced genetically (chinmo1) in all chinmo expressing cells (Figure 2F and Figure 2—source data 2). The let-7-C Gal4 driver alone control flies displayed a statistically significant DR-dependent increase in lifespan (Figure 1—figure supplement 2F). The UAS chinmo RNAi control with and without RU-486 indicated that RU-486 had no significant effect on lifespan and let-7-C KO2, chinmo1 control crosses displayed a DR-dependent increase in lifespan (Figure 2—figure supplement 1A–B, Figure 2—figure supplement 1—source data 12). These data demonstrated a role for chinmo in DR-dependent lifespan extension by miR-125. Furthermore, these data indicated that chinmo played a wider role in regulating DR-dependent lifespan extension which is not just limited to miR-125 expressing cells.

Figure 2. Reducing chinmo (ΔmiR-125, chinmoRNAi and ΔmiR-125, chinmo1) levels in miR-125 mutants suppresses the loss of DR-mediated increase in lifespan extension and decrease in triglyceride levels.

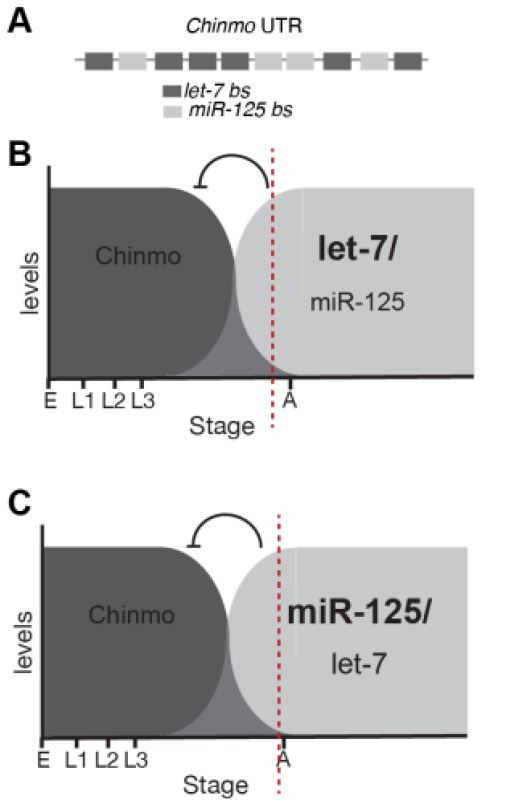
(A) Schematic representing post-transcriptional repression of chinmo mRNA by let-7 and miR-125 adapted from our previously published study (Chawla et al., 2016). chinmo mRNA 3’untranslated region (3’UTR) encodes multiple binding sites for let-7 and miR-125 miRNAs and is differentially regulated by let-7 and miR-125. Let-7 is the predominant repressor of chinmo during development and miR-125 silences chinmo in the adult stage. (B) Loss of miR-125 leads to derepression of chinmo in the adult brain and a concomitant increase in Chinmo signal in the adult fat tissue (Compare top two left panels with top two right panels). Confocal images of dissected tissues (brain and fat body) from adult let-7-C null rescue and miR-125 mutant flies that were fed ad libitum (AL) or nutrient restricted (DR) diet for 5 days. (C, D) Rescue, UAS chinmoRNAi flies and ΔmiR-125, UAS chinmoRNAi flies show a 25% increase in median lifespan upon DR ( blue line) (Rescue, UAS chinmoRNAi, χ2 = 37.35; ΔmiR-125, UAS chinmoRNAi, χ2 = 57.71). (E-F) Rescue, chinmo1 flies display a 20% increase in median lifespan upon DR (blue line) and ΔmiR-125, chinmo1 flies display a 41% increase in DR-dependent increase in median lifespan (compare red and blue curves) (Rescue, chinmo1 χ2 = 29.63; ΔmiR-125, chinmo1 χ2 = 102.5). For statistical comparison of survival curves, p values and χ2 were calculated with log rank test. (G) Quantitation of triglyceride (TAG) stored levels in Rescue line, ΔmiR-125 line, Rescue, UAS chinmoRNAi line, ΔmiR-125, UAS chinmoRNAi line, Rescue, chinmo1 line and ΔmiR-125, chinmo1 line, AL (Red bars) and DR (Blue bars) fed 20-day-old flies. The bars represent mean ± SD, n = 6, p value was calculated with unpaired t-test with Welch’s correction. p Values are indicated in the graph. The TAG values were normalized to protein levels. The ΔmiR-125 flies display significantly lower stored triglycerides compared to the genetically identical rescue line in both AL and DR diets. Reducing chinmo levels by RNAi or by reducing a copy of chinmo led to an increase in TAG levels upon DR. Consistent with the survival analysis, the increase in TAG levels in ΔmiR-125, chinmo1 flies TAG was similar to the increase in rescue flies (p value=0.6343), indicating that reducing a copy of chinmo was sufficient to rescue the TAG levels and the rescue was better than what was obtained with knockdown of chinmo by RNAi in cells that express miR-125. (H, I) Fat bodies/abdomens of female flies were dissected and stained for the content and diameter of lipid droplet (LD) (red are lipid droplets stained with Nile red and blue is Dapi). Scale bar, 25 μm. (I) Quantitation of lipid droplet (LD) diameter in (H). Quantitation of 15 largest LDs in five samples per condition. Error bars represent mean ± SD and p values are indicated in the figure. The reduction in lipid droplet size in ΔmiR-125 mutants that are fed an AL and DR diet is rescued by reducing the dosage of chinmo in ΔmiR-125, chinmo1 and not by chinmoRNAi. Genotypes of strains used in this figure: (B, G-I) let-7-Cnull; Rescue/+: w1118; let-7-CGKI/let-7-CKO2, P{neoFRT}40A; {v+, let-7-C} attP2 /+; (B, G-I) let-7-Cnull; ΔmiR-125: w1118; let-7-CGKI/let-7-CKO2, P{neoFRT}40A; {v+, let-7-C ΔmiR-125} attP2 / +; (C, G-I) let-CGKI/KO2; Rescue, chinmoRNAi: w1118; let-7-CGKI/let-7-CKO2, P{neoFRT}40A; {v+, let-7-C} attP2/P{w+, UAS-chinmoRNAi 148}VK00033; (D, G-I) let-CGKI/KO2; ΔmiR-125, chinmoRNAi: w1118; let-7-CGKI/let-7-CKO2, P{neoFRT}40A; {v+, let-7-C ΔmiR-125} attP2/P{w+, UAS-chinmoRNAi 148}VK00033; (E, G-I) let-7-CGKI/chinmo1let-7-CKO2; Rescue/+: w1118; let-7-CGKI/chinmo1, let-7-CKO2, P{neoFRT}40A; {v+, let-7-C} attP2 /+; (F, G-I) let-7-CGKI/chinmo1,let-7-CKO2; ΔmiR-125/+: w1118; let-7-CGKI/chinmo1, let-7-CKO2, P{neoFRT}40A; {v+, let-7-C ΔmiR-125} attP2 / +.

Figure 2—source data 1. Lifespan analysis of rescue, chinmoRNAi and ΔmiR-125, chinmoRNAi strains.
Figure 2—source data 2. Lifespan analysis of rescue, chinmo1 and ΔmiR-125, chinmo1 strains.
Figure 2—source data 3. Survival proportions for strains used in Figure 2.

Figure 2.

Figure 2—figure supplement 1. Effect of genetic background and/or RU-486 in UAS chinmoRNAi/+ and chinmo1/+ strains used for analysis in Figure 2.

Figure 2—figure supplement 1.

(A) UAS chinmoRNAi/+ flies show a significant increase in lifespan upon DR (DR+, blue dotted line; n = 103; median lifespan = 64 d; DR-, blue solid line; n = 96; median lifespan = 56 d) as compared to UAS chinmoRNAi/+ flies that were fed an ‘ad libitum’ diet (AL+, red dotted line; n = 99; median lifespan = 32 d; AL-, red solid line; n = 108; median lifespan = 32 d). RU-486 does not significantly change the lifespan of UAS chinmoRNAi/+ flies in AL or DR (p values and , χ2 values are indicated in the figure panel). (B) chinmo1, let-7-CKO2/+ flies show a significant increase in lifespan upon DR (DR, blue line; n = 90; median lifespan = 58) as compared to chinmo1, let-7-CKO2/+ flies that were fed and AL diet (red line; n = 104; median lifespan = 38 d). For statistical comparison of survival curves, p values and χ2 were calculated with log rank test. Genotypes of strains used in this figure: (A) UAS chinmoRNAi/+: w1118; +/+; P {w+, UAS-chinmoRNAi 148} VK00033/+; (B) chinmo1, let-7-CKO2/+: w1118; chinmo1, let-7-CKO2, P{neoFRT}40A/+; +/+.
Figure 2—figure supplement 1—source data 1. Lifespan analysis of flies encoding a single copy of the UAS chinmoRNAi transgene and a strain that is heterozygous for let-7-C and chinmo.
Figure 2—figure supplement 1—source data 2. Survival proportions for strains used in Figure 2—figure supplement 1.

DR imposed by restricting yeast in the diet enhances lipid content (Bradley and Simmons, 1997; Katewa et al., 2012) and this increase in lipid content enhances lipid turnover under DR and is required for the DR-dependent lifespan extension in Drosophila (Katewa et al., 2012). Since miR-125 mutants displayed a DR phenotype, we quantitated the levels of total triglycerides (TAG) in whole bodies of rescue and miR-125 mutants that were exposed to AL or DR diet for 20 days. In contrast to the rescue strain, the miR-125 mutants displayed a significant drop in TAG levels in both AL (83 ± 8.5%) and DR (40.5 ± 21.6%) conditions (Figure 2G). In a parallel experiment, we also examined lipid droplets in the fat body of adult flies by staining with nile red. Consistent with the TAG analysis, the miR-125 mutants displayed a significant drop in the diameter of lipid droplets compared to the rescue strain in both AL (35% decrease in the median) and DR (59% decrease in median) diet (Figure 2H–I). Thus, our analysis demonstrates that miR-125 regulates the shift in lipid metabolism upon DR. Consistent with the lifespan data, reducing chinmo dosage in ΔmiR-125 flies resulted in an increase in the TAG levels and lipid droplet diameter (Figure 2G–I). However, a much greater increase in TAG levels was observed in let-7-C Gal4> ΔmiR-125, UAS chinmoRNAi (113.3 ± 8.7% in AL and 446 ± 86.9% increase in DR relative to ΔmiR-125) flies as compared to the ΔmiR-125, chinmo1 flies (108.3 ± 6.6% in AL and 214.8 ± 90.96% increase in DR) (Figure 2G). However, while RNAi for chinmo in let-7-C Gal4> ΔmiR-125, UAS chinmoRNAi flies doubled the TAG levels that were observed in the Rescue line under DR conditions (93.65 ± 7.2% in AL and 180.7 ± 32.5.9% increase in DR relative to Rescue flies), genetically reducing chinmo levels in ΔmiR-125, chinmo1 restored the TAG to the control/rescue levels in DR conditions (89.5 ± 5.45% in AL and 87.04 ± 32.9% increase in DR relative to Rescue flies). These differences could have arisen due to other unknown miR-125 targets operating in the DR pathway or due to mir-125-independent regulation of chinmo upon DR in cells that do not express miR-125 (Figure 2G). Reducing chinmo levels in miR-125 mutant flies that were fed a DR diet rescued the decrease in TAG levels observed in miR-125 mutants. The lipid droplet size in ΔmiR-125, chinmo1 flies that were fed a DR diet did not vary significantly from the lipid droplet size in the Rescue flies upon DR (Figure 2H–I). However, the lipid droplet size was not rescued in let-7-C Gal4> ΔmiR-125, UAS chinmoRNAi flies (Figure 2H–I). Thus, reducing chinmo dosage genetically rescued the DR phenotype of miR-125 mutants more effectively than knocking down chinmo levels in miR-125 expressing cells. Taken together, these data revealed that chinmo acts downstream of miR-125 to regulate lifespan extension upon DR.

DR induces chinmo in the adult fat tissue

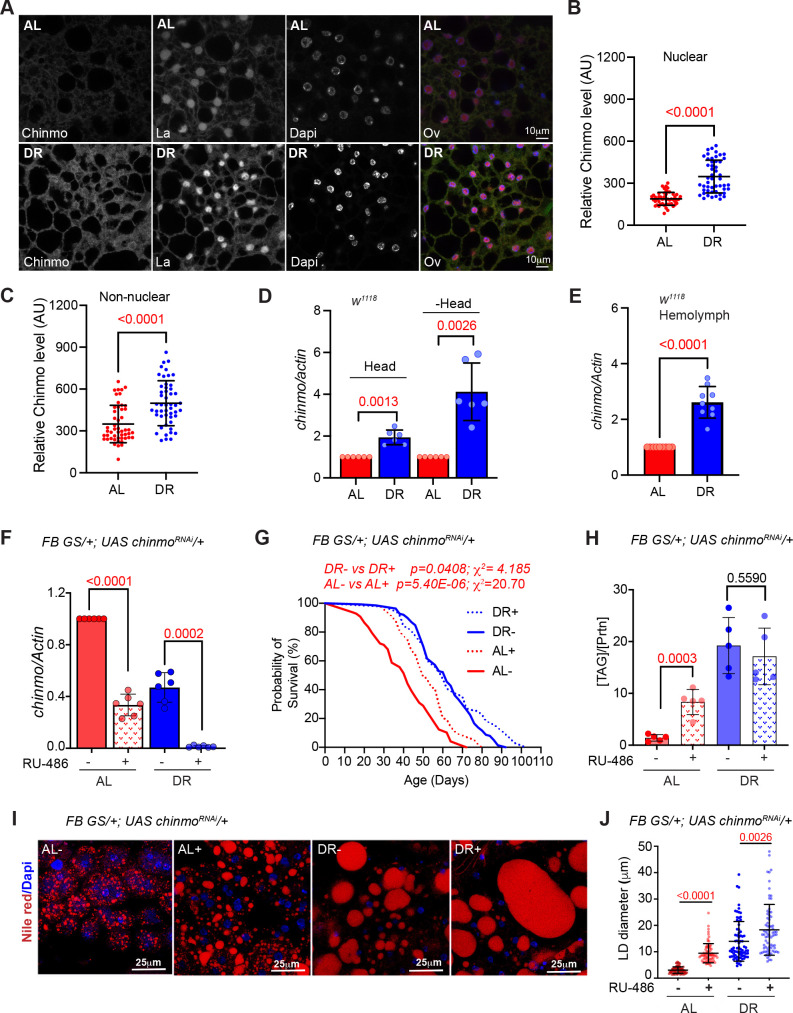
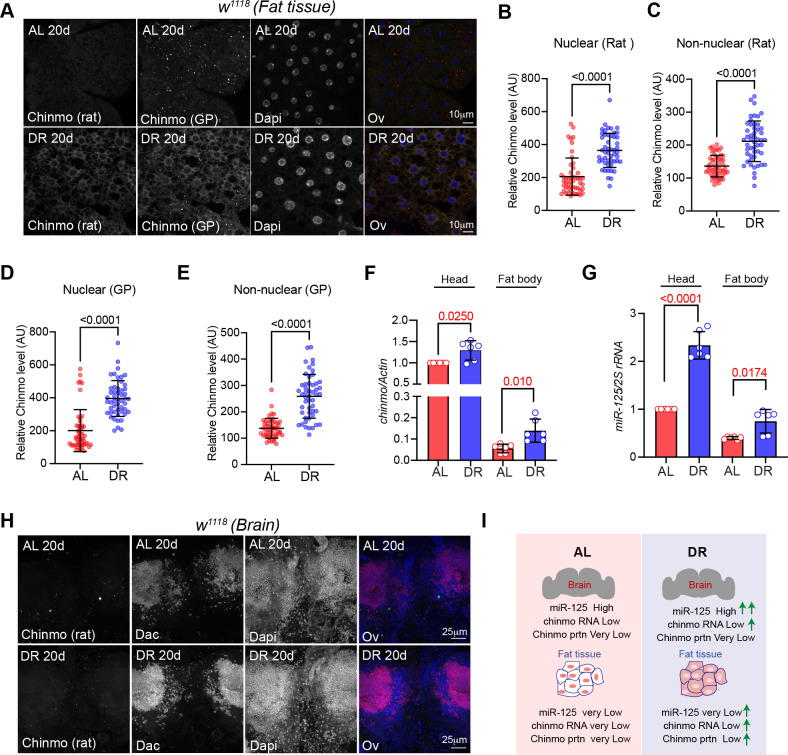
To examine whether DR-mediated regulation of chinmo in the adult fat tissue was required for extension of lifespan, we examined whether Chinmo protein was upregulated in the fat tissue of miR-125 mutants, Rescue and w1118 flies that were fed an AL and DR diet (Figure 2B, bottom panels and Figure 3A–C). Immunostaining of dissected abdominal fat tissue with anti-Chinmo antibody indicated an increased nuclear signal for Chinmo in miR-125 mutant adult fat tissue dissected from flies that were fed an AL diet (Figure 2B). In contrast, an increased non-nuclear/peripheral signal was detected in both Rescue and miR-125 mutant fat tissue of flies that were fed a DR diet (Figure 2B). These data indicated that nutrient restriction caused redistribution of Chinmo to the non-nuclear compartments. To explore whether Chinmo was upregulated by DR in the fat tissue, we examined Chinmo protein and mRNA in flies that expressed wild-type levels of miR-125. Abdominal fat tissue was dissected from w1118 flies that were fed an AL or DR diet for 10 days. The tissues were fixed and immunostained with an anti-Chinmo antibody to detect Chinmo and anti-La antibody was used as a control for immunostaining along with Dapi for nuclear staining (Figure 3A). w1118 flies that were fed a DR diet displayed a much stronger immunostaining signal for Chinmo in the fat tissue than flies that were fed an AL diet for 10 days (Figure 3A). These data were recapitulated in fat tissue obtained from flies that were fed an AL or DR diet for 20 days and with two different antibodies to detect Chinmo (Figure 3—figure supplement 1A). To distinguish whether the increase in the intensity of Chinmo immunostaining occurs in the nuclear or peripheral compartments of the cell, the intensity of the signal generated by immunostaining was quantitated in nuclear and non-nuclear regions (Figure 3B–C; Figure 3—figure supplement 1B–E). DR increased the expression of Chinmo in both nuclear and non-nuclear regions of the fat tissue. While w1118 flies that were fed an AL diet expressed 188.7 ± 46.17 Arbitrary units (AUs) of Chinmo in the nuclear region, feeding flies a DR diet increased nuclear expression of Chinmo to 347.58 ± 117.18 AUs (Figure 3BFigure 3—figure supplement 1B and D). An increase in the intensity of Chinmo signal was detected in non-nuclear regions upon DR (Non-nuclear AL: 349.19 ± 133.90 AU; Non-nuclear DR: 498.56 ± 160.89 AU)(Figure 3C; Figure 3—figure supplement 1C and E). Wild-type (w1118) flies that were fed a DR diet for 10 days expressed higher levels of chinmo RNA than the AL-fed flies (Figure 3D). The magnitude of increase was higher in tissues other than head despite lower levels of the transcript in decapitated tissue as DR led to a 1.94 ± 0.35 fold increase in head tissue and a 4.11 ± 1.37 fold increase in decapitated body tissue (Figure 3D). We previously found miR-125 to be upregulated upon DR (Figure 1D).

Figure 3. Chinmo is nutrient-dependent downstream effector of the DR-pathway.

(A) Chinmo protein levels increase in adult fat tissue of w1118 flies that were fed a DR diet for 10 days. Confocal images of dissected fat body from adult w1118 flies that were fed an AL or DR diet for 10 days. Immunostaining was performed with anti-Chinmo, anti-La (nuclear protein), and Dapi. Scale bar, 10 μm. (B, C) Quantitation of Chinmo protein levels in adult fat tissue nuclear and peripheral (non-nuclear) regions as determined by measuring pixel intensity in 10 cells in five samples per condition. Error bars represent mean ± SD and p values were calculated by unpaired t test with Welch’s correction. (D) DR induces expression of chinmo in w1118 flies. RT-PCR quantitation of chinmo mRNA in head and decapitated body tissue (-Head) of w1118 flies that were fed an AL or DR diet for 10 days. (E) DR increases circulating levels of chinmo mRNA in w1118 flies. RT-PCR quantitation of chinmo mRNA in the hemolymph of w1118 flies that were fed an AL or DR diet for 10 days. (F-J) Reducing chinmo levels in the adult fat body increases lifespan and enhances TAG levels under AL conditions. (F) A transgene expressing a short hairpin to knockdown chinmo was expressed in the adult fat body using the steroid (RU-486) inducible gene switch Gal4 driver. Quantitative RT-PCR of chinmo from abdominal fat tissue of FB GS >UAS chinmoRNAi flies in presence of RU-486 (bars with red and blue pattern) or in absence of RU-486 (bars with solid red and blue color) in flies that were fed Ad libitum (AL) (red) or DR diet (blue) for 10 days. Expression levels were normalized to Actin. Values are mean ± SD, n = 6. p Values are indicated in the graph and were calculated by unpaired t test with Welch’s correction. (G) Knockdown of chinmo in the adult fat tissue resulted in a 16% increase in the median lifespan of flies that were fed an AL diet (compare red solid line with the red dotted line) (Figure 3—source data 1A–B has details of experimental repeat). For statistical comparison of survival curves, p values and χ2 were calculated with log rank test. (H) Quantitation of triglyceride (TAG) stored levels in AL-RU-486 (Solid red bars), AL + RU-486 (Red pattern bars), DR-RU-486 (Solid blue bars) and DR +RU-486 (Blue pattern bars) fed 20-day-old FB GS >UAS chinmoRNAi flies. The bars represent mean ± SD, n = 5, p value was calculated with two tailed t-test. Significance levels: ***p<0.001. (I) Fat bodies of FB GS >UAS chinmoRNAi female flies were dissected and stained for the content and diameter of lipid droplet (LD) (red are lipid droplets stained with Nile red and blue is Dapi). Scale bar, 25 μm. (J) Quantitation of lipid droplet (LD) diameter in (I). Quantitation of 15 largest LDs in five samples per condition. Error bars represent mean ± SD and p values are indicated in the graph and were calculated by using unpaired t test with Welch’s correction. Genotypes of strains used in this figure: (A-E) w1118; (F-J) FB GS/+; UAS chinmoRNAi/+; w1118; P{w[+mW.hs]=Switch1}106/+; P{w+, UAS-chinmoRNAi 148}VK00033/+.

Figure 3—source data 1. Lifespan analysis of FBGS >UAS chinmoRNAi strain.
Figure 3—source data 2. Survival proportions of lifespan curves of FBGS >UAS chinmoRNAi strain.

Figure 3.

Figure 3—figure supplement 1. Nutrient-dependent regulation of Chinmo in the adult fat tissue.

Figure 3—figure supplement 1.

(A) Chinmo protein levels increase in adult fat tissue of w1118 flies that were fed a DR diet for 20 days. Confocal images of dissected fat body from adult w1118 flies that were fed an AL or DR diet for 20 days. Immunostaining was performed with Rat anti-Chinmo, Guinea pig anti-Chinmo, and Dapi. Scale bar, 10 μm. (B, C) Quantitation of Chinmo protein levels detected by the rat anti-Chinmo antibody in adult fat tissue nuclear and peripheral (non-nuclear) regions as determined by measuring pixel intensity in 10 cells in five samples per condition. Error bars represent mean ± SD and p values were calculated by unpaired t test with Welch’s correction. (D, E) Quantitation of Chinmo protein levels detected by the Guinea pig anti-Chinmo antibody in adult fat tissue nuclear and peripheral (non-nuclear) regions as determined by measuring pixel intensity in 10 cells in five samples per condition. Error bars represent mean ± SD and p values were calculated by unpaired t test with Welch’s correction. (F) DR induces expression of chinmo more significantly in adult fat tissue compared to adult head tissue. RT-PCR quantitation of chinmo mRNA in head and dissected fat tissue of w1118 flies that were fed an AL or DR diet for 20 days. (G) In contrast, DR induces miR-125 levels more significantly in adult head tissue as compared to fat tissue. (H) Chinmo protein is not detectable in w1118 adult brains due to post-transcriptional silencing by miR-125. Confocal images of dissected brain from adult w1118 flies that were fed an AL or DR diet for 20 days. Immunostaining was performed with Rat anti-Chinmo, mouse anti-Dacshund and Dapi. Scale bar, 25 μm. (I) Schematic showing the differential tissue-specific regulation of chinmo in adult brain and fat tissue. miR-125 silences chinmo in the adult brain. DR induces miR-125 and chinmo levels in the adult brain and consequentially, chinmo continues to be post-transcriptionally repressed in this tissue under DR conditions. In the fat tissue, DR leads to an increase in chinmo mRNA and protein levels. Genotype of strain used in this figure: (A-H) w1118.

To examine whether miR-125 and chinmo were differentially upregulated by DR in a tissue-specific manner, the expression of chinmo and miR-125 was quantitated by extracting total RNA from the head and dissected fat tissue of w1118 flies that were exposed to AL or DR diet for 20 days (Figure 3—figure supplement 1F–G). Both chinmo and miR-125 were expressed at much higher levels in the adult head tissue and DR induced chinmo by 1.29 ± 0.22 fold and miR-125 by 2.33 ± 0.28 fold in this tissue (Figure 3—figure supplement 1F–G). Thus, the greater increase in miR-125 upon DR ensures that chinmo continues to be repressed in the brain. Both chinmo and miR-125 are expressed at much lower levels in the fat body tissue as compared to the head tissue (chinmo: 5.5% of the levels in the head tissue; miR-125: 39.8% of the levels in head tissue). However, DR induces chinmo by 2.5 ± 0.98 fold and miR-125 by 1.89 ± 0.6 fold in the adult fat body (Figure 3—figure supplement 1F–G). Chinmo mRNA levels also increased by 2.6 ± 0.19 fold in the hemolymph of w1118 adult flies that were fed a DR diet for 10 days (Figure 3E). Hemolymph is responsible for circulating nutrients that are absorbed by the midgut to the fat body where carbohydrate and lipid storage, mobilization, and de novo lipogenesis occurs. A DR-dependent increase in the levels of circulating chinmo mRNA hinted at a possible mechanism by which chinmo could function in a non-autonomous manner. To examine whether a similar increase in Chinmo protein was detected in the adult brain, dissected brain samples from flies that were exposed to AL or DR conditions for 20 days were immunostained with anti-chinmo antibody to detect Chinmo, anti-Dacshund antibody as a control for immunostaining, and Dapi for DNA staining. As expected, the high levels of miR-125 in brain tissue repressed chinmo and no Chinmo signal was detected in adult w1118 brain tissue even when flies were exposed to DR for 20 days (Figure 3—figure supplement 1H). Together these data provided evidence for a miR-125-independent regulation of chinmo in the DR pathway in tissues other than the brain and raised the possibility of a possible non-nuclear role for this protein under conditions of nutrient restriction (Figure 3—figure supplement 1I).

Knockdown of chinmo in the adult fat body enhances lifespan under AL conditions

To address the contribution of chinmo in DR-dependent increase in lifespan, we examined the survival of flies expressing a chinmoRNAi transgene in the adult fat tissue (Figure 3F–J). A fat body (FB) gene switch Gal4 driver was used for overexpressing UAS-chinmoRNAi in an inducible manner (Figure 3F). Knockdown of chinmo resulted in a 16% increase in median lifespan in flies that were fed an AL diet and a 3.2% decrease in median lifespan in DR diet (Figure 3G). Since no increase in lifespan upon DR was observed and flies that were fed an AL diet showed a significant increase in lifespan, it confirmed that the lifespan extension mediated by reducing chinmo operates predominantly through the DR pathway and reducing chinmo does not enhance it further. RU-486 did not show a difference in lifespan of the UAS chinmoRNAi flies (Figure 2—figure supplement 1A and Figure 2—source data 1C–D) and FBGS driver (Bolukbasi et al., 2017; Huang et al., 2014). Reducing chinmo in the adult FB also resulted in an increase in stored triglyceride levels and an increase in lipid droplet diameter in flies that were fed an AL diet (Figure 3H–J). These data confirmed that chinmo functioned as an effector of DR-mediated extension of lifespan.

Chinmo redistributes to the cytoplasm upon nutrient deprivation

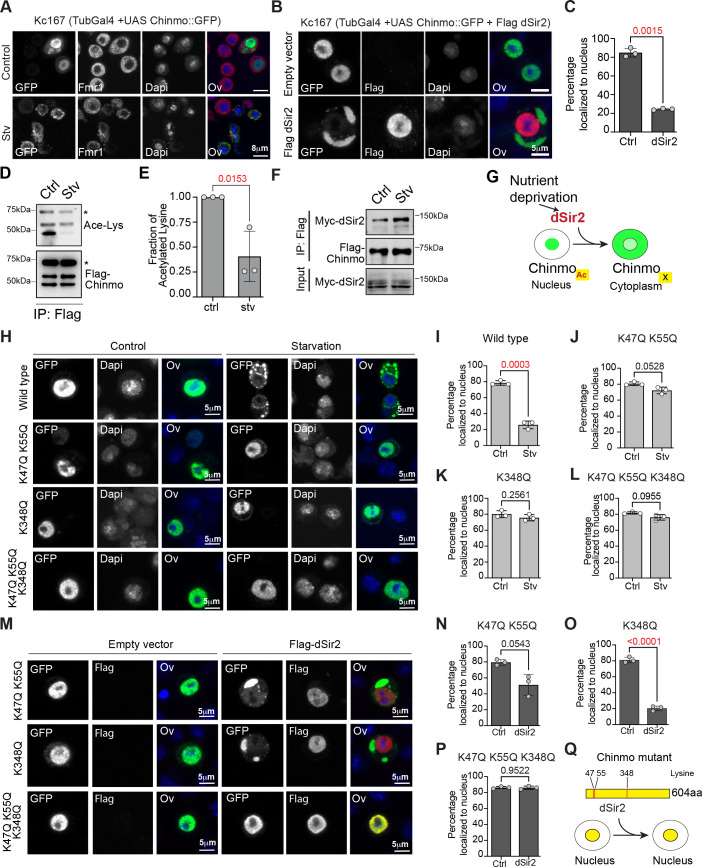
Chinmo’s role as a transcriptional repressor is well-documented and consistent with this function, endogenous and exogenous Chinmo is predominantly localized to the nucleus (Flaherty et al., 2010; Flaherty et al., 2009). To examine whether the non-autonomous role of Chinmo is due to its ability to shuttle between the nucleus and cytoplasm we examined the expression of tagged Chinmo in a Drosophila embryonic cell line, Kc167. Kc167 is one of the cell lines used by modENCODE and expresses very low levels of endogenous chinmo (Cherbas et al., 2011). A GFP-tagged version of Chinmo (UAS GFP-chinmo) was generated for examining the sub-cellular localization of Chinmo with GFP antibody. In fed cells (CCM3 medium), GFP-tagged Chinmo predominantly localized to the nucleus (Figure 4A). In contrast, the protein relocalized to the cytoplasm when Kc167 cells were transferred to starvation conditions (2 mg/ml glucose in PBS) for 10 hr (Figure 4A). These data indicated that Chinmo protein was being modified upon nutrient deprivation to a form that was able to relocalize to the cytoplasm.

Figure 4. Export of Chinmo from the nucleus is dependent on deacetylation of Chinmo by dSir2.

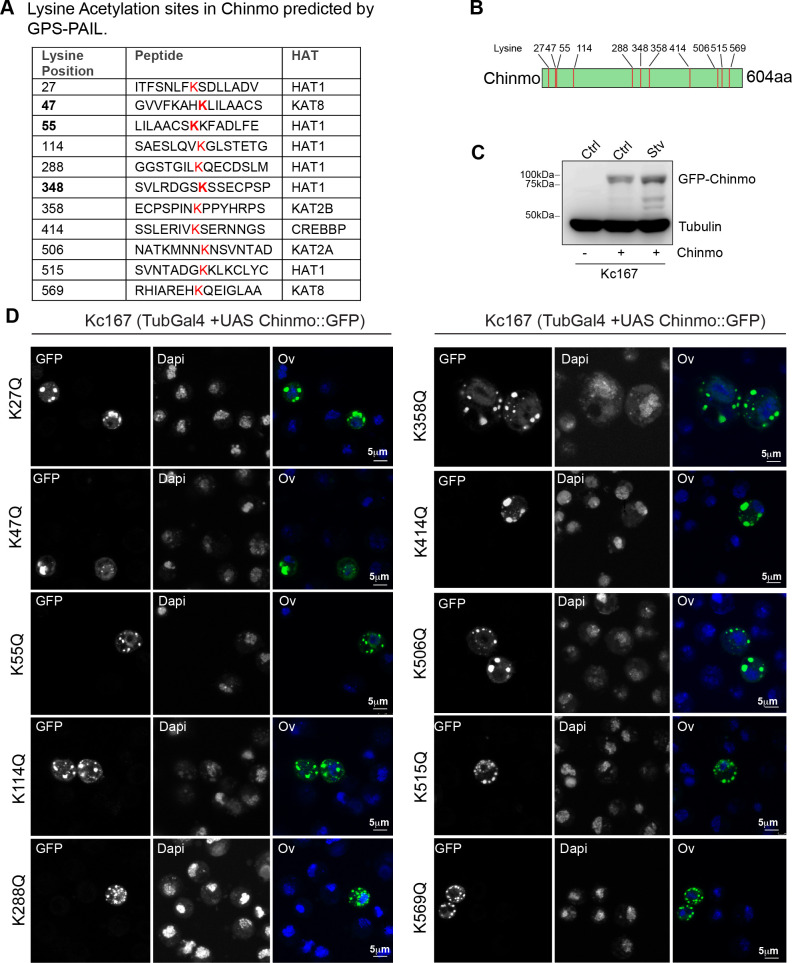
(A) Chinmo redistributes to the cytoplasm upon cell starvation. Kc167 cells were transfected with Tubulin Gal4 and UAS-GFP::Chinmo constructs and redistribution of Chinmo in fed (upper panel) and starved (lower panel) cells was examined by immunostaining with GFP antibody (Chinmo), Fmr1 (cytoplasmic marker) and Dapi (blue). Chinmo is predominantly localized to the nucleus in the fed state and redistributes to the cytoplasm in starved Kc167 cells. (B, C) Localization of GFP::Chinmo in cells overexpressing Flag dSir2 under fed/control (Ctrl) conditions. Kc167 cells were transfected with Tubulin Gal4 and UAS-Chinmo:: GFP and dSir2 pAFW constructs and redistribution of Chinmo was examined by immunostaining cells with GFP (Chinmo), Flag (dSir2), and Dapi. Overexpression of dSir2 led to redistribution of Chinmo to the cytoplasm under fed conditions. (C) Bar graph showing quantitation of the percentage of cells in which Chinmo::GFP was localized to the nucleus in cells transfected with either empty vector or dSir2 expressing plasmid. A total of 100 cells were quantitated in a minimum of three independent experiments. (D, E) Acetylation of Flag-Chinmo in fed (Ctrl) and Starvation (Stv) conditions. Acetylation of Flag-Chinmo was detected by immunoprecipitation with a Flag antibody followed by western blot analysis with an anti-acetyl-lysine antibody. Three bands of Chinmo were detected in the Flag immunoprecipitates reproducibly with the top-most band corresponding to the expected size of the full-length protein. (E) Bar graph showing the fraction of acetylated lysine in full-length Flag-Chinmo (indicated by * in panel D) under Ctrl and Stv conditions, determined by three independent immunoprecipitation experiments. (F) Co-immunoprecipitation of Myc-dSir2 with Flag-Chinmo under control and starvation conditions. Flag antibody was used for immunoprecipitation of Flag-Chinmo followed by western blot analysis with Myc antibody to detect dSir2 in the immunoprecipitates. (G) Schematic representing the nutrient-dependent Chinmo relocalization by dSir2. (H-L) K47, K55, and K348 are the main acetylation sites of Chinmo. The GPS-PAIL online prediction tool was used to identify potential Lysine residues in Chinmo that were acetylated. For table with all predicted acetylation Lysine residues please refer to Figure 4—figure supplement 1A. Kc167 cells were transfected with Tubulin Gal4 and GFP-tagged Chinmo wild type or each of the mutants in which the lysine (K) residues were mutated to Glutamine (Q) and the nuclear-cytoplasmic distribution of the tagged Chinmo proteins was examined under fed and starvation conditions by immunostaining with GFP(Chinmo) and Dapi. Scale bars represent 5 µm. (H-I) Majority of the wild-type GFP: : Chinmo protein redistributes to the cytoplasm upon starvation. (H, J-L) K47Q, K55Q double mutant, K348Q single mutant and K47Q, K55Q, K348Q triple mutant predominantly localize to the nucleus even upon starvation. (M-P) The K47Q, K55Q double mutant and K348Q single mutant show significant redistribution of Chinmo in the cytoplasm upon overexpression of dSir2. However, combining the three mutations in K47Q, K55Q, K348Q triple mutant abrogates the cytoplasmic export of Chinmo upon dSir2 overexpression. (Q) Schematic indicating the three lysine residues that are required for dSir2-mediated redistribution of Chinmo to the cytoplasm. The statistical results in all the bar graphs (C, E, I-P) are shown as mean ± SD (n = 3). p Values are calculated using unpaired t-test with Welch’s correction and indicated in each of the graphs.

Figure 4—source data 1. Uncropped western blots with relevant bands labeled for Figure 4D–F.
Figure 4—source data 2. Original image files of the unedited for western blots in Figure 4D.
Figure 4—source data 3. Original image files of the unedited for western blots in Figure 4E.
Figure 4—source data 4. Original image files of the unedited for western blots in Figure 4F.
Figure 4—source data 5. Morphology and fluorescence microscopy of Kc167 cells used in Figure 4.
elife-62621-fig4-data5.docx (295.6KB, docx)

Figure 4.

Figure 4—figure supplement 1. Evaluation of predicted acetylated lysine residues in Chinmo.

Figure 4—figure supplement 1.

(A) Table indicating potential Lysine residues in Chinmo that are sites for acetylation based on the GPS-PAIL online prediction tool. GPS-PAIL was run with all stringency options and there were very few sites obtained at the stringent (0) or medium (2) cut-offs. All the Lysine residues that were predicted at low cut-off are represented in (A). (B) Schematic representation of the Chinmo protein with predicted Lysines that may undergo Acetylation/deacetylation-mediated regulation. (C) Western blot analysis to confirm expression of GFP-tagged Chinmo in Kc167 cells transfected with Tubulin Gal4 plasmid and either empty vector (pUASTattB) in fed conditions (Ctrl) or UAS GFP Chinmo in fed (Ctrl) and starvation conditions (Stv). (D) All Lysine (K) residues that were predicted to be acetylated were mutated to Glutamine (Q). The UAS-GFP Chinmo mutant constructs were transfected into Kc167 cells together with Tubulin GAL4 and the nucleo-cytoplasmic distribution of the protein was examined after immunostaining of fixed cells exposed to fed (Ctrl) or 10 hr starvation. (D) Majority of single mutants analyzed (K27Q, K47Q, K55Q, K114Q, K288Q, K358Q, K414Q, K506Q, K515Q, and K569Q) redistributed to the cytoplasm upon 10 hr starvation. K348Q and K47QK55Q double mutant and K47QK55QK348Q triple mutant predominantly localized to the nucleus even upon starvation (Figure 4H–L). Scale bars represent 5 µm.
Figure 4—figure supplement 1—source data 1. Uncropped western blots with relevant bands labeled for Figure 4—figure supplement 1C.
Figure 4—figure supplement 1—source data 2. Original image files of the unedited for western blots in Figure 4—figure supplement 1C.
Figure 4—figure supplement 2. Chinmo protein and mRNA are upregulated in adult and larval fat tissue upon starvation.

Figure 4—figure supplement 2.

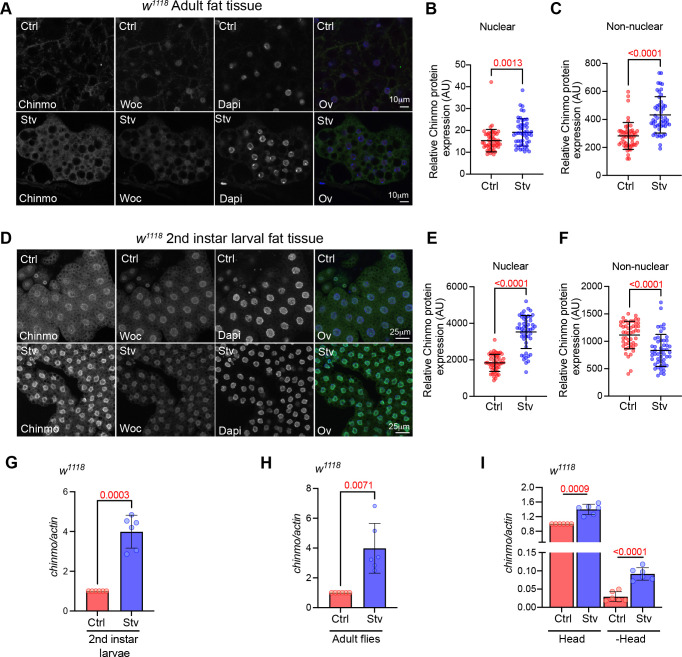
(A) Chinmo protein levels increase in adult fat tissue of w1118 flies that were exposed to starvation for 2 days. Confocal images of dissected fat body from adult w1118 flies that were exposed to normal diet or starvation for 2 days. Immunostaining was performed with anti-Chinmo, anti-Woc (nuclear protein) and Dapi. Scale bar, 10 μm. (B, C) Quantitation of Chinmo protein levels in adult fat tissue nuclear and peripheral (non-nuclear) regions as determined by measuring pixel intensity in 10 cells in five samples per condition. Chinmo levels increase in the nuclear and periphery regions upon starvation. Error bars represent mean ± SD and p values were calculated by unpaired t test with Welch’s correction. (D) Chinmo protein levels increase in larval fat tissue upon 16 hr of starvation. Confocal images of dissected fat body from w1118 2nd instar larvae that were exposed to normal diet or starvation for 16 hr. (E, F) Quantitation of Chinmo protein levels in larval fat tissue nuclear and peripheral (non-nuclear) regions as determined by measuring pixel intensity in 10 cells in five samples per condition. Chinmo levels increase in the nuclear but not periphery regions upon starvation. Error bars represent mean ± SD and p values were calculated by unpaired t test with Welch’s correction. (G-H) Chinmo mRNA levels increase upon starvation. RT-PCR quantitation of fold change in chinmo mRNA levels in w1118 2nd instar larvae (G), adult whole flies (H) that were fed a Ctrl/normal food (Red bars) or exposed to starvation (Blue bars) for 2 days. (I) The DR-dependent increase in chinmo is higher in peripheral tissues (decapitated body tissue) as compared to the head tissue. RT-PCR quantitation of chinmo mRNA in head and decapitated body tissue of w1118 flies that were fed a normal diet or exposed to starvation for 2 days. Genotypes of strains used in this figure: (A-I) w1118.

Deacetylation of Chinmo is required for its nuclear export upon nutrient deprivation

Protein acetylation is a dynamic and reversible post-translational modification that has been implicated in the nutrient-dependent subcellular relocalization of non-histone proteins (Huang et al., 2015; Narita et al., 2019). Lysine is the most common residue at which protein acetylation and deacetylation occur and one major family of enzymes that regulate lysine deacetylation in a nutrient-dependent manner are Sirtuin enzymes (Bao and Sack, 2010). Sir2/SIRT1 is a conserved nuclear-localized, NAD+-dependent deacetylase that senses energy status and protects cells against metabolic stresses (Chang and Guarente, 2014; Lee et al., 2019). dSir2 is regulated by diet and environmental stress and regulates the aging process (Banerjee et al., 2012; Lee et al., 2019). Hence, we tested whether increasing the levels of the nuclear-localized Sirt1/dSir2 led to relocalization of GFP::Chinmo to the cytoplasm (Figure 4B–C). Kc167 cells were co-transfected with Tubulin-Gal4, UAS GFP-Chinmo, and Flag-dSir2, and cells were fixed 48 hr after transfection and immunostained with anti-GFP to detect Chinmo, anti-flag antibody to detect dSir2 and Dapi to detect nuclear DNA (Figure 4B–C). Overexpression of Flag-dSir2 led to export of Chinmo into the cytoplasm under fed conditions. In absence of dSir2, 84.9 ± 4.69% of the cells had Chinmo localized to the nucleus and in presence of dSir2, 24.4 ± 0.83% of the cells had Chinmo localized in the nucleus (Figure 4C). These data indicated that dSir2 was required for the export of Chinmo to the cytoplasm. We then examined the acetylation status of Flag-tagged Chinmo in control and starvation conditions (Figure 4D–E). Cellular starvation caused a 40 ± 25% decrease in acetylated Chinmo as determined by western blot analysis of immunoprecipitated Flag-Chinmo in control and starvation conditions (Figure 4D–E). Consistent with the requirement of dSir2 for the deacetylation of Chinmo during starvation conditions, we found that starvation induced interaction of Myc-dSir2 with Flag-Chinmo (Figure 4F). Thus, dSir2-mediated deacetylation of Chinmo is required for the nuclear export of Chinmo (Figure 4G).

To identify the specific lysine residues in Chinmo that are the potential sites of Acetylation, we utilized the GPS-PAIL (Prediction of Acetylation on Internal Lysines) online tool (Deng et al., 2016). A total of 11 acetylation sites were predicted by the online tool (Figure 4—figure supplement 1A–B). The validity of the predicted acetylation sites was assessed by generating Chinmo mutants in which each of the Lysine (K) sites were mutated to Glutamine (Q) (Figure 4H–P and Figure 4—figure supplement 1D). GFP-tagged Chinmo mutants were co-transfected with Tubulin Gal4 and the subcellular localization of each of the mutants was examined under control and starvation conditions by immunostaining with anti-GFP antibody (Figure 4H–P and Figure 4—figure supplement 1D). Double mutants were also generated and tested for Lysines that were nearby (K47Q and K55Q). We predicted that mutating the acetylation-specific lysines to Glutamines would result in loss of nuclear export of Chinmo. While the K47Q and K55Q single mutants were able to relocalize to the cytoplasm upon starvation, combining the two mutations in K47QK55Q double mutant as well as the K348Q single mutation led to a significantly diminished nuclear export of Chinmo upon starvation. While only 26 ± 5% of the cells had Chinmo wild type protein localized to the nucleus upon starvation, 72 ± 4% of the cells transfected with K47QK55Q mutant and 76 ± 4% of the cells transfected with K348Q mutant retained the protein in the nucleus upon starvation (Figure 4—figure supplement 1D and Figure 4H–J,K). We then tested whether the identified lysine residues were critical for dSir2-mediated relocalization of Chinmo to the cytoplasm. The K47QK55Q and K348Q mutants were co-transfected with Tubulin-Gal4 and Flag dSir2 and cellular localization of Chinmo was analyzed by immunostaining of fixed cells with anti-GFP antibody to detect Chinmo, anti-flag antibody to detect dSir2 and Dapi to detect DNA (Figure 4M). Our prediction was that if deacetylation sites were mutated, cells would retain Chinmo in the nucleus even upon dSir2 transfection. For K47QK55Q mutant 51 ± 13% of transfected cells retained Chinmo in the nucleus upon co-transfection of dSir2, while only 20 ± 3% of the cells retained Chinmo in the nucleus upon co-transfection of K348Q with dSir2. Since, both the mutants (K47QK55Q and K348Q) were exported to the cytoplasm upon dSir2 overexpression, we generated a Chinmo triple mutant (K47QK55QK348Q) construct by combining the three mutations and analyzed the subcellular localization upon starvation and upon co-transfection with Flag-dSir2 (Figure 4H,M,L,P). 76 ± 3% of the cells retained Chinmo triple mutant (K47QK55QK348Q) in the nucleus upon starvation and 86 ± 2% of the cells retained Chinmo K47QK55QK348Q mutant in the nucleus upon co-transfection with dSir2 (Figure 4L–P). These data confirmed that dSir2-mediated deacetylation at all three residues (K47, K55, and K348) was required for redistribution of Chinmo to the cytoplasm upon nutrient deprivation (Figure 4Q).

Since our data showed that nutrient deprivation by starvation was responsible for cellular relocalization of Chinmo, we tested whether Chinmo protein and chinmo mRNA were regulated by starvation in vivo (Figure 4—figure supplement 2). Immunostaining of dissected abdominal fat tissue was performed with anti-Chinmo antibody to detect Chinmo, anti-Woc antibody as an immunostaining control, and Dapi for DNA. Fat body was dissected from adult flies and 2nd instar larvae as 2nd instar larvae express Chinmo in their fat body and we predicted that starvation induced Chinmo relocalization maybe utilized for its role during non-feeding larval states. A significantly increased intensity of Chinmo staining was observed in the nuclei of adult (Nuclear Ctrl: 15.3 ± 5.14 AU; Nuclear Stv: 19.13 ± 6.26 AU) and 2nd instar larval fat body (Nuclear Ctrl: 1835.33.19 ± 469.64 AU; Nuclear Stv: 3525.38 ± 904.48 AU) (Figure 4—figure supplement 2A–B and C–D). In adult fat tissue, peripheral Chinmo intensity was higher than that of the nuclear region and displayed a statistically significant increase upon starvation (Non-nuclear Ctrl: 282.05 ± 96.45 AU; Non-nuclear Stv: 432.36 ± 129.8 AU) (Figure 4—figure supplement 2A and C). In 2nd instar larvae a predominant increase in Chinmo intensity was observed in the nuclear region but not in the peripheral region (Non-nuclear Ctrl: 1114.18 ± 249.63 AU; Non-nuclear Stv: 832.69 ± 292.6 AU) (Figure 4—figure supplement 2D and F). One possible explanation for this difference could be the differences in the levels of dSir2 in the fat tissue of second instar larvae versus adult fat tissue and also due to the duration of starvation and a stronger transcriptional induction in the larval fat tissue. A significant increase in chinmo mRNA levels was detected by Q-RTPCR of total RNA extracted from 2nd instar larvae (3.98 ± 0.83 fold increase relative to control) and adult flies (3.98 ± 1.66 fold increase relative to control) that were exposed to starvation (Figure 4—figure supplement 2G–H). We also examined the effect of starvation in the head tissue versus the decapitated head tissue (Figure 4—figure supplement 2I). Our analysis revealed that the magnitude of induction of chinmo in decapitated tissue (3.13 ± 0.59 fold increase relative to control) was much higher than the magnitude of induction in head tissue (1.39 ± 0.14 fold increase relative to control), even though chinmo is expressed at higher levels in the head tissue (Figure 4—figure supplement 2G–H). Taken together, these analyses confirmed that in addition to miR-125-mediated post-transcriptional regulation, chinmo is independently regulated by nutrient deprivation at the transcriptional and post-translational levels.

Starvation induces loading of Chinmo into exosomes

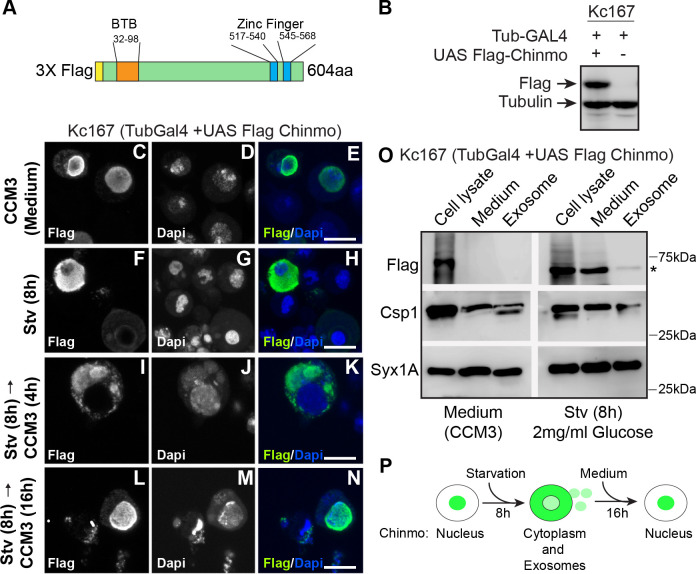
Exosomes mediate cell-cell communication by facilitating the intercellular transfer of specific combinations of bioactive molecules such as DNA, miRNAs, mRNAs, proteins, and lipids (Maas et al., 2017; Tkach and Théry, 2016). These extracellular vesicles are produced by almost all cell types and serve as intercellular messengers and carriers of various signals and molecules and modify the functioning of recipient cells in different contexts. Our data indicate that the deacetylation of Chinmo results in its nuclear export upon starvation. To test whether the long-range non-autonomous effects of Chinmo were associated with its loading onto exosomes, we examined the composition of purified exosomes upon nutrient deprivation. To facilitate biochemical purification and detection of Chinmo by western blot analysis, we generated a Flag-tagged Chinmo construct (UAS flag-chinmo) (Figure 5A–B). Consistent with the GFP-tagged Chinmo data, starved Kc167 cells expressing Flag-tagged Chinmo also showed a cytoplasmic redistribution of Chinmo (Figure 5C–H). Moreover, this cytoplasmic redistribution of Chinmo was reversible, and shifting the cells back to normal medium (16 hr) resulted in the reappearance of nuclear-localized Chinmo and disappearance of cytoplasmic protein (Figure 5I–N). To examine whether non-autonomous expression occurs due to intercellular transfer of exosomes, we examined the protein composition of exosomes derived from Kc167 cells that were exposed to either fed or starvation conditions. Kc167 cells were transfected with Tubulin Gal4 and Flag Chinmo constructs. Seventy-two hr post-transfection, one-half of the cells were shifted to starvation medium for 8 hr and the other half was maintained in fresh complete medium (CCM3) for 8 hr. Exosomes were purified from a concentrated medium from both conditions using gel filtration chromatography (Figure 5—figure supplement 1A–B). Western blot analysis was performed with the cell lysate, concentrated medium, and purified exosomes. Flag Chinmo was detected in the medium and exosome fraction of starved Kc167 cells but not in the concentrated medium and exosomal fraction of cells that were maintained in the complete medium (Figure 5O). These data uncovered a new mechanism by which Chinmo may be delivered to adjacent or distant cells.

Figure 5. Chinmo co-fractionates with exosomal proteins upon nutrient deprivation.

(A) Schematic of the 3X Flag-Chinmo protein indicating the BTB and Zinc finger domains. (B) Western blot analysis to confirm expression of Flag-tagged Chinmo in Kc167 cells transfected with Tubulin Gal4 plasmid and either empty vector (pUASTattB) or UAS Flag Chinmo. (C-N) Kc167 cells were transfected with Tubulin Gal4 and Flag Chinmo and distribution of Chinmo was examined in fixed cells after immunostaining with Flag and Dapi. Chinmo is predominantly localized to the nucleus in the fed state (C-E) and redistributes to cytoplasm when Kc167 cells are starved for 8 hr (F-H). (I-N) Chinmo distribution in Kc167 starved cells that are shifted to medium (CCM3) for 4 hr (I-K) and 16 hr (L-N). Chinmo translocates to the nucleus when cells are shifted from starvation to nutrient-rich conditions for 16 hr. Confocal images were acquired at ×100 magnification. Scale bars represent 8 μm. (O) Western blot analysis of cell lysate, concentrated culture medium and purified exosomes from Kc167 cells. Kc167 cells were transfected with Tubulin Gal4 and Flag Chinmo and 72 hr post-transfection cells were divided into flasks with either medium (CCM3) or 2 mg/ml glucose (PBS) for 8 hr. The medium from both conditions was collected and concentrated using Amicon centrifugal columns. Exosomes were purified from concentrated medium by gel exclusion chromatography. The exosomal fraction, concentrated medium and, cell lysate were analyzed by western blotting with Flag (Flag Chinmo), Csp 1 (exosome marker), and Syntaxin 1A (exosome marker) antibodies. Flag Chinmo was detected in exosomes and concentrated medium of Kc167 cells that were starved for 8 hr (Asterisk symbol). (P) Schematic representing dynamic redistribution of Chinmo in Kc167 cells exposed to starvation for 8 hr followed by a shift to medium for 16 hr.

Figure 5—source data 1. Uncropped western blots with relevant bands labeled for Figure 5B and O.
Figure 5—source data 2. Original image files of the unedited western blots in Figure 5B and O.

Figure 5.

Figure 5—figure supplement 1. Elution of vesicles using gel filtration columns.

Figure 5—figure supplement 1.

(A) Elution profile with 100 µl of concentrated Kc167 cell culture medium loaded. OD600nm (blue line) and OD280nm (red line) was measured in each of the collected fractions. The elution of vesicles peaked at 200 µl after void volume (1000 µl) when 100 µl were collected. The protein fraction eluted in much later fractions (~1000 µl) after the void volume. (B) Western blot analysis of fractions collected (A) with antibodies to exosomal proteins cysteine string protein (CSP), syntaxin 1A (Syx1A) and hepatocyte growth factor regulated tyrosine kinase substrate (Hrs).
Figure 5—figure supplement 1—source data 1. Uncropped western blots with relevant bands labeled for Figure 5—figure supplement 1B.
Figure 5—figure supplement 1—source data 2. Original image files of the unedited western blots in Figure 5—figure supplement 1B.

Overexpression of chinmo diminishes the DR-mediated lifespan extension

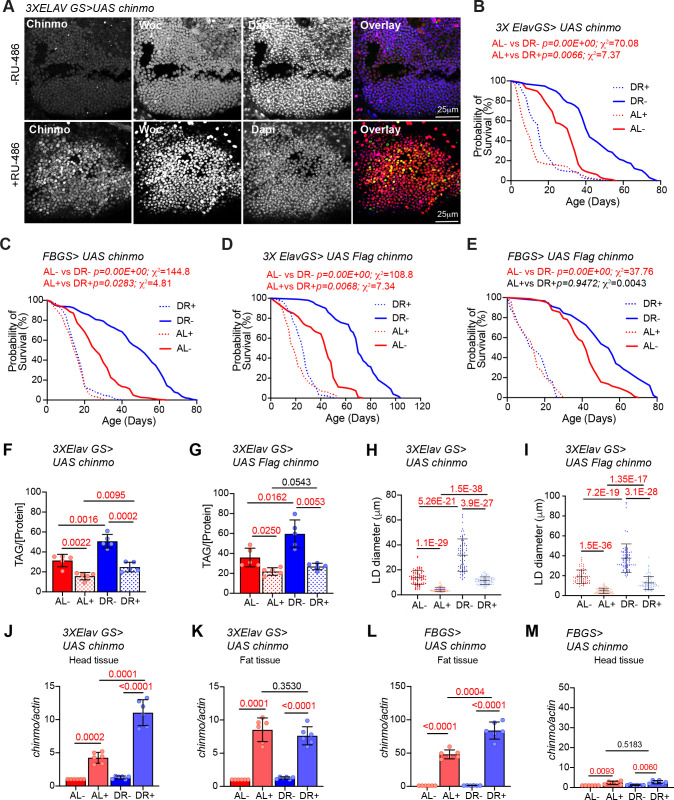
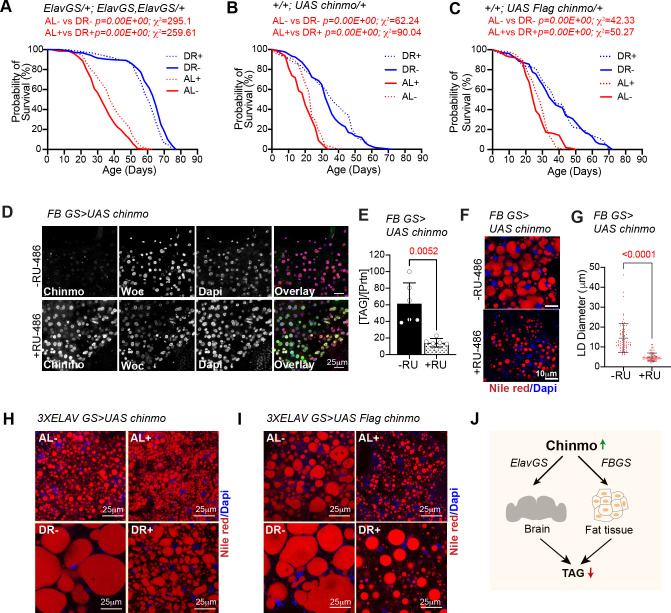
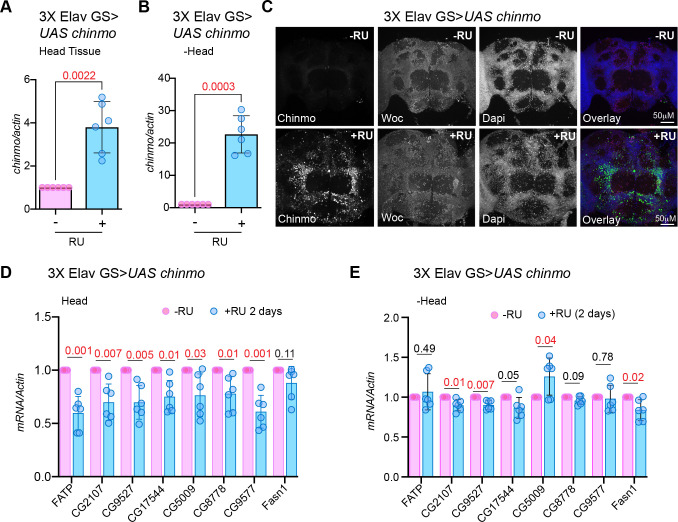
To gain an understanding of how tissue-specific regulation of chinmo results in DR-dependent lifespan extension, we measured the survival of fruit flies that ectopically expressed chinmo in adult neurons and fat tissues under AL and DR conditions. Consistent with the miR-125 single mutant phenotype, overexpression of chinmo or Flag- chinmo using a neuronal gene switch driver (3X Elav GS) or fat-body-specific gene switch driver (BL8151 also referred to as S1106) resulted in the decrease in the DR dependent lifespan extension (Figure 6A–E; Bolukbasi et al., 2017; Gendron and Pletcher, 2017; Huang et al., 2014). A significantly dampened DR-mediated lifespan extension was observed when chinmo was overexpressed in the neurons (Figure 6B and Figure 6—source data 1). Though, a 24% increase in median survival upon DR in uninduced conditions (-RU) and a 37.5% increase in median survival upon DR in induced conditions (+RU) was observed. The p-values (AL- vs DR-, 0.00 E + 00; AL + vs DR+, 0.0066) and Χ2 values (AL- vs DR-, 70.02; AL + vs DR+, 7.37) for comparison of lifespan curves in induced and uninduced conditions indicated that the DR-dependent increase in lifespan was greatly diminished upon overexpression of chinmo in adult neurons (Figure 6B and Figure 6—source data 1). This DR phenotype was further exaggerated in the FBGS >UAS chinmo flies where a 50% increase in median survival was observed upon DR in -RU conditions and a 0% increase in median survival was observed upon DR in +RU conditions (Figure 6C and Figure 6—figure supplement 1). These results were reproduced in crosses of the same GeneSwitch drivers with another transgenic line that overexpressed a Flag-tagged Chinmo (UAS flag chinmo). In 3X ElavGS >UAS flag chinmo flies, a 37% increase in median survival was recorded upon DR in uninduced conditions (-RU), and a 30% increase in median survival upon DR was recorded in induced conditions (+RU). In FBGS >UAS flag chinmo flies, a 22% increase in median survival was recorded upon DR in uninduced conditions (-RU) and, a 0% increase in median survival upon DR was recorded in +RU conditions (Figure 6D–E and Figure 6—source data 1). The 3X ElavGS, UAS-chinmo and UAS flag-chinmo control lifespans were performed (AL+, AL-, DR+, DR-) to confirm that the decrease in DR-mediated lifespan extension was not due to the effect of ligand or genetic background (Figure 6—figure supplement 1A–C and Figure 6—figure supplement 1—source data 1). The effect of the ligand on FBGS (S1106) lifespan have been published before and referenced here (Bolukbasi et al., 2017; Huang et al., 2014). In addition, measurement of TAG levels and lipid droplet size indicated that ectopic neuronal expression of chinmo or flag chinmo (3X ElavGS) resulted in decreased TAG levels and a concomitant reduction in lipid droplet diameter in both AL and DR diets (Figure 6F–I, Figure 6—figure supplement 1H–I). We predicted that overexpression of chinmo would result in a decrease of TAG and lipid droplet size irrespective of the diet. Consistent with the miR-125 single mutant metabolic phenotypes (Figure 2G–I), ectopic expression of chinmo in the adult fat body with an inducible fat-body-specific GAL4 driver (Figure 6—figure supplement 1D–G) resulted in reduced TAG levels (Figure 6—figure supplement 1E) and a decrease in lipid droplet diameter (Figure 6—figure supplement 1F–G). Together, these data demonstrate that overexpression of chinmo in adult neurons mimics the miR-125 mutant phenotype and confirms a role for miR-125 in DR pathways via post-transcriptional repression of chinmo.

Figure 6. Ectopic expression of chinmo in adult neurons and fat body mimics miR-125 mutant DR phenotype.

UAS chinmo was expressed in adult neurons and adult fat tissue using the steroid (RU-486) inducible gene switch Gal4 drivers. (A) Female flies that were fed an RU-486 supplemented diet for 5 days displayed increased levels of Chinmo in neuronal cells, as detected by Chinmo. Woc (nuclear marker) and Dapi staining of dissected adult fly brains. (B, D) 3X ElavGS >UAS chinmo (B) or 3X ElavGS >UAS Flag chinmo (D) flies that were not fed RU-486 show a significant increase in lifespan upon DR (DR, blue line) as compared to 3X ELavGS >UAS chinmo (B) or 3X ElavGS >UAS Flag chinmo (D) flies that were fed an ad libitum (AL) diet (red line)(3X ElavGS >UAS chinmo: AL-, n = 98; median lifespan = 32 d; DR-, n = 99; median lifespan = 42; 3X ElavGS >UAS Flag-chinmo: AL-, n = 107; median lifespan = 44 d; DR-, n = 99; median lifespan = 70 d). RU-486 fed 3X ElavGS >UAS chinmo flies or 3X ElavGS >UAS Flag-chinmo display a significantly dampened DR-dependent increase in lifespan (blue and red dotted lines) (3X ElavGS >UAS chinmo: AL+, n = 100; median lifespan = 10 d; DR+, n = 95; median lifespan = 16 d; 3X ElavGS >UAS Flag-chinmo: AL+, n = 137; median lifespan = 18 d; DR+, n = 100; median lifespan = 26 d). (C, E) FB GS >UAS chinmo or FB GS >UAS Flag-chinmo flies that were fed RU-486 displayed a stronger DR phenotype relative to 3X ElavGS >UAS Chinmo or 3X ElavGS >UAS Flag chinmo (blue and red dotted lines)(FB GS >UAS chinmo: AL-, n = 186; median lifespan = 26 d; DR-, n = 187; median lifespan = 52 d; AL+, n = 213; median lifespan = 16 d; DR+, n = 209; median lifespan = 16 d; FB GS >UAS Flag-chinmo: AL-, n = 96; median lifespan = 42; DR-, n = 91; median lifespan = 54; AL+, n = 83; median lifespan = 14 d; DR+, n = 73; median lifespan = 14 d) (Compare p values and Χ2 in panels B/D with C/E) compared to the flies that were fed the Ethanol (blue and red solid lines). For statistical comparison of survival curves, p values and Χ2 were calculated with log rank test. (F, G) Quantitation of triglyceride (TAG) stored levels in AL-RU-486 (Solid red bars), AL + RU-486 (Red dotted bars), DR-RU-486 (Solid blue bars) and DR +RU-486 (Dotted blue bars) fed 20d old (F) 3XElavGS > UAS chinmo or (G) 3XElavGS > UAS Flag-chinmo flies. Increasing Chinmo levels in adult neurons is sufficient to lead to a significant reduction in the systemic triglyceride levels under both AL and DR conditions. This decrease mimics the decrease in TAG levels observed in miR-125 mutants. The bars represent mean ± SD, n = 5, p value was calculated with unpaired two tailed t-test with Welch’s correction. (H, I) Fat bodies/abdomens of female flies were dissected and stained for the content and diameter of lipid droplet (LD) (red are lipid droplets stained with Nile red and blue is Dapi). For representative confocal images, please refer to Figure 6—figure supplement 1H–I. Quantitation of lipid droplet (LD) diameter in 3XElavGS > UAS chinmo (H) and 3XElavGS > UAS Flag-chinmo (I). A significant reduction is seen in lipid droplet size in the abdominal fat tissue when Chinmo is expressed in adult neurons. Quantitation of 15 largest LDs in five samples per condition. Error bars represent mean ± SD. (J–K) 3X ElavGS >UAS chinmo flies express increased levels of chinmo mRNA in both head and fat tissue. (L–M) FBGS >UAS chinmo flies predominantly express chinmo mRNA in the adult fat tissue. (J–M) Quantitative RT-PCR of RNA extracted from dissected tissues (head and fat body) of 3XElavGS > UAS chinmo (J, K) and FBGS >UAS chinmo (L, M) flies that were fed an AL (Red and pink bars) and DR (Dark Blue and Light blue bars) under uninduced (Red and Dark blue bars) and steroid induced (Pink and Light blue bar) conditions. Expression levels were normalized to Actin5c. Values are mean ± SD, n = 6. p Values were calculated using unpaired t test with Welch’s correction. Genotypes of strains used in this figure: (A, B, F, H, J-M) 3X ElavGS >UAS chinmo: P{elav-Switch.O}GS −1A / +; P{elav-Switch.O}GS-3A, P{elav-Switch.O} GSG301/P{w+, UAS-chin::SV40}/+; (D, G,I) 3X ElavGS >UAS Flag chinmo: P{elav-Switch.O}GS −1A / +; P{elav-Switch.O}GS-3A,P{elav-Switch.O} GSG301/P{w+, UAS Flag-chin::SV40} attP2 / +; (C) FBGS >UAS chinmo: w1118; P {w [+mW.hs]=Switch1}106/+; P{w+, UAS-chin::SV40}/+; (E) FBGS >UAS Flag-chinmo: w1118; P{w[+mW.hs]=Switch1} 106/+; P{w+, UAS Flag-chin::SV40} attP2 / +.

Figure 6—source data 1. Lifespan analysis of strains used in Figure 6.
Figure 6—source data 2. Survival proportions of lifespan curves of strains used in Figure 6B–E.

Figure 6.

Figure 6—figure supplement 1. Lifespan and molecular analysis of strains used in Figure 6.

Figure 6—figure supplement 1.

(A–C) Effect of diet and RU-486 on lifespan of 3X ElavGS X w1118 (A), UAS chinmo X w1118 (B) and UAS Flag chinmo X w1118 (C) flies. (A) Crosses were established between 3X ElavGS and w1118 and the progeny was sorted into four groups (AL-, DR-, AL+ and DR+). Median lifespan in: AL- is 33 days; AL + is 40 days: DR- is 65 days and DR +is 61 days. (B) Crosses were established between UAS chinmo and w1118 and the progeny was sorted into four groups (AL-, DR-, AL+ and DR+). Median lifespan in: AL- is 24 days; AL + is 20 days: DR- is 34 days and DR +is 38 days. (C) Crosses were established between UAS Flag chinmo and w1118 and the progeny was sorted into four groups (AL-, DR-, AL+ and DR+). Median lifespan in: AL- is 26 days; AL + is 30 days: DR- is 38 days and DR +is 38 days. For statistical comparison of survival curves, p values and Χ2 were calculated with log rank test. (D) Over expression of chinmo in the adult fat tissue reduces TAG levels. UAS chinmo was expressed in adult fat body using the drug (RU-486)-inducible gene switch Gal4 driver. Female flies that were fed an RU-486 supplemented diet for 5 days displayed increased levels of Chinmo in fat body cells, as detected by Chinmo, Woc (nuclear marker), and Dapi staining of dissected fat body. (E) Quantitation of stored triglyceride (TAG) levels in -RU-486 and +RU-486 fed 20d old FBGS >UAS chinmo flies. (F) Fat bodies/abdomens of female flies were dissected and stained for the content and diameter of lipid droplet (LD) (red are lipid droplets stained with Nile red and blue is Dapi). Scale bar, 25 μm. (G) Quantitation of lipid droplet (LD) diameter in (F). Quantitation of 15 largest LDs in five samples per condition. Error bars represent mean ± SD. (H, I) Representative nile red images of fat bodies of (H) ElavGS >UAS chinmo and (I) ElavGS >UAS Flag chinmo adult female flies stained with Nile red and Dapi. (J) Schematic displaying systemic reduction in TAG levels by ectopic expression of Chinmo using ElavGS or FBGS Gal4 drivers. Genotypes of strains used in this figure: (A) ElavGS/+; ElavGS, ElavGS/+: P{elav-Switch.O}GS −1A / +; P{elav-Switch.O}GS-3A, P{elav-Switch.O} GSG301/+; (B) +/+; UAS chinmo/+: w1118; +/+; P{w+, UAS-chin::SV40}/+; (C)+/+; UAS Flag chinmo/+: w1118; +/+; P{w+, UAS-Flag chin::SV40} attP2 /+; (D-GFBGS >UAS chinmo: w1118; P{w[+mW.hs]=Switch1}106/+; P{w+, UAS-chin::SV40}/+; (H) 3XElavGS > UAS chinmo: P{elav-Switch.O}GS-1A/ +; P{elav-Switch.O}GS-3A, P{elav-Switch.O} GSG301/P{w+, UAS-chin::SV40}/+; (I) 3XElavGS > UAS Flag chinmo: P{elav-Switch.O}GS −1A / +; P{elav-Switch.O}GS-3A,P{elav-Switch.O} GSG301/P{w+, UAS-Flag chin::SV40} attP2 / +.
Figure 6—figure supplement 1—source data 1. Lifespan analysis of strains used in Figure 6—figure supplement 1A–C.
Figure 6—figure supplement 2. Non-autonomous expression of Chinmo in abdominal fat tissue of 3XElavGS > UAS Chinmo flies.

Figure 6—figure supplement 2.

(A–H and A’–H’) To verify specificity of the gene switch GAL4 drivers, UAS GFP was expressed in a steroid-inducible manner with 3X Elav-GS (A-H) or FB-GS (A’-H’). Confocal images of dissected Drosophila adult brain and fat body from fruit flies that were fed an AL diet (A, B, E, F, A’, B’, E’, F’) or DR diet (C, D, G, H, C’, D’, G’, H’) under uninduced (A-D, A’-D’) and steroid-induced (E-H, E’-H’) conditions. 3x ElavGS >UAS GFP flies that were fed RU-486 for 5 days displayed increased levels of Chinmo in the brain and neurons innervating the adult fat tissue as detected by GFP staining of dissected brains and fat body (E, F, G, H) compared to flies that were not fed RU-486 (A, B, C, D). In contrast, 3x ElavGS >UAS chinmo flies that were fed RU-486 for 5 days displayed increased levels of Chinmo in the adult fat tissue (N, P), in addition to the adult brain (M, O) compared to flies that were not fed RU-486 (I-L) FB GS >UAS GFP and FB GS >UAS chinmo flies that were fed RU-486 for 5 days displayed increased levels of GFP (F’, H’) and Chinmo in the fat tissue (N’, P’), respectively. Scale bar, 50 μm. Genotypes of strains used in this figure: (A-H) 3x ElavGS >UAS GFP: P{elav-Switch.O}GS-1A/P{y[+t7.7] w[+mC]=10XUAS-IVS-myr::GFP}attP40; P{elav-Switch.O}GS-3A, P{elav-Switch.O}GSG301 /+; (I-P) 3x ElavGS >UAS chinmo: P{elav-Switch.O}GS-1A / +; P{elav-Switch.O}GS-3A,P{elav-Switch.O}GSG301/P{w+,UAS-chin::SV40}/+; (A’-H’FBGS >UASGFP:w1118; P{w[+mW.hs]=Switch1} 106/P{y[+t7.7] w[+mC]=10XUAS-IVS-myr::GFP}attP40; +/+: (I’-P’) FB GS >UAS chinmo: w1118; P {w [+mW.hs]=Switch1}106/+; P{w+, UAS-chin::SV40}/+.
Figure 6—figure supplement 3. Non-autonomous expression of Chinmo in abdominal fat tissue of 3XElavGS > UAS Flag chinmo flies.

Figure 6—figure supplement 3.

(A) Confocal images of dissected Drosophila adult brain from fruit flies that were fed an AL diet (top two panels) or DR (bottom two panels) diet under uninduced (AL-, DR-) and steroid-induced (AL+, DR+) conditions. 3x ElavGS >UAS Flag chinmo flies that were fed RU-486 for 10 days displayed increased levels of Chinmo in the brain tissue as detected by anti-flag and anti-chinmo staining of dissected brains compared to flies that were not fed RU-486. (B, C) 3x ElavGS >UAS chinmo flies that were fed RU-486 for 10 days also displayed increased levels of Chinmo in the adult fat tissue (AL+, DR+), in addition to the adult brain compared to flies that were not fed RU-486 (AL-, DR-). Scale bar, 25 μm. (D, E) Quantitation of Chinmo protein levels as detected by staining with anti-Flag and anti-chinmo antibody in adult fat tissue nuclei as determined by measuring pixel intensity in 10 cells in five samples per condition. Error bars represent mean ± SD and p values were calculated by unpaired t test with Welch’s correction. Genotypes of strains used in this figure: (A-E) 3x ElavGS >UAS Flag chinmo: P{elav-Switch.O}GS −1A / +; P{elav-Switch.O}GS-3A, P{elav-Switch.O} GSG301/P{w+, UAS-Flag chin::SV40} attP2/+.

Neuronal chinmo upregulation induces chinmo expression non-autonomously in the fat tissue

In a previous study, we showed that let-Complex miRNAs are induced in the mid-late third larval instar and are predominantly expressed in the nervous system of adult flies (Chawla et al., 2016; Chawla and Sokol, 2012). However, our current analysis has revealed that derepression of chinmo in the nervous system and/or the abdominal fat tissue of miR-125 mutants results in changes in systemic stored fat levels (Figure 2B and G–I, Figure 6A–IFigure 6—figure supplement 1D–I). To determine the mechanistic basis for systemic regulation of fat metabolism by the miR-125-chinmo regulatory axis operating in the adult brain, we examined the expression of chinmo mRNA after inducing its expression with 3X ElavGS and FBGS GeneSwitch Gal4 drivers (Figure 6J–M). Quantitative RT-PCR analysis of chinmo RNA in the head and dissected abdominal fat tissue of 3X ElavGS >UAS chinmo flies and FBGS >UAS chinmo that were exposed to RU-486 for 5 days was performed. In the brain tissue of 3X ElavGS >UAS chinmo flies, chinmo mRNA levels increased by 4.25 ± 0.8 fold under AL conditions and by 11 ± 1.96 fold in DR conditions upon addition of the ligand (Figure 6J). In addition, chinmo mRNA levels also increased by 8.5 ± 1.79 fold in AL conditions and by 7.6 ± 1.36 fold in DR conditions in the dissected fat tissue upon addition of the ligand (Figure 6K). These data suggested that chinmo mRNA was being induced non-autonomously to a similar magnitude in the abdominal fat tissue in 3X ElavGS >UAS chinmo flies. In FBGS >UAS chinmo flies, chinmo levels increased by 48 ± 6.7 fold in AL conditions and by 83.9 ± 12.7 fold in DR conditions in the fat tissue (Figure 6L). However, a much smaller increase in chinmo mRNA levels was detected in the head tissue of FBGS >UAS chinmo with a 2.38 ± 0.8 fold increase in AL and 2.69 ± 0.8 fold increase in DR conditions upon addition of ligand (Figure 6M). To confirm whether the increase in mRNA also resulted in a non-autonomous increase in Chinmo protein levels, we performed immunostaining of dissected brain and abdominal fat tissue of 3X ElavGS >UAS chinmo and FBGS >UAS chinmo flies (Figure 6—figure supplement 2). In parallel, we drove the expression of GFP using the 3X Elav GS and FB GS drivers to verify the specificity of the GeneSwitch drivers (Figure 6—figure supplement 2A–H and A'-H'). Immunohistochemistry with GFP antibody confirmed the specificity of both the gene switch GAL4 drivers. GFP protein was detected in the adult brain and neurons innervating the abdominal wall of 3X ElavGS >UAS GFP flies that were fed an AL + RU or DR +RU diet (Figure 6—figure supplement 2A–H). GFP was only detected in the fat body of FB GS >UAS GFP flies upon RU treatment (Figure 6—figure supplement 2A'–H'). Then we performed immunostaining with anti-Chinmo antibody to detect Chinmo in dissected brain and fat body of 3X Elav GS >UAS chinmo and FB GS >UAS chinmo flies that were fed an AL or DR diet in the presence and absence of RU-486 (Figure 6—figure supplement 2I–P and I'-P'). Consistent with the chinmo mRNA analysis, 3X Elav GS >UAS chinmo flies that were fed RU-486 containing food displayed expression of Chinmo in the adult brain and adult fat body. However, FB GS >UAS chinmo flies that were fed RU-486 containing food displayed expression of Chinmo specifically in the fat body and no signal was detected in dissected brains (Figure 6—figure supplement 2I'–P'). These data were recapitulated using 3X ElavGS >UAS Flag chinmo flies (Figure 6—figure supplement 3A–E). Immunostaining was performed with anti-Chinmo and anti-Flag antibody to detect Chinmo in dissected brain, and fat body of 3X Elav GS >UAS Flag chinmo flies that were fed an AL or DR diet for 10 days in presence or absence of RU-486. As expected Chinmo was detected with both antibodies in the dissected brains of 3X Elav GS >UAS Flag chinmo flies upon induction. However, a more intense Chinmo signal was detected in DR diet. Chinmo was also detectable with both antibodies in the fat body of 3X Elav GS >UAS Flag chinmo flies (Figure 6—figure supplement 3B–C). Quantitation of the signal intensity indicated a much higher levels of Chinmo in DR +RU-486 conditions (Chinmo AL-: 0.17 ± 0.06; Chinmo AL+: 0.59 ± 0.39; Chinmo DR-: 0.22 ± 0.10; Chinmo DR+: 2.04 ± 0.75; Flag AL-: 0.11 ± 0.06; Flag AL+:0.5 ± 0.35; Flag DR-: 0.09 ± 0.025; Flag DR+:1.5 ± 0.74) (Figure 6—figure supplement 3D–E).These data indicated that Chinmo protein and/or mRNA is either capable of loading onto exosomes to facilitate communication with other peripheral tissues or a feed-forward mechanism exists by which upregulation of chinmo in the adult neurons promotes its expression in the fat tissue via an as yet unidentified signal. This non-autonomous expression of Chinmo is required for mediating its effects on fat metabolism and lifespan.

Chinmo downregulates expression of genes involved in fat metabolism

To identify potential targets of Chinmo that were responsible for the DR-dependent phenotypes of miR-125 mutant, we performed semi-quantitative proteomic analysis of extracts prepared from adult flies (whole animals) overexpressing chinmo specifically in adult neurons using the 3X Elav GS Gal4 driver (Figure 7A–E). Since the role of Chinmo as a repressor of gene expression is well established, we examined the downregulated biological processes to identify relevant direct downstream targets of Chinmo (Figure 7F). Proteins that were identified to be significantly downregulated were predominantly genes that were involved in metabolism (Figure 7F). We successfully validated the expression of eight fat metabolism genes (FATP, CG2017, CG9577, CG17554, CG5009, CG8778, CG9527, and FASN1) that were identified through this proteomic analysis (Figure 7G–H) using RNA extracted from head tissue (Figure 7G) or decapitated fly tissue (Figure 7H) of 3XElavGS > UAS chinmo flies that were fed a solvent (Ethanol) or RU-486 containing diet for 10 days (Figure 7G–H) or 2 days (Figure 7—figure supplement 1A–E). The rationale for examining the expression of the genes in head tissue versus decapitated fly tissue was to compare the magnitude of repression of the genes in a tissue where Chinmo was overexpressed with the peripheral tissues. Consistent with the proteomics data, the mRNAs of all the fat metabolism genes were significantly downregulated in the head tissue (51–78% relative to control) and in the decapitated fly tissue (27–50% relative to control) of flies that ectopically expressed chinmo in adult neurons (Figure 7G–H). These data revealed that neuronal upregulation of chinmo led to a repression of genes involved in fat metabolic processes in an autonomous (head) and non-autonomous manner (-head). To verify whether overexpression of chinmo in adult neurons led to a decrease in protein levels of the endogenous proteins involved in fat metabolism, we performed western blot analysis of whole fly lysates prepared from 3X ElavGS >UAS flag chinmo flies that were fed either an AL + RU-486 or AL + solvent/ethanol diet for 10 days (Figure 7—figure supplement 3A). Since, most of the downstream targets identified are not that well-characterized (CG2107, CG9527, CG17544, CG5009, CG8778, and CG9577), we tested the expression of endogenous Fatp for which antibodies were available. Western blot analysis was performed with anti-flag antibody to detect Chinmo, anti-Fatp antibody to detect endogenous Fatp and anti-tubulin as a normalization control. Consistent with the proteomics data, a reduction in Fatp levels was seen upon upregulation of Flag Chinmo in adult neurons (Figure 7—figure supplement 3A). To test whether downregulation of the candidate fat metabolism genes in the adult fat tissue was responsible for modulating lifespan, we measured survival of flies that expressed transgenes to knockdown fasn1 and fatp specifically in the adult fat body (Figure 7I,J). We predicted that if increased expression of one of these genes was sufficient to cause increased lipid turnover and consequentially DR-mediated lifespan extension, then knockdown of this gene would result in a reduction in lifespan upon DR. RT-PCR analysis of total RNA extracted from abdominal fat tissue of FBGS/+; UAS fasnRNAi/+ flies exposed to AL or DR conditions was performed to verify the knockdown of fasn1. Induction of the UAS fasn1RNAi led to a 67.1 ± 1.9% decrease in fasn1 mRNA under AL conditions and a 52.87 ± 3.7% decrease in DR conditions (Figure 7—figure supplement 3B). Knockdown of fasn1 resulted in an 18.7% decrease in median lifespan of flies that were fed an AL diet and a 3.22% decrease in median lifespan on DR diet (Figure 7I and Figure 7—source data 1). Thus, indicating that knocking down of fasn1 alone was not sufficient to mediate the DR effect on longevity. Induction of the UAS fatpRNAi led to a 41.9 ± 5.3% decrease in fatp mRNA under AL conditions and a 51.23 ± 2% decrease in fatp mRNA under DR conditions (Figure 7—figure supplement 3C). Knockdown of fatp resulted in a 14.8% decrease in median lifespan upon DR and no change under AL conditions (Figure 7J and Figure 7—source data 2). Since knockdown of fatp resulted in a decrease in the lifespan of flies that were fed a DR diet, we tested whether increasing the levels of fatp in the adult fat tissue led to an increase in the lifespan of flies under AL conditions. Western blot analysis of whole fly lysates prepared from FBGS >UAS Flag fatp flies that were fed an AL or DR diet in the presence and absence of RU-486 for 10 days revealed that Flag Fatp was expressed in an inducible manner, however, much lower levels of the flag-tagged protein was detected under AL conditions as compared to that in DR conditions (Figure 7—figure supplement 3D). Overexpressing UAS-Flag-FATP specifically in the adult fat tissue increased median life span by 14.2% under AL conditions and by 25% under DR conditions (Figure 7KFigure 7—source data 3). The smaller increase in median lifespan in AL conditions is likely due to the lower induction of the protein, nevertheless, an increase in lifespan in both diets indicates that Fatp functions as a pro-longevity factor and that DR-dependent increase in lifespan occurs due to an increase in the expression of two or more genes that are regulated by Chinmo. To test whether the changes in survival were not due to an effect of RU-486, control experiments were performed with +/+, fasn1RNAi, +/+; fatpRNAi and +/+; UAS Flag fatp lines (Figure 7—figure supplement 3E–G and Figure 7—source data 13). Taken together, these results indicated that ectopic expression of chinmo in the adult neurons causes decreased expression of fat metabolism genes in the fat tissue that resulted in a decreased lifespan.

Figure 7. Ectopic expression of chinmo in adult neurons represses transcription of genes involved in fat metabolic processes.

(A) Quantitation of chinmo mRNA levels in RNA extracted from 3X ElavGS >UAS chinmo flies that were fed a solvent (light blue bars) or RU-486 (pink bars) diet for 5 and 10 days. (B, C) Quantitation of chinmo mRNA levels in RNA extracted from head tissue (B) and decapitated body tissue (C) of 3X ElavGS >UAS chinmo flies that were fed ethanol (blue bar) or RU-486 (pink bar) diet for 10 days. Expression levels were normalized to Actin5c. Values are mean ± SD, n = 3. (D) Venn diagram of 1175 proteins identified across the two groups (-RU-486 and +RU-486) and 91% were common between the two groups. (E) Volcano plot illustrating significantly differentially abundant proteins. Forty proteins were found to be differentially expressed by using a cutoff on p value ≤ 0.05 and log2FC ≥ 1 (7 upregulated) and ≤−1.0 (33 downregulated) proteins. (F) Twenty-five most significant biological processes that are downregulated upon overexpression of chinmo in adult neurons. See Figure 7—figure supplement 2 for upregulated biological processes. (G, H) Overexpression of chinmo in the adult nervous system downregulates genes involved in fat metabolism. RT-PCR quantitation of fold- change in mRNA levels of genes (F) involved in fat metabolism in the head tissue (G) and decapitated body tissue (H) of 3X ElavGS >UAS chinmo flies that were fed the solvent/ethanol (light blue bars) or RU-486 (pink bars) diet for 10 days. (I) Knockdown of fasn1 in the adult fat body reduces lifespan more significantly in flies that are fed an AL (compare red solid and dotted lines) compared to flies that are fed a DR diet (compare blue solid and blue dotted lines) conditions (See Figure 7—source data 1 for p values and median and maximum lifespan for additional experimental replicate). (J) Knockdown of fatp in the adult fat body reduces lifespan under DR (compare blue solid and blue dotted lines) conditions (See Figure 7—source data 2 for p values and median and maximum lifespan for additional experimental replicate). (K) Overexpression of Flag FATP increases lifespan in flies that are fed a DR diet (Compare blue dotted line with blue solid line) more significantly than flies that are fed an AL diet (See Figure 7—source data 3 for p values and median and maximum lifespan for additional experimental replicate). For statistical comparison of survival curves, p values and χ2 were calculated with log-rank test. Genotypes of strains used in this figure: (A-H) 3X ElavGS >UAS chinmo: P{elav-Switch.O}GS −1A / +; P{elav-Switch.O}GS-3A, P{elav-Switch.O} GSG301/P{w+, UAS-chin::SV40}/+; (I) FB GS/+; UAS fasn1RNAi/+: w1118; P{w[+mW.hs]=Switch1}106/+; P{y[+t7.7] v[+t1.8]=TRiP.HMS01524}attP2/+; (J) FB GS/+; UAS fatpRNAi/+:w[1118]; P{w[+mW.hs]=Switch1}106/+; P{y[+t7.7] v[+t1.8]=TRiP.HMC04206}attP2/+; (K) FB GS/+; UAS Flag fatp/+: w[1118]; P{w[+mW.hs]=Switch1}106/+;P{w+, UAS-Flag fatp} attP2/+.

Figure 7—source data 1. Lifespan analysis of FBGS >UAS fasn1RNAi and +/+; UAS fasn1RNAi strains.
Figure 7—source data 2. Lifespan analysis of FBGS >UAS fatpRNAi and +/+; UAS fatpRNAi strains.
Figure 7—source data 3. Lifespan analysis of FBGS >UAS Flag fatp and +/+; UAS Flag fatp strains.
Figure 7—source data 4. Survival proportions of lifespan curves of strains used in Figure 7I–K.
Figure 7—source data 5. Upregulated biological processes from proteomic analysis in Figure 7D–F.
Figure 7—source data 6. Downregulated biological processes from proteomic analysis in Figure 7D–F.

Figure 7.

Figure 7—figure supplement 1. Overexpression of chinmo in adult neurons represses transcription of genes involved in fat metabolic processes in the brain within 2 days of induction.

Figure 7—figure supplement 1.

(A, B) Quantitation of chinmo mRNA levels in RNA extracted from head and decapitated body tissue of 3X ElavGS >UAS chinmo flies that were fed a solvent (light blue bars) or RU-486 (pink bars) diet for 2 days. (C) Female flies that were fed an RU-486 supplemented diet for 2 days displayed increased levels of Chinmo in neuronal cells, as detected by Chinmo, Woc (nuclear marker), and Dapi staining of dissected adult fly brains. (D, E) Overexpression of chinmo in the adult nervous system downregulates genes involved in fat metabolism. RT-PCR Quantitation of fold change in mRNA levels of genes involved in fat metabolism in the head tissue (D) and decapitated body tissue (E) of 3X ElavGS >UAS chinmo flies that were fed a solvent (light blue bars) or RU-486 (pink bars) diet for 2 days. (D) Induction of Chinmo for 2 days was sufficient to lead a statistically significant reduction of seven of the eight genes analyzed in the head tissue. (E) 3 out of 8 genes analyzed also displayed a statistically significant albeit lower reduction in the decapitated body tissue. Expression levels were normalized to Actin5c. Values are mean ± SD, n ≥ 3. p Values were calculated by using unpaired t test with Welch’s correction. Genotypes of strains used in this figure: (A-E) 3XElavGS > UAS chinmo: P{elav-Switch.O}GS −1A / +; P{elav-Switch.O}GS-3A, P{elav-Switch.O} GSG301/P {w+, UAS-chin::SV40}/+.
Figure 7—figure supplement 2. Over expression of chinmo in adult neurons upregulates cytoplasmic processes.
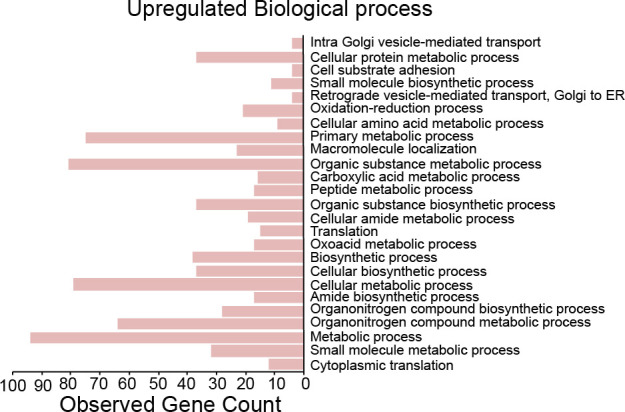
Figure 7—figure supplement 2.

Twenty-five most significant biological processes that are upregulated upon overexpression of chinmo in adult neurons.
Figure 7—figure supplement 3. Molecular and survival analysis of strains utilized in Figure 7.

Figure 7—figure supplement 3.

(A) Overexpression of flag Chinmo in the adult brain neurons leads to a reduction in Fatp protein. Western blot analysis of adult fly lysates from 3X ElavGS >UAS Flag chinmo flies that were fed an AL diet in presence (+AL) or absence (AL-) of RU-486. The whole fly cell lysates were analyzed by western blotting with Flag (Flag Chinmo), Fatp and Tubulin (normalization control) antibodies. Fatp levels reduced upon overexpression of Flag chinmo. (B) Quantitative RT-PCR of fasn1 from abdominal tissue of FB GS >UAS fasn1RNAi flies in presence of RU-486 (light red and light blue) or in absence of RU-486 (bars with solid red and blue color) flies that were fed Ad libitum (AL) (red) or DR diet (blue) for 10 days. Expression levels were normalized to Actin. Values are mean ± SD, n = 6. (C) Quantitative RT-PCR of fatp from abdominal tissue of FB GS >UAS fatpRNAi flies in presence of RU-486 (light red and light blue) or in absence of RU-486 (bars with solid red and blue color) flies that were fed Ad libitum (AL) (red) or DR diet (blue) for 10 days. Expression levels were normalized to Actin. Values are mean ± SD, n = 6. Fatp is more significantly knocked down under DR conditions. (D) Western blot of whole fly lysates from FB GS/+; UAS Flag fatp/+flies that were fed an AL and DR diet in presence (AL+, DR+) and absence (-AL, -DR) of RU-486. The whole fly cell lysates were analyzed by western blotting with Flag (Flag Fatp), Fatp, and Tubulin (normalization control) antibodies. Flag Fatp was detected in AL + and DR +lysates. (E-G) Effect of RU-486 on the lifespan of UAS fasnRNAi, UAS fatpRNAi, and UAS Flag fatp flies. (E) Crosses were established between UAS fasnRNAi and w1118 and the progeny was sorted into four groups (AL-, DR-, AL +, and DR+). Median lifespan in: AL- is 28 days; AL + is 26 days: DR- is 50 days and DR +is 46 days. (F) Crosses were established between UAS fatpRNAi and w1118 and the progeny was sorted into four groups (AL-, DR-, AL +, and DR+). Median lifespan in: AL- is 36 days; AL + is 32 days: DR- is 38 days and DR +is 42 days. (G) Crosses were established between UAS Flag fatp and w1118 and the progeny was sorted into four groups (AL-, DR-, AL + and DR+). Median lifespan in: AL- is 26 days; AL + is 32 days: DR- is 46 days and DR +is 48 days. For statistical comparison of survival curves, p values and Χ2 were calculated with log-rank test. Genotypes of strains used in this figure: (A) 3X ElavGS >UAS Flag chinmo: P{elav-Switch.O}GS −1A / +; P{elav-Switch.O}GS-3A, P{elav-Switch.O} GSG301/P{w+, UAS-chin::SV40}/+; (B) FBGS /+;UASfasnRNAi/+: w1118; P{w [+mW.hs]=Switch1}106/+;P{y[+t7.7]v[+t1.8]=TRiP.HMS01524}attP2/+;(CFBGS/+;UASfatpRNAi/+:w[1118];P{w[+mW.hs]=Switch1}106/+;P{y[+t7.7]v[+t1.8]=TRiP.HMC04206}attP2/+; (D) FBGS/+; UAS Flag fatp/+; w[1118]; P{w [+mW.hs]=Switch1}106/+;P{w+,UAS-Flag fatp}attP2/+; (E) UASfasn1RNAi/+: w1118; +/+; P {y[+t7.7]v [+t1.8]=TRiP. HMS01524} attP2/+; (FUAS fatpRNAi/+:w1118;+/+;P{y[+t7.7]v[+t1.8]=TRiP. HMC04206} attP2/+; (G) UAS Flag fatp/+: w1118;+/+; P{w+, UAS-Flag fatp} attP2 / +.
Figure 7—figure supplement 3—source data 1. Uncropped western blots with relevant bands labeled for Figure 7—figure supplement 3A and D.
Figure 7—figure supplement 3—source data 2. Original image files of the unedited for western blots in Figure 7—figure supplement 3A.
Figure 7—figure supplement 3—source data 3. Original image files of the unedited for western blots in Figure 7—figure supplement 3D.
Figure 7—figure supplement 3—source data 4. Survival proportions of lifespan curves of strains used in Figure 7—figure supplement 3E–G.

Overexpression of human primary miR-125b-1 in the adult fat body extends lifespan

Given that DR-modulated upregulation of chinmo was the likely cause of the decrease in lifespan extension upon DR, we tested whether increasing the levels of the brain enriched miR-125 in the adult fat body was able to mimic the beneficial effects of chinmoRNAi. Our data indicate that DR induces miR-125 levels in the fat tissue (Figure 3—figure supplement 1G and Figure 8B, compare -AL and -DR bars). These data are consistent with a previous study in the mouse model that identified miR-125b as one of the miRNAs that increases in the subcutaneous white fat tissue upon caloric restriction (Mori et al., 2012). Hence, we tested whether artificially increasing the levels of miR-125 specifically in the fat tissue would lead to silencing of chinmo and consequentially lead to an increase in lifespan under AL conditions. Given the multi-targeting ability of miRNAs, it would be reasonable to expect that other potential mRNA targets of miR-125 would also be repressed upon overexpression. Since the human and fly processed miR-125 sequences are identical we generated transgenic fly lines that expressed the human primary miR-125b-1 (hsa pri miR-125b-1) transcript (Figure 8A). Expression of hsa primiR-125b-1 was induced in the adult fat body using the steroid inducible gene switch GAL4 driver FB GS (Figure 8B). Overexpression of miR-125 in the adult fat body led to a 5.8% increase in median lifespan in the AL diet and a 13.6% increase in median lifespan in the DR diet (Figure 8C and Figure 8—figure supplement 1A–B). To confirm whether this increase in lifespan was not due to the effects of RU-486, we analyzed the effect of RU-486 in +/+; hsa miR-125b-1/+ flies (Figure 8—figure supplement 1 and Figure 8—source data 1A–B). While increasing miR-125 levels in the fat tissue also led to increased stored triglyceride content in flies that were fed either AL or DR diets (Figure 8D), a significant increase in the diameter of the lipid droplets was only observed in FB GS >UAS hsa pri miR-125b-1 flies that were fed a DR +RU-486 diet and no difference was observed in AL diet due to the smaller size of the lipid droplets in both AL- and AL + diets (Figure 8E). Finally, to test whether modulating miR-125 levels led to changes in the expression of genes involved in fat metabolism, we examined the expression of fasn1 and fatp in FB GS >UAS hsa pri miR-125b-1 flies that were fed AL and DR in the presence and absence of RU-486. Consistent with the stronger increase in lifespan in DR +conditions, FB GS >UAS hsa pri miR-125b-1 flies expressed higher levels of both FASN1 and FATP in DR plus RU-486 conditions (Figure 8G–H). The levels of FASN1 were also significantly higher in FB GS >UAS hsa pri miR-125b-1 flies that were fed AL diet in presence of RU-486 (Figure 8H). While these data confirmed that artificially modulating the levels of miR-125 in a tissue where its target was upregulated could result in changes in lifespan by regulation of the same downstream targets, inducing miR-125 at different levels might be required to minimize the effects of other miR-125 targets and maximize lifespan upon AL. Nevertheless, these experiments demonstrate that the regulation of fat metabolism by miR-125 is an evolutionarily conserved mechanism.

Figure 8. Overexpression of human primary miR-125b-1 in the adult fat tissue promotes longevity and increases TAG levels under both AL and DR conditions.

(A) Schematic of Drosophila melanogaster primary miR-125 (pri miR-125) transcript and the Homo sapiens primary miR-125b-1 (pri hsa miR-125b-1) indicating that the processed miRNA sequence in fruit flies and humans is identical. (B) Quantitative RT-PCR of miR-125 from abdominal tissue of FB GS >UAS chinmo flies in presence of RU-486 (bars with red and blue pattern) or in absence of RU-486 (bars with solid red and blue color) in flies that were fed Ad libitum (AL) (red) or DR diet (blue) for 20 days. Expression levels were normalized to SnoR442. Values are mean ± SD, n = 6. (C) Overexpression of hsa pri miR-125 increases lifespan in flies that are fed an AL or DR diet (Compare red and blue dotted lines with red and blue solid line) (See Figure 8—source data 1A–B for number of flies and median and maximum lifespan). The p values and Χ2 values indicate that the increase in lifespan is greater under DR conditions. (D) FB GS >UAS hsa pri miR-125b-1 flies store increased levels of triglycerides (TAG) when fed an AL or DR diet. Quantitation of TAG stored levels in -RU-486 and +RU-486 fed 20 d old FBGS >UAS hsa pri miR-125b-1 flies. (E) Fat bodies/abdomens of female flies were dissected and stained for the content and diameter of lipid droplet (LD) (red are lipid droplets stained with Nile red and blue is Dapi). Scale bar, 25 μm. (F) Quantitation of lipid droplet (LD) diameter in (E). Quantitation of 15 largest LDs in five samples per condition. Error bars represent ± SD. (G, H) Overexpression of hsa pri miR-125 upregulates fasn1 but not fatp under AL conditions. RT-PCR quantitation of mRNA levels of fasn1 (G) and fatp (H) in the fat tissue of FB GS >UAS hsa pri mir-125 flies that were fed an AL (red and pink bars) or DR diet (dark blue and light blue) under uninduced (red and dark blue bars) and induced (pink and light blue bars) conditions for 20 days. Expression levels were normalized to Actin5c. Values are mean ± SD, n ≥ 6. Genotypes of strains used in this figure: (B-H) FBGS/+; UAS has pri miR-125b-1: w1118; P{w[+mW.hs]=Switch1}106/+; P{v+, UAS-hsa miR-125b-1} VK00033/+.

Figure 8—source data 1. Lifespan analysis of FBGS >UAS hsa pri miR-125b-1 strain.
Figure 8—source data 2. Survival proportions of lifespan curves of strains used in Figure 8C.

Figure 8.

Figure 8—figure supplement 1. Effect of RU on lifespan of UAS pri hsa miR-125b-1>w1118 flies.
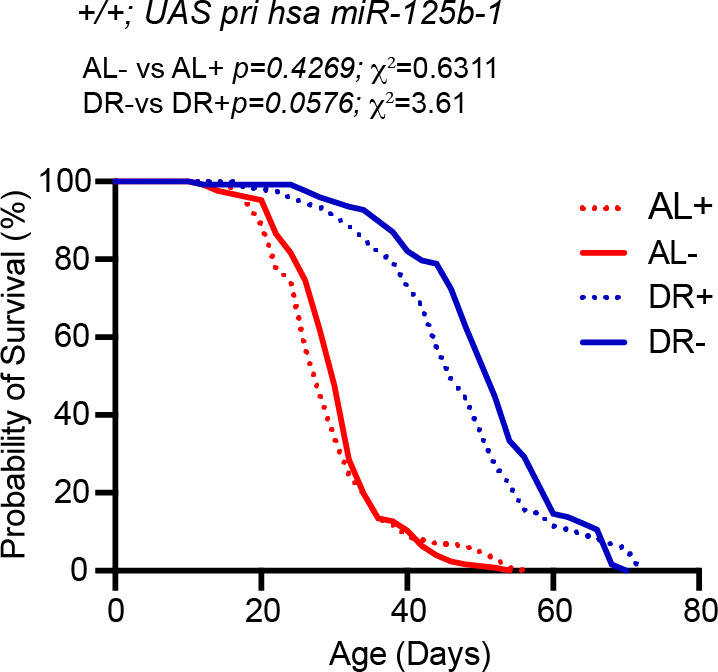
Figure 8—figure supplement 1.

To test if RU486 affects lifespan of flies expressing the UAS pri hsa miR-125b-1 transgene. Median lifespan in: AL- is 30 days; AL + is 28 days: DR- is 52 days and DR +is 46 days. Please refer to Figure 8—figure supplement 1—source data 1 for the second replicate of this experiment. Genotype of strain used in this Figure: +/+; UAS pri has miR-125b-1: w1118; +/+; P{v+, UAS-hsa miR-125b-1} VK00033/+.
Figure 8—figure supplement 1—source data 1. Lifespan analysis of UAS has pri miR-125b-1/+ strain.
Figure 8—figure supplement 1—source data 2. Survival proportions of lifespan curve of strain used in Figure 8—figure supplement 1.

Discussion

Regulatory RNAs as key regulators of metabolic homeostasis

In contrast to the protein machinery that represents only ~2% of the transcribed genome, the expansion of the noncoding transcriptome in higher eukaryotes reflects greater regulation of cellular processes through control of protein function (ENCODE Project Consortium, 2012). Our previous analysis uncovered a role for let-7 and miR-125 in aging (Chawla et al., 2016). This work was followed up by another study that reported that increasing Drosophila let-7 levels in the adult nervous system enhanced lifespan and altered metabolism (Gendron and Pletcher, 2017). In the current study, we have uncovered a new role for the evolutionarily conserved miR-125 in DR-dependent extension of lifespan. We utilized hypomorphic and genetic loss of function mutants to examine the contribution of miR-100, let-7, and miR-125 in the DR pathway. Let-7-Chyp mutant strain expresses near wild-type levels of let-7-C miRNAs (miR-100, let-7, and miR-125) during development but displays an age-related decline in the levels of these miRNAs during adulthood (Chawla et al., 2016; Chawla and Sokol, 2012). Expression analysis of the let-7-Complex miRNAs in let-7-Chyp revealed that DR-mediated upregulation of let-7-C miRNAs is required for lifespan extension by DR (Figure 1E–F and Figure 1—figure supplement 2B–D). Lifespan analysis of Δlet-7 and ΔmiR-125 flies uncovered a role for these miRNAs in DR-mediated lifespan extension. Thus, this is the first study that identifies conserved miRNAs that are regulated by DR in the Drosophila model and demonstrates a role for these two miRNAs in DR-mediated lifespan extension.

Fat metabolism, DR, and the role of miRNAs

Lipid metabolism plays an important role in the aging process and pharmacological, dietary, and genetic interventions that extend lifespan often cause changes in lipid metabolism (Barzilai et al., 2012; Johnson and Stolzing, 2019). The adipose tissue has also been linked to metabolic dysfunction and age-related diseases such as heart attacks, stroke, hypertension, diabetes, and cancer (Tchkonia et al., 2010). The fat body exerts some of its effects by storage and release of fat under different contexts. A non-autonomous regulatory role for this tissue in aging by regulation of the miRNA biogenesis machinery was reported in the mouse model. This study showed that aging-associated decline in the levels of the miRNA biogenesis factor, Dicer results in the downregulation of several miRNAs including miR-125b in the adipose tissue (Mori et al., 2012). The authors further showed that knockout of Dicer specifically in the adipose tissue rendered the mice hypersensitive to oxidative stress. More importantly, this decline in multiple miRNAs in the adipose tissue was prevented by caloric restriction (CR). Although this study correlated the age and CR-mediated changes of miR-125b with its downstream target p53, the causal role of these changes on lifespan was not examined (Mori et al., 2012). Our genetic and molecular analysis in Drosophila independently identified miR-125 as a downstream effector of DR and showed that upregulation of its human ortholog in the fat tissue was able to enhance lifespan in a diet-independent manner. Future work may be required to determine the optimum duration and dose of miR-125 required to maximize healthspan in higher organisms, nevertheless our analysis provides several avenues that can be explored for testing this miRNA as a dietary restriction mimetic.

Chinmo as a nutrient-dependent regulator of fat metabolism

Chinmo is a BTB (Bric-a-brac, Tramtrack, Broad complex) domain -Zinc finger (ZF) transcription factor that has been demonstrated to function as a repressor (Flaherty et al., 2009). This BTB-ZF protein has been shown to play a critical role in the temporal fate specification of mushroom body neurons during development (Zhu et al., 2006). However, more recent studies have highlighted a new role for this protein in the JAK/STAT signaling pathway that regulates stem-cell renewal in Drosophila (Flaherty et al., 2010). Interestingly, as a mediator JAK/STAT signaling, Chinmo exerts non-autonomous effects on the renewal of germline stem cells in Drosophila testis (Flaherty et al., 2010). However, the molecular mechanism or the non-autonomous signal that mediates these effects is currently not known. Our analysis indicates that in addition to previously documented transcriptional and post-transcriptional regulation, Chinmo may be reversibly modified post-translationally to play a role in the cytoplasm. Proteomic analysis of flies that ectopically expressed chinmo in the adult neurons identified several downregulated biological processes including fat metabolism. In addition, this analysis also identified upregulated processes such as cytoplasmic translation, macromolecule localization, retrograde vesicle-mediated transport, and intra Golgi vesicle-mediated transport, that may aid researchers to assign new cytoplasmic functional roles for this dosage-sensitive factor (Figure 7—figure supplement 2). In addition, we show that chinmo is transcriptionally regulated by nutrition deprivation. A significant increase in chinmo mRNA levels was observed in flies that were exposed to DR or starvation conditions (Figure 3 and Figure 4—figure supplement 2). These data reveal that Chinmo shares several attributes with the insulin/IGF signaling pathway—it is a nutrient-regulated factor that plays a critical role in the temporal fate specification of neurons during development. Silencing of chinmo in the adult brain by miR-125 is required for normal aging (Chawla et al., 2016). More importantly, in this study, we show that reducing chinmo in the the adult fat body increases lifespan under AL conditions. Additionally, our results indicate that Chinmo may play a role in fat metabolism through its ability to circulate by loading onto exosomes. Lastly, another plausible hypothesis is that Chinmo exerts a feed-forward effect by inducing a signal that is relayed to the fat tissue to increase its expression in a non-autonomous manner. Future studies focused on the analysis of Chinmo and its interacting partners will likely uncover newer non-nuclear functional roles for Chinmo.

Role of miR-125 in aging and late-onset diseases

We previously showed that miR-125 plays a role in regulating lifespan and maintenance of neuronal integrity (Chawla et al., 2016). In this study, we show that overexpression of the human miR-125 in the adult fat tissue is sufficient to enhance lifespan (Figure 8). In addition to its role in modulating lifespan, miR-125 has also been identified as a circulating diagnostic biomarker in Alzheimer’s disease and Type 2 Diabetes (Ortega et al., 2014; Tan et al., 2014; Villeneuve et al., 2010). These and several other studies, highlight the importance of this conserved small RNA as a pro-longevity factor, biomarker and disease-modifier. However, the widespread expression of this miRNA in metazoans calls for a more detailed analysis of the tissue-specific effects of miR-125 before it can be considered as a relevant therapeutic target for the treatment of age-related diseases.

Taken together, our analyses have identified miR-125 as an effector of DR pathway. miR-125 is regulated by dietary signals (DR) and represses chinmo, thus leading to de-repression of genes involved in fat metabolism in peripheral tissues, which in turn result in the extension of lifespan. (Figure 9). This functional analysis sets the stage for evaluation of miR-125 and other conserved miRNAs as candidates for developing therapeutics that promote healthy aging and prevent/delay late-onset diseases.

Figure 9. miR-125 regulates DR-dependent lifespan extension by post-transcriptionally silencing chinmo.

Figure 9.

Proposed model summarizing the mechanism by which miR-125 and chinmo regulate lifespan extension by DR. miR-125 targets chinmo mRNA in the brain under AL and DR conditions. In the adult fat tissue, Chinmo transcriptionally represses genes involved in fat metabolism. DR-mediated cytoplasmic relocalization of Chinmo in the fat tissue relieves transcriptional repression of genes involved in fat metabolism, thus increasing lifespan.

Materials and methods

Key resources table.

Reagent type
(species) or
resource
Designation Source or
reference
Identifiers Additional
information
Antibody Anti-GFP(chicken) Thermo Fisher Scientific A10262, RRID:AB_2534023 1:2500/1:1000
Antibody Anti-Flag(mouse) Sigma-Aldrich F-1804, RRID:AB_262044 1: 2500
Antibody Anti-Fatp(rabbit) Gift from B. Mollereau Dourlen et al., 2012 1:200
Antibody Anti-acetyl lysine Cell Signaling #9441; RRID:AB_331805 1:750
Antibody Anti-chinmo (rat) Gift from Nick Sokol (Wu et al., 2012) 1:1000
Antibody Anti-Woc(rabbit) Gift from Maurizio Gatti (Raffa et al., 2005) 1:1000
Antibody Anti-La(rabbit) Gift from S.L. Wolin (Yoo and Wolin, 1994) 1:1000
Antibody Anti-tubulin(mouse) Sigma-Aldrich T9026, RRID:AB_477593 1:4000
Antibody Anti-dCsp1(mouse) DSHB DSHB Cat# ab49, RRID:AB_2307340 1:1000
Antibody Anti-Syntaxin 1A
(mouse)
DSHB DSHB Cat# 8C3, RRID:AB_528484 1:500
Antibody Anti-HrsFL(Guinea Pig) Gift from Hugo Bellen 1:2000
Antibody Anti-mouse HRP Jackson Immuno Research, Laboratories, Inc 115-035-003, RRID:AB_10015289 1: 2500
Antibody Anti-chicken HRP Sigma-Aldrich A9046, RRID:AB_258432 1: 2500
Antibody Anti-Rabbit HRP Jackson Immuno Research, Laboratories, Inc 111-035-003, RRID:AB_2313567 1: 2500
Antibody Alexa Fluor 488 Affinipure Donkey anti-chicken IgY Jackson Immuno Research, Laboratories, Inc 703-545-155, RRID:AB_2340375 1:1000
Antibody Alexa Fluor 488 Affinipure Donkey anti-Rat IgG Jackson Immuno Research, Laboratories, Inc 712-545-153, RRID:AB_2340684 1:1000
Antibody Alexa Fluor 488 Affinipure Donkey anti-Mouse IgG Jackson Immuno Research, Laboratories, Inc 712-545-151; RRID:AB_2340846 1:1000
Antibody Goat-anti-Rabbit IgG, Alexa Fluor 568 Thermo Fisher Scientific A-11036, RRID:AB_10563566 1:1000
Antibody Alexa Fluor 568
Goat-anti-Mouse IgG
Thermo Fisher Scientific A-11031, RRID:AB_144696 1:1000
Chemical compound, drug Nile Red Sigma-Aldrich 72485 1:250
Other Normal goat serum Jackson Immuno Research, Laboratories, Inc 005-000-121, RRID:AB_2336990
Chemical compound, drug Deacetylase inhibitor cocktail ApexBio K1017 1:100
Chemical compound, drug Phospho Safe Extraction reagent Merck 71296
Other Anti-Flag M2-Affinity gel Sigma-Aldrich A2220, RRID:AB_10063035 Resin
Peptide, recombinant protein Flag peptide Sigma-Aldrich F4799
Chemical compound, drug SYBR Premix Ex Taq Takara Bio RR420A
Commercial assay or kit Taqman Fast advanced mix Thermo Fisher Scientific 4444557
Sequence-based reagent Taqman microRNA assay for miR-100 Thermo Fisher Scientific Assay ID 000287
Sequence-based reagent Taqman probes for let-7–5 p Thermo Fisher Scientific Assay ID 000332
Sequence-based reagent Taqman probes for miR-125–5 p Thermo Fisher Scientific Assay ID 000449
Sequence-based reagent Taqman probes for Sno446 Thermo Fisher Scientific Assay ID 001742
Sequence-based reagent Taqman probes for 2S rRNA ThermFisher Scientific Assay ID 001766
Other HyClone CCM3 cell culture media Cytiva SH30061.01
Chemical compound,drug RNAiso Plus Takara Bio 9109
Chemical compound, drug Phenol: Chloroform Sigma-Aldrich P1944
Transfection construct Lipofectamine 3000 Transfection Reagent Thermo Fisher Scientific L3000015
Other DNAse I (RNAse-free) New England BioLabs, Inc NEB Catalog #: M0303 Enzyme
Commercial assay or kit Triglyceride reagent Sigma-Aldrich T2449
Commercial assay or kit Free Glycerol reagent Sigma-Aldrich F6428
Recombinant DNA reagent TopoXL cloning kit Thermo Fisher Scientific K804010
Commercial assay or kit High-Capacity Reverse Transcription assay kit Thermo Fisher Scientific 4368814
Other SUPERase In RNAse Inhibitor Thermo Fisher Scientific AM2696 RNAase inhibitor
Other dNTP set 100 mM solutions Thermo Fisher Scientific R0181 dNTPs
Other Superscript IV Reverse Transcriptase Thermo Fisher Scientific 18090050 Enzyme
Other Phusion High-Fidelity DNA Polymerase New England BioLabs, Inc NEB Catalog# M0530S Enzyme
Recombinant DNA reagent Quick Ligation Kit New England BioLabs, Inc NEB Catalog# M2200L
Genetic reagent (D. melanogaster) w1118 Bloomington Drosophila Stock Centre
Genetic reagent (D. melanogaster) let-7-CGKI Sokol et al., 2008
Genetic reagent (D. melanogaster) let-7-CKO2 Wu et al., 2012
Genetic reagent (D. melanogaster) chinmo1 Zhu et al., 2006
Genetic reagent (D. melanogaster) P{w+, UAS-Chin::SV40} Chawla et al., 2016
Genetic reagent (D. melanogaster) P{w+, UAS-chinmoRNAi 148} VK00033 Chawla et al., 2016
Genetic reagent (D. melanogaster) P{w+, UAS-hsa miR-125b-1} VK00033
Genetic reagent (D. melanogaster) P{v+, let-7-C ΔmiR-100}attP2 Chawla et al., 2016
Genetic reagent (D. melanogaster) P{v+, let-7-C Δlet-7}attP2 Chawla et al., 2016
Genetic reagent (D. melanogaster) P{v+, let-7-CΔmiR-125}attP2 Chawla et al., 2016
Genetic reagent (D. melanogaster) P{w+, let-7-Cp3.3kb::cDNA}VK00033 Chawla and Sokol, 2012
Genetic reagent (D. melanogaster) 3XelavGS Kind gift from Scott Pletcher
Genetic reagent (D. melanogaster) P{w+, UAS-FASN1RNAi-1}attP2 Bloomington Stock 35775
Genetic reagent (D. melanogaster) P{w+, UAS-FATPRNAi}attP2 Bloomington Stock 55919
Genetic reagent (D. melanogaster) P{w+, UAS-Flag FATP::SV40} This study (Chawla Lab) G. Chawla (Regional Centre for Biotechnology)
Genetic reagent (D. melanogaster) P{w+, UAS-Flag Chinmo::SV40} This study (Chawla Lab) G. Chawla (Regional Centre for Biotechnology)
Genetic reagent (D. melanogaster) FB-GS Bloomington Stock 8151
Genetic reagent (D. melanogaster) 5966 (Gut specific GS) Kind gift from David Walker
Genetic reagent (D. melanogaster) Da GS Kind gift from David Walker
Genetic reagent (D. melanogaster) UAS GFP Bloomington Stock 32198
Sequence-based reagent Primers for RT-PCRs and cloning, see Supplementary file 2 This study (Chawla Lab) G. Chawla (Regional Centre for Biotechnology)
Recombinant DNA reagent UAS Flag Chinmo plasmid This study (Chawla Lab) G. Chawla (Regional Centre for Biotechnology)
Recombinant DNA reagent UAS GFP Chinmo plasmid This study (Chawla Lab) G. Chawla (Regional Centre for Biotechnology)
Software, algorithm OASIS Han et al., 2016 https://sbi.postech.ac.kr/oasis/
Software, algorithm GraphPad Prism GraphPad RRID:SCR_000306
Software, algorithm GPS-PAIL 2 Deng et al., 2016, Li et al., 2006 http://pail.biocuckoo.org

Drosophila melanogaster stocks and husbandry

Fly stocks were maintained in standard cornmeal/agar medium (composition provided in the next section) at 25°C with a 12 hr light: 12 hr dark cycle in 60% humidity. Fresh fly food was prepared every 3 days to prevent desiccation. For steroid-mediated UAS-transgene control using the Gene-Switch driver, flies were fed a diet containing 200 μM RU-486 (Mifepristone, Cayman Chemicals, Ann Arbor MI). Unless otherwise noted, adult female flies of indicated ages were used for experiments. All experiments were performed in the Drosophila chamber Model DR-36VL (Percival Scientific, Inc, IA, USA). Detailed genotypes of all strains as well as the sources of the genetic mutations and transgenes used in the study are listed in Figure 6—figure supplement 2 and Figure 6—figure supplement 3, respectively. Transgenesis was performed by the Fly Facility at Bangalore Life Science Cluster (CCAMP, Bengaluru, India). Stocks with multiple genetic elements were obtained by genetic recombination and/or crosses. The let-7-CGKI mutation contains a 991-base-pair deletion that removes the miR-100, let-7, and miR-125. Additionally, the let-7-CGKI mutation (let-7-C GAL4 Knock-In) contains the GAL-4 and white coding sequence driven by the let-7-C promoter (Sokol et al., 2008). The let-7-CKO2 is identical except that the endogenous let-7-C locus was replaced with white rather than white and gal4 (Wu et al., 2012). All UAS lines used in the study were backcrossed four times. The scheme for the generation of strains used in Figures 1 and 2 is represented in Figure 1—figure supplement 1. The genetic scheme ensured that experimental and control lines had identical genetic backgrounds. Flies that were analyzed were trans-heterozygous for two different let-7-C null alleles, ensuring that phenotypes were not due to recessive mutations on either let-7-C mutant chromosome. In addition, third chromosomes that contained differing rescuing transgenes were derived in parallel from the same population of flies. Finally, all flies had a common X-chromosome, derived from an isogenized stock. All rescuing transgenes in Figures 1 and 2, including the wild-type rescuing transgene as well as, let-7 and miR-125 deleted versions, were injected into embryos from the same population of BL#25710. The resulting progeny were backcrossed twice to BL#32261 to select and balance vermillion+ transformants. Single transformants were subsequently backcrossed to an isogenized version of BL#3703 three times to make balanced stocks with isogenized X chromosomes. Stocks with differing rescuing transgenes were crossed to the same population of a stock that contained the let-7-CKO2 chromosome, an isogenized X chromosome, and two 3rd chromosome balancers. The let-7-CKO2 stock was generated in a similar fashion as the rescuing transgenes stocks, by backcrossing three times to an isogenized version of BL#3703. The resulting stocks had common X, 2nd, and 3rd chromosomes and were used to generate the experimental strains. A second let-7-C allele, let-7-CGKI, was prepared by outcrossing twice to an isogenized stock, and then crossed to an isogenized stock containing a T (2:3) Cyo-TM6b compound chromosome. The let-7-C allele was selected based on mini-white, and the T (2:3) Cyo-TM6b balancer was selected based on the dominant Humoral marker. The resulting stock with a fixed second and third chromosome was amplified and used as the source for all virgins in the crosses that yielded the flies for analysis. For the generation of the let-7-C hypomorphic rescue and mutant line, the let-7-CHyp transgenic was combined with let-7-CKO2 stock. The remaining steps were similar to the scheme described (Figure 1—figure supplement 1). The genotypes of all the strains used in the study are indicated in the manuscript text, figure legends, and Supplementary file 1.

Diets used in the study

Cornmeal sugar medium (1L)

Cornmeal (80 g); Yeast extract (15 g); Sucrose (25.85 gm); Dextrose (51.65 gm); 8 g agar; methyl paraben (1 gm) in 5 ml Ethanol; 10 mL of Acid mix (Propionic acid: Orthophosophoric acid).

Ad libitum (AL) diet (1L): Yeast Extract (5%); Corn meal (8.6%); Sucrose (5%); Agar (0.46%); 10 ml of Acid Mix (Propionic acid: Orthophosophoric acid) (1%).

Dietary restriction (DR) diet (1L): Yeast Extract (0.25%); Corn meal (8.6%); Sucrose (5%); Agar (0.46%); 10 ml of Acid Mix (Propionic acid: Orthophosophoric acid) (1%).

Starvation medium: 1.5% agarose in Phosphate Buffered Saline (PBS).

Survival analysis

Twenty female flies (1–3 days old) were transferred to each vial. Flies were transferred to fresh food every 3 days at which time dead flies were removed. Surviving flies were recorded every 2 days. The survival curves were plotted using Microsoft Excel. Statistical analysis was performed with the Online Application for the Survival Analysis of lifespan assays (OASIS) and GraphPad prism (Han et al., 2016; Yang et al., 2011), and the p-values were calculated using the log-rank (Mantel-cox) test and Cox proportional regression analysis. The number of flies used for each experiment was noted along with the median and maximum lifespans of the tested strains long with p values and ψ2 values of the comparisons made in Figure 1—source data 1, Figure 2—source data 1, Figure 3—source data 1, Figure 6—source data 1, Figure 7—source data 1, Figure 7—source data 2, Figure 7—source data 3, Figure 8—source data 1, Figure 8—source data 1. Experiments usually included two independent controls: w1118 as well as a let-7-C mutant strain containing a fully rescuing transgene. The w1118 survival curve was generated with flies that had been backcrossed five times. To ensure that the DR phenotypes were not due to an effect of RU-486 the genetic background, survival analysis was performed with progeny from crosses between w1118 and the relevant stocks used to generate the experimental and control strains used in Figures 1, 2, 3, 6, 7 and 8 and have been represented in the respective figure supplements and source data.

Plasmids and transgenes

The N-terminal Flag-Chinmo cDNA was amplified using primers 109/242 by using RE59755 plasmid (DGRC). The N-Terminal codon-optimized GFP-Chinmo was subcloned as an EcoRI-XbaI fragment by PCR amplification. Optimized GFP was amplified as an EcoRI-Xho1 fragment and cloned in frame with Chinmo using the primers 238/239 by using Addgene plasmid 26229 as a template (Pfeiffer et al., 2010). Chinmo cDNA was amplified using primers 241/242 on the RE59755 plasmid (DGRC). GFP-Chinmo mutants were generated by SOE-PCR (Primers listed in Figure 6—figure supplement 2). Primers were designed to mutate predicted lysine residues to Glutamine. The putative Lysine residues were identified by utilizing the GPS-PAIL two online tool (Deng et al., 2016; Li et al., 2006). The outer 5’ end and 3’ end primers for all the chinmo mutants were 241/242, and these PCRs were sub-cloned as XhoI-XbaI fragments in frame with Optimized GFP into pUAST attB plasmid.

The C-terminal Flag-tagged FATP cDNA was sub-cloned as a XhoI-XbaI fragment into pUAST attB using the primers 211 and 209 by using SD05207 plasmid (DGRC).

Drosophila melanogaster Sir2 cDNA was amplified from FI19438 plasmid available from the Drosophila Genomic Resource Center (DGRC) using primers 586/587. The PCR products were cloned into pENTR/D-TOPO (Thermo Fisher Scientific). Plasmids expressing flag and Myc-tagged versions of dSir2 were generated by recombining pENTR-dSir2 with pAFW and pAMW Gateway plasmids (T. Murphy, Carnegie Institute for Science, Baltimore; obtained from DGRC, Bloomington, IN), respectively in an LR clonase enzyme (Thermo Fisher Scientific) reaction. The N-terminal Flag dSir2 was sub-cloned as a Not I-Xba I fragment into pUAST attB plasmid by PCR amplification with primers 322/323.

The hsa mir-125b1 primary transcript was generated by annealing the oligo pair 1070/1071 and cloned into the XbaI site of pUAST attB. All PCRs were performed with High fidelity Phusion enzyme (Thermo Fisher Scientific, USA) and all clones were verified by sequencing. The primers used for cloning are listed in Supplementary file 2.

RNA isolation and quantitative real-time PCR

Total RNA was extracted from whole fly or tissue samples using RNAiso Plus (Takara Bio, Inc). Animals/tissues were homogenized in 0.2 ml of RNAiso Plus with a micropestle (Tarsons) before extraction. The cDNA was generated by using a High-capacity cDNA reverse transcription Kit (Thermo Fisher Scientific, MA, USA). In each reaction, 0.5–1 μg was mixed with random hexamers, MgCl2, 10X RT Buffer, dNTPs, RNAse Inhibitor and MultiScribe Reverse transcriptase in a 10 μl total volume. The cDNA synthesis was performed as per the manufacturer’s protocol in a Bio-Rad C1000 Touch Thermal Cycler. The synthesized cDNA was diluted (1:10) and used as template for quantitative real-time PCR (qRT-PCR) using SYBR premix EX-Taq- plus (TaKara) and analyzed on QuantStudio 6 Real-Time PCR machine (Thermo Fisher Scientific, Waltham, Massachusetts, USA). The expression of the target genes was normalized to actin-5C or rp49. For expression analysis of miRNAs, Taqman miRNA assays (Thermo Fisher Scientific, Waltham, Massachusetts, USA) specific for the miRNA (dme miR-100, dme-let-7 and dme-miR-125). Each cDNA sample was diluted 1:25 and real-time quantitative PCR (qPCR) was performed in duplicate using miRNA-specific primers/probe on a Quant six studio Real Time PCR System (Thermo Fisher Scientific, Waltham, Massachusetts, USA). For fold change analysis, individual values were normalized to 2S rRNA or Snu442 for Taqman miRNA assays and rp49 or Actin 5 c levels for SYBR green assays. For qRT-PCR analysis, oligos 7, 8, 13, 14, 17, 18, 23, 24, 102a, 103a, 179, 180, 181, 182, 1183, 184, 185, 186, 187, 188, 189, 190, 191, 192, 193, 194, 3 and 4 listed in Supplementary file 2 were used.

Measurement of protein levels

Protein levels were quantitated using the Bio-Rad protein assay dye reagent concentrate (BIO-RAD, CA, USA) as per the manufacturer’s instructions.

Measurement of triglycerides levels

Triglyceride quantification was performed as described in Tennessen et al., 2014.

Immunostaining and microscopy

Tissues were dissected in PBS and fixed for 30 min in 4% paraformaldehyde. Immunofluorescence was performed as described previously (Chawla and Sokol, 2012; Wu et al., 2012). Primary antibodies included rat anti-Chinmo (Wu et al., 2012), guinea pig anti-Chinmo (gift from Nick Sokol), rabbit anti-Woc (Raffa et al., 2005) (gift from Maurizio Gatti 1:1000), rabbit anti-La (gift from S. L. Wolin), mouse anti-Fmr1 (DSHB), mouse anti-Flag (Sigma-Aldrich) and, mouse anti-Dachshund (DSHB). For the staining of lipids, fruit flies were fed AL or DR diets for 20 days and fat bodies were dissected in 1X PBS. Tissues were fixed in 4% PFA for 30 min and three washes of 5 min each were given in 1X PBS + 0.3% Triton. Tissues were stained for 1 hr with Nile Red Staining solution (1 mg/mL in Acetone, 1:250 PBST) and DAPI (1:100 PBST). Samples were washed three times with PBST for 5 min and mounted. For immunostaining of transfected cells, poly-L-Lysine coated coverslips were placed in 6-well plates 48 hr after transfection. After 24 hr incubation, the cells were fixed for 30 min in 4% paraformaldehyde followed by permeabilization in 1X PBS + 0.3% Triton. Cells were blocked for 1 hr and incubated with primary antibody for 12 hr at 4°C. Primary antibodies were used at the following concentration: anti-chicken GFP (1: 2500), mouse anti-Flag (1:2500; Sigma-Aldrich), mouse anti-Fmr1 (1:100; DSHB). The coverslips were rinsed with PBS followed by incubation with Alexa-conjugated secondary antibodies for 1 hr at room temperature. Following incubation, the coverslips were rinsed with PBS and stained with DAPI for 15 min followed by three washes and mounted. Slides were analyzed under Leica SP8 Confocal Microscope and lipid droplet size was measured using Fiji/ImageJ software and graphs were plotted with GraphPad Prism v9. Confocal stacks were merged using Leica LAS software. Statistical analysis and histograms were generated using GraphPad Prism software. p Values were calculated using a two-tailed unpaired t test with Welch’s correction. Values are presented as mean ± SD.

For quantitating Chinmo levels in nuclear and peripheral regions, pixel intensity of 10 individual cells in images of five independent dissected abdomens stained with anti-Chinmo antibodies was quantified using ImageJ software. The expression of Chinmo (pixel intensity) was quantitated by measuring the same area between samples of a set (Nuclear or Periphery). Samples whose staining was directly compared were prepared and imaged in parallel and under identical conditions. Slides were analyzed under Leica SP8 Confocal Microscope (Microscopy facility, Regional Centre for Biotechnology, India). Images of abdominal fat tissue were optically sectioned in 1 μm increments keeping the number of sections constant for each set. The image projections were collated from four to six sections and confocal stacks were merged using Leica LAS X software and all images were acquired at the same Laser intensity for a given set. Each experiment was performed three times. Statistical analysis was performed, and histograms generated using Graph-Pad Prism software. p Values were calculated using a two-tailed unpaired t-test with Welch’s correction. Values are presented as mean ± SD.

Exosome isolation

Kc-167 cells were cultured in T75 Flasks in the serum-free CCM3 medium. The cells were transfected with Tubulin-GAL4 and Flag Chinmo pUASTattB at a density of 1.5 × 10⁶ cells/ml with lipofectamine 3000 (Thermos Fisher Scientific) according to the manufacturer’s instruction. After 72 hr of transfection, the cells were starved for 8 hr by culturing in 2 mg/ml Glucose in Phosphate buffered saline (1X PBS). The medium from both control (fed) and starved conditions was collected and concentrated using Amicon Ultra −15 Centrifugal Filter Unit, Ultracel, 3 KDa, 15 ml (Millipore). Exosomes were isolated by size exclusion chromatography with qEV single/35 nm IZON Columns (IZON Science) according to the manufacturer’s instructions. The eluted fractions were collected and an indicative elution profile for exosome particles and proteins was obtained by monitoring Absorbance at 600 nm and 280 nm, respectively. Western blot of collected fractions was performed with anti-Syntaxin 1A (1:500; DSHB), anti-Csp (1:1000; DSHB), anti-HrsFL (1:20,000; kindly provided by H. Bellen), and Flag antibody (1:2500; Sigma Aldrich). Western blot analysis of different fractions revealed that the elution of vesicles peaked 200–400 μl after void volume (1 ml) and these fractions were pooled and used for the RNA or protein analysis.

Immunoprecipitation and western blot analysis

Kc167 cells were cultured in T75 flasks at a density of 1.5 × 10⁶ cells/ml, transfected with Tubulin Gal4 (15 μg) along with other UAS (15 μg) and/or Gateway expression plasmids (20 μg) along with 50 μL Lipofectamine 3000 per flask and harvested after 72 hr. Transfected Kc167 cells were lysed (Phospho Safe Extraction buffer; Merck) with Protease Inhibitors (Sigma-Aldrich) and Deacetylation inhibitor cocktail (ApexBio). The lysates were sonicated and centrifuged, and the resulting lysate was incubated with 12.5 μL of anti-Flag M2 affinity gel (Sigma) at 4°C with nutation for 3 hr. Beads were washed three times with IP150 buffer (50 mM Tris HCl, pH 7.4, with 150 mM NaCl) and bound proteins were eluted by incubating with 150 ng/mL of 3X FLAG peptide (Sigma) for 30 min at 4°C with nutation. The eluate was then used for Western blot analysis. Western blots were probed with primary antibodies, including anti-Flag antibody (1: 2500; Sigma), anti-Myc antibody (1: 2000; Abcam), anti-Tubulin antibody (1: 4000; Sigma), anti-GFP (1: 1000; Thermo Fisher Scientific), anti-acetyl lysine (1: 750; Cell Signaling). Primary antibodies were detected with HRP-conjugated secondary antibodies (1: 2500; Jackson Immunoresearch Laboratories, Inc), and the chemiluminescent signal was detected using a GE Healthcare LAS 4000 (Central Instrumentation Facility, Regional Centre for Biotechnology).

Proteomics analysis

Age-matched mated female flies were fed +or + RU-486 food for 5 or 10 days. Protein lysate was prepared by freezing female flies (n = 5 per replicate). Flies were homogenized in 100 μL of Ammonium bicarbonate buffer (100 mM ammonium bicarbonate and 8M urea) after adding appropriate amount of 100X Protease inhibitor cocktail (Sigma). The samples were centrifuged for 15 min at maximum speed at 4°C in a microfuge and the supernatant was collected, quantitated and processed for Proteomic analysis.

Trypsin digestion and desalting

Proteins from control and 5 days treated samples were precipitated using 4 volumes of chilled acetone. Precipitated proteins were washed thrice with chilled acetone and dried at room temperature. Precipitates were reconstituted in 100 mM Ammonium bicarbonate and treated with 5 mM DTT for 30 min at 55°C. Reduced disulfide bonds were alkylated using 10 mM Iodoacetamide for 30 min at 55°C. Proteins were digested using MS grade trypsin (Promega Trypsin Gold) in a ratio of 1:50 for 12 hr. After digestion, peptides were dried in a SpeedVac vacuum dryer and reconstituted in 2% Acetonitrile (ACN) and 0.1% Formic acid (FA). The reconstituted peptides were cleaned and desalted using a C18 cartridge (Oasis HLB 1cc). Samples were eluted in 0.1%FA and 50% ACN from the cartridge after desalting with 0.1% FA in water. The eluted peptides were dried in a SpeedVac vacuum dryer and reconstituted in 15 µL of 2% ACN and 0.1%FA.

LC-ESI MS/MS analysis

Digested peptides were loaded onto a CapTrap C18 trap cartridge Cap-Trap C18 trap cartridge (Michrom Bioresources, Auburn, CA, USA) and desalted for 10 min at the rate of 10 μl/min using 2% ACN and 0.05% trifluoroacetic acid (TFA) in water using Eksigent NanoLC 400. Labeled peptides were separated on Chromolith Caprod RP-18e HR capillary column (150 × 0.1 mm; Merck Millipore) using linear gradient of buffer B (98% ACN and 0.05% TFA in water) in buffer A (2% ACN and 0.05% TFA in water). Peptides were eluted at the rate of 300 nL/min, which were directed to the Sciex 5600 TripleTOF System for MS and MS/MS analysis. MS spectra were acquired from 350 Da to 1250 Da, and the peptides were fragmented and MS/MS spectra acquired using DDA method. In brief, 25 most intense peaks were fragmented using collision-induced dissociation (CID) with rolling collision energy in each cycle. The MS/MS spectra was acquired from 100 Da to 1600 Da.

MS/MS data analysis

The MS/MS spectra search to identify peptides was performed using the FASTA database of protein sequences from D. melanogaster, available at UniProtKB website (https://www.uniprot.org/taxonomy/7227, proteome ID UP000000803). In order to avoid misidentifications, most common contaminants such as human keratin and porcine trypsin were also included in the database FASTA file. The MS/MS peak list data files were analyzed by Mascot ion search engine version 2.3.02, with one fixed modification; carbamidomethylation of cysteine (monoisotopic mass of 57.0215 Da), two variable modifications; methionine oxidation (monoisotopic mass of 15.9949 Da), deamidation (monoisotopic mass of 0.984 Da) and a peptide and MS/MS fragment ion mass tolerance of 0.1 Da. Up to two missed cleavages were allowed along with Mascot automatic decoy database search. The MASCOT DAT files from all fractions of each biological replica of 5 days control (1C1, 1C2, and 1C3) and treated (1E1, 1E2, and 1E3) samples were merged during the search and output file was analyzed using Scaffold Q + S version 4.9.0 (Proteome Software, Portland, OR, USA) to generate a full report of proteomic data, which is provided in Supplementary files 3 and 4. Protein identification validation was performed by Scaffold parameters including Mascot ion scores of 30 or higher (for +2, +3, and +4 charges), a minimum of two identified peptides, 100 ppm of parent mass tolerance, 95% peptide identification probability and 95% protein identification probability, (using the Scaffold Local FDR algorithm), resulting in a 0.0% decoy-based FDR. Protein fold change values were calculated on the basis of Normalized Spectral Abundance Factor (NSAF), calculated for each protein. Proteins with fold change values less than or equal to 0.5 were down-regulated and the proteins with fold change values more than or equal to two were up-regulated. Quantitative differences were statistically analysed by a t-test and volcano plot (Figure 7E), where differences with p-values lower than 0.05 were considered statistically significant. A two-tailed t test with equal variance between samples was performed to calculate the p-value. In Figure 6E, values were log transformed and INF (Infinity) values were changed to four and zero values to −4 (representing +and or over and under expression). Identified proteins were categorized according to gene ontology terms using STRING, an online database of known and predicted protein-protein interactions. Validation of the identified proteins, spectral abundance values and comparative analysis between control and test samples was done using Scaffold. GO functional categories assigned to the identified proteins have been represented in (Figure 7F and Supplementary files 3 and 4).

Statistical analysis

Data representation and statistical analysis were performed using GraphPad Prism eight software and/or Microsoft Excel. Survival curves were compared using log-rank tests, with Bonferroni corrections for p values where multiple comparisons were necessary. Cox proportional Hazard regression analysis was also performed using the Online Application for the Survival Analysis of Lifespan (OASIS) online tool {20 #216}. All survival and lifespan graphs show one representative experiment out of two or three independent repeats with two to three cohorts of 20 female flies per genotype. A two-tailed t test with Welch’s correction was used to analyze data in Figure 1B–G, Figure 1—figure supplement 1B-D, Figure 2G–H, Figure 3B–F,H,J, Figure 3—figure supplement 1B–G, Figure 4C,E,I–L,N–P, Figure 4—figure supplement 2B–C,E–F,G–I, Figure 6F–M, Figure 6—figure supplement 1E,G, Figure 6—figure supplement 3D–E, Figure 7A–C,G–H, Figure 7—figure supplement 1A–B,D–E, Figure 7—figure supplement 3D–E, Figure 8B,D,F,G,H. Other details on statistical analysis can be found in Figure legends. Statistical significance was set at p<0.05. p Values are denoted in red for statistically significant comparisons and in black for comparisons that were not statistically significant.

Acknowledgements

This work was supported by the DBT/Wellcome Trust India Alliance Fellowship/Grant [grant number IA/I(S)/17/1/503085] awarded to GC. The proteomics analysis was performed at the Mass Spectrometry Facility of the Advanced Technology Platform Centre (ATPC) (Grant No. BT.MED-II/ATPC/BSC/01/2010). AKY was supported by DBT-Big Data Initiative grant (BT/PR16456/BID/7/624/2016) and Translational Research Program (TRP) at THSTI funded by DBT. The authors acknowledge the advice and inputs of Dr. Nirpendra Singh for the proteomics analysis. Fly Facility at Bangalore Life Science Cluster is acknowledged for microinjection of the transgenic line constructs. The author’s thank Dr. Arthur Luhur for microinjection of the hsa miR-125b-1 construct and Jennifer Beck for lifespan analysis to test the effect of RU-486 on 3X ElavGS flies in AL and DR. The authors thank Drs. Scott Pletcher and David Walker and Bloomington Drosophila Stock Center (NIH P40OD018537) for fly stocks, Drosophila Genomics Resource Center (NIH 2P40OD010949) for plasmids and cell line, Dr. M Gatti for Woc antibody, Dr. SL Wolin for La antibody, Dr. H Bellen for Hrs antibody and Dr. Bertrand Mollereau for Fatp antibody.

Funding Statement

The funders had no role in study design, data collection and interpretation, or the decision to submit the work for publication.

Contributor Information

Pankaj Kapahi, Email: Pkapahi@buckinstitute.org.

Geetanjali Chawla, Email: gchawla@rcb.res.in.

Dario Riccardo Valenzano, Max Planck Institute for Biology of Ageing, Germany.

Jessica K Tyler, Weill Cornell Medicine, United States.

Funding Information

This paper was supported by the following grant:

  • Wellcome-Trust DBT India Alliance IA/I(S)/17/1/503085 to Geetanjali Chawla.

Additional information

Competing interests

No competing interests declared.

Author contributions

Investigation, Writing - review and editing.

Investigation, Writing - review and editing.

Investigation, Writing - review and editing.

Formal analysis, Statistical analysis, proteomic analysis and motif analysis.

Resources, Writing - review and editing.

Resources, Investigation.

Resources, Investigation, Writing - review and editing.

Conceptualization, Resources, Formal analysis, Supervision, Funding acquisition, Validation, Investigation, Methodology, Writing - original draft, Project administration, Writing - review and editing.

Additional files

Supplementary file 1. Genotypes used in the study.
elife-62621-supp1.docx (18.5KB, docx)
Supplementary file 2. Primers used in the study.
elife-62621-supp2.docx (16.7KB, docx)
Supplementary file 3. Downregulated biological process.
elife-62621-supp3.xlsx (15.5KB, xlsx)
Supplementary file 4. Upregulated biological process.
elife-62621-supp4.xlsx (14.5KB, xlsx)
Transparent reporting form

Data availability

All data generated or analyzed during this study are included in the manuscript and supporting files. Source data files have been provided for Figures 1, 2, 3, 4, 5, 6, 7, 8. Proteomics analysis data done in Figure 7 is also provided in Supplementary files 3 and 4 (Upregulated and downregulated processes).

References

  1. Anson RM, Guo Z, de Cabo R, Iyun T, Rios M, Hagepanos A, Ingram DK, Lane MA, Mattson MP. Intermittent fasting dissociates beneficial effects of dietary restriction on glucose metabolism and neuronal resistance to injury from calorie intake. PNAS. 2003;100:6216–6220. doi: 10.1073/pnas.1035720100. [DOI] [PMC free article] [PubMed] [Google Scholar]
  2. Banerjee KK, Ayyub C, Ali SZ, Mandot V, Prasad NG, Kolthur-Seetharam U. dSir2 in the adult fat body, but not in muscles, regulates life span in a diet-dependent manner. Cell Reports. 2012;2:1485–1491. doi: 10.1016/j.celrep.2012.11.013. [DOI] [PubMed] [Google Scholar]
  3. Bao J, Sack MN. Protein deacetylation by sirtuins: delineating a post-translational regulatory program responsive to nutrient and redox stressors. Cellular and Molecular Life Sciences. 2010;67:3073–3087. doi: 10.1007/s00018-010-0402-y. [DOI] [PMC free article] [PubMed] [Google Scholar]
  4. Bartel DP. Metazoan MicroRNAs. Cell. 2018;173:20–51. doi: 10.1016/j.cell.2018.03.006. [DOI] [PMC free article] [PubMed] [Google Scholar]
  5. Barzilai N, Huffman DM, Muzumdar RH, Bartke A. The critical role of metabolic pathways in aging. Diabetes. 2012;61:1315–1322. doi: 10.2337/db11-1300. [DOI] [PMC free article] [PubMed] [Google Scholar]
  6. Boehm M, Slack F. A developmental timing microRNA and its target regulate life span in C. elegans. Science. 2005;310:1954–1957. doi: 10.1126/science.1115596. [DOI] [PubMed] [Google Scholar]
  7. Bolukbasi E, Khericha M, Regan JC, Ivanov DK, Adcott J, Dyson MC, Nespital T, Thornton JM, Alic N, Partridge L. Intestinal fork head regulates nutrient absorption and promotes longevity. Cell Reports. 2017;21:641–653. doi: 10.1016/j.celrep.2017.09.042. [DOI] [PMC free article] [PubMed] [Google Scholar]
  8. Bradley TJ, Simmons FH. An analysis of resource allocation in response to dietary yeast in Drosophila Melanogaster. Journal of Insect Physiology. 1997;43:779–788. doi: 10.1016/s0022-1910(97)00037-1. [DOI] [PubMed] [Google Scholar]
  9. Chang HC, Guarente L. SIRT1 and other sirtuins in metabolism. Trends in Endocrinology & Metabolism. 2014;25:138–145. doi: 10.1016/j.tem.2013.12.001. [DOI] [PMC free article] [PubMed] [Google Scholar]
  10. Chawla G, Deosthale P, Childress S, Wu YC, Sokol NS. A let-7-to-miR-125 MicroRNA switch regulates neuronal integrity and lifespan in Drosophila. PLOS Genetics. 2016;12:e1006247. doi: 10.1371/journal.pgen.1006247. [DOI] [PMC free article] [PubMed] [Google Scholar]
  11. Chawla G, Sokol NS. Hormonal activation of let-7-C microRNAs via EcR is required for adult Drosophila melanogaster morphology and function. Development. 2012;139:1788–1797. doi: 10.1242/dev.077743. [DOI] [PMC free article] [PubMed] [Google Scholar]
  12. Cherbas L, Willingham A, Zhang D, Yang L, Zou Y, Eads BD, Carlson JW, Landolin JM, Kapranov P, Dumais J, Samsonova A, Choi JH, Roberts J, Davis CA, Tang H, van Baren MJ, Ghosh S, Dobin A, Bell K, Lin W, Langton L, Duff MO, Tenney AE, Zaleski C, Brent MR, Hoskins RA, Kaufman TC, Andrews J, Graveley BR, Perrimon N, Celniker SE, Gingeras TR, Cherbas P. The transcriptional diversity of 25 Drosophila cell lines. Genome Research. 2011;21:301–314. doi: 10.1101/gr.112961.110. [DOI] [PMC free article] [PubMed] [Google Scholar]
  13. Deng W, Wang C, Zhang Y, Xu Y, Zhang S, Liu Z, Xue Y. GPS-PAIL: prediction of lysine acetyltransferase-specific modification sites from protein sequences. Scientific Reports. 2016;6:39787. doi: 10.1038/srep39787. [DOI] [PMC free article] [PubMed] [Google Scholar]
  14. Dourlen P, Bertin B, Chatelain G, Robin M, Napoletano F, Roux MJ, Mollereau B. Drosophila fatty acid transport protein regulates rhodopsin-1 metabolism and is required for photoreceptor neuron survival. PLOS Genetics. 2012;8:e1002833. doi: 10.1371/journal.pgen.1002833. [DOI] [PMC free article] [PubMed] [Google Scholar]
  15. ENCODE Project Consortium An integrated encyclopedia of DNA elements in the human genome. Nature. 2012;489:57–74. doi: 10.1038/nature11247. [DOI] [PMC free article] [PubMed] [Google Scholar]
  16. Flaherty MS, Zavadil J, Ekas LA, Bach EA. Genome-wide expression profiling in the Drosophila eye reveals unexpected repression of notch signaling by the JAK/STAT pathway. Developmental Dynamics. 2009;238:2235–2253. doi: 10.1002/dvdy.21989. [DOI] [PMC free article] [PubMed] [Google Scholar]
  17. Flaherty MS, Salis P, Evans CJ, Ekas LA, Marouf A, Zavadil J, Banerjee U, Bach EA. Chinmo is a functional effector of the JAK/STAT pathway that regulates eye development, tumor formation, and stem cell self-renewal in Drosophila. Developmental Cell. 2010;18:556–568. doi: 10.1016/j.devcel.2010.02.006. [DOI] [PMC free article] [PubMed] [Google Scholar]
  18. Fontana L, Partridge L. Promoting health and longevity through diet: from model organisms to humans. Cell. 2015;161:106–118. doi: 10.1016/j.cell.2015.02.020. [DOI] [PMC free article] [PubMed] [Google Scholar]
  19. Gendron CM, Pletcher SD. MicroRNAs mir-184 and let-7 alter Drosophila metabolism and longevity. Aging Cell. 2017;16:1434–1438. doi: 10.1111/acel.12673. [DOI] [PMC free article] [PubMed] [Google Scholar]
  20. Guo H, Ingolia NT, Weissman JS, Bartel DP. Mammalian microRNAs predominantly act to decrease target mRNA levels. Nature. 2010;466:835–840. doi: 10.1038/nature09267. [DOI] [PMC free article] [PubMed] [Google Scholar]
  21. Han SK, Lee D, Lee H, Kim D, Son HG, Yang J-S, Lee S-JV, Kim S. OASIS 2: online application for survival analysis 2 with features for the analysis of maximal lifespan and healthspan in aging research. Oncotarget. 2016;7:56147–56152. doi: 10.18632/oncotarget.11269. [DOI] [PMC free article] [PubMed] [Google Scholar]
  22. Harman D. The free radical theory of aging. Antioxidants & Redox Signaling. 2003;5:557–561. doi: 10.1089/152308603770310202. [DOI] [PubMed] [Google Scholar]
  23. Huang H, Lu-Bo Y, Haddad GG. A Drosophila ABC transporter regulates lifespan. PLOS Genetics. 2014;10:e1004844. doi: 10.1371/journal.pgen.1004844. [DOI] [PMC free article] [PubMed] [Google Scholar]
  24. Huang R, Xu Y, Wan W, Shou X, Qian J, You Z, Liu B, Chang C, Zhou T, Lippincott-Schwartz J, Liu W. Deacetylation of nuclear LC3 drives autophagy initiation under starvation. Molecular Cell. 2015;57:456–466. doi: 10.1016/j.molcel.2014.12.013. [DOI] [PubMed] [Google Scholar]
  25. Johnson AA, Stolzing A. The role of lipid metabolism in aging, lifespan regulation, and age-related disease. Aging Cell. 2019;18:e13048. doi: 10.1111/acel.13048. [DOI] [PMC free article] [PubMed] [Google Scholar]
  26. Kapahi P, Kaeberlein M, Hansen M. Dietary restriction and lifespan: lessons from invertebrate models. Ageing Research Reviews. 2017;39:3–14. doi: 10.1016/j.arr.2016.12.005. [DOI] [PMC free article] [PubMed] [Google Scholar]
  27. Katewa SD, Demontis F, Kolipinski M, Hubbard A, Gill MS, Perrimon N, Melov S, Kapahi P. Intramyocellular fatty-acid metabolism plays a critical role in mediating responses to dietary restriction in Drosophila melanogaster. Cell Metabolism. 2012;16:97–103. doi: 10.1016/j.cmet.2012.06.005. [DOI] [PMC free article] [PubMed] [Google Scholar]
  28. Kim VN. MicroRNA biogenesis: coordinated cropping and dicing. Nature Reviews Molecular Cell Biology. 2005;6:376–385. doi: 10.1038/nrm1644. [DOI] [PubMed] [Google Scholar]
  29. Klass MR. Aging in the nematode Caenorhabditis elegans: major biological and environmental factors influencing life span. Mechanisms of Ageing and Development. 1977;6:413–429. doi: 10.1016/0047-6374(77)90043-4. [DOI] [PubMed] [Google Scholar]
  30. Klebanov S. Can short-term dietary restriction and fasting have a long-term anticarcinogenic effect? Interdisciplinary topics in gerontology. 2007;35:176–192. doi: 10.1159/000096562. [DOI] [PubMed] [Google Scholar]
  31. Kraus WE, Bhapkar M, Huffman KM, Pieper CF, Krupa Das S, Redman LM, Villareal DT, Rochon J, Roberts SB, Ravussin E, Holloszy JO, Fontana L, Investigators C, CALERIE Investigators 2 years of calorie restriction and cardiometabolic risk (CALERIE): exploratory outcomes of a multicentre, phase 2, randomised controlled trial. The Lancet Diabetes & Endocrinology. 2019;7:673–683. doi: 10.1016/S2213-8587(19)30151-2. [DOI] [PMC free article] [PubMed] [Google Scholar]
  32. Lee SH, Lee JH, Lee HY, Min KJ. Sirtuin signaling in cellular senescence and aging. BMB Reports. 2019;52:24–34. doi: 10.5483/BMBRep.2019.52.1.290. [DOI] [PMC free article] [PubMed] [Google Scholar]
  33. Li A, Xue Y, Jin C, Wang M, Yao X. Prediction of Nepsilon-acetylation on internal lysines implemented in Bayesian Discriminant Method. Biochemical and Biophysical Research Communications. 2006;350:818–824. doi: 10.1016/j.bbrc.2006.08.199. [DOI] [PMC free article] [PubMed] [Google Scholar]
  34. Lin SJ, Kaeberlein M, Andalis AA, Sturtz LA, Defossez PA, Culotta VC, Fink GR, Guarente L. Calorie restriction extends Saccharomyces cerevisiae lifespan by increasing respiration. Nature. 2002;418:344–348. doi: 10.1038/nature00829. [DOI] [PubMed] [Google Scholar]
  35. Liu N, Landreh M, Cao K, Abe M, Hendriks GJ, Kennerdell JR, Zhu Y, Wang LS, Bonini NM. The microRNA miR-34 modulates ageing and neurodegeneration in Drosophila. Nature. 2012;482:519–523. doi: 10.1038/nature10810. [DOI] [PMC free article] [PubMed] [Google Scholar]
  36. López-Otín C, Blasco MA, Partridge L, Serrano M, Kroemer G. The hallmarks of aging. Cell. 2013;153:1194–1217. doi: 10.1016/j.cell.2013.05.039. [DOI] [PMC free article] [PubMed] [Google Scholar]
  37. Maas SLN, Breakefield XO, Weaver AM. Extracellular vesicles: unique intercellular delivery vehicles. Trends in Cell Biology. 2017;27:172–188. doi: 10.1016/j.tcb.2016.11.003. [DOI] [PMC free article] [PubMed] [Google Scholar]
  38. Maswood N, Young J, Tilmont E, Zhang Z, Gash DM, Gerhardt GA, Grondin R, Roth GS, Mattison J, Lane MA, Carson RE, Cohen RM, Mouton PR, Quigley C, Mattson MP, Ingram DK. Caloric restriction increases neurotrophic factor levels and attenuates neurochemical and behavioral deficits in a primate model of Parkinson's disease. PNAS. 2004;101:18171–18176. doi: 10.1073/pnas.0405831102. [DOI] [PMC free article] [PubMed] [Google Scholar]
  39. Mattison JA, Roth GS, Beasley TM, Tilmont EM, Handy AM, Herbert RL, Longo DL, Allison DB, Young JE, Bryant M, Barnard D, Ward WF, Qi W, Ingram DK, de Cabo R. Impact of caloric restriction on health and survival in rhesus monkeys from the NIA study. Nature. 2012;489:318–321. doi: 10.1038/nature11432. [DOI] [PMC free article] [PubMed] [Google Scholar]
  40. Mattson MP, Wan R. Beneficial effects of intermittent fasting and caloric restriction on the cardiovascular and cerebrovascular systems. The Journal of Nutritional Biochemistry. 2005;16:129–137. doi: 10.1016/j.jnutbio.2004.12.007. [DOI] [PubMed] [Google Scholar]
  41. McCay CM, Crowell MF, Maynard LA. The effect of retarded growth upon the length of life span and upon the ultimate body size: one figure. Nutrition. 1989;5:155–171. doi: 10.1093/jn/10.1.63. [DOI] [PubMed] [Google Scholar]
  42. Mercken EM, Majounie E, Ding J, Guo R, Kim J, Bernier M, Mattison J, Cookson MR, Gorospe M, de Cabo R, Abdelmohsen K. Age-associated miRNA alterations in skeletal muscle from rhesus monkeys reversed by caloric restriction. Aging. 2013;5:692–703. doi: 10.18632/aging.100598. [DOI] [PMC free article] [PubMed] [Google Scholar]
  43. Mori MA, Raghavan P, Thomou T, Boucher J, Robida-Stubbs S, Macotela Y, Russell SJ, Kirkland JL, Blackwell TK, Kahn CR. Role of microRNA processing in adipose tissue in stress defense and longevity. Cell Metabolism. 2012;16:336–347. doi: 10.1016/j.cmet.2012.07.017. [DOI] [PMC free article] [PubMed] [Google Scholar]
  44. Narita T, Weinert BT, Choudhary C. Functions and mechanisms of non-histone protein acetylation. Nature Reviews Molecular Cell Biology. 2019;20:156–174. doi: 10.1038/s41580-018-0081-3. [DOI] [PubMed] [Google Scholar]
  45. Ortega FJ, Mercader JM, Moreno-Navarrete JM, Rovira O, Guerra E, Esteve E, Xifra G, Martínez C, Ricart W, Rieusset J, Rome S, Karczewska-Kupczewska M, Straczkowski M, Fernández-Real JM. Profiling of circulating microRNAs reveals common microRNAs linked to type 2 diabetes that change with insulin sensitization. Diabetes Care. 2014;37:1375–1383. doi: 10.2337/dc13-1847. [DOI] [PubMed] [Google Scholar]
  46. Pandit A, Jain V, Kumar N, Mukhopadhyay A. PHA-4/FOXA-regulated microRNA feed forward loops during Caenorhabditis elegans dietary restriction. Aging. 2014;6:835–851. doi: 10.18632/aging.100697. [DOI] [PMC free article] [PubMed] [Google Scholar]
  47. Pfeiffer BD, Ngo TT, Hibbard KL, Murphy C, Jenett A, Truman JW, Rubin GM. Refinement of tools for targeted gene expression in Drosophila. Genetics. 2010;186:735–755. doi: 10.1534/genetics.110.119917. [DOI] [PMC free article] [PubMed] [Google Scholar]
  48. Raffa GD, Cenci G, Siriaco G, Goldberg ML, Gatti M. The putative Drosophila transcription factor woc is required to prevent telomeric fusions. Molecular Cell. 2005;20:821–831. doi: 10.1016/j.molcel.2005.12.003. [DOI] [PubMed] [Google Scholar]
  49. Schneider A, Dhahbi JM, Atamna H, Clark JP, Colman RJ, Anderson RM. Caloric restriction impacts plasma microRNAs in rhesus monkeys. Aging Cell. 2017;16:1200–1203. doi: 10.1111/acel.12636. [DOI] [PMC free article] [PubMed] [Google Scholar]
  50. Sokol NS, Xu P, Jan YN, Ambros V. Drosophila let-7 microRNA is required for remodeling of the neuromusculature during metamorphosis. Genes & Development. 2008;22:1591–1596. doi: 10.1101/gad.1671708. [DOI] [PMC free article] [PubMed] [Google Scholar]
  51. Tan L, Yu JT, Liu QY, Tan MS, Zhang W, Hu N, Wang YL, Sun L, Jiang T, Tan L. Circulating miR-125b as a biomarker of Alzheimer's disease. Journal of the Neurological Sciences. 2014;336:52–56. doi: 10.1016/j.jns.2013.10.002. [DOI] [PubMed] [Google Scholar]
  52. Tchkonia T, Morbeck DE, Von Zglinicki T, Van Deursen J, Lustgarten J, Scrable H, Khosla S, Jensen MD, Kirkland JL. Fat tissue, aging, and cellular senescence. Aging Cell. 2010;9:667–684. doi: 10.1111/j.1474-9726.2010.00608.x. [DOI] [PMC free article] [PubMed] [Google Scholar]
  53. Tennessen JM, Barry WE, Cox J, Thummel CS. Methods for studying metabolism in Drosophila. Methods. 2014;68:105–115. doi: 10.1016/j.ymeth.2014.02.034. [DOI] [PMC free article] [PubMed] [Google Scholar]
  54. Tkach M, Théry C. Communication by extracellular vesicles: where we are and where we need to go. Cell. 2016;164:1226–1232. doi: 10.1016/j.cell.2016.01.043. [DOI] [PubMed] [Google Scholar]
  55. Verma P, Augustine GJ, Ammar MR, Tashiro A, Cohen SM. A neuroprotective role for microRNA miR-1000 mediated by limiting glutamate excitotoxicity. Nature Neuroscience. 2015;18:379–385. doi: 10.1038/nn.3935. [DOI] [PubMed] [Google Scholar]
  56. Villeneuve LM, Kato M, Reddy MA, Wang M, Lanting L, Natarajan R. Enhanced levels of microRNA-125b in vascular smooth muscle cells of diabetic db/db mice lead to increased inflammatory gene expression by targeting the histone methyltransferase Suv39h1. Diabetes. 2010;59:2904–2915. doi: 10.2337/db10-0208. [DOI] [PMC free article] [PubMed] [Google Scholar]
  57. Wang J, Ho L, Qin W, Rocher AB, Seror I, Humala N, Maniar K, Dolios G, Wang R, Hof PR, Pasinetti GM. Caloric restriction attenuates beta-amyloid neuropathology in a mouse model of alzheimer's disease. The FASEB Journal. 2005;19:1–18. doi: 10.1096/fj.04-3182fje. [DOI] [PubMed] [Google Scholar]
  58. Wu YC, Chen CH, Mercer A, Sokol NS. Let-7-complex microRNAs regulate the temporal identity of Drosophila mushroom body neurons via chinmo. Developmental Cell. 2012;23:202–209. doi: 10.1016/j.devcel.2012.05.013. [DOI] [PMC free article] [PubMed] [Google Scholar]
  59. Yang JS, Nam HJ, Seo M, Han SK, Choi Y, Nam HG, Lee SJ, Kim S. OASIS: online application for the survival analysis of lifespan assays performed in aging research. PLOS ONE. 2011;6:e23525. doi: 10.1371/journal.pone.0023525. [DOI] [PMC free article] [PubMed] [Google Scholar]
  60. Yoo CJ, Wolin SL. La proteins from Drosophila Melanogaster and Saccharomyces cerevisiae: a yeast homolog of the La autoantigen is dispensable for growth. Molecular and Cellular Biology. 1994;14:5412–5424. doi: 10.1128/MCB.14.8.5412. [DOI] [PMC free article] [PubMed] [Google Scholar]
  61. Zhang R, Wang X, Qu JH, Liu B, Zhang P, Zhang T, Fan PC, Wang XM, Xiao GY, Su Y, Xie Y, Liu Y, Pei JF, Zhang ZQ, Hao DL, Xu P, Chen HZ, Liu DP. Caloric restriction induces MicroRNAs to improve mitochondrial proteostasis. iScience. 2019;17:155–166. doi: 10.1016/j.isci.2019.06.028. [DOI] [PMC free article] [PubMed] [Google Scholar]
  62. Zhu S, Lin S, Kao CF, Awasaki T, Chiang AS, Lee T. Gradients of the Drosophila chinmo BTB-zinc finger protein govern neuronal temporal identity. Cell. 2006;127:409–422. doi: 10.1016/j.cell.2006.08.045. [DOI] [PubMed] [Google Scholar]

Decision letter

Editor: Dario Riccardo Valenzano1
Reviewed by: Adam J Dobson2

In the interests of transparency, eLife publishes the most substantive revision requests and the accompanying author responses.

Acceptance summary:

Pandey et al., propose that miR-125 and let-7 mediate the lifespan and metabolic response to dietary-restriction via the transcription factor Chinmo in fruit flies. They propose that the enhanced turnover of fatty acids is the critical metabolic adaptation for lifespan extension under DR. These results are novel and connect beneficial systemic effects to the role of a single transcription factor.

Decision letter after peer review:

[Editors’ note: the authors submitted for reconsideration following the decision after peer review. What follows is the decision letter after the first round of review.]

Thank you for submitting your work entitled "miR-125-chinmo pathway regulates dietary restriction dependent enhancement of lifespan in Drosophila" for consideration by eLife. Your article has been reviewed by 3 peer reviewers, and the evaluation has been overseen by a Reviewing Editor and a Senior Editor. The following individual involved in review of your submission has agreed to reveal their identity: Adam Dobson (Reviewer #2).

Our decision has been reached after consultation between the reviewers. Based on these discussions and the individual reviews below, we regret to inform you that your work will not be considered further for publication in eLife.

Your work investigates the role of regulatory miRNAs and their targets in mediating the effects of dietary restriction on lifespan, proposing a model where neuronal miR125 represses chinmo expression in both neurons and (somehow) peripheral tissues. Unfortunately, all reviewers raised several issues on the way the experiments were conducted, on the analyses and on the conclusions. It appears that the conclusions and the model are not entirely supported by the data presented. For instance, despite the claim in figure 5, there seems to be no clear causality in the action of chinmo in the fat bodies to regulate lifespan via lipid metabolism. Methodologically, this work would have benefited from more explaining and controls. For instance, the mutant/transgenic lines do not appear to have been back-crossed and there are missing controls (e.g. GAL4- and UAS-alone). The GeneSwitch drivers seem to have ubiquitous expression. Very importantly, Chinmo regulation by miR-125 is not demonstrated in this work, but it is rather assumed to occur based on cited work. Lifespan comparisons are not sufficiently analysed statistically (Cox proportional hazards should be computed). Some of the results seem to contradict the main model, rather than supporting it (see reviewer 2, point 4).

Together, there are too many issues that need to be addressed to make this

manuscript acceptable.

Reviewer #1:

The manuscript by Pandey et al., examines the role for microRNAs in the fruit fly's response to dietary restriction. This is a very interesting topic. The authors propose that miR-125 and let-7 mediate the lifespan and metabolic response to DR in the fruit fly. Based on further functional characterization, the authors believe that miR-125 acts though its known target, Chinmo, with effects on both fat metabolism and aging.

While the study is on a very interesting topic, I do not think it's performed to a sufficiently high standard to warrant publication in eLife. My key objections (noted below) concern the way the experiments were conducted, as well as their interpretation and presentation. I believe these are too extensive to be addressed by the authors in a timely manner.

1) The key experimental tool used is fly genetics. Unfortunately, based on the information available in the manuscript I do not have the confidence that the genetic analysis was conducted to a sufficiently good level, and this impacts most if not all of the results presented. It appears that none of the mutants/transgenes were backcrossed, and this is very important for studies of aging in flies. Because the genotypes used would have been derived from multiple strains and backgrounds, I am not persuaded that the effects observed are not due to variation in the background. This is specifically relevant for all experiments where flies of different genotypes are compared (not so much for GeneSwitch experiments). Additionally, the genotypes of the experimental flies are very poorly described in the figures/captions and text.

2) I believe there is a number of essential controls missing. Examples include: Figure 2A – here the DR response appears compared to a response in a complexly different experiment – a control should always be run in parallel. Additionally, GAL4-alone and the UAS-alone controls appear not presented (was a GAL4 used to drive the RNAi line in Figure 2 – it's not clear from Sup Table 7 – if not, how is it being driven?). These are essential. Similarly, driver-alone and UAS-alone controls (with/without RU486) should also be run at least once for each GeneSwitch experiment – it's now well established that RU486 alone can sometimes trigger changes in physiology causing artefacts. As these RU486-induced artifacts appear to be context dependent, the controls need to be run by the authors in their experimental system.

3) GeneSwitch drivers are described as having one tissue specificity but then shown to be expressed in other tissues. This is confusing. References for articles describing the drivers are missing for some of the drivers.

4) The regulation of Chinmo by miR-125 is inferred from previous experiments. I could not find any data showing that it occurs in the context of DR in the submitted manuscript.

5) Figure 3 – the ectopic expression of Chinmo is essentially making the flies very sick – how much the lack of DR response in such flies can be interpreted is questionable.

6) Figure 1G – the p value is noted as not significant but the value in Sup Table 1B is, in two experiments for let-7. For miR-125 it's significant 1 out of 2 times.

7) Is the AL regime used by the authors essentially a cholesterol deficient diet (see Q Wu et al., 2020 Aging cell 19 (3), e13120)? If so, how broadly relevant will it be to DR in other organisms?

8) The authors propose that Chinmo can diffuse from one tissue to another – as a transcription factor I think it's very unlikely to do this. I think such a claim should be substantiated with more evidence.

Reviewer #2:

This manuscript investigates how dietary restriction extends lifespan in Drosophila, and specifically the role of regulatory RNAs and the BTB transcription factor chinmo. The roles of specific tissues and lipid metabolism are also investigated.

There are some good data here and some interesting findings. However these findings are held back by dubious analyses, datasets which appear to contradict the conclusions, and some unjustified logical leaps.

1) The physiological relevance of chinmo is unclear. A leap to studying chinmo is made based on a claim (unsubstantiated by either reference to literature or data) that chinmo is a direct target of the let7C complex. The model is that chinmo repression is required for DR to extend lifespan, and loss of the miRNAs stops this repression. But to really know this, we need to see chinmo levels in WT and miRNA mutants, subjected to AL and DR. And if the miRNAs regulate chinmo at post-translational level, we need to see protein levels by Western blot and IF (using the antibody used in Figure 4?). It would also be nice to have this information specifically in the tissues studied. Currently we have only (A) mRNA levels of chinmo in whole DR flies (in which DR increases chinmo expression, contrary to the concluding model), and (B) IFs in figure 4 which don't appear to show any effect of DR on chinmo levels. A much more convincing case for studying chinmo needs to be made. The genetics in the lifespans might do this (subject to genetics, below), but they follow way later in the paper.

2) Statistical analysis requires considerable work. The model proposed requires evidence from relatively complex epistasis experiments. Some of these data are present, but it is insufficient to say that the magnitude of lifespan extension in one condition is less than another – is it significantly so? More rigorous analysis exploring interactions of experimental factors (e.g. Cox proportional hazards) is required.

3) Numerous conclusions are unsupported. To conclude the epistasis claimed, we'd need to see statistical interactions (i.e. without A, there is no effect of B), but a number of effects look additive (i.e. A affects this thing, and in parallel so does B). E.g. Figure 3F, it looks like chinmo affects mean TAG by a set amount against a baseline set by DR. To really conclude that chinmo was mediating DR, the effect of DR should be blocked (or strongly diminished) when chinmo is manipulated transgenically. We see this in Figure 5, but rarely elsewhere. I encourage the authors to apply proper statistical modelling, testing for interaction effects and specifying pairwise comparisons, for ALL experiments testing epistatic or gene:diet effects.

4) Some figures in fact show results which are contrary to the concluding model. E.g. in Figure 6J: if there is an effect of FATP-RNAi in both AL and DR, does it not argue that FATP is in fact irrelevant for the DR effect? Similarly, the hypothesis tested in 6K is that elevated expression of lipid metabolism genes should create a DR-like state, in which case we expect overexpression to increase AL lifespan but not DR lifespan. However, we see the opposite: FATP expression extends DR lifespan, but not AL lifespan. Altogether, this actually argues against the model that fat metabolism genes in the FB mediate DR's effects.

5) The manuscript would also be more penetrable without jumping so much between tissues, and a more clear explanation of where chinmo and the miRNAs are normally expressed. Probably the most convincing data are in Figure 5, where we have a manipulation of physiological expression patterns (i.e. chinmo RNAi) yielding the sort of interaction patterns we need to conclude epistasis. But then figure 6 jumps back to over-expressing chinmo in neurons. Flyatlas has the expression of chinmo high in neurons and negligible in fat body, and the miRNAs high in the nervous system. No convincing case is made for expressing a neuronal miRNA in the fat body (Figure 7). I am also very cautious in interpreting protein overexpression with a pan-neuronal driver such as ElavGS – brains are complex and this manipulation will force chinmo expression in a lot of neurons where it may never normally be expressed, causing potentially odd effects. This brings the physiological relevance of a number of manipulations into question.

6) The way non-autonomous effects of chinmo are shown is quite nice. But some statements in this section are quite surprising, especially that mRNA can diffuse between tissues. This statement would require quite a lot more data to substantiate. A more parsimonious explanation is a feed-forward loop in which chinmo expression in one tissue promotes its expression elsewhere through a secondary signal.

7) Insufficient genetic information. This is notoriously important when looking at epistasis in lifespan. Number of rounds of backcrossing must be given. The data are not useful if mutants were not freshly backcrossed before recombination. We also are not told whether mutants were heterozygous or homozygous. The Figure 1B qRT-PCR data also don't strongly support the claim that the Let7C mutant is actually a hypomorph – expression levels are not dramatically altered?

8) number of key points are made without reference to literature or data e.g. chinmo is a target of Let7C, Let7C miRNAs are normally expressed in the nervous system.

Reviewer #3:

Pandey and colleagues are studying how miRNAs and their targets regulate the extension of lifespan upon dietary restriction (reduced protein content in diet, termed DR). Previous work from the lab of one of the authors has shown that lifespan extension under DR can be prevented when triglyceride synthesis or breakdown is inhibited (Katewa, 2012, 2016). These observations have led to the current model in the field that the enhanced turnover of fatty acids is the critical metabolic adaptation for lifespan extension under DR. In the current study, the authors use established stocks containing deletions and rescue constructs of the let-7-C locus, which contains 3 miRNAs (miR100, miR125 and let-7) and examine lifespan and lipid droplets (fatty acids) in adult Drosophila. Ultimately, their data lead them to propose a model in which neuronal miR125 represses chinmo expression in both neurons and (somehow) peripheral tissues; the reduction of chinmo in peripheral tissue leads to increased expression of genes encoding fatty acid metabolism, and this leads to DR-induced lifespan extension. Unfortunately, the current manuscript is lacking critical data to support the model. Additionally, controls are missing and key Gal4 drivers are not lineage-traced, increasing the confusion about the cell autonomy of miR125 and chinmo. The text of the manuscript is lacking sufficient rationale for many experiments, and important introductory facts (let-C-7 locus biology, chinmo biology, DR model and biology and how DR compared to caloric restriction) are either relegated to the discussion or entirely lacking from the manuscript. The unclear and confusing autotomy of chinmo activity greatly reduce enthusiasm. This manuscript could be improved by a large number of new experiments and an editorial overhaul.

Dr. Chawla previously showed that adult flies lacking an upstream regulatory region in the let-7-C locus but containing all three miRNAs (called let-7-Chyp) had a significantly shorter lifespan (Chawla, 2016). In the current study, they find that the shorter lifespan of these flies cannot be extended by DR, in contrast to flies possessing the regulatory let-7-C sequences. This observation forms the foundation for the study. Flies lacking miR125 or let-7 similarly do not extend lifespan under DR. They authors decide to follow up on the miR125 observation. The Sokol lab has previously shown that both miR125 and let-7 degrade transcripts for chinmo, which encodes a putative transcriptional repressor that has only been observed in the nucleus of cells that express it. Indeed, miR125 null flies that are heterozygous for a null chinmo allele now display extended lifespan upon DR and have enlarged LDs. [The experiments using the let-7-C-Gal4 to deplete chinmo in Figure 2 are difficult to interpret because the Gal4 is not regulated by RU486 and is active through the life of the fly, leading to depletion of chinmo throughout development with consequences of defective neuronal patterning (Zhu, Cell 2006 and many other papers from Tzumin Lee and other groups)]. These data suggest that the maintenance of chinmo in miR125 null flies underlies the lack of life extension under DR. In Figure 3, they try to determine in which tissue ectopic expression of chinmo decreases lifespan under DR. They used the gene switch inducible system for these experiments, only to find that ectopic expression of chinmo under Da, 5966 or FB leads to early mortality. In fact, even with the Elav neuronal driver, lifespan is shorter than the AL, no-RU-468 control. I find it difficult to logically connect the relatively early death caused by Chinmo mis-expression with a suppression of lifespan extension under DR. The authors need to find another way to test their hypothesis. In Figure 3, they show that Elav>chinmo under RU-486 leads to a decrease in the size of lipid droplets, which they conclude connects neuronal chinmo to fat body metabolism in peripheral tissues. In Figure 4, they show the expression patterns of the GS Gal4 drivers, and because they see chinmo protein in tissues where the driver is supposedly not expressed, they conclude that chinmo RNA or protein is able to diffuse from neuronal cells to other tissues to induce metabolic changes. This is potentially an interesting model, but there are absolutely no data to support it. First, they need perform both real-time and lineage tracing of these drivers using G-trace. [G-trace should also be used for let-7-C-Gal4]. If these experiments support their hypothesis, then they would need to test how the movement of chinmo RNA or protein between tissues could occur – for example, by exosomes? In Figure 5, they deplete chinmo from fat body using FB GS driver. What is the hypothesis being tested here? It was not clear to me. If neuronal chinmo RNA or protein travels from neurons to fat body, then how would depletion of chinmo from fat body alter this movement? These needs to be explained in the text. Let us assume that the chinmo transcripts being depleted in Figure 5 are produced by fat body cells (and not neurons), what is the prediction of this on lifespan extension under DR, TAG levels and lipid droplet size? In my mind, the upregulation of miR125 upon DR leads to the downregulation of chinmo message and protein in neuronal cells. This effect is somehow transmitted to fat body cells, which alter lipid metabolism to promote lifespan extension. If chinmo levels in fat body were depleted, there should be no effect on DR-induced lifespan extension and no change in TAG levels and no reduction in LD size. Indeed, my predictions are borne out by the data. There is no further increase in lifespan extension under DR when chinmo is depleted from fat body (Figure 5B blue solid and dashed lines); there is no difference in TAG levels (Figure 5C, blue solid and hashed bars) and LD size is not reduced (Figure 5E, light and dark blue dots). Yet the authors write in the title to Figure 5 and in lines 280-290 something to the effect that reducing chinmo levels in the adult fat body increases lifespan and enhances lipid metabolism. Would the authors please explain in the text the predictions for this experiment and the results? Their interpretation and mine are not congruous. In Figure 6, they perform mass spec on adult females in which chinmo has been inducibly mis-expressed in neurons. They find 40 proteins differentially expressed between the induced and uninduced samples, 7 upregulated and 33 downregulated. Of the latter, 7 proteins are involved in fat metabolism and their mRNAs decrease 10 days after induction of chinmo. Do the authors have an earlier time point? If chinmo does directly repress these 7 genes, it presumably would do so in a shorter time frame, for example 1-2 days after induction. 10 days is a long time-frame for gene expression and may represent indirect regulation, and if the authors saw an effect after 2 days, this would be a more meaningful result. Do these genes have chinmo binding sites in regulatory regions? It would also be helpful to validate decreased expression of proteins using antibodies or enhancer traps to characterized genes, for example, FATP for which both antibodies and enhancer traps exist. They then test the functional role for FASN1 and FATP in DR-dependent lifespan extension. Once again, it would be helpful for the authors to explain in the text the predictions for this experiment. To my mind, if downregulation of chinmo in the fat body is important for DR-induced lifespan extension and if chinmo represses the fasn1 and fatp genes, then loss of chinmo should in increase FASN1 and FATP expression and this should aid in fatty acid turnover. Depletion of fasn1 and fatp should then decrease DR-induced lifespan extension, which is confirmed by the results (Figure 6I and J), and mis-expression of these factors should increase this extension, which again is supported by the results (Figure 6L). These are important results for the paper but are insufficiently explained in the text by the authors. In Figure 7, they express human miR125 in fat body and examine lifespan extension. Once again, the rationale for these experiments is totally unclear to me. The model introduced earlier in the paper is that neuronal (not fat body) miR125 extends lifespan under DR. Why did they perform the experiments in Figure 7? How do these results add to the paper? To me, they detract from the paper. The authors need to definitely establish in which cells miR125 is acting and in which cells chinmo is being regulated. Figure 8 is a model of the result, but it does not clarify any of the confusion about the autonomy of chinmo activity.

Figure 1B are missing the appropriate control, which is the "rescue" genotype. w1118 is not the right control for this experiment because it does not contain the let-7-C alleles and the attP-inserted transgene. This is important because it forms the foundation for the entire study.

Figure 2A,B are missing controls (δ miR125 alone and chinmo1/+ alone). Furthermore, the driver in Figure 2A is let-7-CGal4, which is not a GS gal4 and therefore is active through development. The correct experiment here would be elavGS. This should be remedied.

Figure 2C and D – the AD and DR TAG profiles should be displayed on the same graph. Why are they separated? Why are is the Y-axis scale so different (0-7 on the AD and 0-50 on the DR) between AL and DR? I can't determine what happens to TAG levels under DR in the various genotypes. This is a significant issue for me. This experiment needs to be performed again and plotted on the same graph.

Figure 2G-J – why is the chinmo protein not monitored here? Why is dilp6 being monitored? The authors do not discuss the rationale for examining dilp6 or foxo; they need to tell the reader why they are doing this experiment. In panel H, what do the third and fourth pair of bars represent? In other words, why are + head and -head being shown twice? In panel J, why is starvation (absence of protein) introduce here? What is the rationale for this experiment and why is it being shown?

Figure 3A: DaGS>UAS-Chinmo flies with RU-486 all day within ~12 days of adulthood, much earlier ectopic flies without drug treatment. These data indicate that there is toxicity/lethality associated with ectopic chinmo, which obviates any possible connection to lifespan extension.

Figure 4 – please supply monochrome (white on black) all of these. It is very difficult for the human brain to appreciate green on black.

The authors need to better explain the various let-7-C reagents that they use both in the legend to Fig, 1 and in the Materials and Method. In particular, the let-C-7GKI allele is not on Flybase and I had to look up three prior pages to figure this out. Please make the manuscript easier to read and to be appreciated by the reviewer.

eLife. 2021 Jun 8;10:e62621. doi: 10.7554/eLife.62621.sa2

Author response


[Editors’ note: The authors appealed the original decision. What follows is the authors’ response to the first round of review.]

Reviewer #1:

The manuscript by Pandey et al., examines the role for microRNAs in the fruit fly's response to dietary restriction. This is a very interesting topic. The authors propose that miR-125 and let-7 mediate the lifespan and metabolic response to DR in the fruit fly. Based on further functional characterization, the authors believe that miR-125 acts though its known target, Chinmo, with effects on both fat metabolism and aging.

While the study is on a very interesting topic, I do not think it's performed to a sufficiently high standard to warrant publication in eLife. My key objections (noted below) concern the way the experiments were conducted, as well as their interpretation and presentation. I believe these are too extensive to be addressed by the authors in a timely manner.

1) The key experimental tool used is fly genetics. Unfortunately, based on the information available in the manuscript I do not have the confidence that the genetic analysis was conducted to a sufficiently good level, and this impacts most if not all of the results presented. It appears that none of the mutants/transgenes were backcrossed, and this is very important for studies of aging in flies. Because the genotypes used would have been derived from multiple strains and backgrounds, I am not persuaded that the effects observed are not due to variation in the background. This is specifically relevant for all experiments where flies of different genotypes are compared (not so much for GeneSwitch experiments). Additionally, the genotypes of the experimental flies are very poorly described in the figures/captions and text.

We agree that controlled genetic background is essential for genetic research and our approach ensured such a controlled genetic background. Moreover, since the genetic approach was previously published by us (Chawla et al., 2016), we did not include the crossing scheme in this submission but noted the reference in the text. To make our approach as transparent as possible, we have included our entire genetic scheme in the revised version as Figure 1—figure supplement 1. As the scheme indicates, our approach relies on the comparison between strains with two different rescuing transgenes in a background as close to identical as possible. This procedure and the strategy should clarify that the strains we have analyzed have a common genetic background. The attached scheme also includes a description of the balancer strains used. The same isogenized balancer stock was used in multiple crosses, thereby ensuring that there was no genetic variability introduced as part of the strain construction.

The use of such rescuing transgenes is a "gold standard" in genetic research and all our rescuing transgenes were generated by injecting them into the same population of flies and once recovered, resulting strains were treated identically and in parallel. In addition, it is not clear whether the recommendation of backcrossing the transgenes/mutants will solve the issue: after backcrossing the strains, we would still need to follow the 8- generation scheme (F1 to F8) in Figure 1 figure supplement-1 to generate the final strains and spontaneous background mutations could be introduced and fixed in the population at any of these steps. As an example of a study with a similar genetic strategy as ours, please see Verma et al., Nature Neuroscience 2015. Additionally, the same scheme was used by us and published earlier (Chawla et al., 2016).

We have included the genotypes of the experimental flies in the revised figure legends and text. Additionally, the manuscript Supplementary File 1 has been retained in the revised version to enable readers to review a compiled list of all strains used in this manuscript.

2) I believe there is a number of essential controls missing. Examples include: Figure 2A – here the DR response appears compared to a response in a complexly different experiment – a control should always be run in parallel.

We acknowledge that genetically similar controls are essential for any functional analyses, and these were run in parallel with the experiment but were represented as Supplementary Figure 1A-B and Supplementary Tables 2A and 2B and referenced in the main text in the previously submitted version. This data is now included as panels in Figure 2C, 2E and Figure 2-source data 1-2 of the revised manuscript. The genotypes of the controls and the experimental strains are now included in the figure legends. The only difference between the genetic background of the control and experimental strains is the let-7-Complex rescuing transgenes that is let-7-Cwild type (Ctrl) or let-7-CΔmiR-125 (Exp).

Additionally, GAL4-alone and the UAS-alone controls appear not presented (was a GAL4 used to drive the RNAi line in Figure 2 – it's not clear from Sup Table 7 – if not, how is it being driven?). These are essential.

We thank Reviewer 1 for pointing out the missing controls and agree that GAL4-alone and UAS-alone controls are essential. The lifespan for GAL4-alone (let-7-C GAL4) is represented as Figure 1—figure supplement 2F and Figure 1—figure supplement 2-source data 1-2 of the revised manuscript. The survival analysis of UAS chinmoRNAi is represented as Figure 2—figure supplement 1A and Figure 2—figure supplement 1-source data 1-2.

The let-7-C GAL4 (let-7-CGKI) was used to drive expression of the UAS chinmoRNAi and this was noted in line 124 of the previously submitted manuscript. The following information regarding let-7-C GAL4 is included in the Materials and methods section of the revised manuscript (Lines 1173-1176). The let-7-CGKI mutation contains a 991-basepair deletion that removes the miR-100, let-7, and miR-125. Additionally, the let-7-CGKI mutation (let-7-C GAL4 Knock-In) contains the GAL4 coding sequence driven by let-7-C promoter (Sokol et al., 2008).

Similarly, driver-alone and UAS-alone controls (with/without RU486) should also be run at least once for each GeneSwitch experiment – it's now well established that RU486 alone can sometimes trigger changes in physiology causing artefacts. As these RU486-induced artifacts appear to be context dependent, the controls need to be run by the authors in their experimental system.

We agree with Reviewer 1 that RU-486 alone can sometimes trigger changes in physiology causing artifacts. The driver-alone and UAS-alone controls (with/without RU486) for UASchinmo (Figure 6—figure supplement 1B and Figure 6—figure supplement 1-source data 1), UAS chinmoRNAi (Figure 2—figure supplement 1A and Figure 2—figure supplement 1-source data 1-2), UAS Flag fatp (Figure 7—figure supplement 3C and Figure 7-source data-3), UAS fatpRNAi (Figure 7—figure supplement 3B and Figure 7-source data 2C-D), UAS fasn1RNAi (Figure 7 —figure supplement 3A and Figure 7-source data-1C-D), UAS Flag chinmo (Figure 6—figure supplement 1C and Figure 6—figure supplement 1source data 1C-D) and, UAS hsa pri miR-125 (Figure 8—figure supplement 1 and Figure 8—figure supplement 1-source data 1-2) have been included in the revised manuscript. We have cited the references for Gene switch driver strains (S1106) that have been previously tested and reported to have no survival effects in presence of RU-486 (Huang et al., 2014; Balukbasi et al., 2017). The effect of RU-486 on the lifespan of 3X ElavGS strain in AL and DR was tested in this study and the survival curve has been included in Supplementary Figure 6—figure supplement 1A and Figure 6—figure supplement 1-source data-1). The DaGS and 5966 GS have also been tested before but we have removed the data from the revised manuscript to retain the focus on the miR-125 regulatory axis in the brain and fat tissue.

3) GeneSwitch drivers are described as having one tissue specificity but then shown to be expressed in other tissues. This is confusing. References for articles describing the drivers are missing for some of the drivers.

We apologize for the confusion with regards to Chinmo non-autonomous expression. We have revised the text so that the non-autonomous expression is not attributed to nonspecific expression of the GeneSwitch drivers. For clarity, the references for articles describing the GeneSwitch GAL4 drivers are included in the main text of the revised manuscript. We have removed data pertaining to DaGS and 5966 GeneSwitch drivers to add clarity. The specificity of the two GeneSwitch drivers used in the revised manuscript (FBGS and 3X ElavGS) was validated by setting up crosses with UAS GFP and analyzing GFP expression in the brain and abdominal fat body of the progeny (Figure 6—figure supplement 2 A-H and 2A’-H’). As expected, 3X ElavGS>UAS GFP flies expressed GFP specifically in the adult neurons and FBGS> UAS GFP flies expressed GFP specifically in the fat body in an inducible manner. Consistent with the GFP expression, Chinmo was specifically expressed in the fat body in FBGS> UAS chinmo flies upon induction with RU486. However, Chinmo was detected in the fat body in addition to being expressed in neurons in 3X ElaGS >UAS chinmo flies (Figure 6—figure supplement 2I-P and 2I’-P’). We attribute this to a non-autonomous expression of Chinmo and have presented some data in support of our hypothesis.

4) The regulation of Chinmo by miR-125 is inferred from previous experiments. I could not find any data showing that it occurs in the context of DR in the submitted manuscript.

The regulation of chinmo by miR-125 in flies that were exposed to AL and DR diet for 5 days (adult brain and fat body) is now represented in Figure 2B of the current manuscript. In addition, a schematic showing differential regulation of chinmo by let-7 and miR-125 in our previously published study is represented as figure 2A (Chawla et al., 2016).

5) Figure 3 – the ectopic expression of Chinmo is essentially making the flies very sick – how much the lack of DR response in such flies can be interpreted is questionable.

We agree with Reviewer 1 that overexpression of chinmo makes the flies sick. This is expected for proteins that play dosage-sensitive essential roles like Chinmo. We believe that it was important to analyze the consequences of ectopic expression of chinmo to assess whether its derepression in adult brain mimicked miR-125 mutant phenotypes and to confirm that chinmo was the functionally relevant target that was mediating the DR phenotype. Moreover, it was important to identify the tissues where this silencing of chinmo was critical for DR-mediated lifespan extension and hence an inducible GeneSwitch Gal4 system seems most appropriate. The other approach that we utilized was to examine whether reducing chinmo dosage by chinmoRNAi or genetic mutation (chinmo1) in miR-125 mutants was able to rescue miR-125 mutant DR phenotype (presented in Figure 2). We have edited figure 3 (current Figure 6 of the revised manuscript) and removed the analysis done with DaGS and 5966 GeneSwitch drivers for clarity. The figure now includes an analysis of ectopic expression of chinmo and flag chinmo in adult neurons (3X ElavGS) and in adult fat tissue (S1106). Comparison of survival curves of flies that overexpress Chinmo or flag Chinmo in adult neurons (Chinmo: AL+ vs DR+ p=0.0066 and Χ2= 7.37; Flag Chinmo p=0.0068 and Χ2=7.34) with flies that overexpress Chinmo or Flag Chinmo in adult fat tissue (Chinmo: AL+ vs DR+ p=0.0283 and Χ2= 4.81; Flag Chinmo p=0.9472 and Χ2=0.0043) indicates that overexpression of this protein in the adult fat tissue dampens the DR dependent increase in lifespan more significantly (Figure 6B-E). The p-values and Χ2 values indicate that there is a significant difference between survival curves in AL and DR conditions. These experiments confirm that deregulation of chinmo is the cause of miR-125 mutant DR phenotypes. Analysis of tissue-specific inducible expression of Chinmo was also important to uncover the non-autonomous effect of chinmo in fat tissue in 3X ElavGS >UAS chinmo flies.

6) Figure 1G – the p value is noted as not significant but the value in Sup Table 1B is, in two experiments for let-7. For miR-125 it's significant 1 out of 2 times.

We thank the reviewer for pointing out the typographical error and apologize for missing the error in Figure 1. We have corrected the p-values and have noted the Χ2 values in all the figure panels with survival analysis. We have corrected all typographical errors and the source data tables have information regarding the maximum and median lifespan as well as the number of flies. Analysis was reperformed with OASIS and GraphPad Prism and corrected.

7) Is the AL regime used by the authors essentially a cholesterol deficient diet (see Q Wu et al., 2020 Aging cell 19 (3), e13120)? If so, how broadly relevant will it be to DR in other organisms?

The AL regimen that we used in this study is a cholesterol-deficient diet and the AL and DR diets essentially vary in the yeast extract (protein source). Protein restriction and more specifically amino acid restriction have been reported to significantly enhance lifespan in yeast and flies (Mirisola et al., 2014; Wei et al., 2008; Mair et al., 2005; Minor et al., 2010). In rodents, restriction of protein intake or of specific amino acids is associated with improved healthspan and increased lifespan (Mirzaei et al., 2014; Fontana et al., 2010; Brandhorst and Longo., 2019; Lopez-Torres and Barja., 2008). In humans, ongoing and future nutritional studies are required for the definition of what constitutes a healthy diet with pro-longevity benefits, however, short-term clinical trials and epidemiological studies indicate that protein restriction leads to reduced activity of the GH/IGF-1 regulatory axis, thus leading to a delay in age-related pathologies (Levine et al., 2014). From all these studies it is reasonable to conclude that healthspan effects observed with calorie restriction can at least partially be explained by the restriction of protein or more specifically amino acids. However, we thank Reviewer 1 for referring Wu et al., 2020, and agree that including cholesterol in the dietary regimen might yield additional conserved miRNA-mediated DR pathways that we would like to investigate in future studies.

8) The authors propose that Chinmo can diffuse from one tissue to another – as a transcription factor I think it's very unlikely to do this. I think such a claim should be substantiated with more evidence.

We agree with Reviewer 1 that more evidence is required to demonstrate that Chinmo is not predominantly functioning as a transcription factor in the nucleus. Cytoplasmic translocation of Chinmo would be a prerequisite for any model that claims a nonautonomous role for this protein. We agree with the need for a better explanation in support of experiments performed. Hence, we would like to highlight some new data that we have included in the revised manuscript as new figures (Figure 4 and Figure 5) and other panels that strengthen the hypothesis for non-autonomous effects of Chinmo and other non-nuclear roles for this protein.

i. Chinmo redistributes to the cytoplasm upon nutrient deprivation.

To ascertain whether Chinmo translocates to the cytoplasm upon nutritional deprivation we made use of a Drosophila cell line and tagged versions of Chinmo (GFP and Flag). Kc167 is an embryonic cell line that expresses very low levels of Chinmo (modEncode data). GFP-tagged Chinmo translocates to the cytoplasm in starved Kc167 cells that are transfected with Tubulin Gal4 and UAS Chinmo::GFP (Figure 4A). Consistent with the GFP-tagged Chinmo data, starved Kc167 cells expressing Flag-tagged Chinmo also show cytoplasmic redistribution of Chinmo (Figure 5C-H). Moreover, this cytoplasmic redistribution of Chinmo upon starvation was reversible, and shifting the cells back to normal medium (16h) resulted in reappearance of nuclear-localized Chinmo and disappearance of cytoplasmic protein (Figure 5I-N). Since, UAS-chinmo constructs were used in these experiments, we could conclude that nutrient-dependent post-translational modification of the protein was the mechanism involved in redistribution of the protein to the cytoplasm upon nutrient deprivation.

ii. Deacetylation of Chinmo by dSir2 is required for its nuclear export upon nutrient deprivation.

Increasing the cellular levels of dSir2 led to redistribution of the exogenous GFP-tagged Chinmo to the cytoplasm in fed conditions (Figure 4B). Thus, indicating that nutrient dependent post-translational modification of Chinmo by dSir2 is required for its export from the nucleus. Since, dSir2 is a nutrient-dependent deacetylase, we performed mutational analysis of Chinmo and identified three Lysine (K47, K55, and K348) residues that were critical for relocalization of Chinmo by dSir2 upon nutrient deprivation. This analysis is represented in Figure 4 and Figure 4—figure supplement 1 of the revised manuscript. These data confirm that dSir2 mediated deacetylation of Chinmo is required for its nuclear export.

iii. Chinmo fractionates with exosomes upon starvation.

Since exosomes are well-known players in intercellular communication and have been shown to carry protein, mRNAs and miRNAs, we examined whether Chinmo is loaded onto these extracellular vesicles in response to nutrient deprivation. To test whether Chinmo protein is loaded onto exosomes, we purified exosomes from Kc167 cells expressing flag-tagged Chinmo by size exclusion chromatography. Kc167 cells expressing Flag-Chinmo were starved for 8h (2mg/ml glucose in PBS) and exosomes were purified from cell culture medium and starvation medium. Western blot analysis was performed with the cell lysate, concentrated medium, and purified exosomes from Kc167 cells expressing Flag Chinmo for detection of exosomal proteins and Flag-Chinmo. Flag-Chinmo was detected in medium and exosome fraction of starved Kc167 cells but not in the concentrated medium and exosomal fraction of cells that were in normal medium (Figure 5O). Together these data provide evidence that Chinmo translocates to the cytoplasm and is loaded onto exosomes upon nutrient deprivation, and this might be a plausible mechanism for its non-autonomous expression (Figure 5P). A similar nutrient dependent translocation has been previously shown for the predominantly nuclear localized protein LC3/Atg8a (Huang et al., 2014).

iv. DR induces chinmo mRNA levels in the hemolymph.

Hemolymph is responsible for circulating nutrients and exosomes. Chinmo mRNA levels increased by 2.6 ± 0.19-fold in the hemolymph of w1118 adult flies that were fed a DR diet for 10 days (Figure 3E). A DR-dependent increase in the levels of circulating chinmo mRNA hints at a possible mechanism by which chinmo mRNA could exert nonautonomous effects.

v. Nutrient deprivation leads to an increase in the non-nuclear Chinmo in the fat tissue of w1118.

Quantitation of Chinmo protein levels in fat tissue of adult w1118 flies exposed to AL and DR flies indicates that Chinmo protein levels increased in the non-nuclear region of the cells in flies that were fed a DR diet (Figure 3A-C and Figure 3—figure supplement1A-E). These data provide in vivo evidence for nutrient-dependent relocalization of Chinmo.

vi. Neuronal Chinmo upregulation induces Chinmo expression non-autonomously in the fat tissue.

Quantitative RT-PCR analysis of chinmo RNA in the head and dissected abdominal fat tissue of 3X ElavGS> UAS chinmo flies and FBGS> UAS chinmo flies that were exposed to RU-486 for 10 days was performed. In the brain tissue of 3X ElavGS> UAS chinmo flies, chinmo mRNA levels increased by 4.25 ± 0.8-fold under AL conditions and by 11 ± 1.96-fold in DR conditions upon addition of the ligand (Figure 6J). In addition, chinmo mRNA levels also increased by 8.5 ± 1.79-fold in AL conditions and by 7.6 ± 1.36-fold in DR conditions in the dissected fat tissue upon addition of the ligand (Figure 6K). These data suggested that chinmo mRNA was being induced non-autonomously to a similar magnitude in the abdominal fat tissue in 3X ElavGS> UAS chinmo flies. To confirm whether the increase in mRNA also resulted in a non-autonomous increase in Chinmo protein levels, we performed immunostaining of dissected brain and abdominal fat tissue of 3X ElavGS> UAS chinmo and FBGS>UAS chinmo flies (Figure 6—figure supplement 2). Consistent with the chinmo mRNA analysis, 3X Elav GS > UAS chinmo flies that were fed RU-486 containing food displayed expression of Chinmo in the adult brain and adult fat body. However, FB GS > UAS chinmo flies that were fed RU-486 containing food displayed expression of Chinmo specifically in the fat body and no signal was detected in dissected brains (Figure 6—figure supplement 2I’-P’). These data were recapitulated in 3X ElavGS > UAS Flag chinmo flies by quantitating the Chinmo protein expression (Figure 6—figure supplement 3A-E). Together these data highlight the existence of mechanisms for the non-autonomous effects of Chinmo. We hypothesize that Chinmo protein and/or mRNA is either capable of loading onto exosomes to facilitate communication with other peripheral tissues or a feed-forward mechanism exists by which upregulation of chinmo in the adult neurons promotes its expression in the fat tissue via an unidentified signal.

Reviewer #2:

This manuscript investigates how dietary restriction extends lifespan in Drosophila, and specifically the role of regulatory RNAs and the BTB transcription factor chinmo. The roles of specific tissues and lipid metabolism are also investigated.

There are some good data here and some interesting findings. However these findings are held back by dubious analyses, datasets which appear to contradict the conclusions, and some unjustified logical leaps.

1) The physiological relevance of chinmo is unclear. A leap to studying chinmo is made based on a claim (unsubstantiated by either reference to literature or data) that chinmo is a direct target of the let7C complex. The model is that chinmo repression is required for DR to extend lifespan, and loss of the miRNAs stops this repression. But to really know this, we need to see chinmo levels in WT and miRNA mutants, subjected to AL and DR. And if the miRNAs regulate chinmo at post-translational level, we need to see protein levels by Western blot and IF (using the antibody used in Figure 4?). It would also be nice to have this information specifically in the tissues studied. Currently we have only (A) mRNA levels of chinmo in whole DR flies (in which DR increases chinmo expression, contrary to the concluding model), and (B) IFs in figure 4 which don't appear to show any effect of DR on chinmo levels. A much more convincing case for studying chinmo needs to be made. The genetics in the lifespans might do this (subject to genetics, below), but they follow way later in the paper.

We are not in complete agreement with the reviewer regarding the unsubstantiated claims and had referenced our previously published study where we showed that chinmo is differentially regulated by miR-125 and let-7 along with three other references in Lines 126-127 of the previously submitted manuscript (Chawla et al., 2016; Wu, Chawla, and Sokol, 2020; Wu, Chen, Mercer, and Sokol, 2012; Zhu et al., 2006). To further increase clarity regarding the targeting of chinmo by miR-125, we have included a panel (Figure 2A) representing a schematic of the previously published study (Chawla et al., 2016). In addition, we show the immunostaining of Chinmo in the rescue and miR-125 mutant dissected brain and fat body under AL and DR conditions (Figure 2B). The antibody used does not recognize denatured Chinmo protein and hence we and other labs that have used this antibody have not had success with this antibody in detecting Chinmo by western blot analysis.

2) Statistical analysis requires considerable work. The model proposed requires evidence from relatively complex epistasis experiments. Some of these data are present, but it is insufficient to say that the magnitude of lifespan extension in one condition is less than another – is it significantly so? More rigorous analysis exploring interactions of experimental factors (e.g. Cox proportional hazards) is required.

The statistical analysis for all the lifespan data has been repeated by performing Log Rank analysis using OASIS and GraphPad Prism. In addition to the p-values, we have included the Χ2 values to aid in the direct comparisons between different conditions. Both p values as well Χ2 values are represented in the Figure panels and Figure supplement tables for all the lifespan curves in the revised manuscript. Cox proportional analysis has been performed for experiments where diet and ligand interactions were tested and the p values are noted in the Figure table supplements.

3) Numerous conclusions are unsupported. To conclude the epistasis claimed, we'd need to see statistical interactions (i.e. without A, there is no effect of B), but a number of effects look additive (i.e. A affects this thing, and in parallel so does B). E.g. Figure 3F, it looks like chinmo affects mean TAG by a set amount against a baseline set by DR. To really conclude that chinmo was mediating DR, the effect of DR should be blocked (or strongly diminished) when chinmo is manipulated transgenically. We see this in Figure 5, but rarely elsewhere. I encourage the authors to apply proper statistical modelling, testing for interaction effects and specifying pairwise comparisons, for ALL experiments testing epistatic or gene:diet effects.

We agree with the reviewer that the effects of overexpression of chinmo can be seen in both AL and DR. However, this is not unexpected and may be due to other DR-mediated effector mechanisms operating in parallel. The complex metabolic reprogramming that occurs because of Dietary restriction is mediated by several effectors including mTOR, Sirtuins, AMPK, FOXO, and circadian regulators. Our study adds non-coding RNAs to the list of effectors of the DR pathway. Hence, it is not surprising that due to other operating mechanisms, DR is not completely blocked. However, our TAG analysis indicates a greater reduction in TAG levels upon DR as compared to that in AL, upon overexpression of chinmo and flag chinmo (Figure 6F-G)(compare p-values between AL- vs DR- with AL+ vs DR+). As pointed by Reviewer 2, Figure 5 (Figure 3 in the revised manuscript) is the only experiment where DR response is blocked—in this experiment chinmo is knocked down in the fat body. Consistent with RNAi analysis, we would predict a stronger reduction in TAG levels in FBGS>UAS chinmo. As predicted a stronger effect on survival is seen in FBGS>UASchinmo flies as compared to the ElavGS>UAS chinmo flies (Figure 6B-E). TAG analysis of FBGS>UAS chinmo was not done in AL and DR diets but on normal food, a much stronger reduction in TAG levels was observed as compared to 3XElavGS> UASchinmo flies (Figure 6—figure supplement 1E).

Pairwise comparisons have been specified in each of the graphs and the p-values are depicted in the figure panels for all graphs.

4) Some figures in fact show results which are contrary to the concluding model. E.g. in Figure 6J: if there is an effect of FATP-RNAi in both AL and DR, does it not argue that FATP is in fact irrelevant for the DR effect? Similarly, the hypothesis tested in 6K is that elevated expression of lipid metabolism genes should create a DR-like state, in which case we expect overexpression to increase AL lifespan but not DR lifespan. However, we see the opposite: FATP expression extends DR lifespan, but not AL lifespan. Altogether, this actually argues against the model that fat metabolism genes in the FB mediate DR's effects.

We agree that the concluding model in the previous submission did not accurately reflect the results. We have edited the proposed model (Figure 9) and have provided an explanation in the Results section in the revised manuscript. Based on the proposed model, miR-125 dependent regulation of chinmo in the adult brain, as well as DR-mediated post-translational regulation of Chinmo in the fat tissue are required for extension of lifespan upon DR. The proposed model summarizes the mechanism by which chinmo regulates lifespan extension by dietary restriction. miR-125 targets chinmo mRNA in the brain under AL and DR conditions. In the adult fat tissue, Chinmo transcriptionally represses genes involved in fat metabolism. Dietary restriction mediated cytoplasmic relocalization of Chinmo in the fat tissue relieves transcriptional repression of genes involved in fat metabolism, thus increasing lifespan. Thus, regulation of chinmo at the transcriptional (nutrition-dependent), post-transcriptional (miR-125-dependent) and post-translational (dSir2-dependent) ensures DR-mediated extension of lifespan.

We do not agree with Reviewer 2 regarding the conclusions drawn from the results in Figure 6J and Figure 6K of the previous submission (currently Figure 7J and Figure 7K). The proteomic analysis of 3X ElavGS > UAS chinmo flies identified 8 genes and it is likely that modulation of more than one gene would be required to alter fat metabolism. We predicted that if increased expression of one of these genes was sufficient to cause increased lipid turnover and consequentially DR-mediated lifespan extension, then knockdown of this gene would result in a reduction in lifespan upon DR. Knockdown of fatp resulted in a 14.8% decrease in median lifespan upon DR and no change under AL conditions (Figure 7J and Figure 7-source data 2). Since knockdown of fatp resulted in a decrease in the lifespan of flies that were fed a DR diet, we tested whether increasing the levels of fatp in the adult fat tissue led to an increase in the lifespan of flies under AL conditions. Western blot analysis of whole fly lysates prepared from FBGS > UAS Flag fatp flies that were fed an AL or DR diet in the presence and absence of RU-486 for 10 days revealed that Flag Fatp was expressed in an inducible manner, however, much lower levels of the flag-tagged protein was detected under AL conditions as compared to that in DR conditions (Figure 7—figure supplement 3D). Overexpressing UAS-Flag-FATP specifically in the adult fat tissue increased median life span by 14.2% under AL conditions and by 25% under DR conditions (Figure 7K). The smaller increase in median lifespan in AL conditions is likely due to the lower induction of the protein, nevertheless, an increase in lifespan in both diets indicates that Fatp functions as a pro-longevity factor and that DR dependent increase in lifespan occurs due to an increase in the expression of two or more genes that are regulated by Chinmo. We believe that these data do not argue against the proposed model but indicate that a combination of two more genes likely function together to mediate the effects and a combination of genes would need to be tested to attain the predicted increase in longevity.

5) The manuscript would also be more penetrable without jumping so much between tissues, and a more clear explanation of where chinmo and the miRNAs are normally expressed. Probably the most convincing data are in Figure 5, where we have a manipulation of physiological expression patterns (i.e. chinmo RNAi) yielding the sort of interaction patterns we need to conclude epistasis. But then figure 6 jumps back to over-expressing chinmo in neurons. Flyatlas has the expression of chinmo high in neurons and negligible in fat body, and the miRNAs high in the nervous system. No convincing case is made for expressing a neuronal miRNA in the fat body (Figure 7). I am also very cautious in interpreting protein overexpression with a pan-neuronal driver such as ElavGS – brains are complex and this manipulation will force chinmo expression in a lot of neurons where it may never normally be expressed, causing potentially odd effects. This brings the physiological relevance of a number of manipulations into question.

We thank the reviewer for the suggestion to restrict the analysis to the relevant tissues and to improve clarity and retain focus, we have removed the lifespan data and expression analysis of DaGS> UAS chinmo and 5966> UAS chinmo flies. We have examined the expression of miR-125 and chinmo in the brain and fat tissue under AL and DR conditions and our data indicated that DR induces both miR-125 and chinmo in the fat tissue (Figure 3—figure supplement 1G and Figure 8B, compare -AL and -DR bars). However, the lower expression levels of miR-125 in the fat body as well as higher induction of chinmo mRNA limit miR-125-mediated downregulation of Chinmo in this tissue. We have also examined and quantitated tissue-specific and sub-cellular localization of Chinmo protein in the w1118 adult fat body and brain (Figure 3A-C and Figure 3—figure supplement 1A-E, H). We thank Reviewer 2 for appreciating the analysis done with FBGS>UAS chinmoRNAi flies and would like to highlight other experiments that also depict convincing data. In figure 1 we show that a let-7-Chyp strain has a dampened DR-mediated lifespan extension and go onto identifying let-7 and miR-125 to be responsible for the phenotype. In figure 2, we show that reducing the dosage of chinmo completely rescues the DR phenotype of miR-125 mutants. We also believe that examining the effect of overexpression of chinmo was important to pinpoint the tissue where chinmo functions to cause DR-mediated lifespan extension.

We believe that it was important to analyze the consequences of ectopic expression of chinmo to assess whether its upregulation in the adult brain mimicked miR-125 mutant phenotypes. This experiment was complementary to the experiments where we show that knockdown of chinmo in the fat body promotes a DR-like state under AL conditions (current Figure 3F-J). Moreover, since a given miRNA can target several mRNAs, this experiment was important for confirming that chinmo was the functionally relevant target that was mediating the DR phenotype. It was important to identify the tissues where this silencing of chinmo was critical for DR-mediated lifespan extension and hence an inducible GeneSwitch Gal4 system seems most appropriate. The FlyAtlas reports expression of genes under normal dietary conditions and hence, we don’t think any conclusions can be drawn regarding expression of genes under AL and DR diets which are significantly different from the normal food used for rearing flies in those experiments. We have examined expression of miR-125 and chinmo in the brain and fat tissue under AL and DR conditions and our data indicated that DR induces both miR-125 and chinmo in the fat tissue (Figure 3—figure supplement 1G and Figure 8B, compare -AL and -DR bars). However, the lower expression levels of miR-125 in the fat body as well as higher induction of chinmo mRNA limit miR-125-mediated downregulation of Chinmo in this tissue. By expressing human miR-125 in the adult fat body, we addressed four questions: (i) Is the role of miR-125 in fat tissue conserved i.e., can human primary miR-125 substitute for Drosophila miR-125; (ii) Can miR-125 function as a DR-mimetic i.e., can modulating its level provide benefits of DR, irrespective of diet (i.e., in both AL and DR). (iii) Can increasing levels of the miRNA silence chinmo more efficiently and provide additional benefits. (iv) Can increasing the levels of a miRNA in a tissue where it is expressed at low levels be used as a strategy to redirect the role of its downstream targets. Consistent with our expression analysis of miR-125, a previous study in the mouse model identified miR-125b as one of the miRNAs that increase in the subcutaneous white fat tissue upon caloric restriction (Mori et al., 2012). However, the beneficial effects of increasing miR-125b in the fat tissue were not examined in the mouse model. Hence, we tested whether artificially increasing the levels of miR-125 specifically in the fat tissue would lead to silencing of chinmo and consequentially lead to an increase in lifespan. Our results revealed that overexpression of miR-125 in fat tissue does increase lifespan of flies that are fed an AL diet but more so in DR. Since, only one dose/condition of induction was utilized, further optimization of induction duration or RU486 would likely lead to a greater enhancement in lifespan upon AL. Nevertheless, these initial results are promising because the data indicates that the modulation of this miRNA in the fat tissue is beneficial at an organismal level. In addition, this analysis also shows that the functional role of miR-125 as a pro-longevity factor is conserved and that human pri miR-125 can extend lifespan. In the revised manuscript, we have edited the text to clarify that both miR-125-dependent and nutrition-dependent post-translational control of Chinmo mediate the DR-mediated increase in lifespan.

We believe that it was important to analyze the consequences of ectopic expression of chinmo to assess whether its upregulation in the adult brain mimicked miR-125 mutant phenotypes. This experiment was complementary to the experiments where we show that knockdown of chinmo in the fat body promotes a DR-like state under AL conditions (current Figure 3F-J). Moreover, since a miRNA can target several mRNAs, this experiment was important for confirming that chinmo was the functionally relevant target that was mediating the DR phenotype. It was important to identify the tissues where this silencing of chinmo was critical for DR-mediated lifespan extension and hence an inducible GeneSwitch Gal4 system seems most appropriate. The other approach that we utilized was to examine whether reducing chinmo dosage by chinmoRNAi or genetic mutation (chinmo1) in miR-125 mutants was able to rescue miR-125 mutant DR phenotype (presented in Figure 2). Given the broad pattern of Chinmo derepression in miR-125 mutants, we chose the ElavGS to drive the expression of chinmo (Figure 2B) (Chawla et al., 2016).

6) The way non-autonomous effects of chinmo are shown is quite nice. But some statements in this section are quite surprising, especially that mRNA can diffuse between tissues. This statement would require quite a lot more data to substantiate. A more parsimonious explanation is a feed-forward loop in which chinmo expression in one tissue promotes its expression elsewhere through a secondary signal.

We agree with Reviewer 2, for the need for more experiments and explanations in support of the non-autonomous effects of Chinmo. This statement has been substantiated with the addition of new data (Figure 4, Figure 5, and Figure 3A-C). For a more detailed explanation, we would like to request Reviewer 2 to refer to our response to Reviewer 1 comment 8). Some of the experiments that have been performed and included in the revised manuscript are listed below:

i. Chinmo redistributes to the cytoplasm upon nutrient deprivation (Figure 4A and Figure 5C-N)

ii. Deacetylation of Chinmo by dSir2 is required for its nuclear export upon nutrient deprivation (Figure 4 and Figure 4—figure supplement 1).

iii. Chinmo fractionates with exosomes upon starvation (Figure 5).

iv. DR induces chinmo mRNA levels in the hemolymph (Figure 3E).

v. Nutrient deprivation leads to an increase in non-nuclear Chinmo in the fat tissue of w1118 (Figure 3A-C, and Figure 3—figure supplement 1A-E).

vi. Neuronal Chinmo upregulation induces Chinmo expression non-autonomously in the fat tissue (Figure 6J-K, Figure 6—figure supplement 2, Figure 6—figure supplement 3A-E).

We thank the reviewer for suggesting a more parsimonious explanation for the nonautonomous role of Chinmo and have included the suggestion as a plausible mechanism to explain our data in addition to the experiments performed in the revised manuscript (Lines 834-836).

7) Insufficient genetic information. This is notoriously important when looking at epistasis in lifespan. Number of rounds of backcrossing must be given. The data are not useful if mutants were not freshly backcrossed before recombination. We also are not told whether mutants were heterozygous or homozygous. The Figure 1B qRT-PCR data also don't strongly support the claim that the Let7C mutant is actually a hypomorph – expression levels are not dramatically altered?

The genetic scheme for generation of strains used in Figure 1 and 2 is included as Figure 1—figure supplement 1 of the revised manuscript. The same scheme was previously used in our previously published study (Chawla et al., 2016). Our approach relies on the comparison between strains with two different rescuing transgenes in a background as close to identical as possible. This procedure and the strategy should clarify that the strains we have analyzed have a common genetic background. It is not clear whether the recommendation of backcrossing the transgenes/mutants will solve the issue: after backcrossing the strains, we would still need to follow the 8- generation scheme (F1 to F8) in Figure 1 figure supplement-1 to generate the final strains and spontaneous background mutations could be introduced and fixed in the population at any of these steps. The rescue and the mutant lines were generated by expressing a single copy of the wild type, ΔmiR-100, let-7 or ΔmiR-125 transgene in a transheterozygous let-7-Cnull mutant background (let-7-CKO2/let-7-CGKI). The let-7-C rescuing (wild type) transgene encodes a 17983 base-pair genomic fragment containing the let-7-C locus. The ΔmiR100, Δlet-7 and ΔmiR-125 are derivatives of the let-7-C transgenes that lack the mature miR-100, let-7, and miR-125 sequences, respectively (Lines 174-179). For a more detailed explanation of the genetic scheme, we would like to request the reviewer to refer to our response to Reviewer 1 comment 1.

The lifespan and RT-PCR analysis for the let-7-Chyp and let-7-Chyp/Rescue line has been repeated with another set of strains that express a single copy of the let-7-Chyp. These edits have been incorporated to ensure that a genetically identical control is used for the analysis of the let-7-Chyp in response to comment 11 by Reviewer 3 and the main text of the revised manuscript regarding the new RT-PCR data and lifespan analysis. Since the tested strain encodes a single copy of the let-7-Chyp transgene (as opposed to two copies that was presented earlier), a stronger decrease is seen in the hypomorph as opposed to the control even in younger flies (Figure 1E-G). As expected, the expression is dramatically reduced with age (Figure 1—figure supplement 2B-D).

8) number of key points are made without reference to literature or data e.g. chinmo is a target of Let7C, Let7C miRNAs are normally expressed in the nervous system.

We have included the references regarding the expression of let-7-C miRNAs (Chawla and Sokol., 2012). References pertaining to the targeting of chinmo by let-7-C miRNAs have been included in the main text (Wu et al., Chawla et al., 2016). Additionally, we have included a panel representing a schematic (Figure 2A) and immunostaining (Figure 2B) of Chinmo in the rescue line and miR-125 mutant in AL and DR conditions (Figure 2A-B)(Chawla et al., 2016).

Reviewer #3:

Pandey and colleagues are studying how miRNAs and their targets regulate the extension of lifespan upon dietary restriction (reduced protein content in diet, termed DR). Previous work from the lab of one of the authors has shown that lifespan extension under DR can be prevented when triglyceride synthesis or breakdown is inhibited (Katewa, 2012, 2016). These observations have led to the current model in the field that the enhanced turnover of fatty acids is the critical metabolic adaptation for lifespan extension under DR. In the current study, the authors use established stocks containing deletions and rescue constructs of the let-7-C locus, which contains 3 miRNAs (miR100, miR125 and let-7) and examine lifespan and lipid droplets (fatty acids) in adult Drosophila. Ultimately, their data lead them to propose a model in which neuronal miR125 represses chinmo expression in both neurons and (somehow) peripheral tissues; the reduction of chinmo in peripheral tissue leads to increased expression of genes encoding fatty acid metabolism, and this leads to DR-induced lifespan extension. Unfortunately, the current manuscript is lacking critical data to support the model. Additionally, controls are missing and key Gal4 drivers are not lineage-traced, increasing the confusion about the cell autonomy of miR125 and chinmo. The text of the manuscript is lacking sufficient rationale for many experiments, and important introductory facts (let-C-7 locus biology, chinmo biology, DR model and biology and how DR compared to caloric restriction) are either relegated to the discussion or entirely lacking from the manuscript. The unclear and confusing autotomy of chinmo activity greatly reduce enthusiasm. This manuscript could be improved by a large number of new experiments and an editorial overhaul.

1) Dr. Chawla previously showed that adult flies lacking an upstream regulatory region in the let-7-C locus but containing all three miRNAs (called let-7-Chyp) had a significantly shorter lifespan (Chawla, 2016). In the current study, they find that the shorter lifespan of these flies cannot be extended by DR, in contrast to flies possessing the regulatory let-7-C sequences. This observation forms the foundation for the study. Flies lacking miR125 or let-7 similarly do not extend lifespan under DR. They authors decide to follow up on the miR125 observation. The Sokol lab has previously shown that both miR125 and let-7 degrade transcripts for chinmo, which encodes a putative transcriptional repressor that has only been observed in the nucleus of cells that express it. Indeed, miR125 null flies that are heterozygous for a null chinmo allele now display extended lifespan upon DR and have enlarged LDs. [The experiments using the let-7-C-Gal4 to deplete chinmo in Figure 2 are difficult to interpret because the Gal4 is not regulated by RU486 and is active through the life of the fly, leading to depletion of chinmo throughout development with consequences of defective neuronal patterning (Zhu, Cell 2006 and many other papers from Tzumin Lee and other groups)]. These data suggest that the maintenance of chinmo in miR125 null flies underlies the lack of life extension under DR.

We thank the reviewer 3 for a very thorough feedback of the data in the manuscript, however, we do not agree with the reviewer regarding the interpretation of let-7-C Gal4 for the analysis in Figure 2C-D. let-7-C Gal4 is not active throughout development, and its activity coincides with the expression of let-7-C primary transcript. The neuronal patterning of chinmo occurs much earlier during development- and let-7-C miRNA mediated downregulation of chinmo only affects the later-born neurons (Author response image 1). Our previously published analyses revealed that let-7 represses chinmo during development and miR-125 silences chinmo in adulthood (Chawla et al., 2016). We acknowledge Reviewer 3 for raising this relevant point and agree that more explanation should be included in support of the use of let-7-C Gal4 in the revised manuscript and we have summarized the differential mode of regulation of chinmo by let-7 and miR-125 in Figure 2A of the revised manuscript.

Author response image 1. Chinmo is silenced by let-7 and miR-125 in a biphasic manner.

Author response image 1.

(A) Schematic of a 1.4kb Chinmo 3’UTR fragment indicating number and arrangement of let-7 and miR-125 binding sites. (B) Chinmo derepression is significantly higher in let-7 mutant brains dissected from staged pupae (24h and 96h after puparium formation)(red dashed lines indicates the stage at which let-7 represses chinmo) (C) Chinmo is predominantly regulated by miR-125 in adult flies as the degree of depression of chinmo in ΔmiR-125 flies is more widespread and higher in miR-125 mutants than in Δlet-7 adult fly brains (Day-3 after eclosion)(red dashed lines indicates late pupal stage).

chinmo is abundantly expressed in the nervous system of Embryo, L1, L2, and early L3 (Zhu et al., 2006). Let-7-C miRNAs are induced by the ecdysone pulse in mid-late third larval instar (Chawla and Sokol., 2012) and this induction of let-7-C miRNAs coincides with repression of chinmo after mid-third larval stages. The 3’UTR of chinmo has multiple miRNA binding sites for both let-7 and miR-125 and the Chinmo gradient (downregulation) that is required for neuronal transitions during metamorphosis is mediated predominantly by let-7. The genotype of the strain analyzed in Figure 2D is: w1118; let-7-CGKI / let-7-CKO2, P{neoFRT}40A; {v+, let-7-C ΔmiR-125} attP2 / P{w+, UAS-chinmoRNAi 148}VK00033.

The ∆miR-125 transgene on chromosome 3 has a single wild-type copy of let-7 miRNA that predominantly silences chinmo during the 3rd larval instar. Our previously published study has shown that let-7 and miR-125 miRNAs silence chinmo in a biphasic manner, with let-7 being the predominant repressor of chinmo during development and miR-125 being the predominant silencer of chinmo during late pupal stages into adulthood. Quantitation of Chinmo protein (by immunofluorescence) in let-7 and miR-125 mutants (Chawla et al., 2016) during different pupal stages indicates that chinmo is predominantly repressed by let-7 during development and by miR-125 during adulthood (Schematic above). This expression analysis is further corroborated by our previously published phenotypic analysis of ∆let-7,miR-125 double mutants, and ∆let-7 single mutants that show that the loss of miR-125 does not exaggerate the let-7 mutant developmental phenotypes. Thus, indicating that ∆miR-125 mutants do not display any defects in neuronal patterning during development. Moreover, wild type let-7 in the ∆miR-125 mutants and control line ensure that chinmo is already repressed during metamorphosis.

2) In Figure 3, they try to determine in which tissue ectopic expression of chinmo decreases lifespan under DR. They used the gene switch inducible system for these experiments, only to find that ectopic expression of chinmo under Da, 5966 or FB leads to early mortality. In fact, even with the Elav neuronal driver, lifespan is shorter than the AL, no-RU-468 control. I find it difficult to logically connect the relatively early death caused by Chinmo mis-expression with a suppression of lifespan extension under DR. The authors need to find another way to test their hypothesis.

We agree with Reviewer 3 that ubiquitously driving chinmo expression with DaGS leads to early mortality. This is expected for proteins like Chinmo, which play dosage-sensitive essential roles. These experiments were not aimed at connecting overexpression of chinmo with an extension of lifespan by DR but we expected to observe a reduction in the DR-mediated extension of lifespan. We believe that it was important to analyze the consequences of ectopic expression of chinmo to assess whether its upregulation in the adult brain mimicked miR-125 mutant phenotypes. This experiment was complementary to the experiments where we show that knockdown of chinmo in the fat body promotes a DR-like state under AL conditions (current Figure 3F-J). Moreover, since a miRNA can target several mRNAs, this experiment was important for confirming that chinmo was the functionally relevant target that was mediating the DR phenotype. It was important to identify the tissues where this silencing of chinmo was critical for DR-mediated lifespan extension and hence an inducible GeneSwitch Gal4 system seems most appropriate. The other approach that we utilized was to examine whether reducing chinmo dosage by chinmoRNAi or genetic mutation (chinmo1) in miR-125 mutants was able to rescue miR125 mutant DR phenotype (presented in Figure 2). We have edited figure 3 (current Figure 6 of the revised manuscript) and removed the analysis done with DaGS and 5966 GeneSwitch drivers for clarity. The figure now includes analysis of ectopic expression of chinmo and flag chinmo in adult neurons (3X ElavGS) and in adult fat tissue (S1106). Comparison of survival curves of flies that overexpress Chinmo or flag Chinmo in adult neurons (Chinmo: AL+ vs DR+ p=0.0066 and Χ2= 7.37; Flag Chinmo p=0.0068 and Χ2=7.34) with flies that overexpress Chinmo or Flag Chinmo in adult fat tissue (Chinmo: AL+ vs DR+ p=0.0283 and Χ2= 4.81; Flag Chinmo p=0.9472 and Χ2=0.0043) indicates that overexpression of this protein in the adult fat tissue dampens the DR dependent increase in lifespan more significantly (Figure 6B-E). We believe that the statistical comparisons (p-values and Χ2 values) indicate that there is a significant difference between survival curves in AL and DR conditions and these should help the readers in connecting reduction in chinmo with extension of lifespan upon DR. These experiments confirm that deregulation of chinmo is the cause of miR-125 mutant DR phenotypes. Analysis of tissue-specific inducible expression of Chinmo was also important to uncover the non-autonomous effect of chinmo in fat tissue in 3X ElavGS >UAS chinmo flies. Based on the lifespan analysis, the maximum lifespan of 3X ElavGS >UAS chinmo flies in (AL-) conditions ranged between 56-58 days and upon RU mediated induction (AL+) varied between 50-54 days. The differences in DR- and DR+ conditions were expected if Chinmo were to play a role in DR-mediated lifespan extension.

Lastly, we would like to emphasize that the decision to use of GeneSwitch system to drive overexpression of chinmo was based on the requirement for adult-specific, tissue-specific, and inducible expression of chinmo. We are not aware of any other strategy that can fulfill the above criteria and be used to drive expression of dosage-sensitive regulators for examining the organismal level changes.

3) In Figure 3, they show that Elav>chinmo under RU-486 leads to a decrease in the size of lipid droplets, which they conclude connects neuronal chinmo to fat body metabolism in peripheral tissues.

In Figure 3 (Current figure 6), quantitation of stored fat (TAG levels) as well as lipid droplet size, were decreased (Figure 6F-G). The conclusion that ectopic expression of chinmo in adult neurons lead to a reduction in expression of genes involved in fat metabolism was arrived at by the proteomic analysis of 3X ElavGS> UAS chinmo flies and validation of downstream genes by RT-PCR analysis of the downregulated proteins that are involved in fat metabolism. These data are presented in Figure 7 of the revised manuscript. Additional supplementary data that connects neuronal chinmo to fat body metabolism in peripheral tissues is that overexpression of chinmo or Flag chinmo in adult neurons leads to an increase in Chinmo protein in the fat tissue (Figure 6—figure supplement 2 and Figure 6—figure supplement 3).

4) In Figure 4, they show the expression patterns of the GS Gal4 drivers, and because they see chinmo protein in tissues where the driver is supposedly not expressed, they conclude that chinmo RNA or protein is able to diffuse from neuronal cells to other tissues to induce metabolic changes. This is potentially an interesting model, but there are absolutely no data to support it. First, they need perform both real-time and lineage tracing of these drivers using G-trace. [G-trace should also be used for let-7-C-Gal4]. If these experiments support their hypothesis, then they would need to test how the movement of chinmo RNA or protein between tissues could occur – for example, by exosomes?

We agree with Reviewer 3 that more data needs to be presented in support of our hypothesis regarding the movement of chinmo mRNA or protein and here we list the new experiments that have been performed to show that chinmo mRNA and/or protein is expressed in a non-autonomous manner. For a more detailed explanation, we would like to request Reviewer 3 to refer to our response to Reviewer 1 comment 8.

i. Chinmo redistributes to the cytoplasm upon nutrient deprivation (Figure 4A and Figure 5C-N)

ii. Deacetylation of Chinmo by dSir2 is required for its nuclear export upon nutrient deprivation (Figure 4 and Figure 4—figure supplement 1).

iii. Chinmo fractionates with exosomes upon starvation (Figure 5).

iv. DR induces chinmo mRNA levels in the hemolymph (Figure 3E).

v. Nutrient deprivation leads to an increase in non-nuclear Chinmo in the fat tissue of w1118 (Figure 3A-C and Figure 3—figure supplement1A-E).

vi. Neuronal Chinmo upregulation induces Chinmo expression non-autonomously in the fat tissue (Figure 6J-K, Figure 6—figure supplement 2, Figure 6—figure supplement 3A-E).

In addition, we would like to cite an example of the study by Ulgherait et al., 2014, in which the authors utilized GeneSwitch drivers to provide evidence for a non-autonomous role for AMPK in organismal aging.

5) In Figure 5, they deplete chinmo from fat body using FB GS driver. What is the hypothesis being tested here? It was not clear to me. If neuronal chinmo RNA or protein travels from neurons to fat body, then how would depletion of chinmo from fat body alter this movement? These needs to be explained in the text. Let us assume that the chinmo transcripts being depleted in Figure 5 are produced by fat body cells (and not neurons), what is the prediction of this on lifespan extension under DR, TAG levels and lipid droplet size? In my mind, the upregulation of miR125 upon DR leads to the downregulation of chinmo message and protein in neuronal cells. This effect is somehow transmitted to fat body cells, which alter lipid metabolism to promote lifespan extension. If chinmo levels in fat body were depleted, there should be no effect on DR-induced lifespan extension and no change in TAG levels and no reduction in LD size. Indeed, my predictions are borne out by the data. There is no further increase in lifespan extension under DR when chinmo is depleted from fat body (Figure 5B blue solid and dashed lines); there is no difference in TAG levels (Figure 5C, blue solid and hashed bars) and LD size is not reduced (Figure 5E, light and dark blue dots). Yet the authors write in the title to Figure 5 and in lines 280-290 something to the effect that reducing chinmo levels in the adult fat body increases lifespan and enhances lipid metabolism. Would the authors please explain in the text the predictions for this experiment and the results? Their interpretation and mine are not congruous.

We agree with Reviewer 3, that more explanation should be provided to explain the premise for doing this experiment. We have included additional data in support of the hypothesis and have made edits in the manuscript that we explain here. Immunostaining of adult brains and fat tissue with Chinmo antibody indicates that miR-125 mutant flies express higher levels of Chinmo in the brain and fat tissue as compared to the control/rescue flies. These data indicate that Chinmo is derepressed in the adult brain and to some extent in the fat body in the miR-125 mutants (Figure 2B). We predicted that silencing of chinmo by miR-125 in either brain tissue and/or fat tissue is required for DR- mediated lifespan extension in wild-type flies. Since highly expressed miR-125 ensures that chinmo is repressed in adult brain in wild type flies/rescue (Figure 2B), we tested the effect of reducing chinmo in the fat tissue on lifespan extension by DR. The hypothesis being tested was that reduction in chinmo levels in the fat tissue is required for DR=mediated lifespan extension. Our prediction was that knockdown of chinmo in adult fat tissue would lead to extension of lifespan, increase in TAG levels and increase in lipid droplet size in AL conditions but no further increase of lifespan, no increase in TAG and no increase in lipid droplet diameter under DR conditions. Indeed, the data obtained from these experiments matched our prediction. These results indicate that knockdown of chinmo in the adult fat body is a prerequisite for DR-mediated lifespan extension and hence, a further knockdown of chinmo in DR conditions does not increase the lifespan further. However, knocking down chinmo in AL conditions recapitulates a DR like state and leads to an increase in lifespan.

We thank Reviewer 3 for pointing out the incorrectness in the title. We have edited the title to reflect that knockdown of chinmo in fat tissue leads to an increase in lifespan and enhances lipid metabolism in AL conditions. These data are now represented as Figure 2F-J of the revised manuscript.

6) In Figure 6, they perform mass spec on adult females in which chinmo has been inducibly mis-expressed in neurons. They find 40 proteins differentially expressed between the induced and uninduced samples, 7 upregulated and 33 downregulated. Of the latter, 7 proteins are involved in fat metabolism and their mRNAs decrease 10 days after induction of chinmo. Do the authors have an earlier time point? If chinmo does directly repress these 7 genes, it presumably would do so in a shorter time frame, for example 1-2 days after induction. 10 days is a long time-frame for gene expression and may represent indirect regulation, and if the authors saw an effect after 2 days, this would be a more meaningful result.

We thank reviewer 3 for the suggestion to analyze expression at an earlier time point to determine whether the effects are direct. We analyzed the expression of the 8 genes identified after inducing expression of chinmo for 2 days in 3X ElavGS>UAS chinmo flies and the data from this analysis is represented in Figure 7—figure supplement 1. Induction of UASchinmo for 2 days was sufficient to lead to a statistically significant reduction of 7 of the 8 genes analyzed in the head tissue. 3 out of 8 genes analyzed also displayed a statistically significant albeit lower reduction in the decapitated body tissue. These data confirmed that Chinmo represses these genes directly in the head tissue and longer induction (10d) of uas chinmo in the adult neurons is required for the genes to be repressed in the peripheral tissues.

7) Do these genes have chinmo binding sites in regulatory regions? It would also be helpful to validate decreased expression of proteins using antibodies or enhancer traps to characterized genes, for example, FATP for which both antibodies and enhancer traps exist.

A recently published study by Grmai et al., 2021 describes the transcriptomic analysis of chinmo-deficient cells from Drosophila testis. This study reports the following consensus Chinmo binding site (G/A)ATGCAC(T/C)(T/N)NN. We examined the noncoding regions (1500 bp upstream of the transcription start site, introns and 1500bp downstream of the termination site) of the 8 genes involved in fat metabolism that we validated to be Chinmo targets. Two binding sites were identified in CG9527 and one each in CG9577 and CG5009. We also searched the reverse complement sequence of the genes for the consensus binding and found that 7 of the 8 genes had 1 site and the remaining 1 (CG17544) had 3 sites.

As a second approach to identify motifs in the promoter sequences of the 8 genes that were validated to be transcriptionally repressed by Chinmo, we performed MEME analysis. The promoter sequences (50 base pairs) were downloaded from the Eukaryotic promoter database (EPD) and used for analysis. The MEME Suite (Bailey et al., 2009; Bailey et al., 2015) is a motif-based sequence analysis tool that can fetch motifs hidden in biological sequences – DNA, RNA, or proteins. We searched the promoter sequences of the genes, that we validated to be downregulated. The MEME tool (Version 5.3.3) from the MEME Suite web server (https://meme-suite.org/meme/tools/meme) was used with the default parameters. MEME was instructed to report the top ten motifs from the search. No motifs could be identified with this approach.

As suggested by reviewer 3, we have verified that overexpression of Flag-tagged chinmo in adult neurons using a 3X ElavGS driver (3X ElavGS> UAS Flag chinmo) reduced endogenous Fatp protein levels under AL conditions. The western blot analysis was performed on whole fly lysates and is currently represented as Figure 7—figure supplement 3A and following explanation has been included in the Results section:

“To verify whether overexpression of chinmo in adult neurons led to a decrease in protein levels of the endogenous proteins involved in fat metabolism, we performed western blot analysis of whole fly lysates prepared from 3x Elavgs>UAS flag chinmo flies that were fed either an AL+ RU-486 or AL+ solvent/ethanol diet for 10 days. Since, most of the downstream targets identified are not that well-characterized (CG2107, CG9527, CG17544, CG5009, CG8778, and CG9577), we tested the expression of endogenous Fatp for which antibodies were available. Western blot analysis was performed with anti-flag antibody to detect Chinmo, anti-Fatp antibody to detect endogenous Fatp, and antitubulin as normalization control. Consistent with the proteomics data, a reduction in Fatp levels was seen upon upregulation of Flag Chinmo in adult neurons (Figure 7—figure supplement 3A).”

8) They then test the functional role for FASN1 and FATP in DR-dependent lifespan extension. Once again, it would be helpful for the authors to explain in the text the predictions for this experiment. To my mind, if downregulation of chinmo in the fat body is important for DR-induced lifespan extension and if chinmo represses the fasn1 and fatp genes, then loss of chinmo should in increase FASN1 and FATP expression and this should aid in fatty acid turnover. Depletion of fasn1 and fatp should then decrease DR-induced lifespan extension, which is confirmed by the results (Figure 6I and J), and mis-expression of these factors should increase this extension, which again is supported by the results (Figure 6L). These are important results for the paper but are insufficiently explained in the text by the authors.

We agree with Reviewer 3 and thank the reviewer for the suggestion. The text in the Results section of the revised manuscript has been edited to explain the predictions for these experiments. To test whether downregulation of the candidate fat metabolism genes in the adult fat tissue was responsible for modulating lifespan, we measured survival of flies that expressed transgenes to knockdown fasn1 and fatp specifically in the adult fat body (Figure 7I, J). We predicted that if overexpression of one of these genes was sufficient to cause increased lipid turnover and consequentially DR-mediated lifespan extension, then knockdown of these genes would result in a reduction in lifespan upon DR. Knockdown of fasn1 resulted in an 18.7% decrease in median lifespan of flies that were fed an AL diet and a 3.22% decrease in median lifespan on DR diet (Figure 7I and Figure 7-source data 1). Knockdown of fatp resulted in a 14.8% decrease in median lifespan upon DR and no change under AL conditions (Figure 7J and Figure 7-source data 2). Since knockdown of fatp resulted in a decrease in the lifespan of flies that were fed a DR diet, we tested whether increasing the levels of fatp in the adult fat tissue led to an increase in the lifespan of flies under AL conditions. Western blot analysis of whole fly lysates prepared from FBGS > UAS Flag fatp flies that were fed an AL or DR diet in the presence and absence of RU-486 for 10 days revealed that Flag Fatp was expressed in an inducible manner, however, much lower levels of the flag-tagged protein was detected under AL conditions as compared to that in DR conditions (Figure 7—figure supplement 3D). Overexpressing UAS-Flag-FATP specifically in the adult fat tissue increased median life span by 14.2% under AL conditions and by 25% under DR conditions (Figure 7K). The smaller increase in median lifespan in AL conditions is likely due to the lower induction of the protein, nevertheless, an increase in lifespan in both diets indicates that Fatp functions as a pro-longevity factor and that DR dependent increase in lifespan occurs due to an increase in the expression of two or more genes that are regulated by Chinmo.

9) In Figure 7, they express human miR125 in fat body and examine lifespan extension. Once again, the rationale for these experiments is totally unclear to me. The model introduced earlier in the paper is that neuronal (not fat body) miR125 extends lifespan under DR. Why did they perform the experiments in Figure 7? How do these results add to the paper? To me, they detract from the paper. The authors need to definitely establish in which cells miR125 is acting and in which cells chinmo is being regulated.

We apologize for the lack of clarity in the Results section of Figure 8 (Figure 7 in the previously submitted version). We have edited the Results section to include a rationale for performing the experiments in Figure 8. We have examined the expression of miR-125 and chinmo in the brain and fat tissue under AL and DR conditions and our data indicated that DR induces both miR-125 and chinmo in the fat tissue (Figure 3—figure supplement 1G and Figure 8B, compare -AL and -DR bars). However, the lower expression levels of miR-125 in the fat body as well as higher induction of chinmo mRNA limit miR-125mediated downregulation of Chinmo in this tissue. By expressing human miR-125 in the adult fat body, we addressed four questions: (i) Is the role of miR-125 in fat tissue conserved i.e., can human primary miR-125 substitute for Drosophila miR-125; (ii) Can miR-125 function as a DR-mimetic i.e., can modulating its level provide benefits of DR, irrespective of diet (i.e., in both AL and DR). (iii) Can increasing levels of the miRNA silence chinmo more efficiently and provide additional benefits. (iv) Can increasing the levels of a miRNA in a tissue that it is not expressed/expressed at low levels be used as a strategy to redirect the role of its downstream targets. Consistent with our expression analysis of miR-125, a previous study in the mouse model reported miR-125b as one of the miRNAs that increase in the subcutaneous white fat tissue upon caloric restriction (Mori et al., 2012). However, the beneficial effects of increasing miR-125b in the fat tissue were not examined in the mouse model. Hence, we tested whether artificially increasing the levels of miR-125 specifically in the fat tissue would lead to silencing of chinmo and consequentially lead to an increase in lifespan. Our results revealed that overexpression of miR-125 in fat tissue does increase lifespan of flies that are fed an AL diet but more so in DR. Since, only one dose/condition of induction was utilized, further optimization of induction duration or RU-486 would likely lead to a greater enhancement in lifespan upon AL. Nevertheless, these initial results are promising because the data indicates that the modulation of this miRNA in the fat tissue is beneficial at an organismal level. In addition, this analysis also shows that the functional role of miR-125 as a pro-longevity factor is conserved and that human pri miR-125 can extend lifespan. In the revised manuscript, we have edited the text to clarify that both miR-125-dependent and nutrition-dependent post-translational control of Chinmo mediate the DR-mediated increase in lifespan.

10) Figure 8 is a model of the result, but it does not clarify any of the confusion about the autonomy of chinmo activity.

We have edited the model (Figure 9) to clarify that both miR-125 dependent regulation of chinmo in the adult brain, as well as DR-mediated post-translational regulation of Chinmo in the fat tissue, are required for extension of lifespan upon DR. The proposed model summarizes the mechanism by which chinmo regulates lifespan extension by dietary restriction. miR-125 targets chinmo mRNA in the brain under AL and DR conditions. In the adult fat tissue, Chinmo transcriptionally represses genes involved in fat metabolism. Dietary restriction mediated cytoplasmic relocalization of Chinmo in the fat tissue relieves transcriptional repression of genes involved in fat metabolism, thus increasing lifespan. Thus, regulation of chinmo at the transcriptional (nutrition-dependent), post-transcriptional (miR-125-dependent) and post-translational (dSir2-dependent) ensures DR-mediated extension of lifespan.

11) Figure 1B are missing the appropriate control, which is the "rescue" genotype. W1118 is not the right control for this experiment because it does not contain the let-7-C alleles and the attP-inserted transgene. This is important because it forms the foundation for the entire study.

We agree with Reviewer 3 that w1118 is not the appropriate control for the experiment. In the previously submitted manuscript, the strain encoded two copies of the let-7-Chyp transgene (let-7-Cnull; let-7-Chyp/let-7-Chyp). To make comparisons with a control having an identical genetic background, we have done the analysis again with a strain with a single copy of the let-7-Chyp and a single of the let-7-C transgene lacking all three miRNAs (w1118; let-7-CGKI/ let-7-CKO2 in a let-7-Cnull transheterozygous background (P{neoFRT}40A; P{w+, let-7-Cp3.3kb::cDNA} / {v+, let-7-C Δlet-7-C miRNAs}attP2). The experiment has been repeated with a genetically identical control strain that has the transheterozygous let-7-C null alleles, a single copy of the hypomorph transgene, and a wild type let-7-C transgene (let-7-CGKI/ let-7-CKO2, P{neoFRT}40A; P{w+, let-7Cp3.3kb::cDNA} / {v+, let-7-C }attP2). Both rescue and experimental lines have been tested again and are represented as Figure 1H-I and figure 1-source data 1-2. Since these strains are different from the hypomorph used earlier, the RT-PCR analysis for quantitation of let-7-C miRNAs has also been repeated with the strains used for lifespan analysis and the data are presented as Figure 1E-G and Figure 1—figure supplement 2BD of the revised manuscript.

12) Figure 2A,B are missing controls (δ miR125 alone and chinmo1/+ alone). Furthermore, the driver in Figure 2A is let-7-CGal4, which is not a GS gal4 and therefore is active through development. The correct experiment here would be elavGS. This should be remedied.

We thank Reviewer 3 for pointing out the missing controls. The survival curves for testing the effect of genetic background have been represented in Figure 1—figure supplement 2K, Figure 2—figure supplement 1B, Figure 1—figure supplement 2-source data 1, and Figure 2—figure supplement 1-source data 1 of the revised manuscript.

We agree with Reviewer 3 that the Gal4 used is let7-C Gal4 and is not GeneSwitch. Our premise for using let-7-C Gal4 is based on our previous analysis of miR-125 mediated regulation of chinmo. Chinmo is regulated by let-7 and miR-125 and wild type let-7 in the miR-125 mutants ensures that chinmo is repressed during development. In the Figure 2C and D panels (Previous Figure 2A) we are trying to assess whether knockdown of chinmo in miR-125 expressing cells rescues the miR-125 mutant phenotype. Our previous analysis (Chawla et al., 2016) of Chinmo protein levels in adult brains indicates that Chinmo is predominantly repressed by miR-125 in adult fly brains and as a consequence, miR-125 mutants display upregulated Chinmo protein in the brain (Author response image 2). Let-7 miRNA ensures that chinmo is repressed during development (late third instar onwards). Since, both the control and experimental strains in Figure 2C-D have wildtype let-7 miRNA, chinmo is repressed during development even when let-7-C Gal4 is driving chinmoRNAi. However, the absence of miR-125 in Figure 2D leads to the derepression of chinmo in adult brains. Hence, to examine the effect of chinmoRNAi specifically in miR-125 expressing cells, let-7-C Gal4 is more appropriate. In addition, we would like the reviewer to refer to Figure 5 in Chawla et al., 2016, where we have analyzed the expression of chinmo mRNA and protein in let-7 and miR-125 mutant lines during different developmental stages and in adult flies. In addition, we have also provided functional evidence for the differential regulation of chinmo by let-7 and miR-125 in the previously published study. miR-125 mutants do not display any developmental phenotypes associated with chinmo overexpression (Chawla et al., 2016). We have included a schematic of the differential regulation of chinmo by let-7 and miR-125 as Figure 2A in the revised manuscript.

Author response image 2. miR-125 is the predominant miRNA that silences chinmo in adult flies.

Author response image 2.

(A-D) Confocal images of 3d adult brains immunostained for Chinmo (green). No Chinmo expression was detected in brains of flies harboring either the wild type of the ΔmiR-100 transgene (panels A and B). The level of Chinmo expression in ΔmiR-125 mutants is much higher than in Δlet-7 mutant adult flies (compare panels C and D).

13) Figure 2C and D – the AD and DR TAG profiles should be displayed on the same graph. Why are they separated? Why are is the Y-axis scale so different (0-7 on the AD and 0-50 on the DR) between AL and DR? I can't determine what happens to TAG levels under DR in the various genotypes. This is a significant issue for me. This experiment needs to be performed again and plotted on the same graph.

The data represented in Figure 2C and D of the previously submitted manuscript were normalized to protein and hence lysates prepared from flies that were fed a DR diet had lower amounts of proteins and hence higher TAG/[protein] (y-axis) values as compared to lysates from flies that were fed an AL diet. As suggested by Reviewer 3, the experiment was performed again and we didn’t see much change in the values. The AL and DR data are now plotted on the same graph (Figure 2G).

14) Figure 2G-J – why is the chinmo protein not monitored here?

We thank the reviewer for pointing this out, In the revised manuscript we have examined Chinmo protein levels under AL and DR conditions (Figure 3A-C; Figure 3—figure supplement 1A-E and 1H) and starvation conditions (Figure 4—figure supplement 2A-C) in w1118 adult flies. Chinmo is not abundantly expressed in adult flies and hence, we were not so confident about immunostaining to detect Chinmo protein levels in the previously submitted version. However, we have standardized the protocol and the data is presented in the revised version of the manuscript.

15) Why is dilp6 being monitored? The authors do not discuss the rationale for examining dilp6 or foxo; they need to tell the reader why they are doing this experiment.

We agree with Reviewer 3 that a rationale should be provided for examining dilp6 and foxo. We examined dilp6 and foxo because the mRNAs of these genes are induced upon nutrient shortage/starvation (Slaidina et al., 2009; He et al., 2020). Thus, we utilized dilp6 and foxo mRNA as positive controls for the starvation state and to compare the magnitude of increase of these mRNAs with that of chinmo mRNA upon starvation. The foxo and dilp6 data have been removed from the revised manuscript to retain the focus on chinmo expression.

16) In panel H, what do the third and fourth pair of bars represent? In other words, why are + head and -head being shown twice?

We thank the reviewer for pointing out the error. The panel has been removed and only one time-point is represented in Figure of the revised manuscript.

17) In panel J, why is starvation (absence of protein) introduce here? What is the rationale for this experiment and why is it being shown?

Starvation is a form of nutrient deprivation that recapitulates the non-feeding states during development. Since chinmo is highly expressed during development, we wanted to test whether transcriptional upregulation of chinmo occurs during starvation as well. There are other regulators such as dSir2 and insulin-like peptide mRNAs that are regulated both by dietary restriction and starvation and hence, we wanted to examine tissue-specific regulation of chinmo upon nutrient deprivation. We have included additional data to support our preliminary analysis. Chinmo mRNA and protein are transcriptionally and post-translationally regulated upon starvation. In the revised manuscript we show that dSir2 deacetylates Chinmo and facilitates its distribution to the cytoplasm upon starvation. This nutrient-dependent post-translational modification of Chinmo may also play a role in relieving the repression of Chinmo targets. This panel is now represented as Figure 4—figure supplement 2I in the revised manuscript.

18) Figure 3A: DaGS>UAS-Chinmo flies with RU-486 all day within ~12 days of adulthood, much earlier ectopic flies without drug treatment. These data indicate that there is toxicity/lethality associated with ectopic chinmo, which obviates any possible connection to lifespan extension.

We agree that overexpression of chinmo ubiquitously using DaGS in adult tissues causes lethality. These data further support our model that silencing of chinmo by miR-125 is critical for DR. Our model proposes that repression of chinmo in the brain and fat tissue is required for DR mediated lifespan extension and hence, we would expect that increasing mRNA or protein levels of this dosage-sensitive factor would be deleterious. We believe that chinmo is an example in support of the Antagonistic pleiotropy hypothesis that proposes that a gene that controls multiple traits, where at least one of the traits is beneficial to the organism’s fitness early on in life and at least one is detrimental to the organism’s fitness later-on (during aging). Hence, multiple mechanisms (transcriptional, post-transcriptional, and post-translational) exist to regulate the levels of this key temporal regulator. In our opinion, these data do not in any way obviate a connection of the miR125-chinmo axis to lifespan extension. Since, the manuscript is focused on examining the miR-125-chinmo pathway in the brain and fat tissue, we have removed the DaGS>UASchinmo lifespan data as most of the supporting data to show the effect on TAG levels is in 3X ElavGS >UAS chinmo and FBGS >UAS chinmo, we have retained these panels only.

19) Figure 4 – please supply monochrome (white on black) all of these. It is very difficult for the human brain to appreciate green on black.

We have edited all figures with images to monochrome and retained the colors only in the merged/overlay images.

20) The authors need to better explain the various let-7-C reagents that they use both in the legend to Fig, 1 and in the Materials and Method. In particular, the let-C-7GKI allele is not on Flybase and I had to look up three prior pages to figure this out. Please make the manuscript easier to read and to be appreciated by the reviewer.

The let-7-C reagents that are used in Figures 1 and 2 are described in the results, material methods, and figure legends of the revised manuscript. Additionally, we have included the genetic scheme for the generation of the strains in Figure 1—figure supplement 1. The description of the let-7-CGKI allele is included in the methods section. We have tried our best to make the manuscript easier to read.

Associated Data

    This section collects any data citations, data availability statements, or supplementary materials included in this article.

    Supplementary Materials

    Figure 1—source data 1. Lifespan analysis of let-7-Complexhyp, let-7-Complexhyp rescue, let-7-Complexnull rescue, ΔmiR-100, Δlet-7, and ΔmiR-125 mutant lines.
    Figure 1—source data 2. Survival proportions for strains used in Figure 1.
    Figure 1—figure supplement 2—source data 1. Lifespan analysis of let-7-Complexhyp, let-7-Complexhyp rescue, let-7-Complexnull rescue, ΔmiR-100, Δlet-7, and ΔmiR-125 mutant lines.
    Figure 1—figure supplement 2—source data 2. Survival proportions for strains used in Figure 1.
    Figure 2—source data 1. Lifespan analysis of rescue, chinmoRNAi and ΔmiR-125, chinmoRNAi strains.
    Figure 2—source data 2. Lifespan analysis of rescue, chinmo1 and ΔmiR-125, chinmo1 strains.
    Figure 2—source data 3. Survival proportions for strains used in Figure 2.
    Figure 2—figure supplement 1—source data 1. Lifespan analysis of flies encoding a single copy of the UAS chinmoRNAi transgene and a strain that is heterozygous for let-7-C and chinmo.
    Figure 2—figure supplement 1—source data 2. Survival proportions for strains used in Figure 2—figure supplement 1.
    Figure 3—source data 1. Lifespan analysis of FBGS >UAS chinmoRNAi strain.
    Figure 3—source data 2. Survival proportions of lifespan curves of FBGS >UAS chinmoRNAi strain.
    Figure 4—source data 1. Uncropped western blots with relevant bands labeled for Figure 4D–F.
    Figure 4—source data 2. Original image files of the unedited for western blots in Figure 4D.
    Figure 4—source data 3. Original image files of the unedited for western blots in Figure 4E.
    Figure 4—source data 4. Original image files of the unedited for western blots in Figure 4F.
    Figure 4—source data 5. Morphology and fluorescence microscopy of Kc167 cells used in Figure 4.
    elife-62621-fig4-data5.docx (295.6KB, docx)
    Figure 4—figure supplement 1—source data 1. Uncropped western blots with relevant bands labeled for Figure 4—figure supplement 1C.
    Figure 4—figure supplement 1—source data 2. Original image files of the unedited for western blots in Figure 4—figure supplement 1C.
    Figure 5—source data 1. Uncropped western blots with relevant bands labeled for Figure 5B and O.
    Figure 5—source data 2. Original image files of the unedited western blots in Figure 5B and O.
    Figure 5—figure supplement 1—source data 1. Uncropped western blots with relevant bands labeled for Figure 5—figure supplement 1B.
    Figure 5—figure supplement 1—source data 2. Original image files of the unedited western blots in Figure 5—figure supplement 1B.
    Figure 6—source data 1. Lifespan analysis of strains used in Figure 6.
    Figure 6—source data 2. Survival proportions of lifespan curves of strains used in Figure 6B–E.
    Figure 6—figure supplement 1—source data 1. Lifespan analysis of strains used in Figure 6—figure supplement 1A–C.
    Figure 7—source data 1. Lifespan analysis of FBGS >UAS fasn1RNAi and +/+; UAS fasn1RNAi strains.
    Figure 7—source data 2. Lifespan analysis of FBGS >UAS fatpRNAi and +/+; UAS fatpRNAi strains.
    Figure 7—source data 3. Lifespan analysis of FBGS >UAS Flag fatp and +/+; UAS Flag fatp strains.
    Figure 7—source data 4. Survival proportions of lifespan curves of strains used in Figure 7I–K.
    Figure 7—source data 5. Upregulated biological processes from proteomic analysis in Figure 7D–F.
    Figure 7—source data 6. Downregulated biological processes from proteomic analysis in Figure 7D–F.
    Figure 7—figure supplement 3—source data 1. Uncropped western blots with relevant bands labeled for Figure 7—figure supplement 3A and D.
    Figure 7—figure supplement 3—source data 2. Original image files of the unedited for western blots in Figure 7—figure supplement 3A.
    Figure 7—figure supplement 3—source data 3. Original image files of the unedited for western blots in Figure 7—figure supplement 3D.
    Figure 7—figure supplement 3—source data 4. Survival proportions of lifespan curves of strains used in Figure 7—figure supplement 3E–G.
    Figure 8—source data 1. Lifespan analysis of FBGS >UAS hsa pri miR-125b-1 strain.
    Figure 8—source data 2. Survival proportions of lifespan curves of strains used in Figure 8C.
    Figure 8—figure supplement 1—source data 1. Lifespan analysis of UAS has pri miR-125b-1/+ strain.
    Figure 8—figure supplement 1—source data 2. Survival proportions of lifespan curve of strain used in Figure 8—figure supplement 1.
    Supplementary file 1. Genotypes used in the study.
    elife-62621-supp1.docx (18.5KB, docx)
    Supplementary file 2. Primers used in the study.
    elife-62621-supp2.docx (16.7KB, docx)
    Supplementary file 3. Downregulated biological process.
    elife-62621-supp3.xlsx (15.5KB, xlsx)
    Supplementary file 4. Upregulated biological process.
    elife-62621-supp4.xlsx (14.5KB, xlsx)
    Transparent reporting form

    Data Availability Statement

    All data generated or analyzed during this study are included in the manuscript and supporting files. Source data files have been provided for Figures 1, 2, 3, 4, 5, 6, 7, 8. Proteomics analysis data done in Figure 7 is also provided in Supplementary files 3 and 4 (Upregulated and downregulated processes).


    Articles from eLife are provided here courtesy of eLife Sciences Publications, Ltd

    RESOURCES