

Abstract
Technological and computational advances in genomics and interactomics have made it possible to identify how disease mutations perturb protein-protein interaction (PPI) networks within human cells. Here, we show that disease-associated germline variants are significantly enriched in sequences encoding PPI interfaces compared to variants identified in healthy subjects from the 1000 Genomes and ExAC projects. Somatic missense mutations are also significantly enriched in PPI interfaces compared to non-interfaces in 10,861 tumor exomes. We computationally identified 470 putative oncoPPIs in a pan-cancer analysis and demonstrate that the oncoPPIs are highly correlated with patient survival and drug resistance/sensitivity. We experimentally validate the network effects of 13 oncoPPIs using a systematic binary interaction assay, and also demonstrate the functional consequences of two of them on tumor cell growth. In summary, this human interactome network framework provides a powerful tool for prioritizing alleles with PPI perturbing mutations to inform pathobiological mechanism and genotype-based therapeutic discovery.
Introduction
Interpretation of the clinical pathogenic effects of variants is crucial for the advancement of precision medicine. However, our ability to understand the functional and biological consequences of genetic variants identified by human genome sequencing projects is limited. Many computational approaches can identify only a small proportion of pathogenic variants with the high confidence required in clinical settings. Human genome sequencing studies have reported potential mutation-disease associations with the functional regions altered by somatic mutations, such as molecular drivers in cancers.1,2 However, many important issues in the field remain unclear, including the phenotypic consequences of different mutations within the same gene and the same mutation across different cell types.
Recent efforts using systematic analyses of 1,000–3,000 missense mutations in Mendelian disorders3,4 and ~2,000 de novo missense mutations in developmental disorders5 demonstrate that disease-associated alleles commonly alter distinct protein-protein interactions (PPIs) rather than grossly affecting the folding and stability of proteins.3,4 Network-based approaches provide novel insights into disease-disease6 and drug-disease7–9 relationships within the human interactome. Yet, the functional consequences of disease mutations on the comprehensive human interactome and their implications for therapeutic development remain understudied. Several studies have suggested that protein structure-based mutation enrichment analysis offers a potential tool for identification of possible cancer driver genes10, such as hotspot mutation regions in three-dimensional (3D) protein structures11–14. Development of novel computational and experimental approaches for the study of functional consequences of mutations at single amino acid residue resolution is crucial for our understanding of the pleiotropic effects of disease risk genes and offers potential strategies for accelerating precision medicine15,16.
In this study, we investigated the network effects of disease-associated mutations at amino acid resolution within the 3D macromolecular interactome of structurally-resolved and computationally-predicted PPI interfaces. We provide evidence for widespread perturbations of PPIs in human diseases caused by both germline and somatic mutations identified in large-scale sequencing studies.
RESULTS
Widespread network perturbations by germline mutations
To investigate the effects of disease-associated mutations at amino acid resolution on a PPI network, we constructed a structurally-resolved human protein-protein interactome network by assembling three types of experimentally validated binary PPIs with experimental or predicted interface information: (a) PPIs with crystal structures from the RCSB protein data bank17, (b) PPIs with homology modeling structures from Interactome3D18, and (c) experimentally determined PPIs with computationally predicted interface residues from Interactome INSIDER19 (see online Methods). In total, we collected 121,575 PPIs (edges or links) connecting 15,046 unique proteins (nodes). We found that disease-associated mutations from the Human Gene Mutation Database (HGMD)20 were significantly enriched in PPI interfaces of the respective proteins compared to variants identified in individuals from 1000 Genomes21 (P < 2.2×10⁻¹⁶, two-tailed Fisher’s test, Fig. 1a) and ExAC22 (P < 2.2×10⁻¹⁶, two-tailed Fisher’s test, Fig. 1a) projects. We found the same level of enrichment for mutant interface residues with both crystal structures (Supplementary Fig. 1) and within the high-throughput systematic interactome identified by (unbiased) yeast two-hybrid (Y2H) screening assays23 (Supplementary Fig. 2). Fig. 1b reveals the global view of network perturbations in disease-associated germline mutations from the HGMD20. For example, multiple disease-associated gene products, such as p53, LMNA, CFTR, HBA, and GJB2, have PPIs altered by multiple interface, disease-associated mutations.
Fig. 1. Proof-of-concept of protein-protein interaction-perturbing alleles in human diseases.
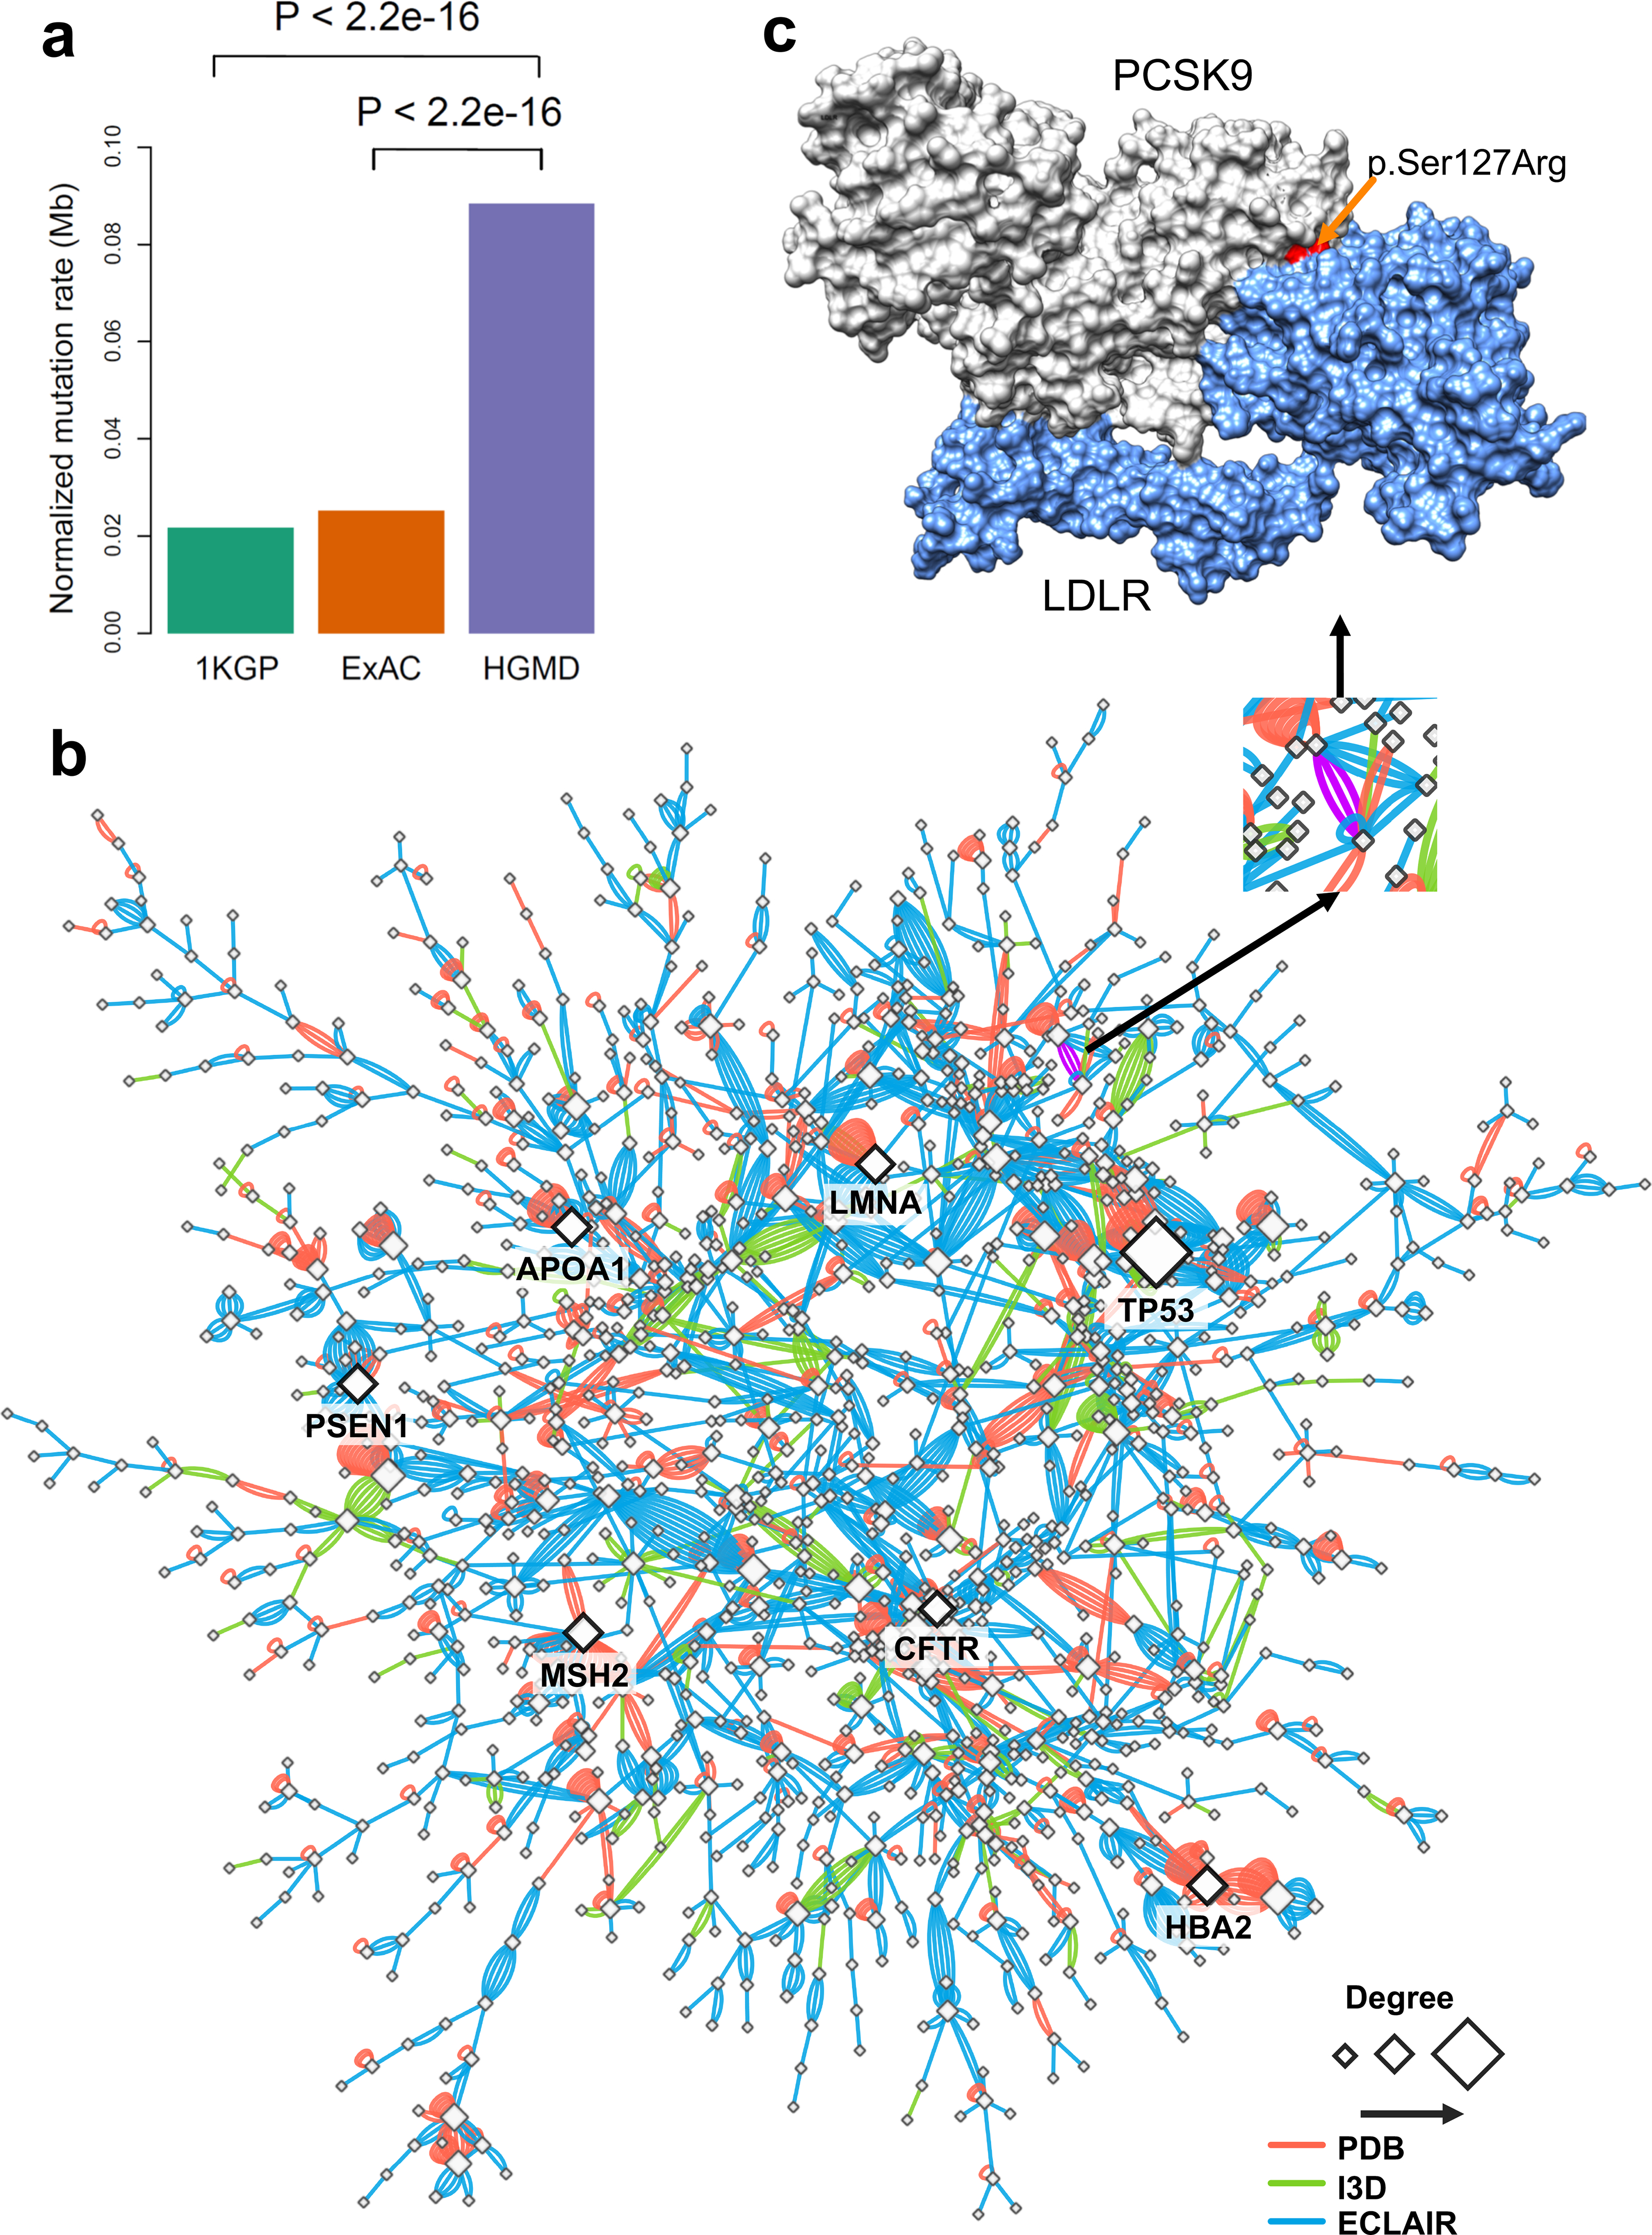
(a) Distribution of mutation burden at protein-protein interfaces for disease-associated germline mutations from HGMD in comparison to mutations from the 1,000 Genome Project (1KGP) and ExAC Project. P-value was calculated by two-tailed Fisher’s test. (b) A subnetwork highlights disease network module for all human disease-associated mutations at protein-protein interfaces. An edge denotes at least one disease-associated mutation from HGMD at the interfaces of experimentally identified binary PPIs. Three types of protein-protein interfaces are illustrated: (i) PPIs with crystal structures (PDB), (ii) PPIs with homology models (I3D), and (iii) experimentally determined PPIs with computationally predicted interface residues (ECLAIR) (see Online Methods). A PPI with multiple types of evidences of protein-protein interface-associated mutations was illustrated by multiple edges (links). Node size is counted by degree (connectivity). (c) An example of a PPI-perturbing mutation (p.Ser127Arg in PCSK9) affecting the PCSK9 and LDLR complex (PDB id: 3M0C). The protein three-dimensional images (including Figure 5c and 5d, Figure 6c and 6d, and Figure 7a and 7g) were prepared by PyMOL (https://pymol.org/2/).
Proprotein convertase subtilisin/kexin type 9 (PCSK9), first discovered by human genetic screening studies in 2003, has generated great interest in genomics-informed drug discovery for cardiovascular disease24. We, therefore, investigated whether the PCSK9 allele carrying a p.Ser127Arg substitution perturbs the interaction between PCKS9 and LDLR (low-density lipoprotein receptor protein) (Fig. 1c). We performed molecular dynamics (MD) simulations (Supplementary Fig. 3) to predict that the binding affinity between p.Ser127Arg PCSK9 and LDLR would be increased (545 kJ/mol) compared with wild-type (691 kJ/mol, Supplementary Fig. 4). We focused on the interaction between the beta-propeller region of LDLR and the non-covalently bound propeptide (residues 61–152) of PCSK9. The binding affinity (ΔΔG) of p.Ser127Arg relative to that of wild type is predicted to change by −14 kJ/mol, suggesting that the strength of interaction with LDLR is perturbed by the p.Ser127Arg substitution.
We next focused on the propeptide of PCSK9, where the total change in binding affinity by p.Ser127Arg is predicted to be altered by −211 kJ/mol (Supplementary Fig. 4). The region centered on the p.Ser127Arg substitution is key to the increased binding affinity in the mutant PCSK925. While interactions between the propeptide of PCSK9 and the beta-propeller of LDLR do exist in the wild-type system, they do not involve the region surrounding residue 127 (Supplementary Fig. 4). Much of the change in the binding affinity, on a per residue basis, is due to a steep increase in the electrostatic interaction energy with the mutated residue (Arg127), which accounts for the greatest contribution to the significant change in overall binding affinity (Supplementary Fig. 4). For example, a number of arginine residues in the alpha-helix (Leu88-Arg105) distal to the interface between the beta-propeller of LDLR and the propeptide are predicted to exhibit an increase in their binding affinity due to an increase in electrostatic interactions. This increase in electrostatic interactions stems from a roughly 15 Å decrease in the distance between the center of the helix and the interaction region, measured from the alpha-carbon of Arg86 in PCSK9 and Arg385 of LDLR (Supplementary Fig. 5). For the PCSK9 p.Ser127Arg-LDLR complex, the combination of the extra length of the sidechain, in addition to the charged guanidinium functionality, would allow interactions with the sidechains of Arg385 and His386 on LDLR. In summary, combining human interactome analyses and computational biophysical modeling supports an interaction perturbation model for p.Ser127Arg, in agreement with our notion of PPI-perturbing alleles.
PPI-perturbing alleles in somatic mutations
We next turned to an investigation of the somatic mutation load between PPI interface and non-interface regions. We inspected 1,750,987 missense somatic mutations from 10,861 tumor exomes across 33 cancer types from The Cancer Genome Atlas (TCGA) in the interface regions of 121,575 PPIs. We found a significantly higher somatic mutation burden at PPI interfaces compared to non-interfaces across all 33 cancer types (P < 2.2×10⁻¹⁶, two-tailed Wilcoxon test, Fig. 2a). For breast cancer, the average missense mutation burden leading to amino acid substitutions is 20 per 1 million residues in interface regions, significantly higher than that of non-interface regions (4 per 1 million, 5-fold enrichment, P < 2.2×10⁻¹⁶, two-tailed Wilcoxon test). We found the same trend that somatic mutations are highly enriched in both crystal structure-derived (Supplementary Fig. 6) and computationally inferred (Supplementary Fig. 7) PPI interfaces compared to non-interface regions across all 33 cancer types, as well. We further performed the same mutation burden analysis in structurally-resolved, unbiased PPIs. We found a higher mutation load at the interface residues of the physical human interactome using co-crystal structures only (Supplementary Fig. 8) and unbiased, binary PPIs identified by Y2H with available co-crystal structure-derived interfaces and computationally predicted interfaces, as well (Supplementary Fig. 9), supporting the robustness of the analysis. We investigated the cumulative distribution of deleterious amino acid substitutions between PPI interface and non-interface regions. Deleterious substitutions quantified by both SIFT (Fig. 2b) and PolyPhen-2 (Fig. 2c) scores are significantly enriched at PPI interfaces compared to non-interfaces. Thus, widespread interaction perturbations caused by somatic mutations may contribute to tumorigenesis. Following this analysis, we next pursued the identification of putative oncoPPIs (also termed significantly mutated edges [SMEs]) by systematically exploring the mutation burden between PPI interfaces versus non-interfaces across 10,861 tumor exomes.
Fig. 2. Network perturbation by missense somatic mutations in human cancers.
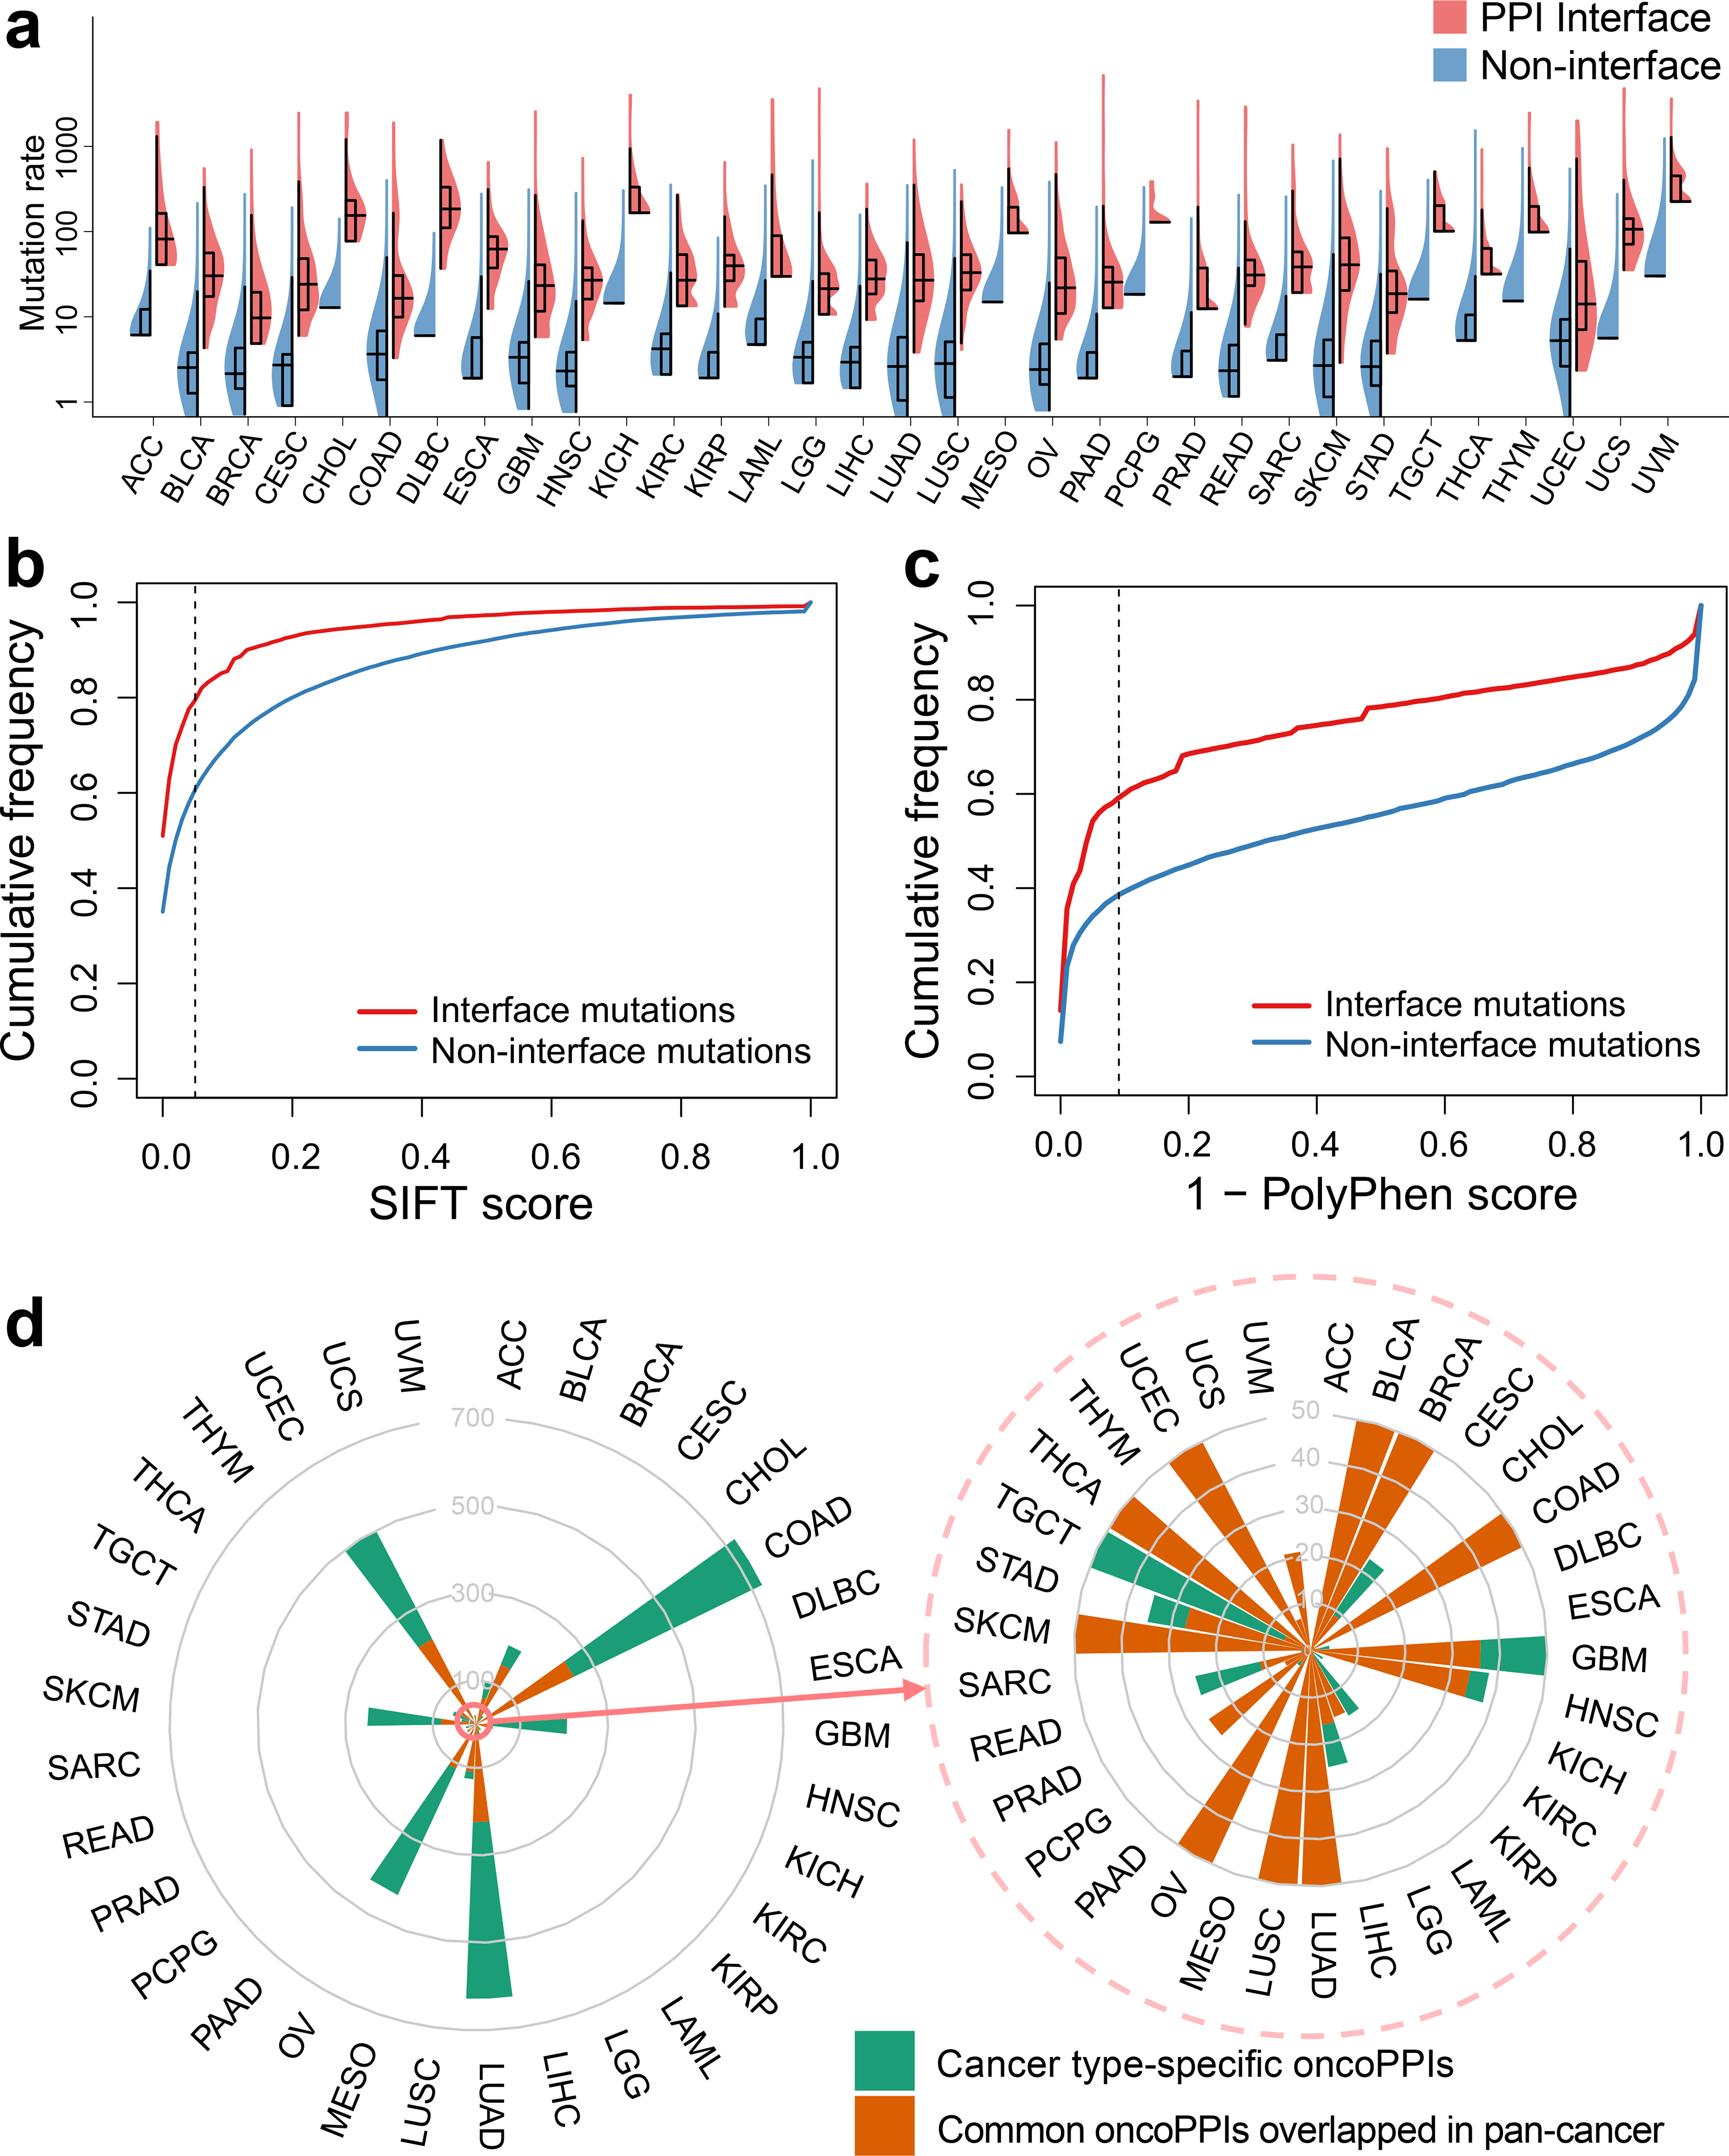
(a) Distribution of missense mutations in protein-protein interfaces versus non-interfaces across 33 cancer types/subtypes from The Cancer Genome Atlas (TCGA). The data are represented as violin plots with underlaid boxplots where the middle line is the median, the lower and upper edges of the rectangle are the first and third quartiles, and the lower and upper whiskers of the violin plot represent the interquartile range (IQR) ×1.5. (b & c) Cumulative frequencies of SIFT (b) and PolyPhen-2 scores (c) for protein-protein interface mutations (red) versus non-interface (green) mutations. Abbreviations of 33 cancer types are provided in the main text. (d) A circos plot illustrating the landscape of significant mutation-perturbed PPIs (termed putative oncoPPIs) which harbor a statistically significant excess number of missense mutations at PPI interfaces across 33 cancer types/subtypes (adjusted p-value < 0.05, see Online Methods). The bar denotes the number of putative oncoPPIs across each cancer type/subtype. Cancer type-specific oncoPPIs are highlighted by green. Overlapped oncoPPIs between individual cancer type and pan-cancer analysis (adjusted p-value < 0.001) are highlighted by orange. The detailed data are provided in Supplementary Table 1. All abbreviations for each cancer type/subtype are provided in main text.
Systematic identification of oncoPPIs
Based on the observation that somatic missense mutations are enriched at PPI interfaces (Fig. 2a) and that mutations at PPI interfaces are more likely to be deleterious than those at the non-interfaces (Fig. 2b and 2c), we prioritized putative oncoPPIs using a binomial statistical model (see Online Methods). In total, we investigated the somatic mutations in 10,861 tumor-normal pairs across 33 cancer types/subtypes in the TCGA database. All abbreviations for 33 cancer types/subtypes are provided in Online Methods. We selected putative oncoPPIs using subject matter expertise based on a combination of factors: (i) strength of the prediction (a higher adjusted p-value in Supplementary Table S1); (ii) availability of crystal structure-derived PPI interfaces; (iii) novelty of the predicted oncoPPIs; and (iv) availability of sufficient patient survival and pharmacogenomics data for meaningful evaluation. Applying these criteria resulted in 470 putative oncoPPIs among a total of 15,357 PPIs (Supplementary Fig. 10 and Supplementary Data 1). Among 470 pan-cancer putative oncoPPIs, we highlighted 13 oncoPPIs with documented crystal structure-based interface mutations, such as KEAP1-KFE2L2, SPOP-H2AFY, and FGF1-FGFR3 (Extended Data Fig. 1).
We next investigated putative oncoPPIs identified across 33 individual cancer types. In total, we found 2,708 unique, putative oncoPPIs across 29 cancer types, including 2,338 heterodimers and 370 homodimers, that reached a level of significance (Fig. 2d, FDR q < 0.05, Online Methods, Supplementary Data 1), with at least one putative oncoPPI (Supplementary Fig. 11). Among the 10,861 TCGA tumor samples analyzed, 4,405 (40%) samples harbour at least one putative oncoPPI. Figure 3 illustrates the landscape of putative oncoPPIs across the 33 cancer types. The top five oncoPPIs (heterodimers) with known structural information include BRAF-MAP2K1, PIK3R1-PIK3CA, TP53-EP300, TP53-TP53BP2, and KEAP1-NFE2L2. Among these complexes, 3D structural analysis revealed that p.Val600Glu on BRAF may perturb the BRAF-MAP2K1 interaction (Supplementary Fig. 12), consistent with a prior study.26 The specific PPI-perturbing somatic mutations among these leading oncoPPIs are p.Arg132His in IDH1, p.Val600Glu in BRAF, p.His1047Arg in PIK3CA, p.Gln209Leu in GNA11, and p.Phe133Leu in SPOP (Fig. 3). In summary, many known driver mutations are commonly located in regions that are part of the interaction interface of one or the other binding partner proteins, indicating the potential for widespread interaction perturbation in human cancers (Fig. 3).
Fig. 3. Landscape of protein-protein interaction-perturbing mutations across 33 cancer types.
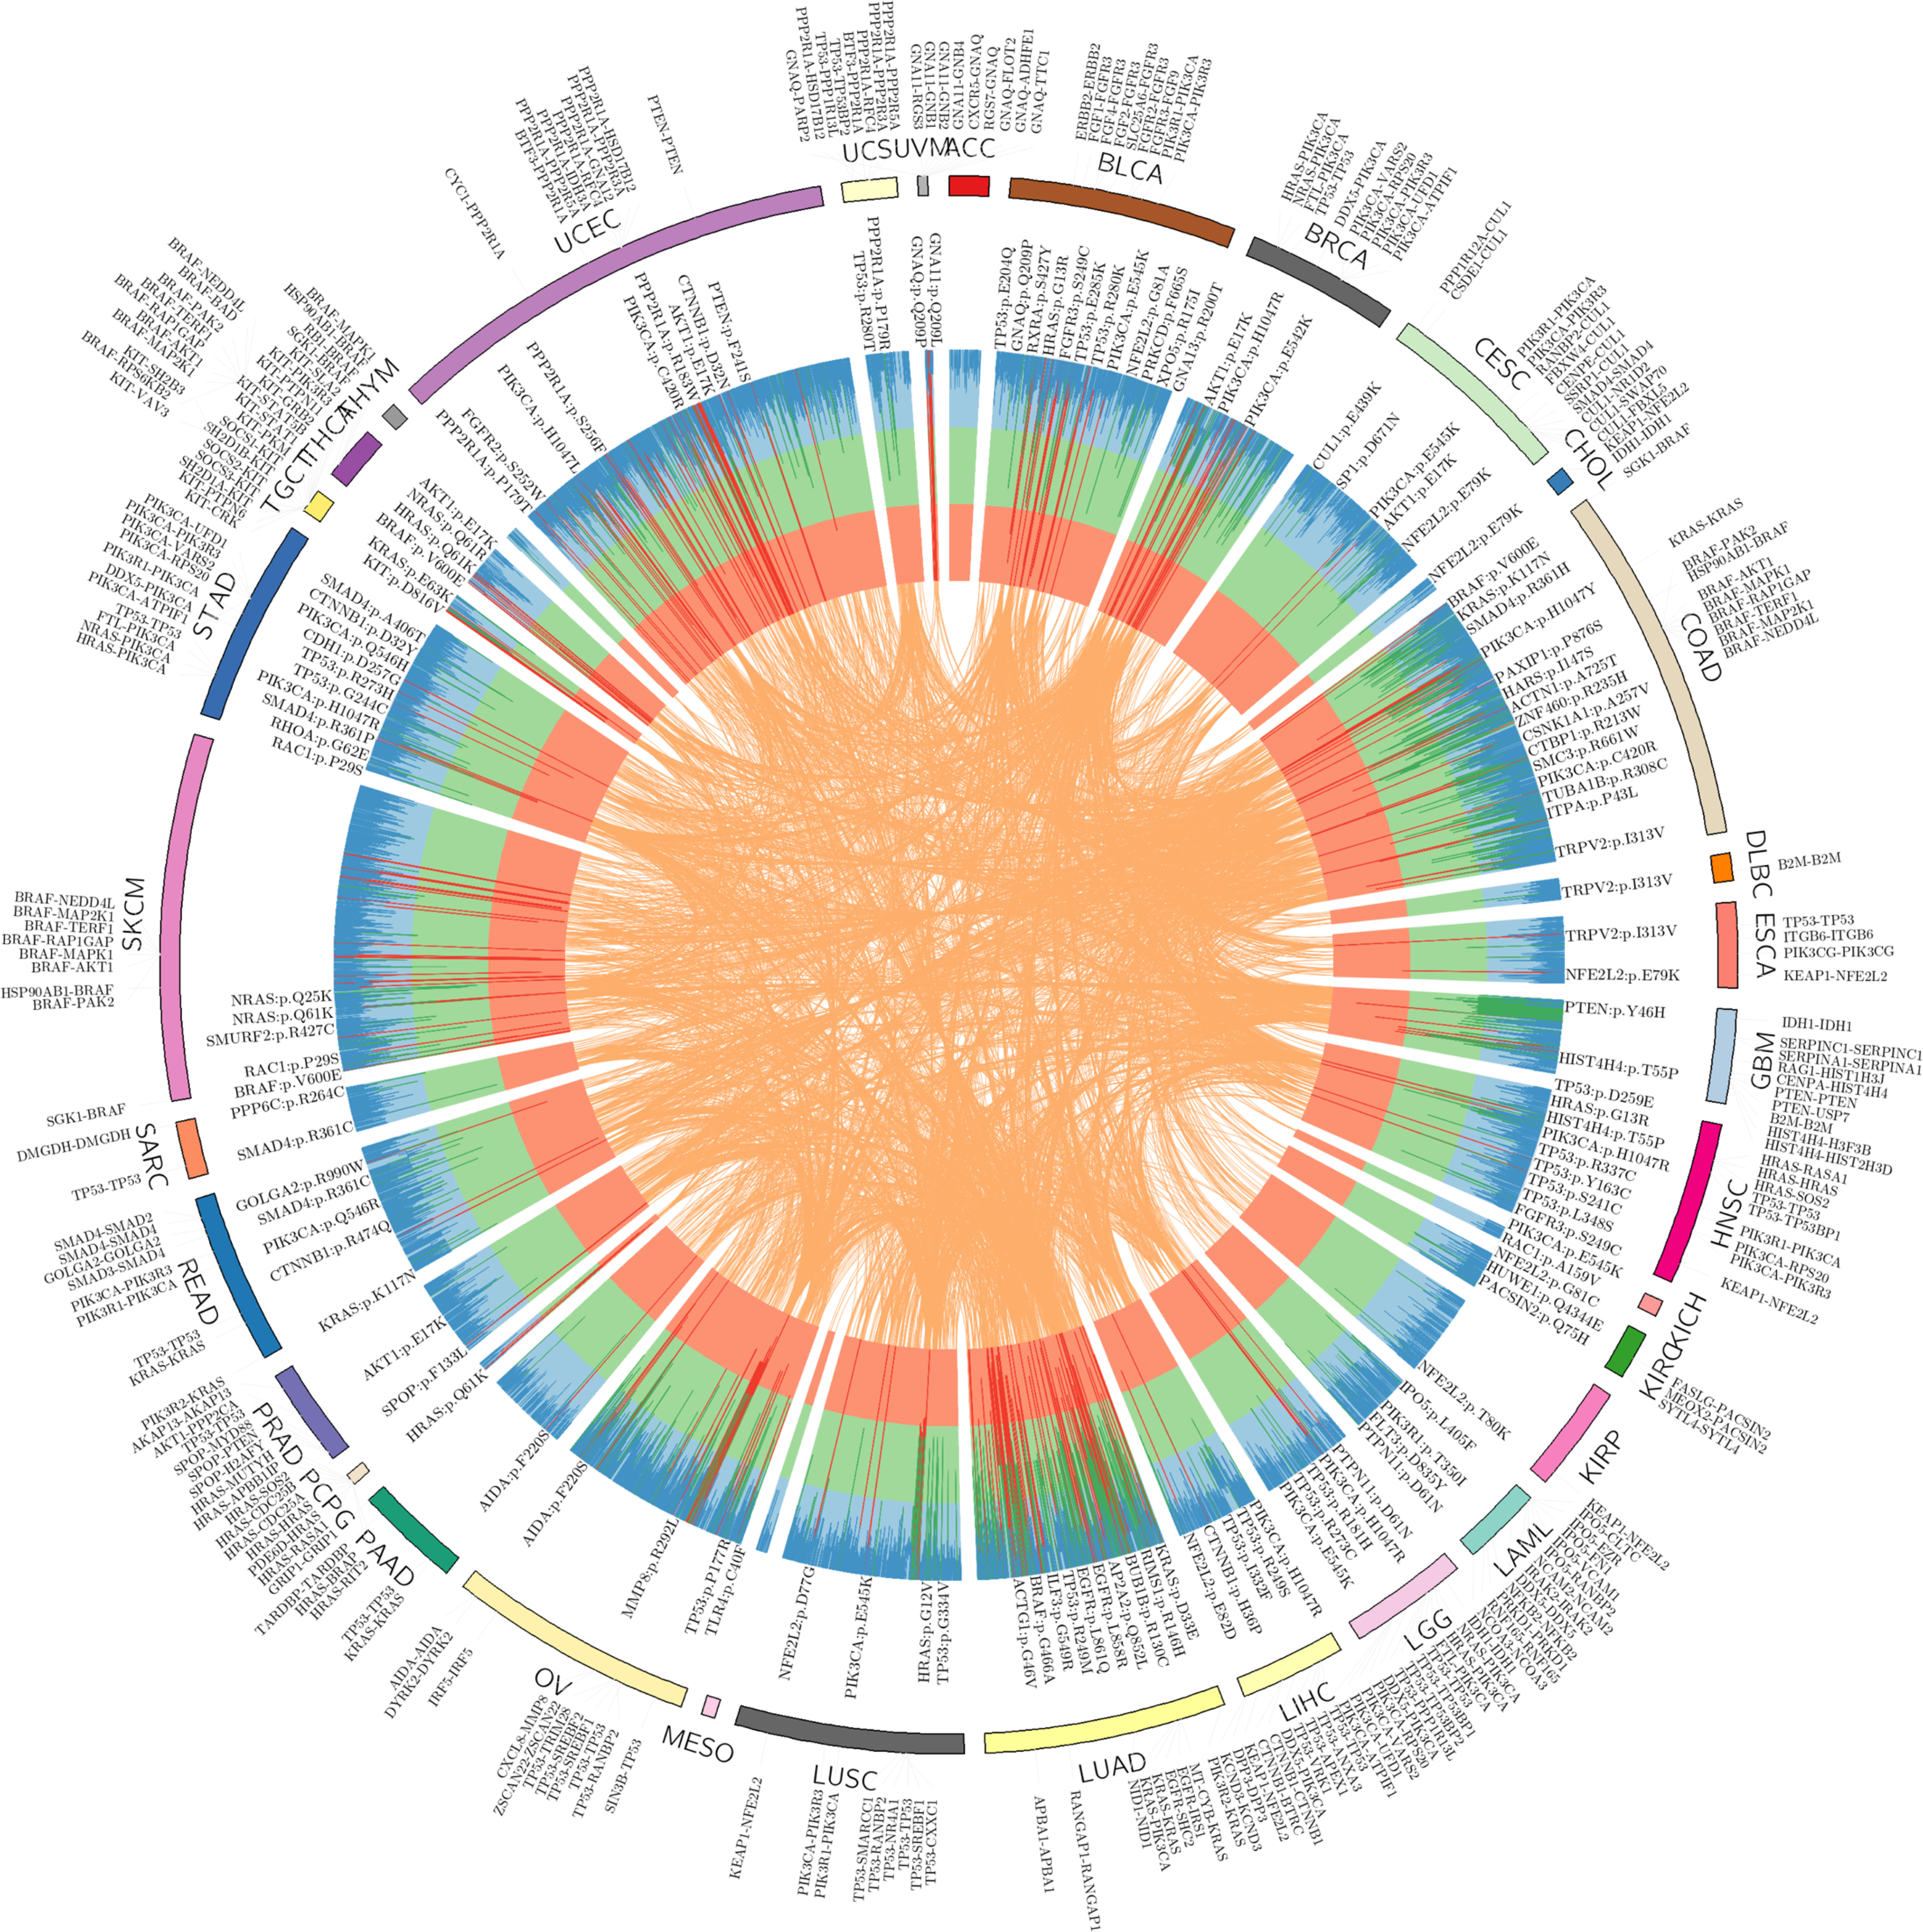
The circos plot displays significant mutation perturbed protein-protein interactions (termed putative oncoPPIs, see Online Methods) which harbor a statistically significant excess number of missense mutations at PPI interfaces across 33 cancer types. The putative oncoPPIs with various significance levels (see Online Methods) are plotted in three inner layers. The links (edges, orange) connecting two oncoPPIs indicate two cancer types share the same oncoPPIs. Some significant oncoPPIs and their related mutations are plotted on the outer surface. The length of each line is proportional to −log10(P). All oncoPPIs and PPI-perturbing mutations are free available at https://mutanome.lerner.ccf.org/.
Pharmacogenomic landscape of PPI-perturbing mutations
We next examined whether or not putative oncoPPIs can predict drug responses (Fig. 4a). We used ANOVA to determine if there is a significant difference in the responses of specific cell lines comparing the PPI interface-mutated group and the wild-type interface group. By analyzing drug pharmacogenomic profiles of over 1,000 cancer cell lines from the Genomics of Drug Sensitivity in Cancer (GDSC) database (see Online Methods), we found that interface-predicted mutations of oncoPPIs are highly correlated with sensitivity or resistance to multiple therapeutic agents (Supplementary Data 2). Figure 4b shows that oncoPPIs correlate with the sensitivity or resistance of 66 clinically investigational or approved anticancer agents. For example, we found that PPI-perturbing mutations in SNAI1 and ACTN2 were responsible for resistance to foretinib (a c-Met and VEGFR2 kinase inhibitor27, Supplementary Fig. 13), consistent with a previous study28. In addition, PPI-perturbing mutations in GNAI2 (encoding G protein subunit alpha I229) that directly disrupt interactions with RGS20 and TRIP6 were associated with resistance to several chemotherapeutic agents, including gemcitabine and tamoxifen (Supplementary Fig. 13).
Fig. 4. Pharmacogenomics landscape of protein-protein interaction-perturbing alleles.
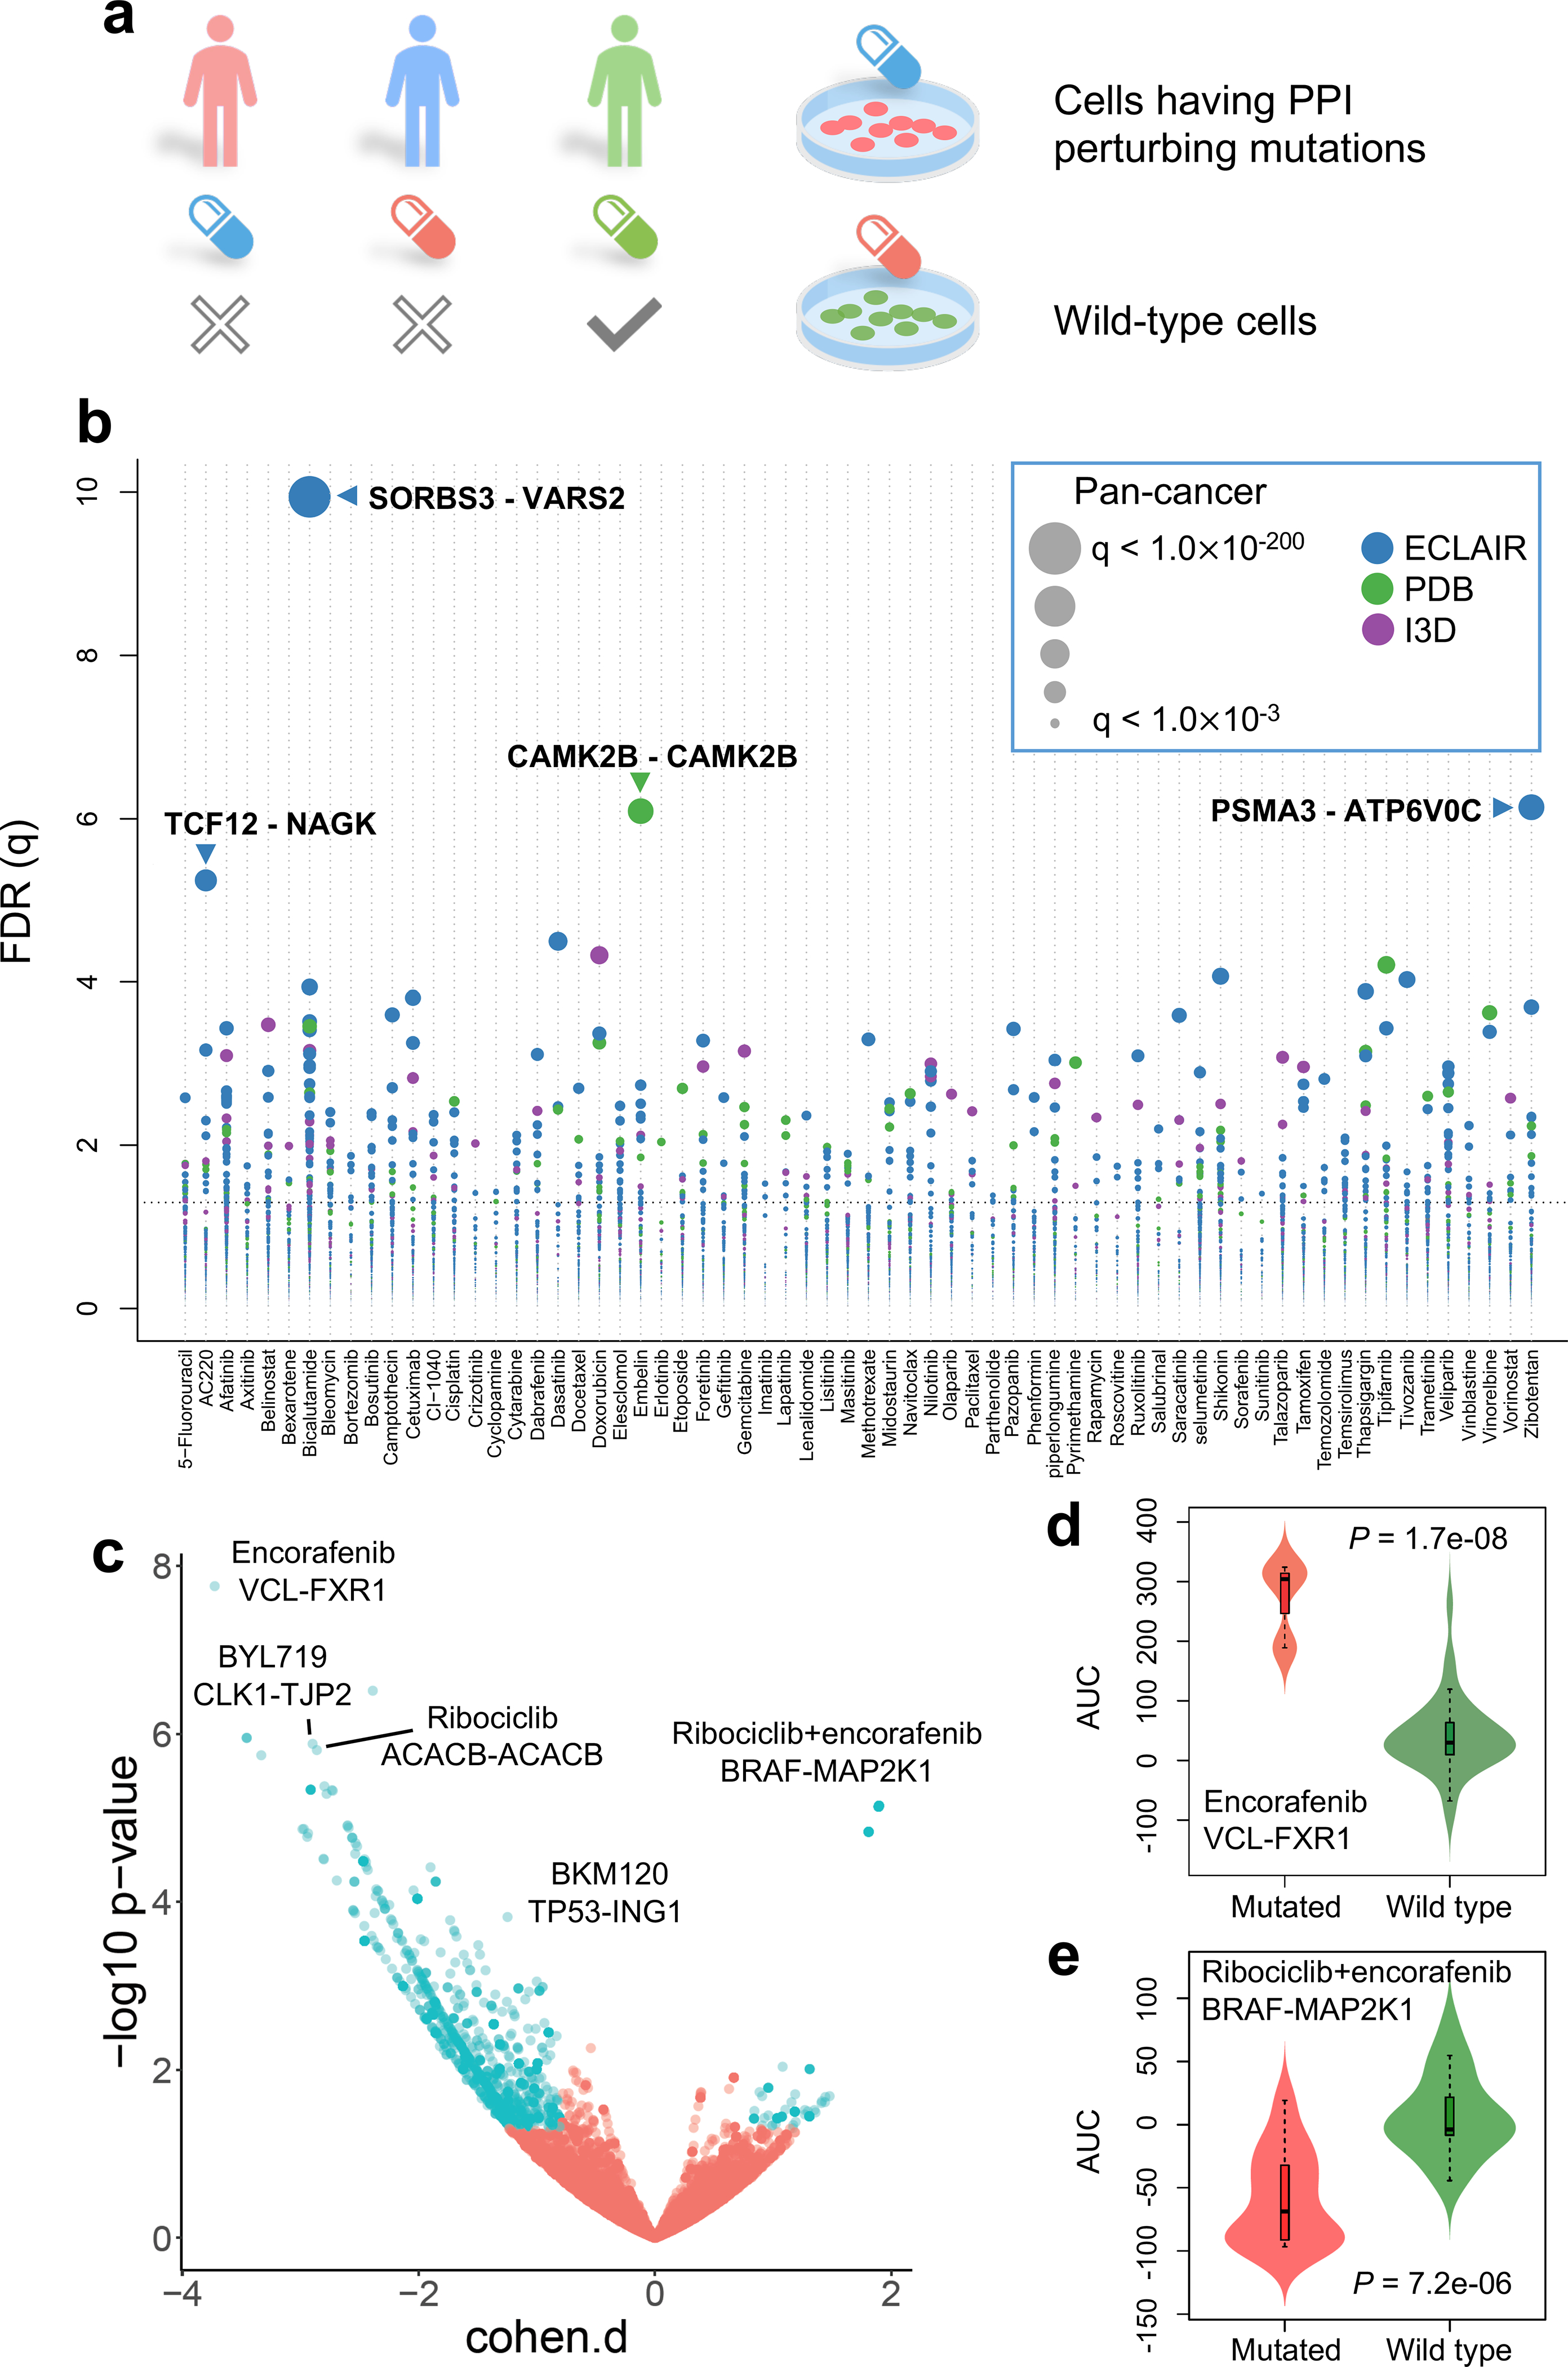
(a) Experimental design of pharmacogenomics predicted by PPI-perturbing alleles. (b) Drug responses evaluated by mutation-perturbed PPIs (putative oncoPPIs) which harbor a statistically significant excess number of missense mutations at PPI interfaces by following a binomial distribution across 66 selected anticancer therapeutic agents in cancer cell lines. Each node denotes a specific oncoPPI. The size of a node denotes the p-value levels computed by two-tailed ANOVA test (see Online Methods). The effect size was quantified through Cohen’s statistics using the difference between two means divided by a pooled standard deviation for the data. Color of nodes represents three different types of PPIs (see Figure 1c legend). (c) Drug responses evaluated by oncoPPIs in the Patient-Derived Xenograft (PDX) models. (d & e) Highlighted examples of drug response for encorafenib and its combinations (LEE011 and encorafenib) predicted by interface mutations on VCL-FXR1 (n=3 mutated cell lines; n=73 wild type cell lines) and BRAF-MAP2K1 (n=14 mutated cell lines; n=19 wild type cell lines), respectively. The p-value (P) was calculated by two-tailed ANOVA test. The data are represented as a boxplot with a underlaid violin plot where the middle line is the median, the lower and upper edges of the box are the first and third quartiles, the whiskers represent the interquartile range (IQR) ×1.5 and beyond the whiskers are outlier points.
We further investigated their correlation with anticancer drug response by analyzing the data from in vivo compound screens between ~1,000 patient-derived tumor xenograft (PDXs) models and 62 medications.30 In total, we found 2,808 significant correlations (P < 0.05, ANOVA test, see Methods) between 49 medications and 1,411 putative oncoPPIs (Fig. 4c). Amino acid substitutions in VCL (vinculin), located at the interface between VCL and FXR1 (fragile X mental retardation syndrome-related protein 1) are significantly correlated with resistance to encorafenib, an FDA-approved BRAF inhibitor for the treatment of melanoma,31 compared to patients without VCL-FXR1 perturbing mutations. Importantly, FXR1-BRAF fusion has been found in glioma,32,33 which may explain the correlation of encorafenib’s response with interface substitutions that disrupt VCL-FXR1 (Fig. 4d). Interface substitutions that disrupt BRAF-MAP2K1 were significantly associated with response to combination therapy with ribociclib (a CDK4/CDK6 inhibitor34) and encorafenib in PDX models, suggesting potential pharmacogenomic biomarkers for rational development of combination therapy in cancer. In summary, PPI-perturbing mutations offer potential as pharmacogenomic biomarkers in both cancer cell lines and PDX models, an observation that warrants further detailed investigation using preclinical and clinical data.
PPI-perturbing alleles in histone H4 complex
We next investigated the correlation between patient survival and oncoPPIs. We found that interface substitutions of p53 or SRSF1 (arginine-rich splicing factor 135) in p53-SRSF1 were significantly associated with poor survival rate in bladder urothelial carcinoma (BLCA) (P = 6.1 × 10⁻³, Log-rank test), breast invasive carcinoma (BRCA) (P = 6.4 × 10⁻⁴), and colon adenocarcinoma (COAD) (P = 7.2 × 10⁻³), among 33 cancer types (Extended Data Fig. 2 and Supplementary Fig. 14). Yet, mutations in p53 alone are modestly associated with poor survival rate in BRCA (P = 0.03, Log-rank test), but are not associated with BLCA (p = 0.79) and COAD (p = 0.11, Extended Data Figure 2) survival rate. Amino acid substitutions of EP300 (histone acetyltransferase p30036) or NFYB (nuclear transcription factor Y subunit beta) at the interfaces of EP300-NFYB significantly correlated with poor survival rate in melanoma patients (p = 0.02, log-rank test, Supplementary Fig. 15). For COAD, PPI-perturbing mutations in PLG (plasminogen) or SMAD4 (mothers against decapentaplegic homolog 4) are highly correlated with poor survival (P < 1.0×10⁻⁴, Log-rank test, Supplementary Fig. 15).
Histone H4, encoded by HIST1H4A, is one of the five main histone proteins involved in gene regulation and chromatin structure.37 Figure 5a shows multiple potential PPI-perturbing mutations in histone H4 in complex with DAXX (death-associated protein 6), H3F3A (H3 histone family member 3A), and CENPA (centromere protein A). We found a high mutational burden of the histone H4 complex in multiple cancer types (Fig. 5b), especially for BLCA, head and neck squamous cell carcinoma (HNSC), lung adenocarcinoma (LUAD), lung squamous cell carcinoma (LUSC), and uterine corpus endometrial carcinoma (UCEC). Figure 5c illustrates several selected H4 interface substitutions of the histone H4 complex. Interface substitutions of HIST1H4A or H3F3A (encoding histone H3.338) in H3.3-H4 interfaces are significantly associated with poor survival in COAD (Fig. 5e) and response to multiple anticancer drugs, such as paclitaxel and BMS-754807 (Fig. 5f). We found multiple interface substitutions between histone H4-DAXX, which are potentially involved in tumorigenesis and drug responses (Fig. 5c). For example, PPI-perturbing mutations in histone H4 that disrupt the DAXX interaction are significantly associated with poor survival in COAD and LUSC, and are further associated with drug responses in those malignancies (Fig. 5e and 5f). Thus, PPI-perturbing alleles in the histone H4 complex provide another example of clinically relevant mechanisms of PPI-perturbing alleles.
Fig. 5. Protein-protein interaction-perturbing alleles in histone H4 complex.
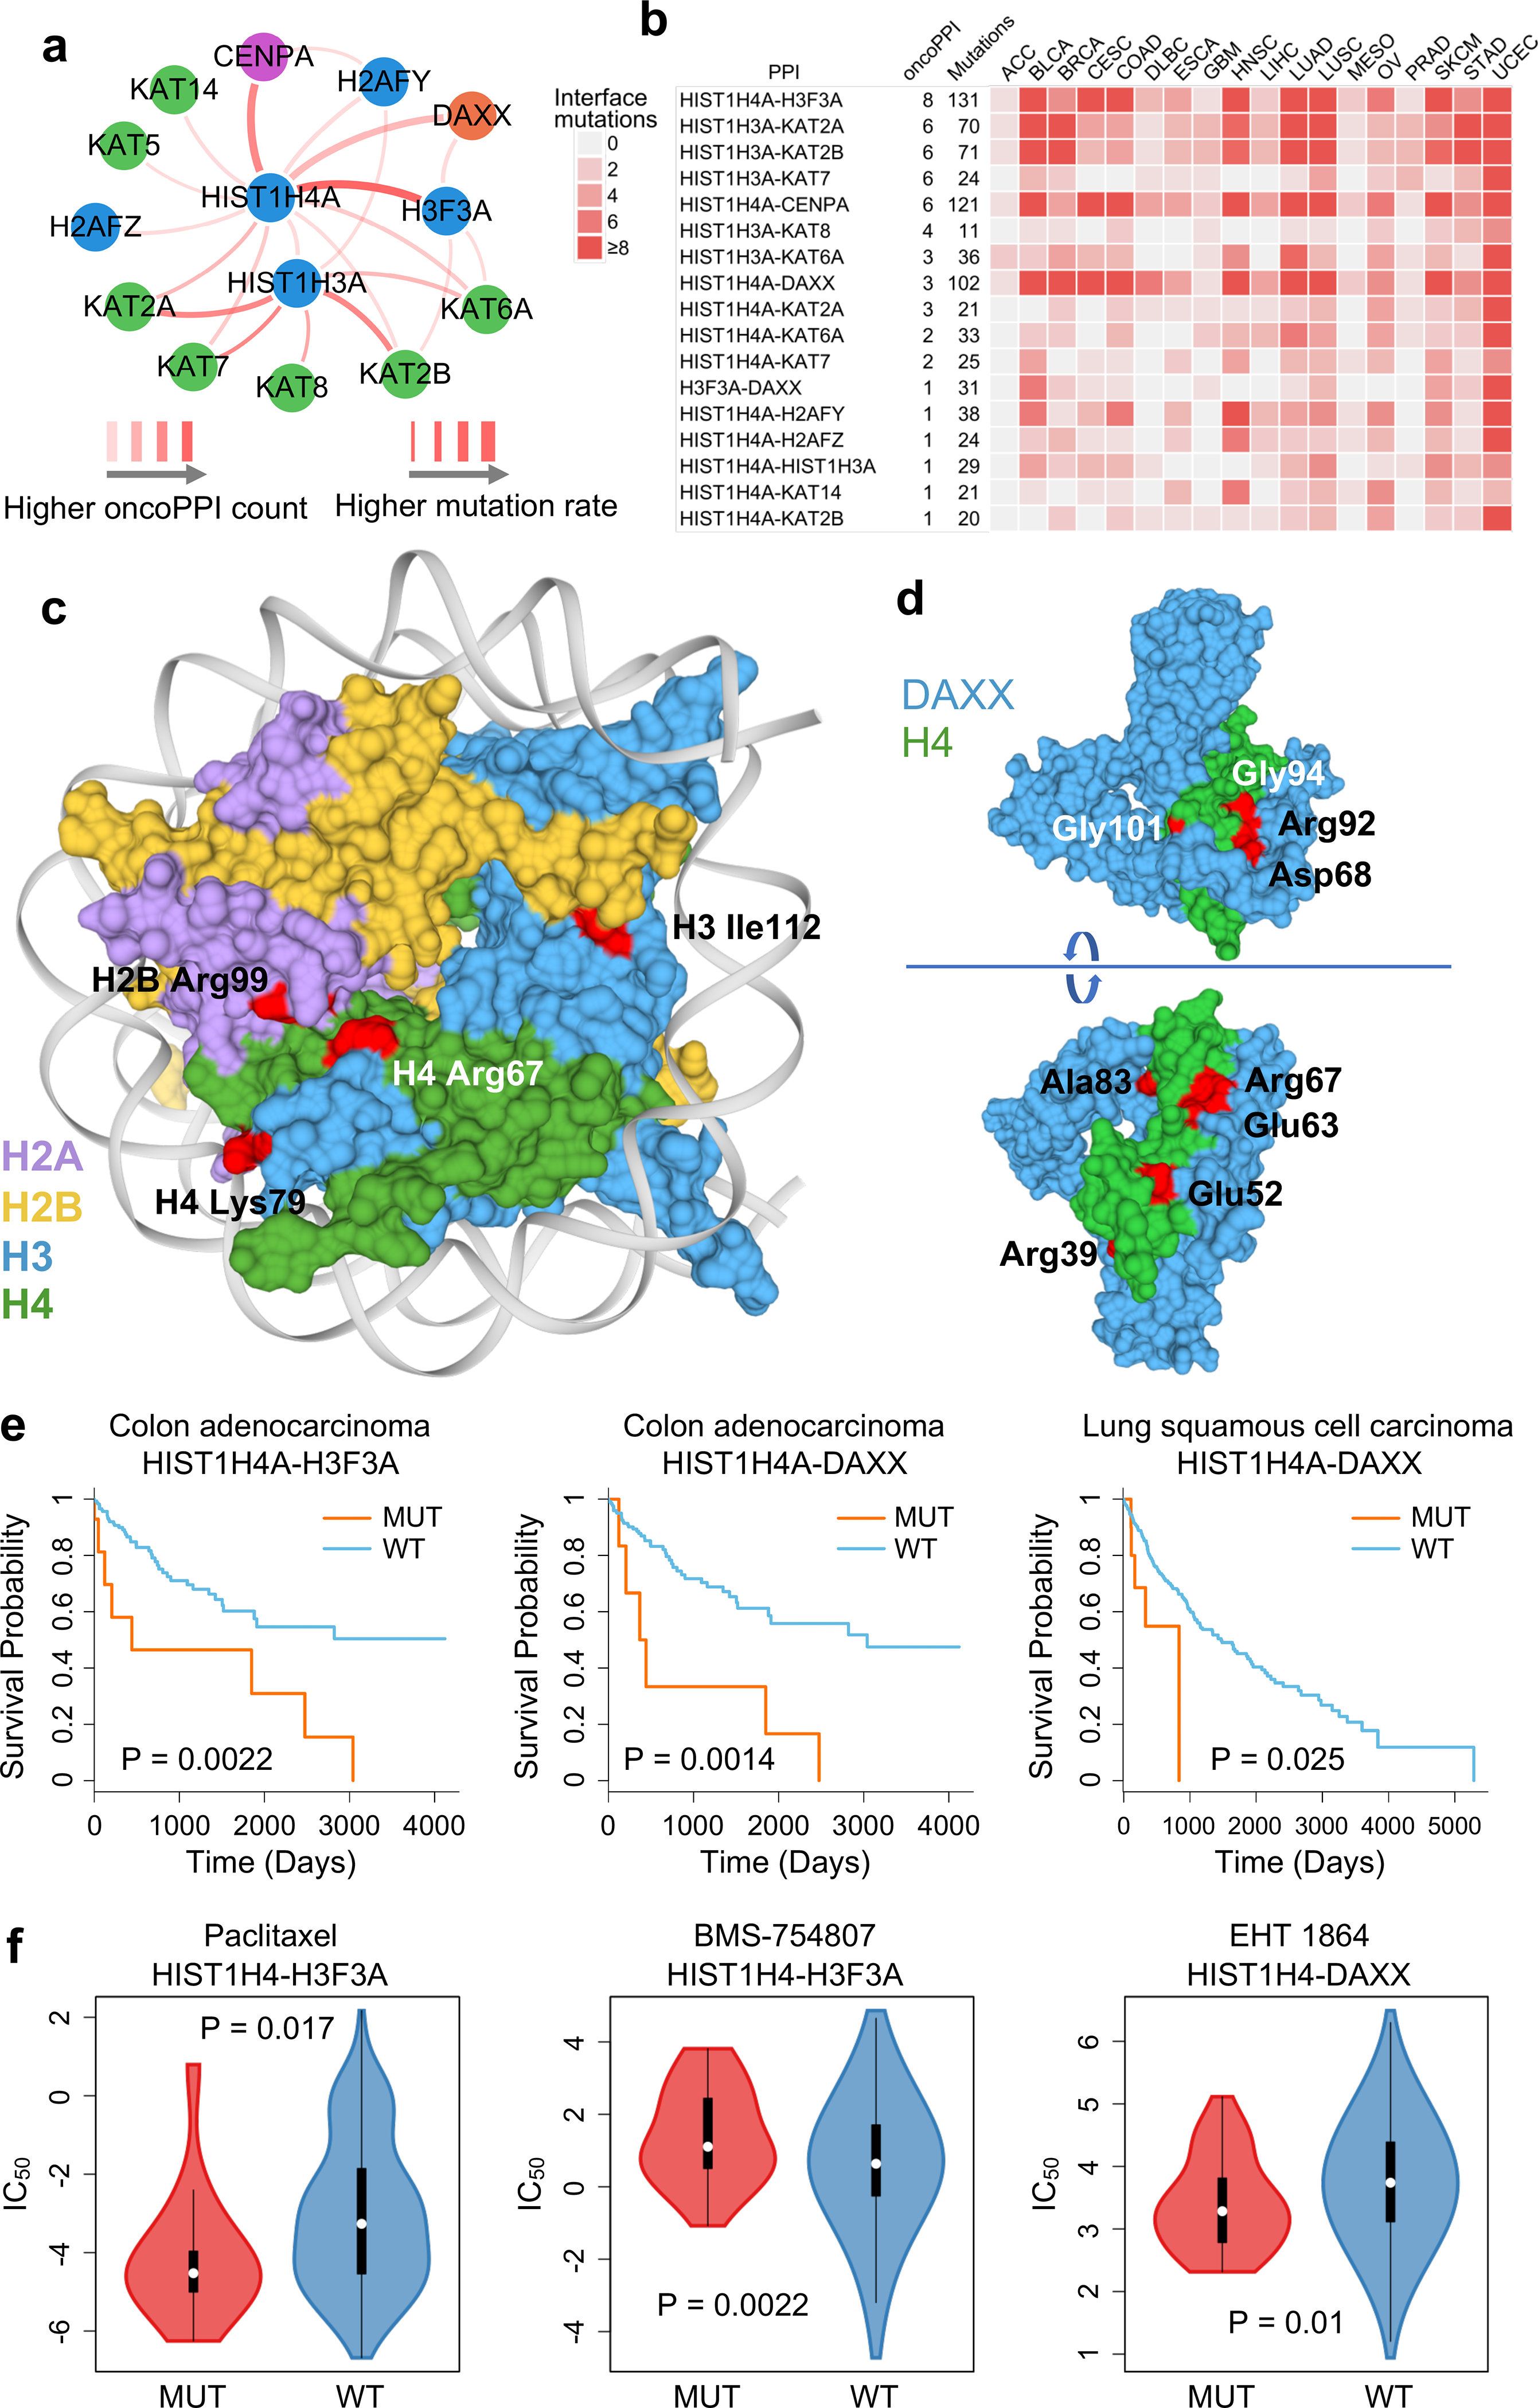
(a) A highlighted PPI-perturbing mutation network for the histone H4 complex in human cancer. (b) Somatic mutation landscape of histone H4 complex across 18 selected cancer types with the highest number of somatic mutation rate. (c) Selected PPI-perturbing mutations (highlighted by red) in histone H4 complex. (d) Interface mutations (highlighted by red) between histone H4 and DAXX. (e) Interface mutations of histone H4 complex are significantly correlated with survival in colon adenocarcinoma (COAD) and lung squamous cell carcinoma (LUSC). The p-value (P) was calculated by two-tailed Log-rank test. (f) Interface mutations of histone H4 complex are significantly correlated with anticancer drug responses, including paclitaxel (n=16 mutated cell lines; n=411 wild type cell lines), BMC-754807 (an IGF-1R inhibitor) (n=32 mutated cell lines; n=895 wild type cell lines), and EHT-1864 (a Rho inhibitor) (n=36 mutated cell lines; n=928 wild type cell lines). The p-value (P) was calculated by two-tailed ANOVA test. The data are represented as a boxplot with a underlaid violin plot where the middle line is the median, the lower and upper edges of the box are the first and third quartiles, the whiskers represent the interquartile range (IQR) ×1.5 and beyond the whiskers are outlier points.
Experimental validation of PPI-perturbing alleles
To test PPI-perturbing alleles experimentally, we selected and cloned 13 high-confidence oncoPPIs using our previously established binary interaction mapping vectors39. We selected 23 somatic missense mutations (Supplementary Table 1) across these 13 oncoPPIs for experimental validation, using subject matter expertise based on a combination of factors: (i) interface mutations with crystal structure evidence; (ii) PPI-perturbing mutations that are significantly correlated with drug response and patient survival; and (iii) mutations that affect the interaction, which can be detected by Y2H assay39.
We first tested the impact of these mutations on the corresponding 13 oncoPPIs using our well-established Y2H assay3,39. As shown in Fig. 6, among 23 tested mutations, 17 (74%) led to loss of PPIs or reduced the detected effects of PPIs, while 6 (26%) maintained the interactions predicted to be affected by the mutation (Supplementary Table 1). Our experimental results are consistent with the PPI test results of disease mutations in our previous study3, in which approximately two-thirds of disease mutations are PPI-perturbing. Importantly, this prior study did not identify the location of the mutation in the protein tertiary structure.
Fig. 6. Experimental investigation of alleles with perturbed physical protein-protein interactions.
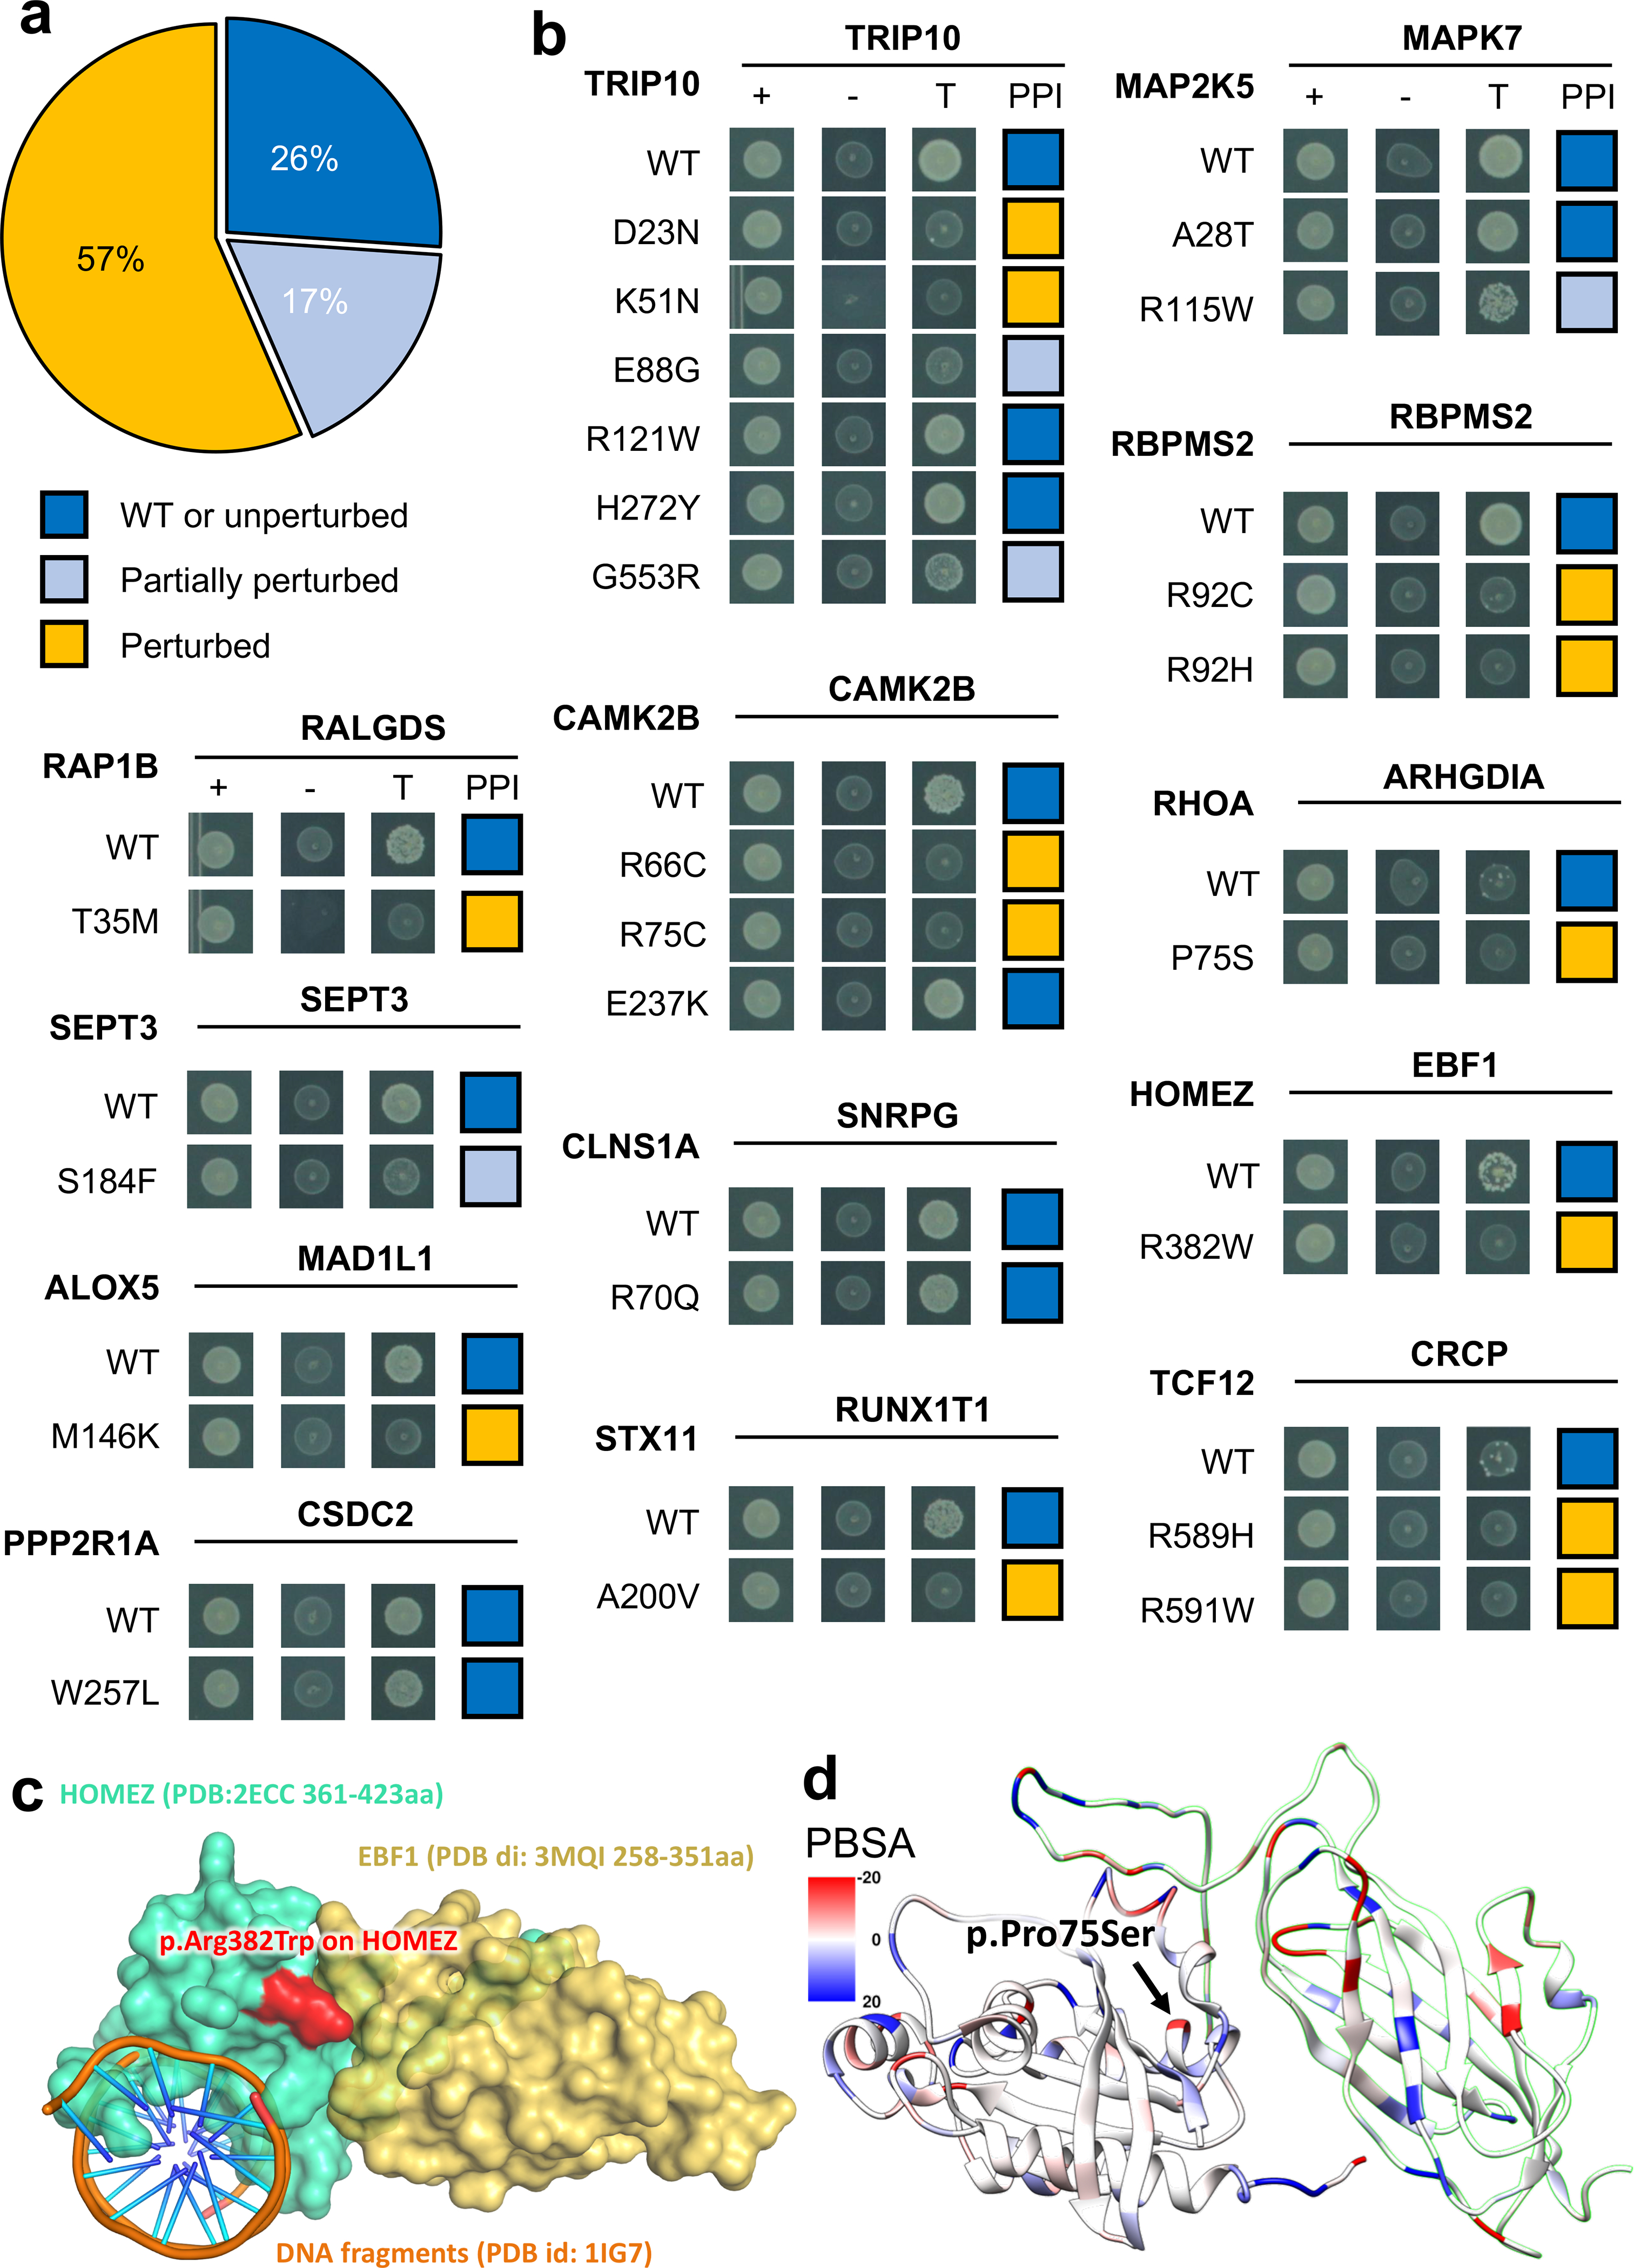
(a) Distribution of three types of mutational consequences on PPIs, unperturbed, partially perturbed, and perturbed. (b) Y2H readouts of oncoPPIs with and without mutations. “+” represents selection for existence of AD and DB plasmids that carry ORFs for PPI testing, “-” represents selection for auto-activators, “T” represents selection for PPIs. Growth indicates interaction, no growth suggests no interaction (see Methods and Supplementary Table 3). Growth indicates interaction, no growth suggests no interaction (see Methods and Supplementary Table 3). (c) HOMEZ-EBF1 complex model and the location of the interface mutation, p.Arg382Trp on HOMEZ. The complex model was built by Zdock protein docking simulation (see Supplementary Figure 18). (d) Distribution of calculated binding affinity (PBSA) of RHOA-ARHGDIA complex (PDB id: 1CC0) directed by p.Pro75Ser mutation on RHOA. Color bar indicates binding affinity (see Methods) from high (blue) to low (red). WT: wild-type.
Among the tested mutations, the p.Met146Lys mutation (Fig. 6b) in ALOX5 (arachidonate 5-lipoxygenase) disrupts its interaction with MAD1L1, a mitotic spindle assembly checkpoint protein. Both ALOX5 and MAD1L1 have been reported to be involved in tumorigenesis and/or tumor progression of several cancer types.40,41. Another example is the p.Arg382Trp mutation in HOMEZ (homeobox and leucine zipper encoding) that alters the interaction between HOMEZ and EBF1 (early B-cell factor 1). We performed Zdock protein docking analysis42 of the effect of p.Arg382Trp on the HOMEZ-EBF1 interaction (Supplementary Fig. 16). We computationally constructed the homology structure of the HOMEZ and EBF1 complex from the monomer structures of HOMEZ homeobox domain (PDB: 2ECC) and EBF1 IPT/TIG domain (PDB: 3MQI), respectively. According to the docking structure model with the best predicted score (Fig. 6c and Supplementary Fig. 16), Arg382 is located at the binding interface of the HOMEZ-EBF1, forming one salt-bridge and one hydrogen-bond with Asp285 and Asn286 in EBF1, respectively. Interestingly, p.Arg382Trp disrupts the salt-bridge and hydrogen bond and further alters surface topography due to the size and shape difference between Arg and Trp, which contribute to the binding free energy loss of the protein complex. By superimposing homeobox-DNA complex structure onto the HOMEZ-EBF1 complex model (Supplementary Fig. 16), we observe that HOMEZ contains two distinct binding interfaces of its homeobox domain that interact with DNA and EBF1 simultaneously. Although p.Arg382Trp disrupts the interaction of HOMEZ and EBF1, it may alter the protein-DNA interaction, as well.
We next focused on the RHOA-ARHGDIA interaction as it has an available co-crystal structure (Supplementary Fig. 17). In the RHOA-ARHGDIA system, the p.Pro75Ser substitution causes a shift in the secondary structure of the region. Using MM/PBSA to calculate the interaction enthalpy, we observed a difference of over 100 kJ/mol incident in the mutated protein, indicating a significant loss of interaction energy inherent in the mutation, consistent with our experimental data (Fig. 6b and 6d). RHOA is a well-known oncogene in which multiple mutations were reported to be likely pathogenic in various types of cancers, including lymphoma and adenocarcinoma43. Its interaction with ARHGDIA is important for inactivation and stabilization of RHOA. Loss of the RHOA-ARHGDIA interaction could, therefore, lead to tumor cell proliferation and metastasis.44,45 These observations suggest that p.Pro75Ser is a potential functional PPI-perturbing mutation that alters the RHOA-ARHGDIA interaction in cancer cells. In summary, our experimental assays and computational biophysical analyses identify network perturbations by PPI-perturbing mutations that can potentially lead to discovery of novel pathogenic molecular mechanisms.
Functional validation of PPI-perturbing alleles
We next turned to functional validation using two selected systems: 1) the RXRA p.Ser427Phe mutation at the RXRA-PPARG interface, and 2) the ALOX5 p.Met146Lys mutation at the ALOX5-MAD1L1 interface (Fig. 6b). RXRA is a member of the nuclear receptor superfamily and plays critical roles in pathologic processes of multiple diseases, including oncogenesis46. Our oncoPPI analysis revealed that p.Ser427Phe in RXRA plays a possible role in tumorigenesis, including pancreatic carcinogenesis (Fig. 7a). To demonstrate an oncogenic role of p.Ser427Phe in pancreatic cancer, we transfected the wild-type (WT) and p.Ser427Phe mutant RXRA into pancreatic cancer cells (Supplementary Fig. 18). We observed that p.Ser427Phe promoted tumor cell growth and clone formation in two pancreatic cancer cell lines: Capan-2 and SW1990 (Fig. 7b–7d). It has been reported that p.Ser427Phe in RXRA simulated peroxisome proliferator activated receptors (PPAR) to drive urothelial proliferation, and a PPAR-specific antagonist can block the mutant RXRA-driven cell proliferation47. To test this hypothesis, Capan-2 and SW199 cells transfected with WT or RXRA p.Ser427Phe were treated with GSK0660, a potent PPARβ/δ antagonist. As shown in Fig. 7e, p.Ser427Phe-expressing Capan-2 cells are modestly susceptible to GSK0660 (IC50= 1.11 μM) as compared to empty vector (EV, IC50=8.41 μM) or WT (IC50= 2.51 μM)-transfected cells. A similar result was also obtained using the SW1990 cell line (EV: IC50 = 6.99 μM, WT: IC50=2.84 μM and p.Ser427Phe: IC50=1.80 μM, Fig. 7e and 7f). Taken together, these data show that the RXRA-PPARG-perturbing mutation p.Ser427Phe promotes pancreatic cancer cell growth and sensitivity to PPAR antagonists.
Fig. 7. Mutants of RXRA and ALOX5 promote cancer cell growth.
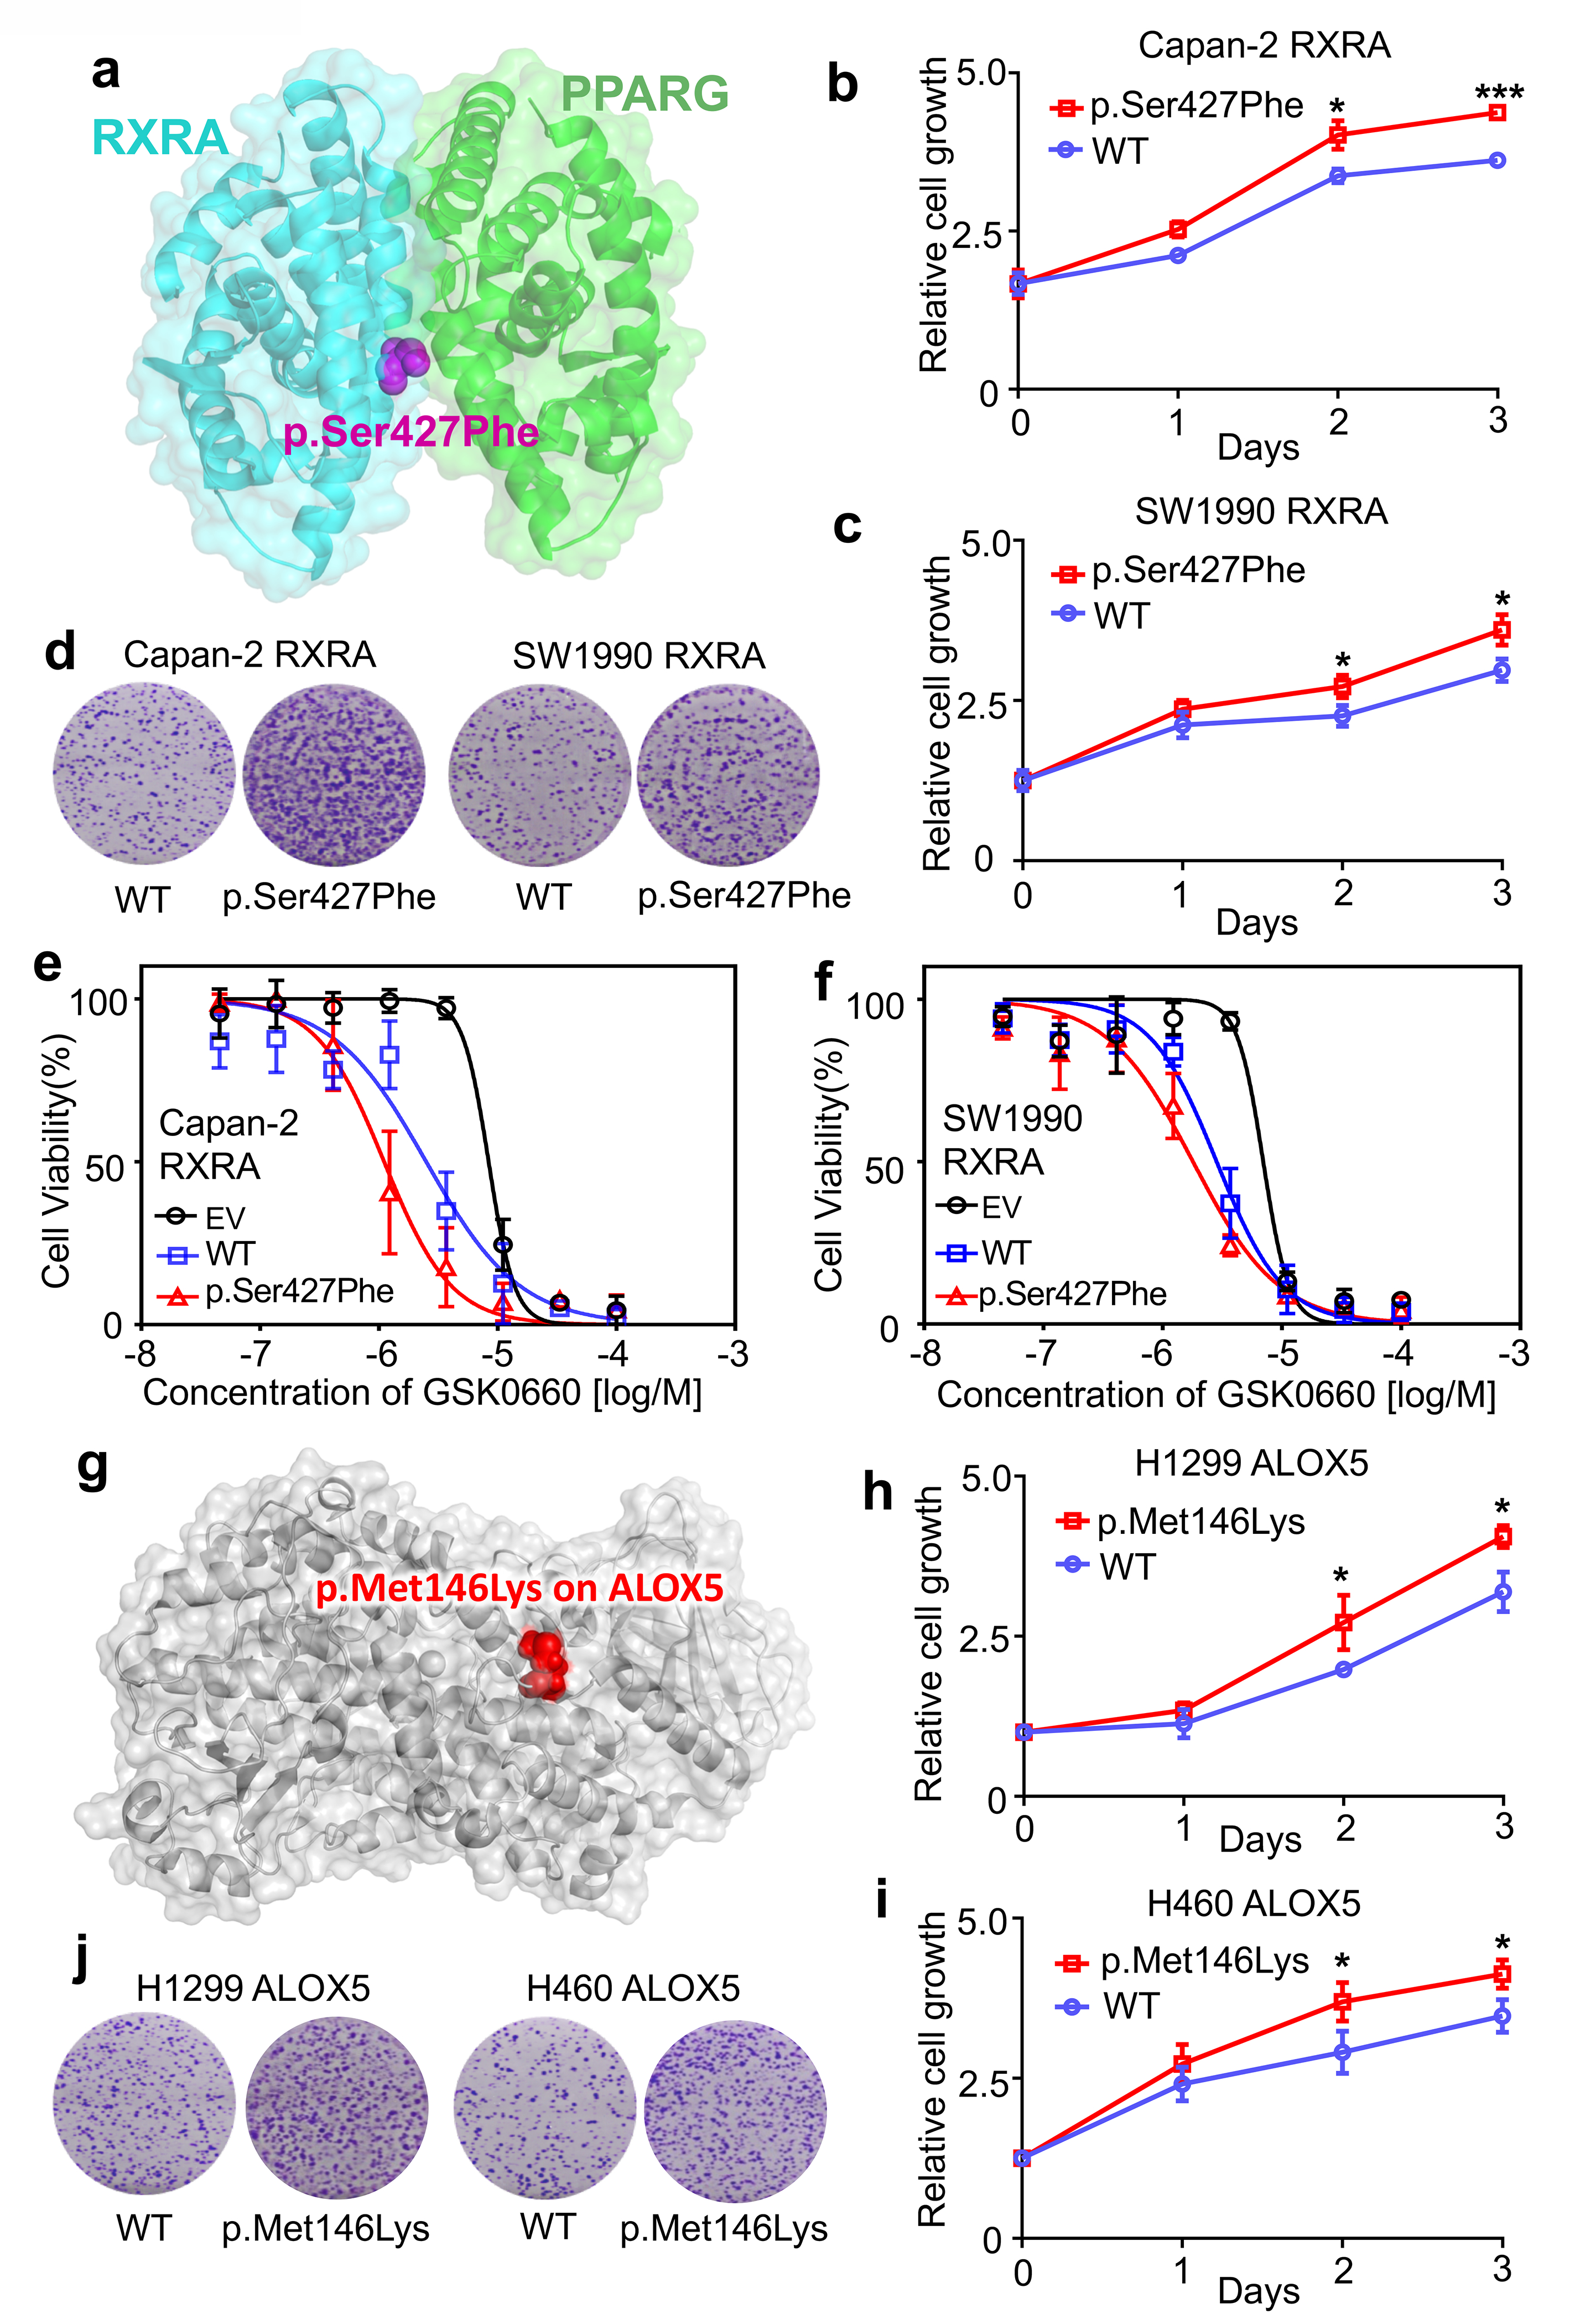
(a) The structure of RXRA and PPARG complex. (b and c) The relative cell growth of Capan-2 and SW1990 cells transfected with pCDNA3-RXRA WT or pCDNA3-RXRA p.Ser427Phe. Cell proliferation was measured by MTS assay at 24-hrs intervals up to 72 hrs. The graph presents the mean ± standard deviation (SD) derived from three independent experiments. The two-tailed Student’s t-test was used to test for statistical significance, *P<0.01, ***P<0.001. (d) For the colony formation assay, cells were maintained in normal media containing 10% FBS for 14 days, and then fixed and stained with crystal violet. (e and f) Suppression of WT and mutant RXRA-driven cell proliferation by GSK0660, a potent PPARβ/δ antagonist. Capan-2 and SW1990 cells were transfected with pCDNA3 empty vector (EV), pCDNA3-RXRA WT, or pCDNA3-RXRA p.Ser427Phe, and then treated with various concentrations of GSK0660 for 72 hrs. The graph presents the mean ± SD derived from three independent experiments. (g) An example of a perturbed allele, p.Met146Lys on ALOX5 crystal structure (PDB id: 3V98). (h and i) The relative cell growth of H1299 and H460 cells transfected with pCDNA3-ALOX5 WT or pCDNA3-ALOX5 p.Met146Lys. Cell proliferation was measured by the MTS method at 24-hrs intervals up to 72 hrs (see Online Methods). The graph presents the mean ± SD derived from three independent experiments. Student’s t-test was used to test for statistical significance, *P<0.01. (j) For the colony formation assay, cells were maintained in normal media containing 10% FBS for 14 days, and then fixed and stained with crystal violet. Error bars denote SD of three independent experiments (n = 3).
ALOX5, a key enzyme in the biosynthesis of leukotrienes48, plays roles in tumorigenesis and tumor progression49. Our Y2H assay showed that p.Met146Lys in ALOX5 (Fig. 7g) perturbed the physical interaction between ALOX5 and MAD1L1. To examine the functional role of p.Met146Lys in ALOX5 on cancer cell proliferation, we generated ALOX5 p.Met146Lys using standard site-directed mutagenesis (Supplementary Fig. 19). We next expressed WT and p.Met146Lys mutant ALOX5 in two lung cancer cell lines: H1299 and H460 (Supplementary Fig. 19). As shown in Figure 7h–7j, we found that p.Met146Lys significantly promotes cell proliferation and clone formation of H1299 and H460 cell lines. Taken together, these experiments provide proof-of-concept evidence for the functional consequences of PPI-perturbing alleles in cancer.
DISCUSSION
Previous studies have demonstrated that the human protein-protein interactome provides powerful network-based tools to quantify disease-disease6 relationships and drug-disease7–9 relationships; however, the functional network consequences of disease-associated mutations remain largely unknown. In this study, we developed a human structurally-resolved macromolecular interactome framework for comprehensive identification of PPI-perturbing alleles in human disease. We showed the widespread PPI network perturbations altered by both disease-associated germline and somatic mutations. Via a binomial statistical model, we identified 470 putative oncoPPIs harboring a statistically significant excess number of missense mutations at PPI interfaces (oncoPPIs) in pan-cancer analysis using a combination of factors, and validated the selected predictions experimentally. We demonstrated that network-predicted oncoPPIs were highly correlated with patient survival and drug resistance/sensitivity in human cancer cell lines and patient-derived xenografts as well, offering actionable prognostic markers and pharmacogenomic biomarkers for potential clinical guidance. Taken together, these findings provide network medicine-based, fundamental pathogenic molecular mechanisms, and offer potential disease-specific targets for genotype-informed therapeutic discovery.
Our systematic network strategy provides a practical approach to identifying possible, functional consequences of candidate disease alleles by perturbing PPI networks. PPI-perturbing mutations are significantly associated with poor survival rate in cancer patients, while mutations in the gene alone did not typically correlate with patient survival (Extended Data Fig. 2). PPI-perturbing mutations were significantly correlated with drug sensitivity or resistance, but mutations in a gene alone typically failed to predict drug responses (Fig. 4 and Supplementary Fig. 20). We found that the proteins involved in the oncoPPIs do not directly overlap with known drug targets (Supplementary Fig. 21). One possible explanation is that the oncoPPIs influence the downstream or upstream network-associated protein targets of these drugs. In support of this view, we found that known drug targets did overlap with the neighbors of oncoPPIs (Supplementary Fig. 21) rather than the oncoPPIs directly, supporting the network proximity analysis of drug-disease relationships in the human interactome, as we demonstrated in previous studies8,9.
We found that gene expression of oncoPPIs is unlikely to be cancer type-specific (Supplementary Fig. 22). This conclusion is consistent with our recent human interactome analysis showing no significant enrichment for PPIs between causal disease proteins and tissue-specific expressed proteins39. One possible explanation for this finding is that PPIs are more likely to be altered by somatic coding mutations that alter physical binding affinity. For example, we found that p.Met146Lys specifically perturbed the interaction between ALOX5 and MAD1L1 (Fig. 6b and Supplemental Fig. 19). Previous studies have shown low or no correlation between protein expression or activity and gene expression50. There are, of course, many factors that influence the correlation between protein expression or activities and mRNA abundance, including post-translational modification of proteins, RNA editing, and others50,51.
We acknowledge several potential limitations in the current study. Different tissue collection protocols, different sequencing approaches, and variant calling and filtering approaches from TCGA may generate the potential risk of a significant false positive rate. Although we found the same level of enrichment for mutant interface residues using both crystal structures and within the high-throughput systematic interactome identified by unbiased Y2H assays23, some potential noise in the computationally inferred PPI interfaces may exist. Although we validated wild-type PPIs in Y2H assays using the PacBio sequencing approach (see Methods), several wild-type PPI pairs (such as RHOA-ARHGDIA) showed a weak Y2H signal. Further experimental validation is, therefore, needed in the future.
We compiled a comprehensive, structurally-resolved interactome network based on our sizeable efforts. Importantly, the incompleteness of the human interactome may limit coverage for unknown disease proteins or mutations. In the future, our approach may help to directly facilitate the biological interpretation of mutations and inform disease-driven PPI allele identification in multiple ongoing and future human genome sequencing efforts, including TopMed52, PVDOMICS53, International Cancer Genome Consortium (ICGC)54, All of US55, and many others. Taken together, this work suggests that we can minimize the translational gap between genomics and clinical medicine, and provide a significant path from network medicine to precision medicine in the process. If broadly applied, this human 3D interactome network analysis framework could prioritize actionable prognostic and pharmacogenomic biomarkers for personalized treatments and offer disease allele-specific targets for genotype-informed protein-protein inhibitor discovery.
ONLINE METHODS
Building the human protein-protein interactome
To build a comprehensive human binary protein-protein interactome, we assembled three types of experimental evidence: (1) PPIs with crystal structures from the RCSB protein data bank (https://www.rcsb.org)17, (2) PPIs with homology modeling structures from Interactome3D (v2017.12, https://interactome3d.irbbarcelona.org)18, and (3) experimentally determined binary PPIs with computationally predicted interface residues from Interactome INSIDER (v2018.3, http://interactomeinsider.yulab.org)19. For crystal structures and homology models of PPIs, any residue that is at the surface of a protein (≥15% exposed surface) and whose solvent accessible surface area (SASA) decreases by ≥1.0 Å2 in complex is considered to be at the interface. In addition, we also assembled computationally predicted interfaces using the ECLAIR classifier for experimentally identified PPIs from Interactome INSIDER19. Genes were mapped to their Entrez ID based on the NCBI database (https://www.ncbi.nlm.nih.gov)56 as well as their official gene symbols based on GeneCards (http://www.genecards.org/). The resulting human binary interactome constructed in this way includes 121,575 PPIs (edges or links) connecting 15,046 unique proteins (nodes). All PPIs are experimentally validated PPIs derived from different types of experimental evidence as described in the original study19.
Collection and preparation of genome sequencing data
We downloaded the tumor-normal pairwise somatic mutation data for patients from TCGA GDC Data Portal (https://portal.gdc.cancer.gov)57 using R package TCGA-assembler (v2, http://www.compgenome.org/TCGA-Assembler/)58 for 33 cancer types/subtypes. These 33 major cancer types consist of acute myeloid leukemia (LAML), adrenocortical carcinoma (ACC), bladder urothelial carcinoma (BLCA), breast invasive carcinoma (BRCA), cervical carcinoma (CESC), cholangiocarcinoma (CHOL), colon and rectal adenocarcinoma (COAD/READ), diffuse large B cell lymphomas (DLBC), esophageal carcinoma (ESCA), glioblastoma (GBM), head and neck squamous cell carcinoma (HNSC), kidney chromophobe carcinoma (KICH), kidney renal clear cell carcinoma (KIRC), kidney papillary cell carcinoma (KIRP), low grade glioma (LGG), liver hepatocellular carcinoma (LIHC), lung adenocarcinoma (LUAD), lung squamous cell carcinoma (LUSC), mesothelioma (MESO), ovarian serous cystadenocarcinoma (OV), pancreatic ductal adenocarcinoma (PAAD), paraganglioma and pheochromocytoma (PCPG), prostate adenocarcinoma (PRAD), sarcoma (SARC), rectal adenocarcinoma (READ), skin cutaneous melanoma (SKCM), stomach adenocarcinoma (STAD), thyroid carcinoma (THCA), testicular germ cell cancer (TGCT), thymoma (THYM), uterine corpus endometrial carcinoma (UCEC), uterine carcinosarcoma (UCS), and uveal melanoma (UVM).
Disease-associated missense mutations were downloaded from HGMD (http://www.hgmd.cf.ac.uk/ac/index.php)20. Population-based missense mutations were obtained from the 1000 Genomes (https://www.internationalgenome.org)21 (phase 3, 2,504 individuals) and from ExAC database (v0.3.1, 60,706 individuals, https://gnomad.broadinstitute.org)22. We downloaded putative somatic mutations for 1,001 cancer cell lines from the Genomics of Drug Sensitivity in Cancer (GDSC, http://www.cancerrxgene.org/). The list of genomic variants found in these cell lines by whole exome sequencing was also obtained from GDSC. The sequencing variants were identified by comparison to a reference genome. The resulting variants were then filtered using the data from NHLBI GO Exome Sequencing Project and the 1000 Genomes Project to remove sequencing artefacts and germline variants59. In addition, we used ANNOVAR (https://doc-openbio.readthedocs.io/projects/annovar/en/latest/)60 to map these somatic mutations in the in order to identify the corresponding amino acid changes via RefSeq ID. The functional impact of nonsynonymous SNVs (single nucleotide variants) was measured by both SIFT61 and PolyPhen-2 scores62. For this analysis, we obtained SIFT and PolyPhen-2 scores from the ANNOVAR annotation database. We then converted RefSeq ID to UniProt ID using a UniProt ID mapping tool (http://www.uniprot.org/uploadlists/).
Significance test of PPI interface mutations
A PPI in which there is a significant enrichment in interface mutations in one or the other of the two protein binding partners across individuals will be defined as an oncoPPI. For each gene and its PPI interfaces, we assume that the observed number of mutations for a given interface follows a binomial distribution, binomial (T, pgi), in which T is the total number of mutations observed in one gene and pgi is the estimated mutation rate for the region of interest under the null hypothesis that the region was not recurrently mutated. Using length(gi) to represent the length of the protein product of gene gi, for each interface, we computed the P value – the probability of observing more than k mutations around this interface out of T total mutations observed in this gene – using the following equation:
| (1) |
in which . Finally, we set the minimal P value across all the interfaces in a specific protein as the representative P value of its coding gene gi, denoted P(gi). The significance of each PPI is defined as the product of P values of the two proteins (gene products). All P values were adjusted for multiple testing using the Bonferroni correction.
Cancer cell line annotation
We downloaded the annotation file of the cancer cell lines: molecular and drug-response data availability, microsatellite instability (MSI) status, growth properties and media, and TCGA and COSMIC tissue classification, from GDSC (http://www.cancerrxgene.org/). The details of this annotation have been described previously59.
Drug sensitivity data
Natural log half-maximal inhibitory concentration (IC50) and the area under the dose-response curve (AUC) values for all screened cell line/drug combinations were downloaded from GDSC. After applying the data preparation procedure described in a previous study 59, a total of 251 drugs tested in 1,074 cancer cell lines with 224,510 data points were used. In addition, we collected anticancer drug response data from in vivo compound screens between ~1,000 patient-derived tumor xenograft models (PDXs) and 62 treatments across six indications.30
ANOVA model
For each drug, we constructed a drug-response vector consisting of n IC50 values from treatment of n cell lines. Next, a drug-response vector was modeled as a linear combination of the tissue of origin of the cell lines, screening medium, growth properties, and the status of a genomic feature:
| (2) |
where Mut is mutations and MSI is microsatellite instability (including small indels)
In this study, considering the data sparsity, we only performed pan-cancer analysis. A genomic feature-drug pair was tested only if the final drug-response vector contained at least 3 positive cell lines and at least 3 negative cell lines. The effect size was quantified through Cohen’s statistic using the difference between two means divided by a pooled standard deviation for the data. The resulting P-values were corrected by the Benjamini-Hochberg method63. All statistical analyses were performed using the R package (v3.2.3, http://www.r-project.org/) and two-tailed tests.
Pathway enrichment analysis
We used ClueGO64 for enrichment analysis of genes in the canonical KEGG pathways. A hypergeometric test was performed to estimate statistical significances, and all P values were adjusted for multiple testing using the Bonferroni correction (adjusted P values).
Cloning of disease mutations
We generated the predicted disease mutants by implementing a site-directed mutagenesis pipeline as described below. For each mutation, two “primary PCRs” were performed to generate DNA fragments containing the mutation and a “stitch PCR” was performed to fuse the two fragments to obtain the mutated ORF. For the primary PCRs, two universal primers (E2E forward and E2E reverse) and two ORF-specific internal forwards and reverse primers were used. The two ORF-specific primers contained the desired nucleotide change. The fragments generated by the primary PCRs were fused together by the stitch PCR using the universal primers to generate the mutated ORF. The final product was a full length ORF containing the mutation of interest. All of the mutated ORFs were cloned into a Gateway donor vector, pDONR223, by BP reaction followed by bacterial transformation and selection using spectinomycin. Two single colonies were picked for each transformant. All picked colonies were transferred into pDEST-AD and pDEST-DB by LR reaction followed by bacterial transformation and selection using ampicillin. The plasmids were then extracted, purified, and transformed into Y8930 yeast strain for the pairwise testing.
Pairwise test to identify perturbed interactions
The pairwise test was performed in 96 well format. The ORFs were inoculated in SC-Leu and SC-Trp media overnight and mated in YEPD media the following day. All WT and mutant alleles in pDEST-DB were mated with their interacting partner in pDEST-AD (DB-ORFxAD-ORF) as well as pDEST-AD without the ORF inserted (DB-ORFxAD-empty). After incubation at 30ºC overnight, mated yeasts were transferred into SC-Leu-Trp media to select for diploids. The following day, the diploid yeasts were spotted on SC-Leu-Trp-His+1mM 3AT and SC-Leu-Trp media to control for mating success.
After 3 days of growth at 30ºC, each spot on plates was scored with a growth score ranging from 0 to 4, 0 being no growth, 1 being one or two colonies, 2 being some colonies, 3 being many colonies, 4 being a large consolidated spot in which no individual colonies can be distinguished. Pairs for which the SC-Leu-Trp spot was scored as 3 or 4 and the 3AT spot were valid (yeasts were spotted and no contamination or other experimental failure) were considered as successfully tested. A successfully tested pair can be further classified as positive, negative, or auto-activator and depends on the growth scores of DB-ORFxAD-ORF and DB-ORF-AD-empty on SC-Leu-Trp-His+1mM 3AT plates. If growth score of DB-ORFxAD-ORF = 0, the pair was classified as negative; if growth score of DB-ORFxAD-ORF - DB-ORFxAD-empty ≥ 2, the pair was classified as positive (Supplementary Table 3); otherwise the pair was classified as auto-activator. Pairs were scored blindly with respect to their identity using in-house software.
In parallel, we made lysates of all SC-Leu-Trp plates to perform duplex PCR using barcoded AD/DB and Term primers followed by pooling and sequencing with the PacBio Sequel system. We used SMRT tools (v5.1.0) and ISO-SEQ (v3.1) software packages to analyze raw sequencing results. The pipeline includes five main steps to obtain high-quality sequences; 1) generating circular consensus (CCS) reads, 2) demultiplexing and primer removal, 3) classifying full-length CCS reads, 4) clustering full-length non-chimeric (FLNC) reads, and, finally, 5) polishing cluster sequences. Polished sequences were then aligned to the ORF sequences using BLAST. Colonies with the exact full-length sequence as expected (with, and only with, the expected mutations, fully covered by polished reads) were considered as sequence-confirmed.
Only pairs that were successfully tested, classified as positive or negative, for which the wild-type allele was classified as positive with a growth score ≥ 2, and that were sequence-confirmed were considered for all further analysis. An interaction was considered perturbed by an allele if the growth score of the allele was ≤ 1 and the growth score was smaller than the growth score of the corresponding wild-type pair by at least two. Otherwise, an interaction was considered partially perturbed by an allele if the growth score of the wild-type pair was greater than the growth score for that interaction with the respective allele by one.
System construction for molecular simulation
Crystal structures (PDBs: 1CC0 and 3M0C) were accessed from the RCSB PDB protein data bank. Co-crystalized ions were retained from the structure. Non-terminal missing loops were reconstructed using Modeller9.18 within UCSF Chimera where required. Protonation states for charged residues were determined using PROPKA 2.0. Mutations and preparation of the system for molecular dynamics simulation were accomplished using the quick MD simulator module of CHARMM-GUI. Following a processing step, including adding hydrogens and patching the terminal regions, a water box using TIP3 water molecules with edges at least 12 Å from the protein was added. The system was neutralized to a NaCl concentration of 150 mM.
Simulation parameters
Molecular dynamics simulations were carried out using GROMACS (v2018.2)7 on the Pitzer computing cluster at the Ohio Supercomputer Center. Initial minimizations of the systems were carried out using steepest descent until the energy of the system reached machine precision. Following minimization, an NVT equilibration step with positional restraints of 400 kJ mol−1 nm−2 on backbone atoms and 40 kJ mol−1 nm−2 on side chain atoms was run using a timestep of 2 fs for 500 000 steps, yielding 1 ns of equilibration. Finally, NPT dynamics were run with no positional restraints for 400 ns using the same 2 fs timestep from equilibration, after which the system was determined by its root-mean-squared deviation (RMSD) to be reasonably well equilibrated.
Hydrogen atoms were constrained using the a LINear Constraint Solver (LINCS) algorithm implemented in GROMACS (v2018.2)7. Temperature coupling to 310.15° K was done separately for the protein and the water/ions using a Nose-Hoover thermostat and a 1 ps coupling constant. For the NPT dynamics simulation, isotropic pressure coupling to 1 bar was done using a Parrinello-Rahman barostat with a coupling constant of 5.0 ps and compressibility of 4.5e-05 bar−1. The pair-list cutoff was constructed using the Verlet scheme, updated every 20 evaluations with a cutoff distance of 12 Å. Particle mesh Ewald (PME) electrostatics were chosen to describe coulombic interactions using the same cutoff as in the pair-list. Van der Waals forces were smoothly switched to zero between 10 and 12 Å using a force-switch modifier to the cut-off scheme.
Post-processing and RMSD plots were generated using standard GROMACS tools. MM/PBSA energies were calculated on 1,001 frames over the final 100 ns of each simulation using g_mmpbsa, which uses APBS to determine the polar and non-polar contributions to the binding energy. Briefly, the binding free energy can be expressed as
| (3) |
where complex refers to the protein-protein complex, and protein 1 and protein 2 the respective proteins in the complex. The individual free energies for each component above are determined by
| (4) |
where is the vacuum molecular mechanics energy, the solvation energy, and TS the entropic contribution. Entropic contributions were not included owing to computational cost and evidence that the inclusion of the entropy term does not always improve the accuracy of the calculations. The molecular mechanics energy and solvation energy can be further broken down into their component energies:
| (5) |
| (6) |
Here, Ebonded is zero, since we have used the single trajectory approach. EvdW and Eelec are the van der Waals and electrostatic contributions to the vacuum binding, respectively, while Gpolar and Gnonpolar are the electrostatic and non-electrostatic contributions to the solvation energy.
Expression vector construction
pCDNA3-RXRA was generated using standard molecular cloning methods. pcDNA3-ALOX5 was kindly provided by Prof. Colin D. Funk (Department of Biochemistry, Queen’s University, Canada). Site-directed mutagenesis were performed using the KOD-Plus-Mutagenesis Kit (TOKOYO, Cat. SMK-101) according to the manufacturer’s instructions. RXRA p.Ser427Phe and ALOX5 p.Met146Lys were generated from the vectors, pCDNA3-RXRA and pcDNA3-ALOX5, respectively. All of the generated plasmids were confirmed by Sanger sequencing.
Cell culture and transfection
Human cancer cell lines (Capan-2, SW1990, H1299 and H460) were obtained from American Type Culture Collection (ATCC). All cells were cultured in Dulbecco’s Modified Eagle’s Medium (DMEM, Gibco, Cat. 11995040) supplemented with 10% Fetal Bovine Serum (FBS, Gibco, Cat. 10099–141) and maintained under an atmosphere containing 5% CO2 at 37 °C. All cell lines were negative for mycoplasma. Pancreatic cancer cell lines (Capan-2 and SW1990) were transfected with empty vector (EV), pcDNA3-RXRA WT, or pcDNA3-RXRA p.Ser427Phe, and lung cancer cell lines (H1299 and H460) were transfected with EV, pcDNA3-ALOX5 WT, or pcDNA3-ALOX5 p.Met146Lys using Lipofectamine 2000 (Invitrogen, Cat.11668019).
Cell proliferation assay
Cell viability was determined by using CellTiter 96® AQueous Non-Radioactive Cell Proliferation Assay (MTS, Promega, Cat. G5421) according to manufacturer’s recommendation. In brief, treated cancer cells were seed into 96-well plates at a density of 3,000–5,000 cells/well and incubated for the indicated time. Next, 20 μl/well of combined MTS/PMS solution were added and the absorbance was recorded at 490 nm using a microplate reader Synergy 2 (BioTek, Winooski, VT, USA).
Western blotting
Cells were lysed with RIPA lysis buffer (20 mM Tris-HCl, 37 mM NaCl2, 2 mM EDTA, 1% Triton-X, 10% glycerol, 0.1% SDS, and 0.5% sodium deoxycholate) with protease and phosphatase inhibitors (Roche). Protein samples were quantified (Pierce BCA Protein Assay Kit, Thermo Fisher Scientific), subjected to SDS-PAGE and transferred to PVDF membranes. Membranes were incubated with primary antibodies, including RXRA (1:1000, Proteintech, Cat. 21218–1-AP) and ALOX5 (1:1000, Abclonal, Cat. A2877), and subsequent secondary antibody: HRP-conjugated Affinipure Goat Anti-Rabbit IgG(H+L) (1:3000, Proteintech, Cat. SA00001–2).
Colony formation assay
Transfected cells were seeded into six-well plates at a density of 3,000 cells per well in 2 ml of DMEM medium supplemented with 10% FBS. The medium was replaced every 3 days. After 14 days, viable colonies were fixed in 4% paraformaldehyde and stained with 0.1% crystal violet at room temperature. Formed colonies were photographed with an inverted fluorescence microscope (Olympus).
Data availability
All mapping interface mutations, network-predicted oncoPPIs across pan-cancer and 33 individual cancer types, the human protein-protein interactome, and predicted drug responses and patient survival analysis are freely available at the website: https://mutanome.lerner.ccf.org/ and https://github.com/ChengF-Lab/oncoPPIs. Publicly available databases used in the present study include the RCSB protein data bank (https://www.rcsb.org), Interactome3D (v2017.12, https://interactome3d.irbbarcelona.org), Interactome INSIDER (v2018.3, http://interactomeinsider.yulab.org), GeneCards (http://www.genecards.org/), NCBI (https://www.ncbi.nlm.nih.gov), TCGA GDC Data Portal (https://portal.gdc.cancer.gov), HGMD (http://www.hgmd.cf.ac.uk/ac/index.php), 1000 Genomes (phase 3, 2,504 individuals, https://www.internationalgenome.org), ExAC database (v0.3.1, 60,706 individuals, https://gnomad.broadinstitute.org), GDSC (http://www.cancerrxgene.org/).
Code availability
All codes written for and used in this study are available from https://github.com/ChengF-Lab/oncoPPIs.
Extended Data
Extended Data Fig. 1.
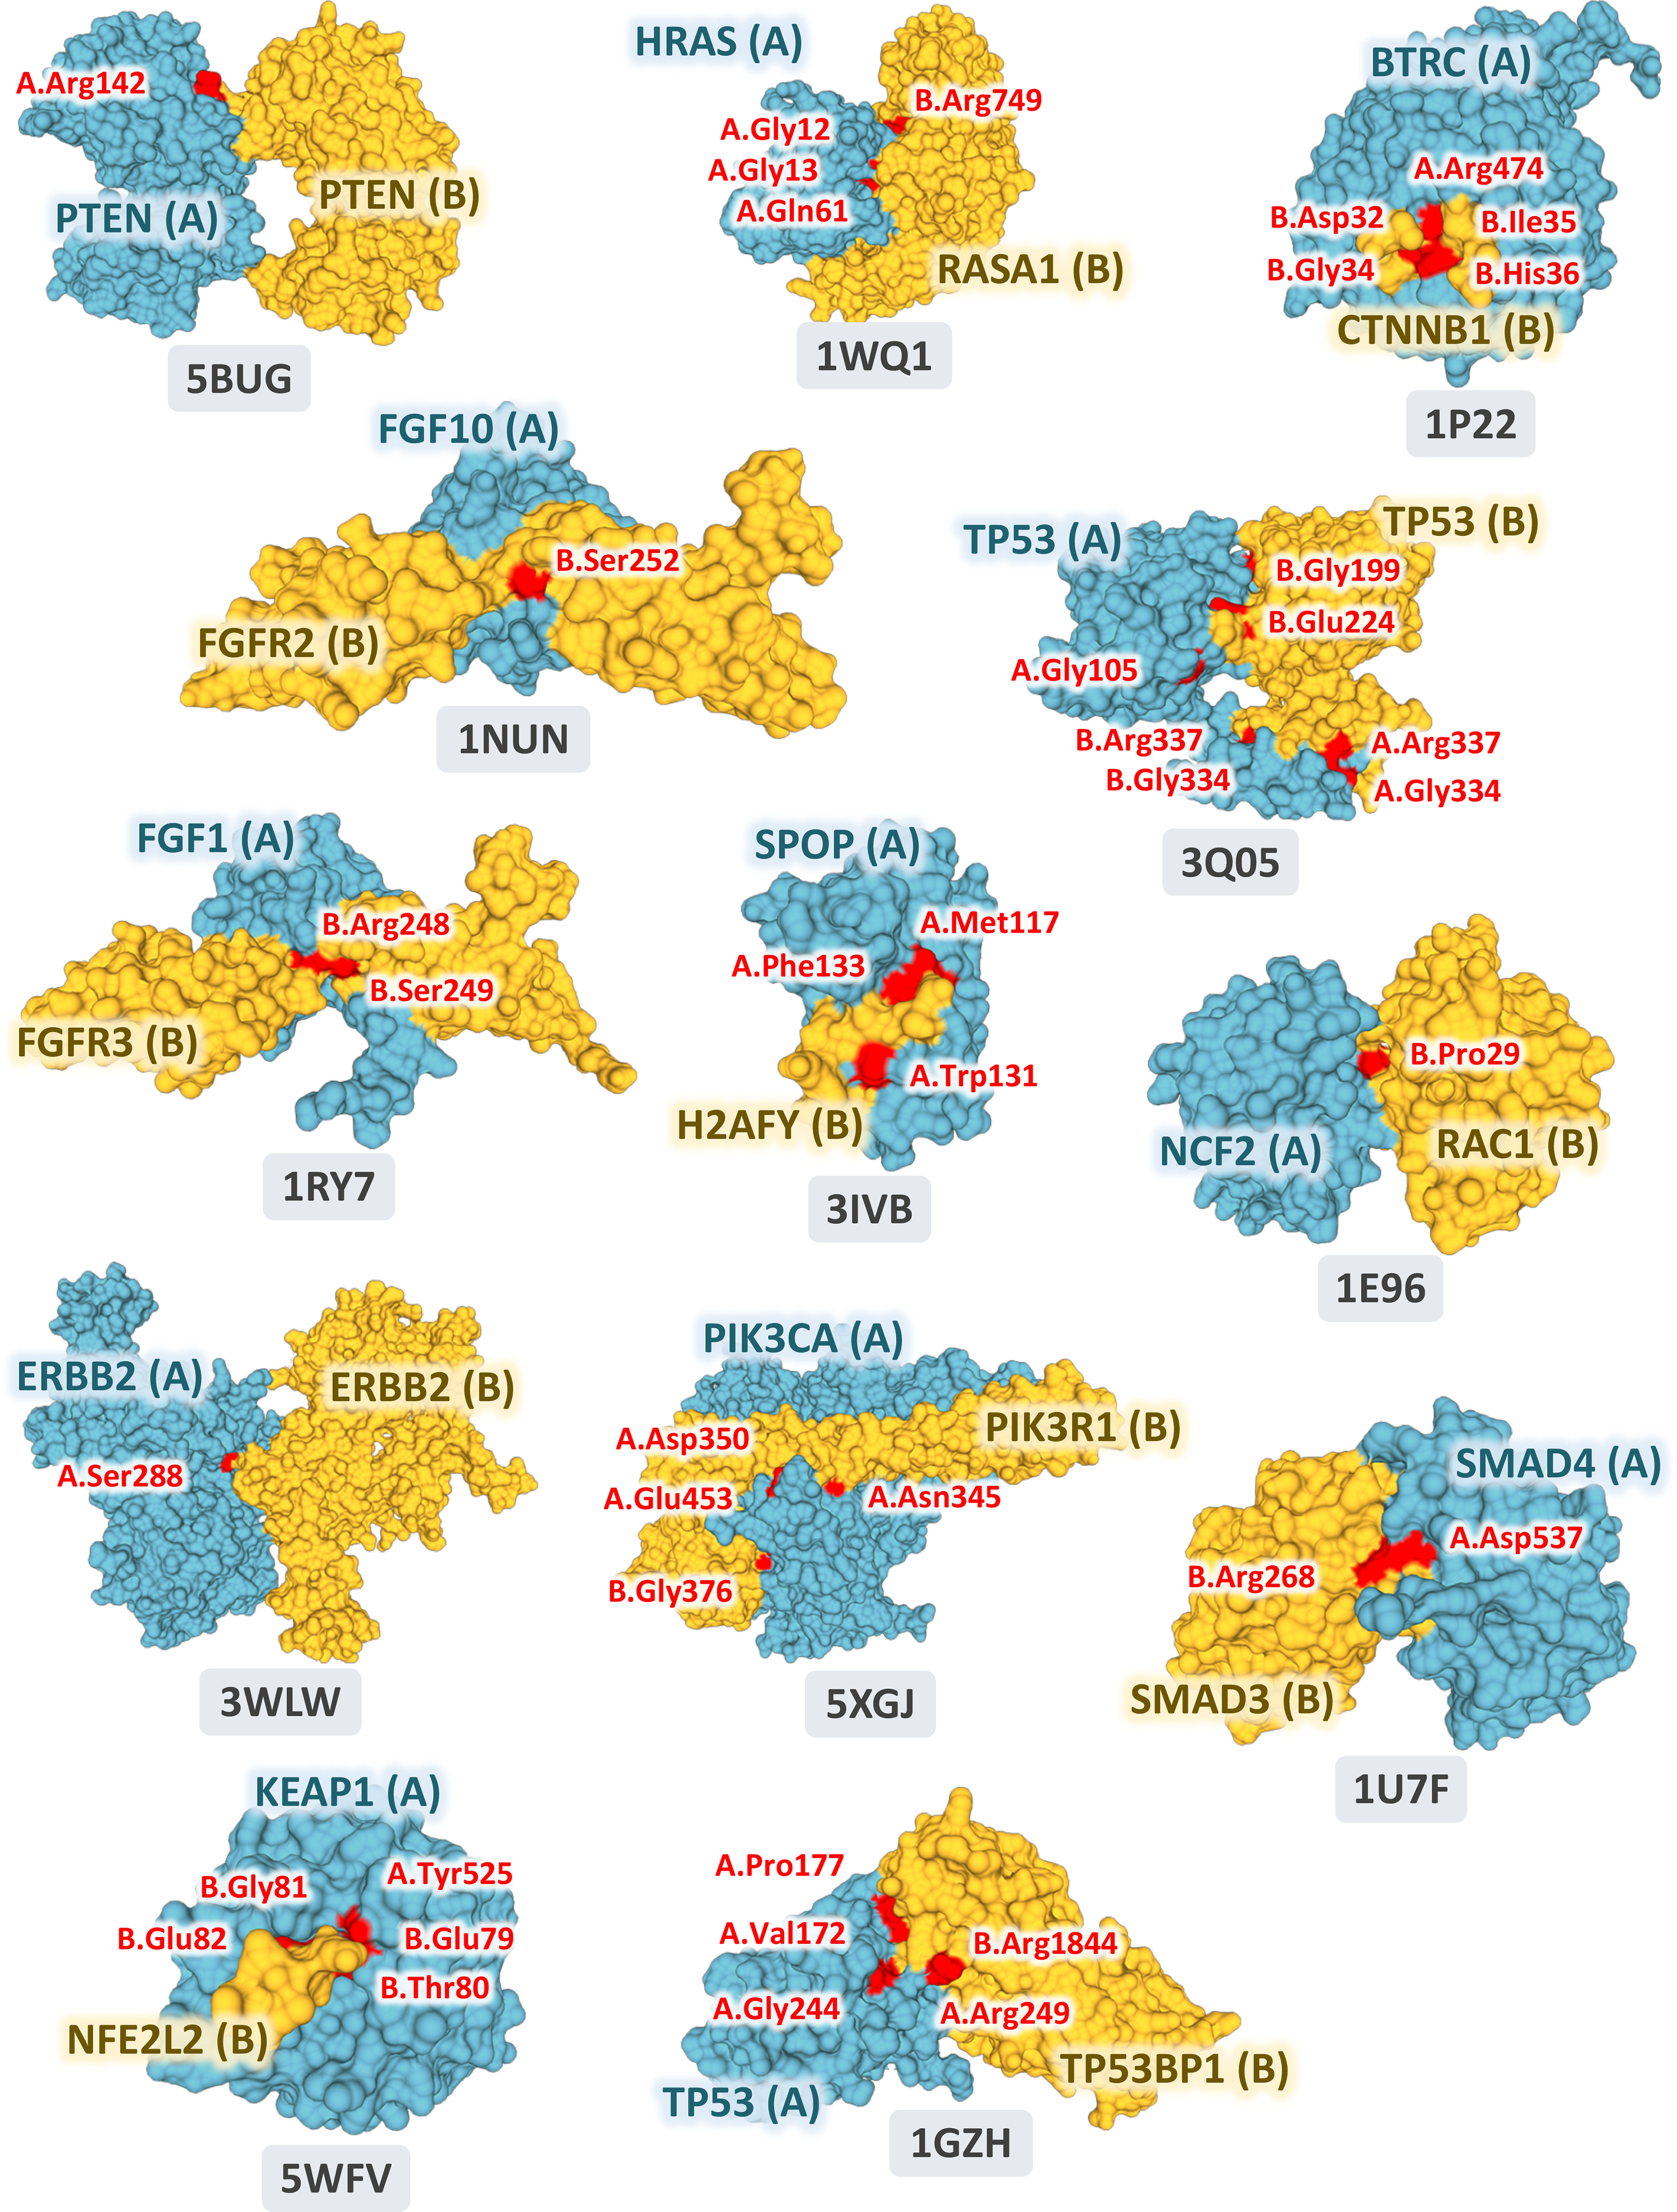
The 13 selected pan-cancer oncoPPIs with crystal structure-based PPI interface mutations. The images were prepared by PyMOL (https://pymol.org/2/) using the Protein Data Bank (PDB) IDs (highlighted in figures) downloaded from PDB database (https://www.rcsb.org). Structural views of all oncoPPIs in pan-cancer and individual cancer types/subtypes are freely available: https://mutanome.lerner.ccf.org/.
Extended Data Fig. 2.
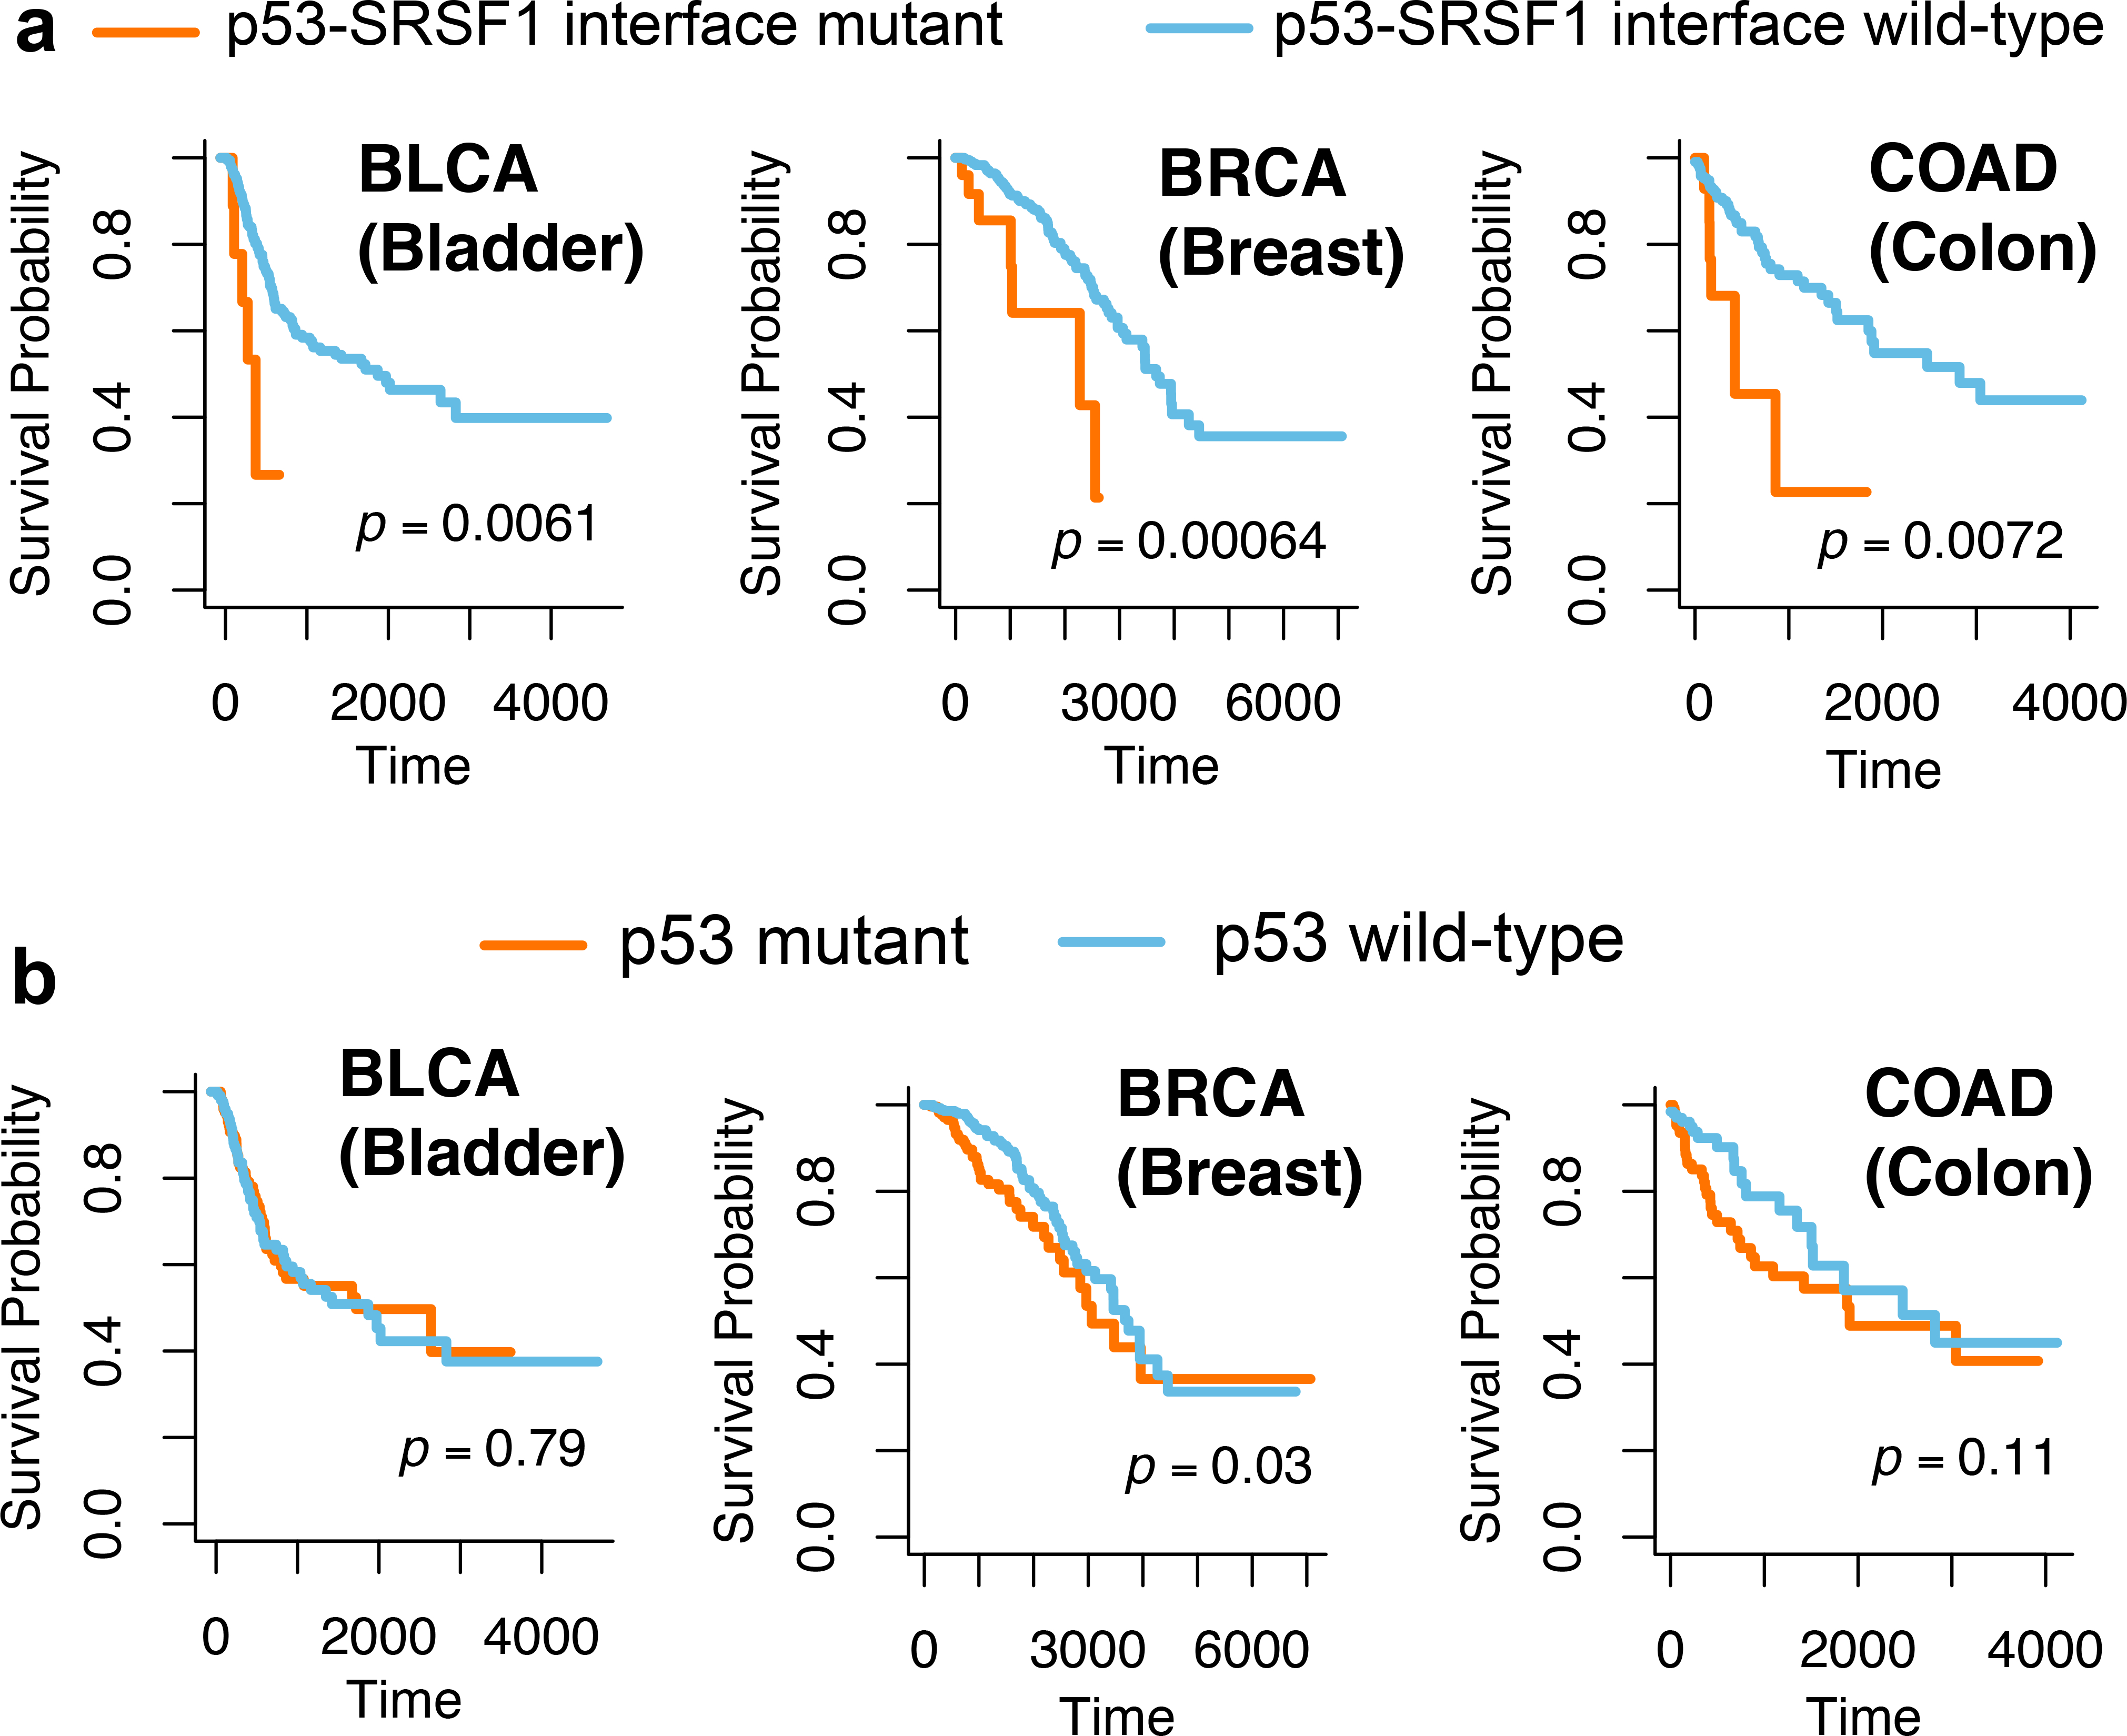
Survival analyses of p53-SRSF1 PPI perturbing-mutations and p53 mutations alone. Three exemplary cancer types, including bladder urothelial carcinoma (BLCA), breast invasive carcinoma (BRCA), and colon adenocarcinoma (COAD), are illustrated. Survival analyses of p53-SRSF1 PPI perturbing-mutations across other cancer types/subtypes are provided in Supplementary Fig. 14. The p-value (P) was computed by log-rank test. All oncoPPI-predicted survival analyses for 33 cancer types/subtypes are freely available at the following website: https://mutanome.lerner.ccf.org/.
Supplementary Material
Acknowledgements
We thank Stephanie Tribuna for expert technical assistance. A portion of this work was performed under the auspices of the U.S. Department of Energy by Lawrence Livermore National Laboratory under Contract DE-AC52-07NA27344 (Release number LLNL-JRNL-797982).
This work was supported by the National Institutes of Health (NIH) grants K99 HL138272, R00 HL138272, 3R01AG066707-01S1, and R01AG066707 to F.C. This work was also supported in part by NIH grants U01 HG007690, P50 GM107618, and U54 HL119145 to J.L., as well as AHA grants D700382 and CV-19 to J.L. F.C.L. was supported by AHA CRADA TC02274.0. C.E. is the Sondra J. and Stephen R. Hardis Endowed Chair in Cancer Genomic Medicine at the Cleveland Clinic, and an ACS Clinical Research Professor. M.V. and D.E.H supported by NIH grants P50 HG004233 and U41 HG001715 from NHGRI. This work has been also supported in part by the VeloSano Pilot Program (Cleveland Clinic Taussig Cancer Institute) to F.C.
Footnotes
Competing interests.
J. Loscalzo is the scientific co-founder of Scipher Medicine, Inc., a start-up company that uses network medicine to identify biomarkers for disease and specific pathway targets for drug development. M. Vidal is a shareholder and scientific advisor of seqWell, Inc. and founder and scientific advisor of Gloucester Marine Genomics Institute, Inc. The other authors have declared that no relevant conflicts of interest exist.
Additional Information
Supplementary information is available in the online version of the paper
References
- 1.Bailey MH et al. Comprehensive characterization of cancer driver genes and mutations. Cell 173, 371–385 (2018). [DOI] [PMC free article] [PubMed] [Google Scholar]
- 2.Cheng F, Liang H, Butte AJ, Eng C & Nussinov R Personal mutanomes meet modern oncology drug discovery and precision health. Pharmacol. Rev 71, 1–19 (2019). [DOI] [PMC free article] [PubMed] [Google Scholar]
- 3.Sahni N et al. Widespread macromolecular interaction perturbations in human genetic disorders. Cell 161, 647–660 (2015). [DOI] [PMC free article] [PubMed] [Google Scholar]
- 4.Ng PK et al. Systematic Functional Annotation of Somatic Mutations in Cancer. Cancer Cell 33, 450–462 e410 (2018). [DOI] [PMC free article] [PubMed] [Google Scholar]
- 5.Chen S et al. An interactome perturbation framework prioritizes damaging missense mutations for developmental disorders. Nat. Genet 50, 1032–1040 (2018). [DOI] [PMC free article] [PubMed] [Google Scholar]
- 6.Menche J et al. Disease networks. Uncovering disease-disease relationships through the incomplete interactome. Science 347, 1257601 (2015). [DOI] [PMC free article] [PubMed] [Google Scholar]
- 7.Cheng F et al. Network-based approach to prediction and population-based validation of in silico drug repurposing. Nat. Commun 9, 2691 (2018). [DOI] [PMC free article] [PubMed] [Google Scholar]
- 8.Cheng F, Kovacs IA & Barabasi AL Network-based prediction of drug combinations. Nat. Commun 10, 1197 (2019). [DOI] [PMC free article] [PubMed] [Google Scholar]
- 9.Cheng F et al. A genome-wide positioning systems network algorithm for in silico drug repurposing. Nat. Commun 10, 3476 (2019). [DOI] [PMC free article] [PubMed] [Google Scholar]
- 10.Porta-Pardo E, Garcia-Alonso L, Hrabe T, Dopazo J & Godzik A A pan-cancer catalogue of cancer driver protein interaction interfaces. PLoS Comput. Biol 11, e1004518 (2015). [DOI] [PMC free article] [PubMed] [Google Scholar]
- 11.Gao J et al. 3D clusters of somatic mutations in cancer reveal numerous rare mutations as functional targets. Genome Med. 9, 4 (2017). [DOI] [PMC free article] [PubMed] [Google Scholar]
- 12.Niu B et al. Protein-structure-guided discovery of functional mutations across 19 cancer types. Nat. Genet 48, 827–837 (2016). [DOI] [PMC free article] [PubMed] [Google Scholar]
- 13.Tokheim C et al. Exome-scale discovery of hotspot mutation regions in human cancer using 3D protein structure. Cancer Res. 76, 3719–3731 (2016). [DOI] [PMC free article] [PubMed] [Google Scholar]
- 14.Kamburov A et al. Comprehensive assessment of cancer missense mutation clustering in protein structures. Proc. Natl. Acad. Sci. USA 112, E5486–5495 (2015). [DOI] [PMC free article] [PubMed] [Google Scholar]
- 15.Mosca R et al. dSysMap: exploring the edgetic role of disease mutations. Nat. Methods 12, 167–168 (2015). [DOI] [PubMed] [Google Scholar]
- 16.Wang X et al. Three-dimensional reconstruction of protein networks provides insight into human genetic disease. Nat. Biotechnol 30, 159–164 (2012). [DOI] [PMC free article] [PubMed] [Google Scholar]
- 17.Rose PW et al. The RCSB protein data bank: integrative view of protein, gene and 3D structural information. Nucleic Acids Res. 45, D271–D281 (2017). [DOI] [PMC free article] [PubMed] [Google Scholar]
- 18.Mosca R, Ceol A & Aloy P Interactome3D: adding structural details to protein networks. Nat. Methods 10, 47–53 (2013). [DOI] [PubMed] [Google Scholar]
- 19.Meyer MJ et al. Interactome INSIDER: a structural interactome browser for genomic studies. Nat. Methods 15, 107–114 (2018). [DOI] [PMC free article] [PubMed] [Google Scholar]
- 20.Stenson PD et al. The Human Gene Mutation Database: towards a comprehensive repository of inherited mutation data for medical research, genetic diagnosis and next-generation sequencing studies. Hum. Genet 136, 665–677 (2017). [DOI] [PMC free article] [PubMed] [Google Scholar]
- 21.Genomes Project C et al. A global reference for human genetic variation. Nature 526, 68–74 (2015). [DOI] [PMC free article] [PubMed] [Google Scholar]
- 22.Lek M et al. Analysis of protein-coding genetic variation in 60,706 humans. Nature 536, 285–291 (2016). [DOI] [PMC free article] [PubMed] [Google Scholar]
- 23.Rolland T et al. A proteome-scale map of the human interactome network. Cell 159, 1212–1226 (2014). [DOI] [PMC free article] [PubMed] [Google Scholar]
- 24.Mullard A Nine paths to PCSK9 inhibition. Nat. Rev. Drug Discov 16, 299–301 (2017). [DOI] [PubMed] [Google Scholar]
- 25.Pandit S et al. Functional analysis of sites within PCSK9 responsible for hypercholesterolemia. J. Lipid Res 49, 1333–1343 (2008). [DOI] [PubMed] [Google Scholar]
- 26.Diedrich B et al. Discrete cytosolic macromolecular BRAF complexes exhibit distinct activities and composition. EMBO J. 36, 646–663 (2017). [DOI] [PMC free article] [PubMed] [Google Scholar]
- 27.Zillhardt M et al. Foretinib (GSK1363089), an orally available multikinase inhibitor of c-Met and VEGFR-2, blocks proliferation, induces anoikis, and impairs ovarian cancer metastasis. Clin. Cancer Res 17, 4042–4051 (2011). [DOI] [PMC free article] [PubMed] [Google Scholar]
- 28.Wang Y, Shi J, Chai K, Ying X & Zhou BP The role of Snail in EMT and tumorigenesis. Curr. Cancer Drug Targets 13, 963–972 (2013). [DOI] [PMC free article] [PubMed] [Google Scholar]
- 29.Raymond JR Jr., Appleton KM, Pierce JY & Peterson YK Suppression of GNAI2 message in ovarian cancer. J. Ovarian Res. 7, 6 (2014). [DOI] [PMC free article] [PubMed] [Google Scholar]
- 30.Gao H et al. High-throughput screening using patient-derived tumor xenografts to predict clinical trial drug response. Nat. Med. 21, 1318 (2015). [DOI] [PubMed] [Google Scholar]
- 31.Koelblinger P, Thuerigen O & Dummer R Development of encorafenib for BRAF-mutated advanced melanoma. Curr. Opin. Oncol 30, 125–133 (2018). [DOI] [PMC free article] [PubMed] [Google Scholar]
- 32.Blessing MM et al. Novel BRAF alteration in desmoplastic infantile ganglioglioma with response to targeted therapy. Acta Neuropathol. Commun 6, 118 (2018). [DOI] [PMC free article] [PubMed] [Google Scholar]
- 33.Zhang J et al. Whole-genome sequencing identifies genetic alterations in pediatric low-grade gliomas. Nat. Genet 45, 602–612 (2013). [DOI] [PMC free article] [PubMed] [Google Scholar]
- 34.Tripathy D, Bardia A & Sellers WR Ribociclib (LEE011): Mechanism of action and clinical impact of this selective cyclin-dependent kinase 4/6 inhibitor in various solid tumors. Clin. Cancer Res 23, 3251–3262 (2017). [DOI] [PMC free article] [PubMed] [Google Scholar]
- 35.Anczukow O et al. SRSF1-Regulated Alternative Splicing in Breast Cancer. Mol. Cell 60, 105–117 (2015). [DOI] [PMC free article] [PubMed] [Google Scholar]
- 36.Yan G et al. Selective inhibition of p300 HAT blocks cell cycle progression, induces cellular senescence, and inhibits the DNA damage response in melanoma cells. J. Invest. Dermatol 133, 2444–2452 (2013). [DOI] [PMC free article] [PubMed] [Google Scholar]
- 37.Urdinguio RG et al. Chromatin regulation by Histone H4 acetylation at Lysine 16 during cell death and differentiation in the myeloid compartment. Nucleic Acids Res 47, 5016–5037 (2019). [DOI] [PMC free article] [PubMed] [Google Scholar]
- 38.Yuen BT & Knoepfler PS Histone H3.3 mutations: a variant path to cancer. Cancer Cell 24, 567–574 (2013). [DOI] [PMC free article] [PubMed] [Google Scholar]
- 39.Luck K et al. A reference map of the human binary protein interactome. Nature 580, 402–408 (2020). [DOI] [PMC free article] [PubMed] [Google Scholar]
- 40.Wang Y et al. ALOX5 exhibits anti-tumor and drug-sensitizing effects in MLL-rearranged leukemia. Sci. Rep 7, 1853 (2017). [DOI] [PMC free article] [PubMed] [Google Scholar]
- 41.Tsukasaki K et al. Mutations in the mitotic check point gene, MAD1L1, in human cancers. Oncogene 20, 3301–3305 (2001). [DOI] [PubMed] [Google Scholar]
- 42.Pierce BG et al. ZDOCK server: interactive docking prediction of protein-protein complexes and symmetric multimers. Bioinformatics 30, 1771–1773 (2014). [DOI] [PMC free article] [PubMed] [Google Scholar]
- 43.Nagata Y et al. Variegated RHOA mutations in adult T-cell leukemia/lymphoma. Blood 127, 596–604 (2016). [DOI] [PMC free article] [PubMed] [Google Scholar]
- 44.Liang L et al. Loss of ARHGDIA expression is associated with poor prognosis in HCC and promotes invasion and metastasis of HCC cells. Int. J. Oncol 45, 659–666 (2014). [DOI] [PubMed] [Google Scholar]
- 45.Lu W et al. Downregulation of ARHGDIA contributes to human glioma progression through activation of Rho GTPase signaling pathway. Tumour Biol. 37, 15783–15793 (2016). [DOI] [PMC free article] [PubMed] [Google Scholar]
- 46.Evans RM & Mangelsdorf DJ Nuclear receptors, RXR, and the big bang. Cell 157, 255–266 (2014). [DOI] [PMC free article] [PubMed] [Google Scholar]
- 47.Halstead AM et al. Bladder-cancer-associated mutations in RXRA activate peroxisome proliferator-activated receptors to drive urothelial proliferation. Elife 6, e30862 (2017). [DOI] [PMC free article] [PubMed] [Google Scholar]
- 48.Radmark O & Samuelsson B 5-Lipoxygenase: mechanisms of regulation. J. Lipid. Res 50 Suppl, S40–45 (2009). [DOI] [PMC free article] [PubMed] [Google Scholar]
- 49.Pidgeon GP et al. Lipoxygenase metabolism: roles in tumor progression and survival. Cancer Metastasis Rev. 26, 503–524 (2007). [DOI] [PubMed] [Google Scholar]
- 50.Liu Y, Beyer A & Aebersold R On the dependency of cellular protein levels on mRNA abundance. Cell 165, 535–550 (2016). [DOI] [PubMed] [Google Scholar]
- 51.Han L et al. The genomic landscape and clinical relevance of A-to-I RNA editing in human cancers. Cancer Cell 28, 515–528 (2015). [DOI] [PMC free article] [PubMed] [Google Scholar]
- 52.Sarnowski C et al. Impact of rare and common genetic variants on diabetes diagnosis by hemoglobin A1c in multi-ancestry cohorts: The trans-omics for precision medicine program. Am. J. Hum. Genet 105, 706–718 (2019). [DOI] [PMC free article] [PubMed] [Google Scholar]
- 53.Hemnes AR et al. PVDOMICS: A multi-center study to improve understanding of pulmonary vascular disease through phenomics. Circ. Res 121, 1136–1139 (2017). [DOI] [PMC free article] [PubMed] [Google Scholar]
- 54.Consortium I. T. P.-C. A. o. W. G. Pan-cancer analysis of whole genomes. Nature 578, 82–93 (2020). [DOI] [PMC free article] [PubMed] [Google Scholar]
- 55.Reardon S Giant study poses DNA data-sharing dilemma. Nature 525, 16–17 (2015). [DOI] [PubMed] [Google Scholar]
- 56.Coordinators NR Database resources of the National Center for Biotechnology Information. Nucleic Acids Res. 44, D7–19 (2016). [DOI] [PMC free article] [PubMed] [Google Scholar]
- 57.Grossman RL et al. Toward a shared vision for cancer genomic data. N. Engl. J. Med 375, 1109–1112 (2016). [DOI] [PMC free article] [PubMed] [Google Scholar]
- 58.Zhu Y, Qiu P & Ji Y TCGA-assembler: open-source software for retrieving and processing TCGA data. Nat. Methods 11, 599–600 (2014). [DOI] [PMC free article] [PubMed] [Google Scholar]
- 59.Iorio F et al. A landscape of pharmacogenomic interactions in cancer. Cell (2016). [DOI] [PMC free article] [PubMed] [Google Scholar]
- 60.Wang K, Li M & Hakonarson H ANNOVAR: functional annotation of genetic variants from high-throughput sequencing data. Nucleic Acids Res. 38, e164–e164 (2010). [DOI] [PMC free article] [PubMed] [Google Scholar]
- 61.Ng PC & Henikoff S SIFT: Predicting amino acid changes that affect protein function. Nucleic Acids Res. 31, 3812–3814 (2003). [DOI] [PMC free article] [PubMed] [Google Scholar]
- 62.Adzhubei IA et al. A method and server for predicting damaging missense mutations. Nat. Meth 7, 248–249 (2010). [DOI] [PMC free article] [PubMed] [Google Scholar]
- 63.Benjamini Y & Hochberg Y Controlling the false discovery rate: a practical and powerful approach to multiple testing. J. Royal Stat. Soc. B, 289–300 (1995). [Google Scholar]
- 64.Bindea G et al. ClueGO: a Cytoscape plug-in to decipher functionally grouped gene ontology and pathway annotation networks. Bioinformatics 25, 1091–1093 (2009). [DOI] [PMC free article] [PubMed] [Google Scholar]
Associated Data
This section collects any data citations, data availability statements, or supplementary materials included in this article.
Supplementary Materials
Data Availability Statement
All mapping interface mutations, network-predicted oncoPPIs across pan-cancer and 33 individual cancer types, the human protein-protein interactome, and predicted drug responses and patient survival analysis are freely available at the website: https://mutanome.lerner.ccf.org/ and https://github.com/ChengF-Lab/oncoPPIs. Publicly available databases used in the present study include the RCSB protein data bank (https://www.rcsb.org), Interactome3D (v2017.12, https://interactome3d.irbbarcelona.org), Interactome INSIDER (v2018.3, http://interactomeinsider.yulab.org), GeneCards (http://www.genecards.org/), NCBI (https://www.ncbi.nlm.nih.gov), TCGA GDC Data Portal (https://portal.gdc.cancer.gov), HGMD (http://www.hgmd.cf.ac.uk/ac/index.php), 1000 Genomes (phase 3, 2,504 individuals, https://www.internationalgenome.org), ExAC database (v0.3.1, 60,706 individuals, https://gnomad.broadinstitute.org), GDSC (http://www.cancerrxgene.org/).