

Abstract
The Western North Atlantic Ocean (WNAO) and adjoining East Coast of North America are of great importance for atmospheric research and have been extensively studied for several decades. This broad region exhibits complex meteorological features and a wide range of conditions associated with gas and particulate species from many sources regionally and other continents. As Part 1 of a 2-part paper series, this work characterizes quantities associated with atmospheric chemistry, including gases, aerosols, and wet deposition, by analyzing available satellite observations, ground-based data, model simulations, and reanalysis products. Part 2 provides insight into the atmospheric circulation, boundary layer variability, three-dimensional cloud structure, properties, and precipitation over the WNAO domain. Key results include spatial and seasonal differences in composition along the North American East Coast and over the WNAO associated with varying sources of smoke and dust and meteorological drivers such as temperature, moisture, and precipitation. Spatial and seasonal variations of tropospheric carbon monoxide and ozone highlight different pathways toward the accumulation of these species in the troposphere. Spatial distributions of speciated aerosol optical depth and vertical profiles of aerosol mass mixing ratios show a clear seasonal cycle highlighting the influence of different sources in addition to the impact of intercontinental transport. Analysis of long-term climate model simulations of aerosol species and satellite observations of carbon monoxide confirm that there has been a significant decline in recent decades among anthropogenic constituents owing to regulatory activities.
1. Introduction
The Western North Atlantic Ocean (WNAO) and the adjoining East Coast of North America have been the focus of numerous efforts aimed at understanding their atmospheric processes, with a particular emphasis on atmospheric chemistry and aerosol characterization. Over 50 field campaigns and long-term monitoring programs have been conducted in this broad region and summarized in over 700 peer-reviewed publications (Sorooshian et al., 2020). That review article highlighted important regional atmospheric features and identified knowledge gaps that warrant further research. North American pollution and outflow over the WNAO have been of interest for reasons such as acid rain (e.g., Cogbill & Likens, 1974; Likens & Bormann, 1974) and the opportunity to examine the aging of gas and aerosol pollutants (e.g., Fehsenfeld et al., 2006). Bermuda in particular has been a scientifically critical island where an extensive amount of research has been conducted over the last several decades to monitor changes in variables associated with pollution, climate, and general atmospheric changes (Aryal et al., 2014; Keene et al., 2014). The Sargasso Sea around Bermuda has also been the subject of many efforts intended to examine air-sea interaction processes, aerosol deposition, ocean biogeochemistry, and primary marine aerosol fluxes (Beaupre et al., 2019; Frossard et al., 2019; Lomas et al., 2013; Michaels & Knap, 1996; Steinberg et al., 2001; X. L. Zhou et al., 2008).
The East Coast of North America and the WNAO have encountered significant changes in their atmospheric composition during the last few decades. Robson et al. (2018) provided an analysis of the multivariate changes in the climate system of the broader North Atlantic region between 2005 and 2016 and concluded that there have been increases in ozone (O3) and methane, in addition to a reduction in aerosol optical depth (AOD) off the United States (U.S.) East Coast and Western Coastal Europe. Many studies have provided evidence of the success of pollution regulatory activities across North America. For example, Feng et al. (2019) reported that reduced emissions of sulfur dioxide (SO2) and nitrogen oxides (NOx) decreased surface air levels of sulfate (SO42−), nitrate (NO3−), ammonium (NH4+), nitric acid (HNO3), and SO2 by 73.3%, 29.1%, 67.4%, 65.8%, and 87.6%, respectively, along the U.S. East Coast and Canada between 1990 and 2015. Other works have reported on reductions in O3 (Chan & Vet, 2010), aerosol optical thickness (Yoon et al., 2014; Yu et al., 2020; Zhao et al., 2008), and constituents such as SO42− in surface particulate matter with aerodynamic diameter less than or equal to 2.5 μm (PM2.5) (Hand et al., 2012; Jongeward et al., 2016) and wet deposition (Keene et al., 2015; Sickles II & Shadwick, 2007, 2015). In addition, Keene et al. (2014) observed significant reductions in SO42− in both aerosol and wet deposition as far downwind as Bermuda.
Despite insight gained from past studies, a coherent picture is lacking that both puts in context our current knowledge and integrates different observations to provide a comprehensive overview of the spatial and temporal atmospheric features of the WNAO and North American East Coast. This first part of a 2-part paper series provides a detailed summary of the atmospheric chemical composition over this broad study region, whereas Part 2 will examine cloud variability, weather, precipitation, and aerosol-cloud interactions. Here, we address the following topics: (i) North American East Coast aerosol and wet deposition composition profiles; (ii) carbon monoxide (CO), O3, and simulated total and speciated AOD; and (iii) long-term observations of CO and aerosols over eastern North America and the WNAO region. The findings of this work are important for several reasons. The centralization of numerous atmospheric composition features for this region provides a framework for comparison with other areas, in addition to assisting with the interpretation of data for the North American East Coast and the WNAO region for past and future periods. As this extensive region has experienced significant changes in recent decades associated with atmospheric chemistry (e.g., Feng et al., 2019; Hand et al., 2012; Jongeward et al., 2016; Keene et al., 2014, 2015; Robson et al., 2018; Sickles II & Shadwick, 2007, 2015; Yoon et al., 2014; Yu et al., 2020; Zhao et al., 2008), more changes in the coming decades cannot be ruled out, and thus the current conditions provide a useful snapshot in the time evolution of the region. Lastly, results from this work provide context for many recent and upcoming field projects such as the North Atlantic Aerosols and Marine Ecosystems Study (NAAMES) (Behrenfeld et al., 2019), the Aerosol Cloud meTeorology Interactions oVer the western ATlantic Experiment (ACTIVATE) (Sorooshian et al., 2019), and the Investigation of Microphysics and Precipitation for Atlantic Coast-Threatening Snowstorms (IMPACTS) mission.
2. Datasets and Methodology
2.1. Surface Observational Data
Aerosol composition data were obtained for nine stations on the U.S. East Coast that are part of the U.S. Environmental Protection Agency (U.S. EPA) Interagency Monitoring of Protected Visual Environments (IMPROVE) network. Details associated with site coordinates and altitudes are summarized in Table S1. Methods of chemical characterization, uncertainties, and detection limits can be found on the Federal Land Manager Environmental Database (http://views.cira.colostate.edu/fed/). Following the method of Hand et al. (2019), data for the components comprising the reconstructed fine mass (RCFM) were obtained for the five-year period between December 2013 and November 2018. The RCFM consists of six major aerosol components measured or calculated for PM2.5: ammonium sulfate, ammonium nitrate, organic matter, elemental carbon, sea salt, and dust.
Seasonal averages of speciated composition in wet deposition from nine sites associated with the National Trends Network (NTN) National Atmospheric Deposition Program (NADP) are also discussed here. The nine sites are in very close proximity and often co-located with the IMPROVE sites. IMPROVE and NADP data are reported as seasonal averages, with subsequent references to seasons referring to the following months: December-January-February (DJF), March-April-May (MAM), June-July-August (JJA), and September-October-November (SON). For both IMPROVE and NADP data, results for two representative seasons (MAM and JJA) are shown in Figures 1 and 2, respectively. Results for other seasons and the tabulated data are included in the SI file (IMPROVE = Figure S1 and Tables S2–S5; NADP = Figure S2 and Tables S6–S9). Seasonal mass concentrations for each species at the nine sites can also be found in the SI (Figures S3–S8).
Figure 1.
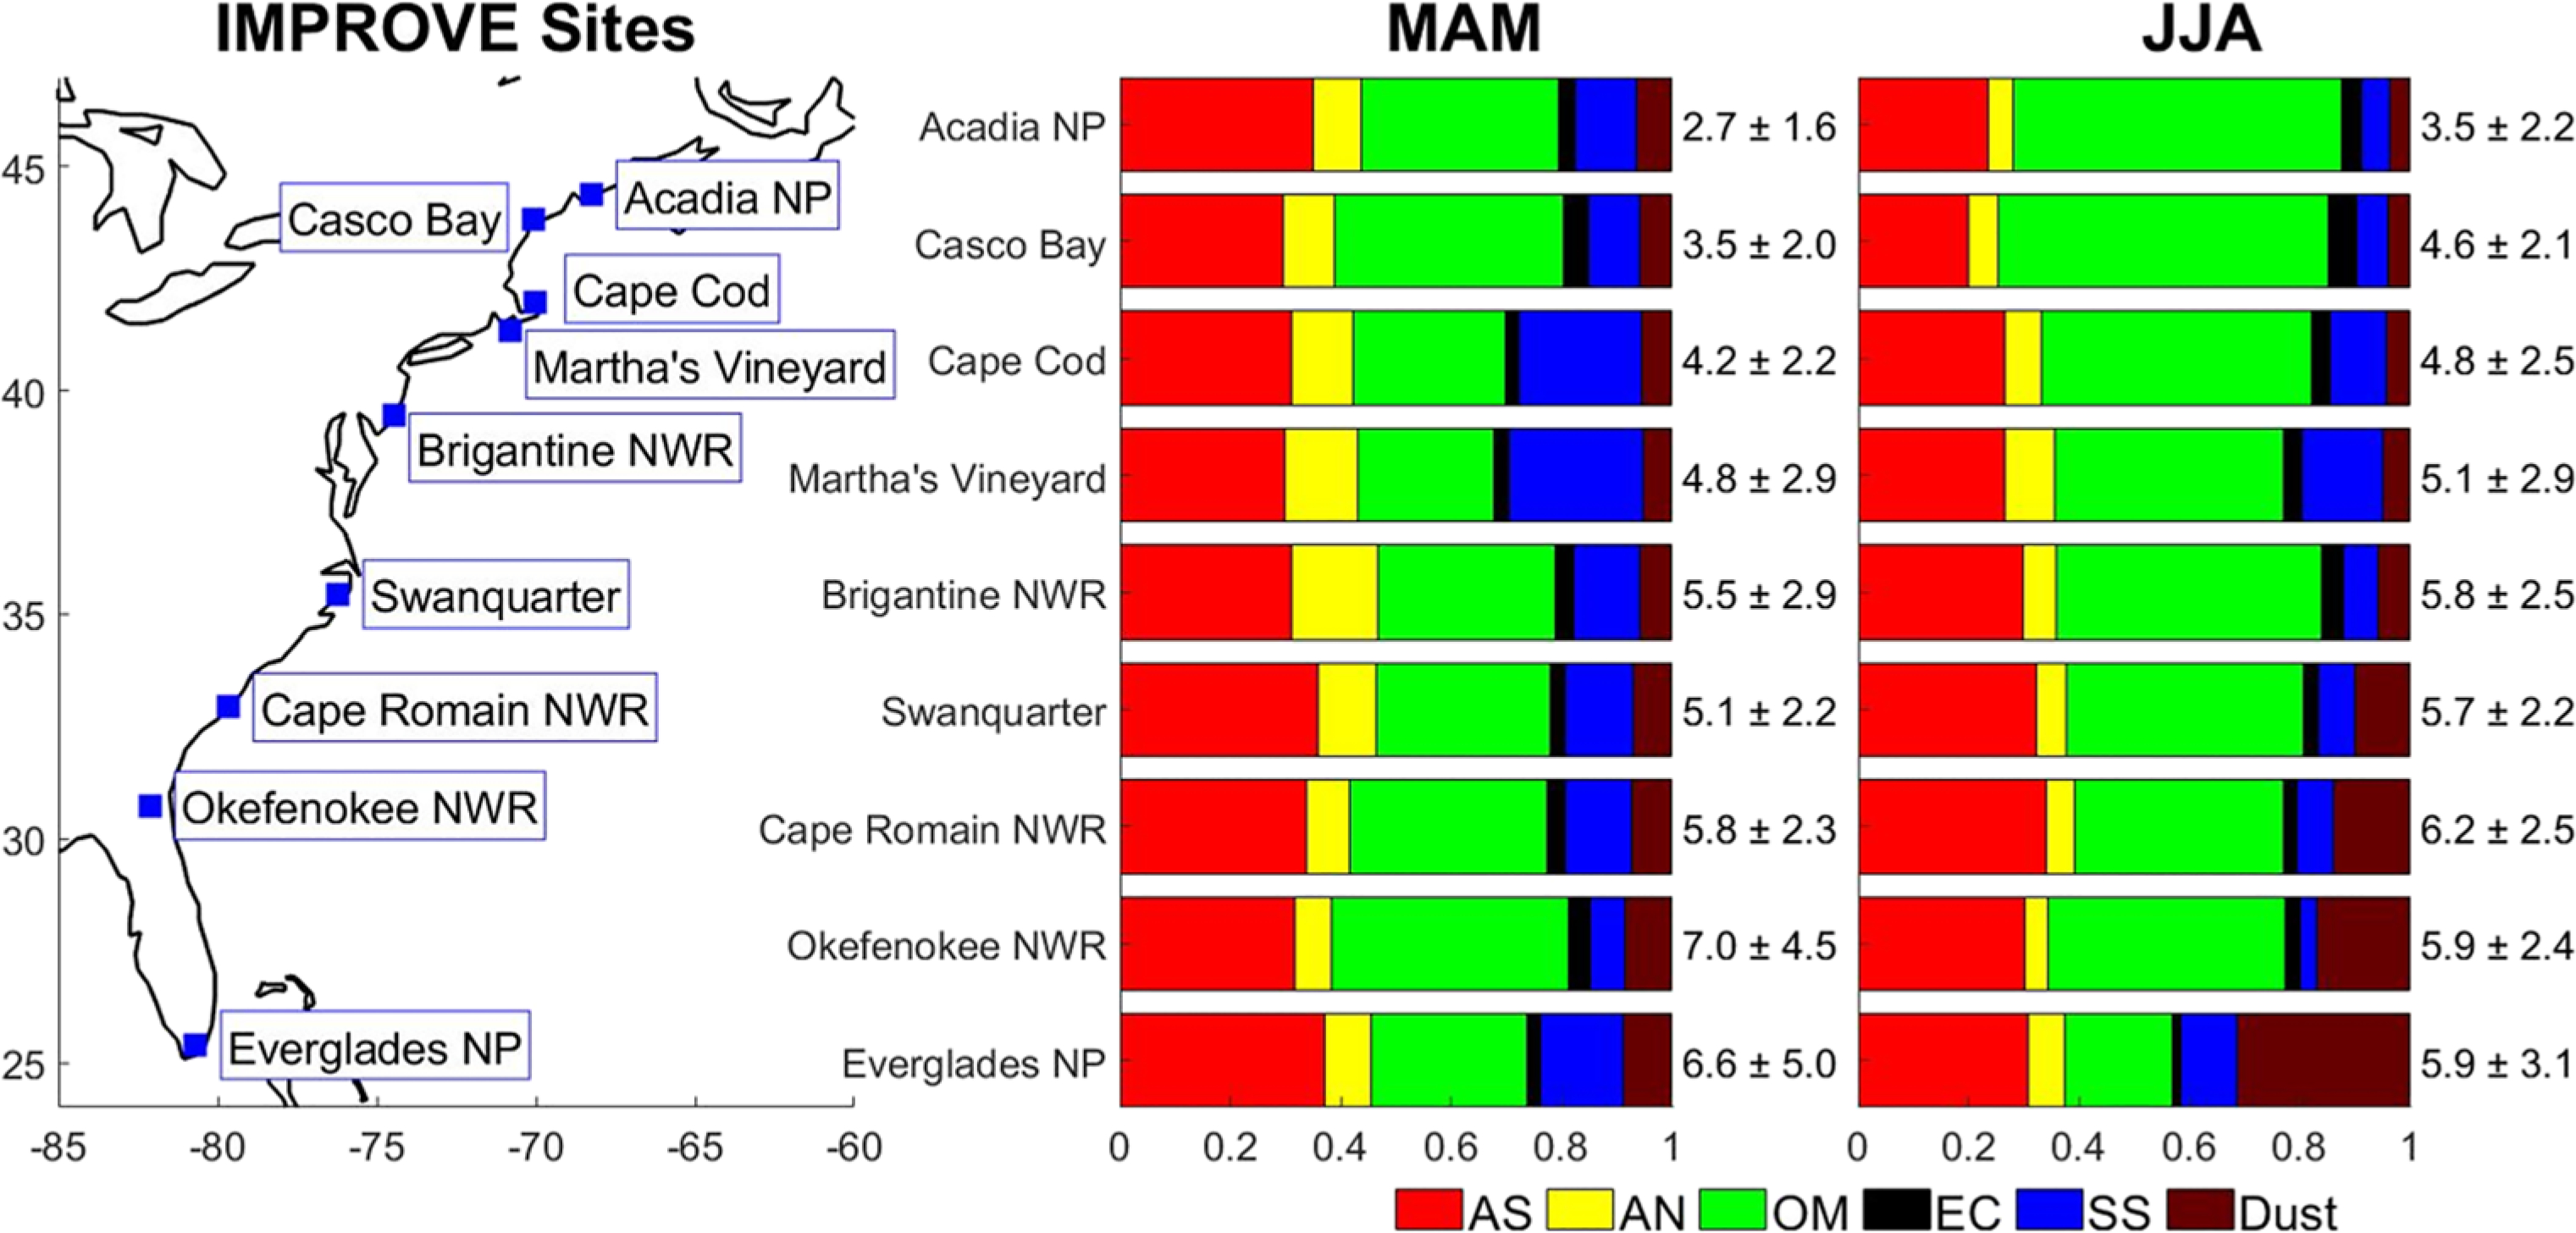
Geographic positions of IMPROVE monitoring sites referenced in Table S1 and bar charts showing the reconstructed fine mass (RCFM) for nine sites along the U.S. East Coast for March, April, May (MAM) and June, July, and August (JJA) for 2014–2018. Values on the right of each bar show the average (± standard deviation) value of RCFM in units of μg m−3. The components of RCFM are ammonium sulfate (AS), ammonium nitrate, (AN), organic matter (OM), elemental carbon (EC), sea salt (SS), and dust.
Figure 2.

Geographic positions of National Atmospheric Deposition Program (NADP) monitoring sites referenced in Table S1 and bar charts showing the averages of weekly concentrations (mg L−1) of species measured in wet deposition for nine sites along the U.S. East Coast for March, April, May (MAM) and June, July, and August (JJA) for 2014–2018. On the right of each bar chart is the average (± standard deviation) value of pH.
2.2. MERRA-2 Reanalysis Products
Meteorological fields, CO, O3, and total and speciated AOD over the North American East Coast and the WNAO region for 2014–2018 were obtained from the Modern-Era Retrospective analysis for Research and Applications, version 2 (MERRA-2) (Gelaro et al., 2017). MERRA-2 is NASA’s latest reanalysis produced with the Goddard Earth Observing System, version 5 (GEOS-5) atmospheric data assimilation system (Rienecker et al., 2008). The tropospheric O3 column (Dobson Units [DU]) over the WNAO region was calculated from assimilated O3 fields in the MERRA-2 reanalysis (Wargan et al., 2017) using the tropopause pressure based on a blended estimate (Bosilovich et al., 2016). Similarly, the tropospheric CO column (molecules cm−2) was calculated from CO chemical fields in MERRA-2.
The aerosol reanalysis from MERRA-2 (Buchard et al., 2017; Randles et al., 2017) uses the GEOS-5 Goddard Aerosol Assimilation System (Buchard et al., 2015) where the Goddard Chemistry, Aerosol, Radiation, and Transport (GOCART) model (Chin et al., 2002) is used to simulate 15 externally mixed aerosol tracers: hydrophobic and hydrophilic black carbon and organic carbon, dust (five size bins), sea salt (five size bins), and SO42−. GOCART includes wind speed-dependent emissions for dust and sea salt. It also includes fossil fuel combustion, biomass burning, and biofuel emissions for primary SO42− and carbonaceous aerosols, and additional biogenic sources for organic carbon. Secondary SO42− aerosols are formed by chemical oxidation of SO2 and dimethylsulfide (DMS). Volcanic SO2 emissions are also considered. The major sinks for aerosol tracers include gravitational settling, dry deposition, and wet scavenging due to large-scale and convective precipitation. MERRA-2 assimilates AOD from ground and satellite-based remote sensors, including the Advanced Very High Resolution Radiometer (AVHRR, 1980-August 2002), the Aerosol Robotic Network (AERONET, 1999–October 2014), the Multi-angle Imaging Spectroradiometer (MISR, February 2000–June 2014), the Moderate Resolution Imaging Spectroradiometer (MODIS) on Terra (March 2000 onward), and MODIS on Aqua (August 2002 onward). The MERRA-2 aerosol products have been evaluated by Randles et al. (2017) for AODs and by Buchard et al. (2017) for aerosol vertical distribution and absorption.
2.3. Atmospheric Infrared Sounder (AIRS)
Satellite total column CO data were obtained from the AIRS instrument on Aqua (L2 Standard Physical Retrieval (AIRS-only) V006 product at 50 × 50 km resolution) for the full CO record from January 2003 to December 2018 (https://search.earthdata.nasa.gov/search), to examine long-term observations over the North American East Coast and the WNAO region. Daily data were collected as granules over the region bordered by 25°–50°N and 60°–85°W. The data were subsequently re-gridded at 0.5° resolution. Monthly averages were calculated from the daily gridded values and then used to determine the monotonic trend using Mann-Kendall trend analysis, which is described in Section S1.
2.4. Aerosol Vertical Profiles from CALIOP-Aerosol Lidar with Orthogonal Polarization (CALIOP)
CALIOP on the Cloud-Aerosol-Lidar and Infrared Pathfinder Satellite Observation (CALIPSO) platform provides vertically resolved retrievals of aerosol extinction coefficient at 532 nm and aerosol typing for cloudless samples (Kim et al., 2018). Version 4 Aerosol Profile Level 2 products used here have a vertical resolution of 60 m, and an effective spatial resolution of 5 km. Aerosol retrievals for the period 2006–2013 are limited to daytime data with medium to high confidence of being classified as aerosols. In addition, samples classified as clear air are assigned an aerosol extinction coefficient of 0.0, consistent with Tackett et al. (2018).
2.5. Airborne Remotely Sensed Data
Aerosol remote sensing data were obtained by the airborne Research Scanning Polarimeter (RSP) (Cairns et al., 1999) during the U.S. Department of Energy (DOE) Two-Column Aerosol Project (TCAP) (Berg et al., 2016) campaign between 8 and 25 July 2012 and the NASA Ship-Aircraft Bio-Optical Research (SABOR) campaign between 26 and 31 July 2014. Both campaigns operated over the WNAO and the East Coast of North America. Aerosol properties are retrieved from RSP’s multi-wavelength, multi-angle measurements of total reflectances and degree of polarization using the Microphysical Aerosol Properties from Polarimetry (MAPP) algorithm (Stamnes et al., 2018). The MAPP algorithm retrieves AOD at 555 nm, effective radius and variance of the size distribution and number concentration in two modes, as well as the complex refractive index of the fine mode. The coarse mode refractive index is assumed to be that of water representing hydrated sea salt. The total and fine mode single scattering albedo (SSA) is derived from these aerosol properties. The aerosol top heights for the coarse and fine mode are obtained using the co-located High Spectral Resolution Lidar (HSRL) (Hair et al., 2008). Although not presented in this paper, the HSRL also provides vertically resolved aerosol information (Muller et al., 2014; R. R. Rogers et al., 2009; Sawamura et al., 2017), as well as aerosol type (Burton et al., 2012).
2.6. Community Atmosphere Model Version 5 (CAM5) Simulation
The CAM5 model is run for 35 years over 1980–2014 to show the performance of a modern aerosol-climate model in simulating inter-annual variability and long-term analysis of aerosols over the WNAO and the East Coast of North America by comparing against the observational data and reanalysis products. The CAM5 model is configured to run with time-varying emissions of aerosol and gas precursors to predict number and mass concentrations of major types of aerosols, including primary organic matter, black carbon, SO42−, secondary organic aerosol, sea salt, and mineral dust. To quantify the source-receptor relationships of aerosols in a particular region, the CAM5 model was equipped with an explicit aerosol source tagging (CAM5-EAST) capability that tracks the evolution of certain species originating from pre-defined source regions (H. L. Wang et al., 2014; Yang et al., 2017, 2018). Three major types of anthropogenic aerosol species (i.e., SO42−, black carbon, primary organic matter) emitted from four U.S. domestic regions and a number of remote source regions are tracked by CAM5-EAST (regions spatially defined in Figure S9). The tagged regions include northwestern, southwestern, northeastern and southeastern U.S. (NWU, SWU, NEU, SEU), western and eastern Canada (WCA and ECA), Central America (CAM), Europe (EUR), the Middle East (MDE), South Asia (SAS), East Asia (EAS), Russia/Belarus/Ukraine (RBU), South America (SAM), North Africa (NAF), South Africa (SAF), Southeast Asia (SEA), Central Asia (CAS), Pacific/Australia/New Zealand (PAN), the Arctic (ARC), Antarctic (ANT), and Non-Arctic/Antarctic Ocean (OCN).
3. Results and Discussion
3.1. U.S. East Coast Observational Analysis
3.1.1. Aerosols
This section summarizes seasonal characteristics for RCFM based on EPA IMPROVE data for 2014–2018 at the nine sites as shown in Figure 1. This analysis aims to build on work by Hand et al. (2019) who used IMPROVE data to analyze the annual cycle over the entire U.S. by focusing on the seasonal characteristics and highlighting the varying sources impacting the U.S. East Coast for more recent years. In terms of relative mass fraction, the influence of dust is greatest in JJA at Okefenokee NWR (17 ± 15%) and Everglades NP (31 ± 20%) (Figure 1). The highest fraction at the southernmost point (Everglades NP) is likely due to it being closest to where Northern Africa dust would presumably first arrive along the U.S. East Coast. These results are consistent with past work showing JJA maxima in dust levels at sites in Bermuda, Barbados, and Miami (e.g., Muhs et al., 2007; Muhs et al., 2012; Prospero et al., 2010; Zuidema et al., 2019). The third southernmost site (Cape Romain NWR in South Carolina) also exhibits a relatively high dust mass fraction in JJA (14 ± 13%), in contrast to all other sites to the north (4 ± 3%–10 ± 11%) with reduced dust influence owing to likely dilution in the transport of African dust plumes. The ability of Saharan dust to travel from North Africa over the tropical Atlantic by the help of trade winds has been documented for decades (Carlson & Prospero, 1971; Jung et al., 2013; Prospero & Carlson, 1972; Savoie & Prospero, 1977). Its reach to the northern part of the Atlantic Ocean and the WNAO depends on the season, and is influenced by the latitudinal movement of the Inter-Tropical Convergence Zone (ITCZ) (Moulin et al., 1997). The westward displacement of the North Atlantic subtropical high can also promote more easterly flow (and thus dust transport, if dust is present) to the northwest Atlantic (Doherty et al., 2008).
An interesting seasonal gradient appears as a function of latitude for mass concentrations of dust (Figure S3). The highest levels are observed in the JJA months for sites including and south of Martha’s Vineyard; more specifically, dust levels increase gradually from an average of 0.28 ± 0.52 μg m−3 at Martha’s Vineyard to an average of 2.29 ± 2.39 μg m−3 at Everglades NP. In contrast, for Cape Cod and sites to the north (Casco Bay and Acadia NP), the highest dust levels were in the MAM season with less variation between those three sites (average values between 0.17 ± 0.16 and 0.23 ± 0.24 μg m−3). Local sources of dust are generally quite weak over the Northeast U.S. (Cook et al., 2009), and thus long-range transport could potentially be the more important source. As African dust typically peaks in abundance in JJA over the East Coast, the source of dust for the Northeast is likely different. Other studies have pointed to Asian dust being more significant in MAM months for the Northeast U.S. (Aldhaif et al., 2020; Zhang et al., 2019), which may also explain the peak levels of dust in MAM at the northernmost sites. Studies over the western U.S. have also confirmed Asian dust is most influential over the continental U.S. in MAM (Creamean et al., 2014; Lopez et al., 2016; VanCuren & Cahill, 2002; Wells et al., 2007).
The majority of sites north of Florida and Georgia exhibited their highest RCFM levels in the JJA season, which coincides with the period of highest incident solar radiation and thus potential for photochemical generation of secondary aerosols, when the incident solar radiation is the highest. Enhanced photochemical production of aerosols may be sufficient to outweigh factors that would reduce concentrations in these warmer months (e.g., deeper boundary layer, volatilization, wet scavenging) as observed in other regions too (e.g., Crosbie et al., 2015). Other important factors for the RCFM increase during the summer include the influence of biomass burning plumes from upwind regions such as Alaska, Canada, and the western U.S. (Fehsenfeld et al., 2006), high relative humidity (which assists with chemical reactions to produce secondary species), and stagnation events (Tai et al., 2010). With some exceptions based on geography and season, the two dominant constituents of RCFM that are secondarily produced include organic matter and ammonium sulfate, although primary sources exist for organic matter. The relative amount of organic matter is highest in JJA for the sites north of South Carolina (43 ± 15%–60 ± 15%), suggestive of the enhanced relative importance of secondary organic aerosol for RCFM. The precursors to secondary organic aerosol formation include a myriad of volatile organic compounds from both biogenic and anthropogenic sources. Organic matter concentration follows the same trend with higher values during JJA for sites north of Cape Romain NWR (Figure S4). However, the highest and lowest organic matter concentrations were observed during MAM with a decreasing latitudinal gradient from high to low concentrations moving from the south at Okefenokee NWR (3.26 ± 3.61 μg m−3) to the north at Acadia NP (0.93 ± 0.64 μg m−3).
Ammonium sulfate typically exhibited some of the highest concentrations in the MAM season along the East Coast (Everglades NP = 2.14 ± 1.19 μg m−3; Okefenokee NWR = 2.04 ± 1.04 μg m−3; Swanquarter = 1.82 ± 0.90 μg m−3) with the exception of some sites with higher values in JJA (Brigantine NWR = 1.79 ± 1.05 μg m−3; Cape Romain NWR = 2.05 ± 0.88 μg m−3; Martha’s Vineyard = 1.42 ± 1.07 μg m−3; Cape Cod = 1.34 ± 0.97 μg m−3) or DJF (Casco Bay = 1.16 ± 0.65 μg m−3; Acadia NP = 1.02 ± 0.56 μg m−3) as shown in Figure S5. The lowest ammonium sulfate values were usually in SON. Ammonium sulfate was the only RCFM constituent that consistently, regardless of season, showed a general latitudinal gradient from high to low concentrations moving from the south to the north of the East Coast (Figure S5). That feature was clearest in MAM where the highest concentrations of any site for any season was for Everglades NP (2.14 ± 1.19 μg m−3) and Okefenokee NWR (2.04 ± 1.04 μg m−3). There were gradual reductions moving north to a concentration of 0.90 ± 0.48 μg m−3 at Acadia NP. It is unclear as to why this latitudinal trend exists based on the given datasets used. Yang et al. (2018) found that near-surface SO42− in northeastern U.S. is mostly from local SO2 emissions, while SO42− in the southeastern U.S. is mainly accounted for by local sources with additional inputs from northeastern U.S. emissions in recent decades (1980–2014). Hand et al. (2012) noted that SO2 emissions between the early 1990s through 2010 are nearly double over the northeastern U.S. versus the southeastern U.S., and that the response of SO42− to SO2 is lower for the eastern U.S. versus the western U.S., which points to future work needed to understand more about SO42− over the U.S. East Coast.
Ammonium nitrate exhibits its highest mass fraction in the DJF season for all sites (8 ± 4%–26 ± 10.4%) (Figure S1). The highest DJF mass fraction for ammonium nitrate was at Brigantine NWR (New Jersey), which may be linked to nearby agricultural activity and thus NH3 emissions. Another study reported that there are major NH3 sources from agricultural activity between Chesapeake Bay and the Atlantic Ocean in the vicinity of Maryland and Virginia (Loughner et al., 2016). Results from the 2015 Wintertime Investigation of Transport, Emissions, and Reactivity (WINTER) campaign revealed that reduced particle acidity favors partitioning of NO3− to the aerosol phase (Shah et al., 2018), which is another factor promoting high DJF levels of NO3− over the Northeast U.S. For Cape Romain NWR, and sites to its north (except for Acadia NP), the ammonium nitrate concentrations were the highest during DJF and highest during MAM for the southern sites of Okefenokee NWR and Everglades NP (Figure S6). The highest concentration was observed during DJF at Brigantine NWR (1.92 ± 2.15 μg m−3).
Only one site exhibited maximum RCFM levels in DJF (Brigantine NWR = 6.68 ± 5.62 μg m−3), which is in the northeast U.S. and has organic matter as the most abundant constituent. A plausible explanation for this result would be enhanced wood burning for heating purposes in these months (Schroder et al., 2018). In this regard, Sullivan et al. (2019) used WINTER measurements to estimate that organic carbon from residential burning accounted for ~30–100% of PM1.0 over the U.S. East Coast. Furthermore, they showed that the aerosol chemistry model GEOS-Chem underpredicted smoke contributions to PM1.0, likely due to how emissions are handled.
The relative abundance of sea salt was most pronounced at Martha’s Vineyard, Cape Cod, and Everglades NP, regardless of season. Although the peak seasonal mass fractions of sea salt occurred in different seasons for these sites (Martha’s Vineyard = 25 ± 18% in MAM; Cape Cod: 23 ± 20% in SON; Everglades NP = 19 ± 17% in DJF), sea salt average mass concentrations were always highest in the MAM season (0.35 ± 0.59 μg m−3–1.26 ± 1.37 μg m−3; Figure S7). The maximum sea salt concentration of 1.26 ± 1.37 μg m−3 was observed during MAM at Martha’s Vineyard, while Acadia NP exhibited the lowest concentration of 0.15 ± 0.25 μg m−3 in JJA. Results from the Chemistry of Halogens on the Isles of Shoals (CHAiOS) campaign showed that high sea salt levels along the coastline of the East Coast are due to their reactivity and consequent acid displacement reactions that can occur, promoting enhanced Cl2 levels that can often recirculate back onshore leading to enhanced Cl2 at nighttime (Pechtl & von Glasow, 2007). Enhancement of Cl2 and bromine may be the result of high levels of gaseous acids (e.g., organic acids, nitric, and sulfuric acids) in the air outflow from larger coastal urban areas (e.g., New York City) that may facilitate these reactions (e.g., Lawler et al., 2009; von Glasow et al., 2013).
The least abundant RCFM constituent at the nine sites was usually elemental carbon, which contributed less than 6% ± 3% to RCFM. Both elemental carbon and organic matter are among the most enhanced constituents in biomass burning plumes as previously documented for parts of the continental U.S. (e.g., Schlosser et al., 2017). Elemental carbon exhibited the highest mass fraction at Casco Bay (Maine) regardless of season (DJF = 6% ± 2%; MAM = 5% ± 2%; JJA = 5% ± 2%; SON = 6 ± 3). One plausible explanation is that this site may be the most vulnerable to biomass burning as organic matter also usually was the dominant RCFM component.
The highest elemental carbon mass concentrations were observed during DJF at Okefenokee NWR (0.31 ± 0.25 μg m−3), Cape Romain NWR (0.28 ± 0.19 μg m−3), Swanquarter (0.19 ± 0.15 μg m−3), Brigantine NWR (0.31 ± 0.28 μg m−3), and Casco Bay (0.33 ± 0.25 μg m−3). The latter site exhibited the highest concentration (0.33 ± 0.25 μg m−3) of all seasons and sites. High concentrations were also observed during MAM for Everglades NP (0.18 ± 0.19 μg m−3), and JJA for Cape Code (0.16 ± 0.12 μg m−3), Martha’s Vineyard (0.16 ± 0.13 μg m−3), and Acadia NP (0.13 ± 0.10 μg m−3). Residential wintertime wood burning was likely a major source of elemental carbon, as also confirmed by WINTER campaign measurements (Sullivan et al., 2019; Figure S8). Similar to dust, elemental carbon exhibited different spatial profiles between JJA and MAM. More specifically, during JJA, elemental carbon reached high mass concentrations at Brigantine NWR and sites to its north (except for Acadia NP) peaking at Casco Bay (0.24 ± 0.14 μg m−3). High concentrations were observed south of Brigantine NWR during MAM, with the highest concentration at Okefenokee NWR (0.28 ± 0.12 μg m−3), while lower concentrations were observed at the sites north of Brigantine NWR except for Casco Bay (0.16 ± 0.17 μg m−3). Elemental carbon sources during MAM may be linked to agricultural and natural fires in the neighboring areas (e.g., Akagi et al., 2013; Hand et al., 2013; Lang et al., 2002; Sevimoğlu & Rogge, 2019). While dust is influenced from long-range transport from different upwind regions based on whether it is MAM or JJA, biomass burning could also vary by season in terms of different sources impacting the northern and southern parts of the East Coast. Wildfires over the western U.S., Alaska, and Canada have been noted to influence the northeastern U.S. (H. M. Rogers et al., 2020) and WNAO pollution levels in JJA (de Gouw et al., 2006; Honrath et al., 2004; Q. B. Li et al., 2005; Owen et al., 2006; Parrington et al., 2012), whereas fires from the Yucatan (Yokelson et al., 2009) and central Mexico (Mora et al., 2017) have been noted to be prevalent in MAM that can more easily impact the southeast U.S. Further work is warranted to examine the prevalence of different pathways of biomass burning plume transport based on season, and their overall impact on surface aerosol loadings over the East Coast.
3.1.2. Wet Deposition
Wet deposition composition results from nine NADP sites for 2014–2018 along the U.S. East Coast are summarized in this section (Figures 2 and S2). There has been extensive research conducted over the East Coast related to acid rain dating back to the early 1970s (Driscoll et al., 2001). Documented values of pH in precipitation samples have historically been well below the value expected based on equilibrium with CO2 (pH = 5.6) (Cogbill & Likens, 1974; Driscoll et al., 2001; Likens & Bormann, 1974; Likens et al., 1972). The most problematic area was concentrated over the northeastern part of the United States as a result of pollution transport from the industrialized Midwest (Cogbill & Likens, 1974). Here we build on past wet deposition studies to examine the entire East Coast as a whole while focusing on seasonal variations.
The seasonal mean pH values for all nine sites were within the range of 4.5 ± 2.8 and 5.4 ± 0.5 (Figures 2 and S2). The highest pH was consistently reported at the southernmost site (Everglades NP) owing presumably to greater influence from dust and more alkaline constituents. A multitude of other studies have shown that dust enhances wet deposition pH (Loye-Pilot & Morelli, 1988; Schwikowski et al., 1995; Sorooshian et al., 2013; Williams & Melack, 1991). The two main mechanisms by which dust impacts wet deposition are by either serving as the cloud condensation nuclei (CCN) upon which drops form or from being scavenged below cloud base by falling drops (Ahmady-Birgani et al., 2020). The crustal tracer species calcium (Ca2+) and potassium (K+) (Dadashazar et al., 2019; R. Li et al., 2019) were most enhanced at Everglades NP versus all other sites regardless of season (Figure 2). In addition, K+ is often considered as a tracer for biomass burning and fireworks (R. Li et al., 2019). With three exceptions (Everglades NP = DJF, Casco Bay = SON, Acadia NP = SON; Figure S2), values of pH were highest in MAM and reached minimum values in one of the other three seasons depending on the site.
With only a few exceptions, the highest concentration of any ion in wet deposition was chloride (Cl−), which is the most abundant component species by mass in sea salt, followed by sodium (Na+). Unlike the IMPROVE results for sea salt, Cl− and Na+ mass concentrations in wet deposition samples were not always highest in the MAM season (Figure 2) as, depending on the site, peak levels were usually in SON or DJF.
After accounting for the two main sea salt constituents (Cl− and Na+), usually NO3− and SO42− were the next most abundant species, followed by NH4+. The Everglades NP site usually had the highest SO42− concentration except for the JJA season when Cedar Beach-Southold had slightly higher levels. It is uncertain as to what exactly is the predominant source of the SO42− in wet deposition at the southern tip of Florida; however, a few possibilities include: (i) marine SO42− from oxidation of dimethylsulfide (DMS) (e.g., Chen et al., 2018); (ii) regional SO2 emissions that form SO42−; and (iii) also African dust interacting with sources of pollution during its transport including over the eastern Mediterranean and western Africa (Falkovich et al., 2001; Koçak et al., 2007; Putaud et al., 2004). The lowest SO42− concentrations were usually at the two northernmost sites (Casco Bay and Acadia NP) for all seasons. Of all seasons, MAM exhibited peak levels of SO42− for five of the sites (Okefenokee NWR, Edwin B. Forsythe NWR, Cedar Beach-Southold, Casco Bay, and Acadia NP). In contrast to the clear latitudinal gradient of ammonium sulfate concentrations in IMPROVE data from the south to north of the East Coast, SO42− in wet deposition did not show as clear a trend.
In sharp contrast to the ammonium nitrate spatiotemporal profile from IMPROVE where concentrations were typically highest in DJF (Figure S1), the concentrations of NO3− in wet deposition were the lowest in DJF and SON (Figure S2). Peak levels of NO3− were usually observed in JJA for sites including and to the south of Cedar Beach-Southold. Sites farther north exhibited the highest NO3− levels in MAM. The seasonal concentration profile at each site for NH4+ was more similar to SO42− than NO3− with the highest levels usually in MAM with a few exceptions that were slightly higher in either SON (Everglades NP) or DJF (Cape Romain NWR, Beaufort, N. Atlantic Coastal Lab). The other similarity between NH4+ and SO42− was that Everglades NP had the highest levels in each season except JJA, where in this case Edwin B. Forsythe NWR had the highest NH4+ levels of any site.
More research is needed to reconcile factors explaining the differences in the seasonal character of composition in wet deposition versus RCFM along the East Coast. For instance, it is worth pursuing if the different latitudinal profiles of NO3− in MAM and JJA discussed above are associated in any way with Asian and African dust, respectively. A limitation of the NADP/NTN monitoring network is the inability to speciate organics and elemental carbon in wet deposition (e.g., Barrett et al., 2019), and, thus, this analysis is limited to just inorganic species. This may be the reason why signatures of biomass burning are not evident in the wet deposition data unlike the IMPROVE data. More efforts are needed to provide a more comprehensive picture of wet deposition chemistry to incorporate carbonaceous materials and various trace elements that serve as useful air mass tracers.
3.2. Characteristics Over the Ocean
Section 3.1 provided a detailed view of East Coast composition based on observational data from ground-based monitoring networks. Such networks do not exist over the WNAO and occasional cruise or airborne measurements provide snapshots of spatial properties of gases, aerosol, and cloud/precipitation chemistry (Fehsenfeld et al., 2006; Sorooshian et al., 2020). For this reason, we avail ourselves of satellite observations and reanalysis data for describing the vertical structure and spatial variability of several chemical species. Moreover, CAM5-EAST model simulations of speciated aerosols are compared with IMPROVE measurements over the East Coast and then used to quantify historical trends and source attribution of aerosols over the WNAO. The subsequent sections discuss these datasets in the context of gas and aerosol composition. With regard to gases, the discussion centers on CO and O3 as these are important and ubiquitous trace constituents in the troposphere.
3.2.1. Carbon Monoxide
Carbon monoxide possesses a sufficiently long lifetime in the atmosphere (~1–3 months) (e.g., Cicerone, 1988; Holloway et al., 2000) to be useful as a quasi-conservative tracer for anthropogenic emissions (e.g., Fishman & Seiler, 1983). While the processes involved with the emission and formation of CO are well-documented, the sources and sinks are variable over time and space, yielding uncertainties in its overall budget. Carbon monoxide is efficiently removed in the troposphere by oxidation with the hydroxyl radical (OH) (Logan et al., 1981), with dry deposition being another important removal mechanism (Petron et al., 2002). Approximately three-quarters of surface CO sources are in the Northern Hemisphere with inputs derived from fossil fuel use, biomass burning, vegetation and soil emissions, ocean emissions, and oxidation of methane and non-methane hydrocarbons (Petron et al., 2002; Warneke et al., 2006; Wotawa et al., 2001). An effective way to characterize the spatiotemporal distribution of CO over broad scales is with remote sensing and reanalysis data.
Several studies have examined the interannual variability of CO by using 3-D modeling or ground measurements like the ones provided by the National Oceanic and Atmospheric Administration (NOAA) Climate Monitoring and Diagnostics Laboratory (CMDL) air sampling network (e.g., Duncan & Logan, 2008; Novelli et al., 1998; Novelli et al., 1992; Wotawa et al., 2001; Y. Zhou et al., 2017). Our study builds on past works by using seasonally averaged tropospheric CO column from MERRA-2 from 2014 – 2018 (Figure 3) to analyze the changes in CO specifically over eastern North America and the WNAO. Carbon monoxide concentrations reach a maximum along the coast, with a gradual reduction eastward. This spatial pattern is consistent with North American pollution outflow and dilution mechanisms over the WNAO. The highest domain-wide mean value for the tropospheric CO was observed during MAM (13.7 ± 0.78 [× 1017 molecules cm−2]). During MAM, the concentration of CO is primarily driven by the seasonal cycle of OH and photochemical production and destruction reactions (e.g., Novelli et al., 1998; Spivakovsky et al., 2000). Although the maximum potential for CO removal via reaction with OH is in JJA due to peak OH levels (Bates & Witherspoon, 1952; Novelli et al., 1992), the lowest domain-wide mean concentration is in SON (12.8 ± 0.81 [× 1017 molecules cm−2]). The domain-wide mean concentration in JJA (13.2 ± 1.47 [× 1017 molecules cm−2]) is slightly higher than the mean in SON (12.8 ± 0.81 [× 1017 molecules cm−2]) and DJF (13.1 ± 0.71 [× 1017 molecules cm−2]). The JJA domain-wide mean exhibited the largest standard deviation, suggestive of more episodic events. Additionally, the lowest minimum values over the open ocean (10.86 × 10¹⁷ molecules cm−2; 25°N, 66.25°W) and the highest maximum value over land (22.03 × 10¹⁷ molecules cm−2; 41°N, 73.75°W) can be observed during JJA. The specific area with the highest CO in the JJA season is in the vicinity of the urban center of New York City. In contrast to the oceanic part of the study region, tropospheric CO over the East Coast is at a maximum during JJA, reflecting mainly larger sources of CO from the chemical oxidation of non-methane hydrocarbons (e.g., Novelli et al., 1992; Spivakovsky et al., 2000).
Figure 3.
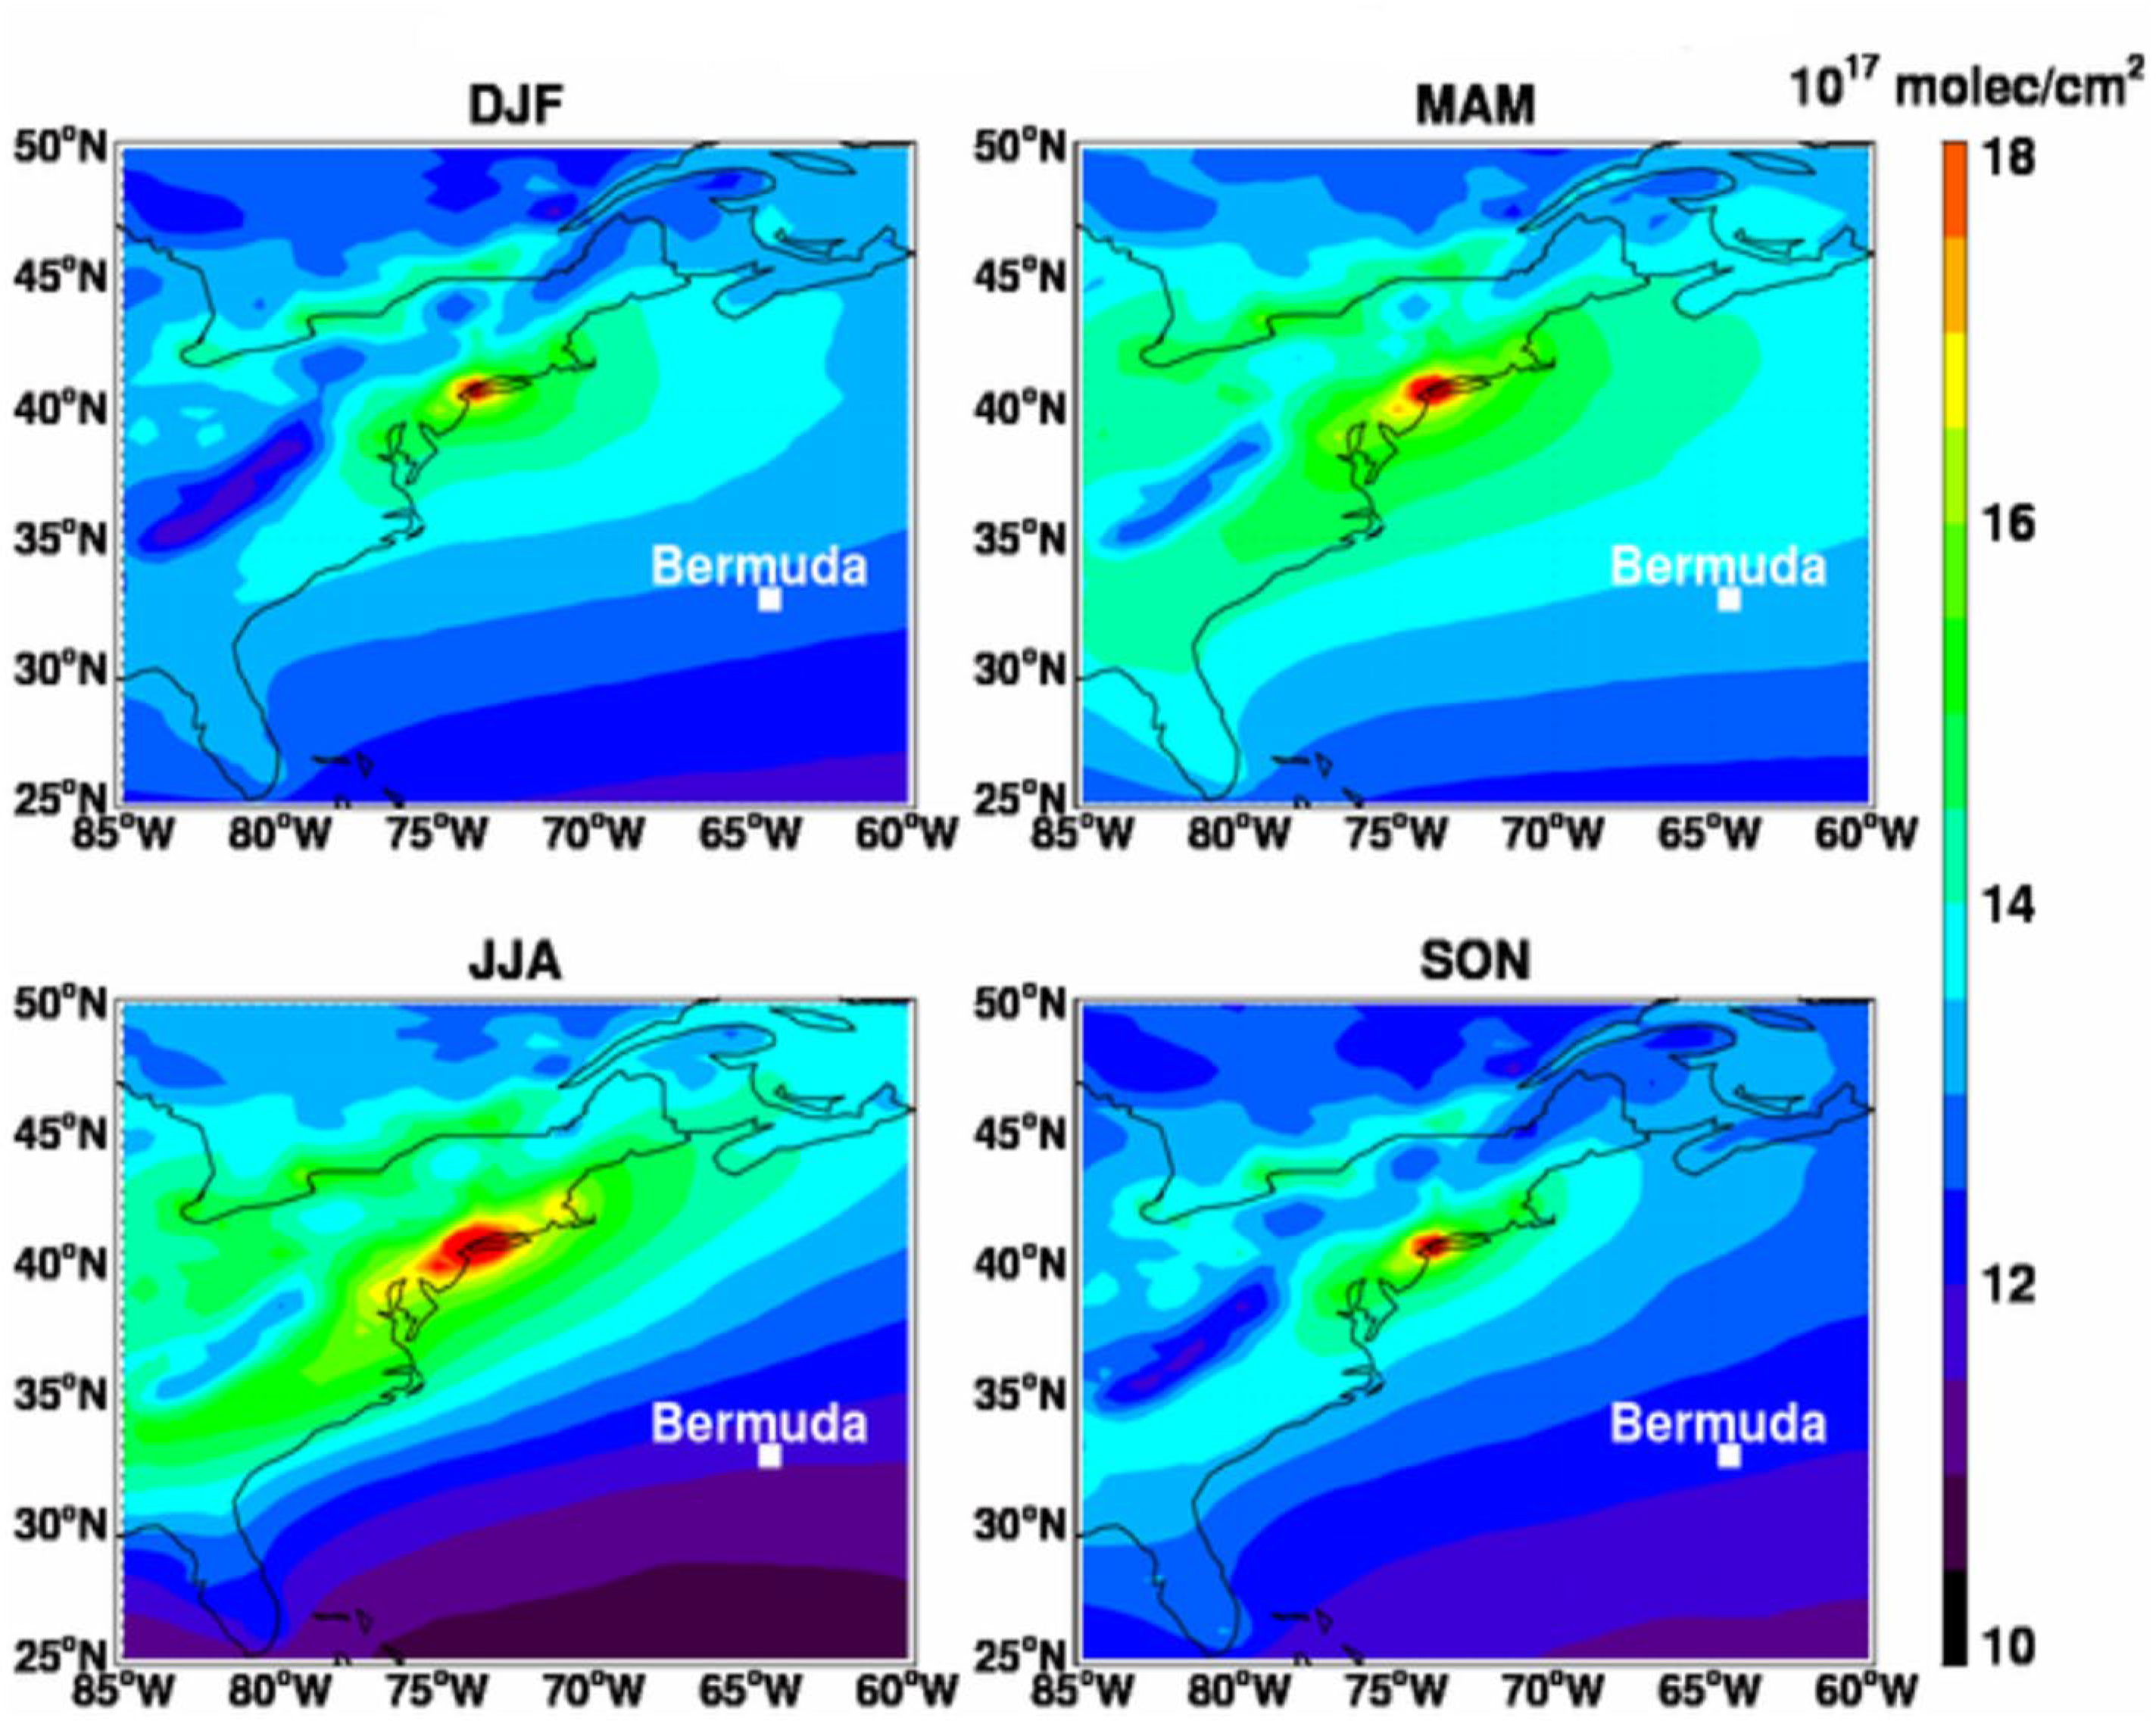
MERRA-2 tropospheric CO column (molecules cm−2) over eastern North America and the Western North Atlantic Ocean (WNAO) region. Seasonal average values are shown for December-January-February (DJF), March, April, May (MAM), June, July, and August (JJA), and September-October-November (SON) between 2014 and 2018.
3.2.2. Ozone
Tropospheric O3 plays a key role in oxidizing processes in the atmosphere (Logan et al., 1981), primarily owing to it being the precursor of the hydroxyl radical (e.g., Levy, 1971). Ozone at the surface is known to be a threat to human health (WHO, 2006) and have an impact on natural vegetation and crop yield and quality (e.g., NRC, 1992). In the middle and upper troposphere, it is a greenhouse gas contributing to positive radiative forcing (Myhre et al., 2014). In contrast to CO, O3 is mainly produced secondarily via photochemical oxidation of volatile organic compounds, methane, and CO in the presence of NOx. The sources of these various precursors are both anthropogenic (e.g., fossil fuel and biofuel combustion) and natural (e.g., wildfires, biogenic hydrocarbon emissions, lightning NOx, biogenic NOx emitted from soils) (Cooper et al., 2014). An additional source of O3 in the troposphere is downward transport from the stratosphere (e.g., Levy et al., 1985).
Previous studies have compared and contrasted long-term model-calculated O3 concentrations (Parrish et al., 2014) and the evolution of the seasonal cycle in tropospheric O3 over northern midlatitudes between 1996 and 2011 (Parrish et al., 2013). Here we examine seasonally averaged tropospheric O3 column values calculated from assimilated O3 in MERRA-2 over eastern North America and the WNAO for a 5-year period (2014–2018; Figure 4). It shows a strong seasonal cycle, with the highest domain-wide mean concentration in JJA (45.42 ± 1.83 DU) and the lowest mean value in DJF (33.36 ± 2.59 DU). The peak values in JJA are immediately downwind of major urban centers over the ocean between 40° and 45°N. These regions are adjacent to sources of O3 precursor gases and within a reasonable transport distance given the fairly short atmospheric lifetime of O3 (~days to weeks) (Robson et al., 2018). There is a distinct difference in the latitudinal distribution of O3 between seasons, unlike CO, that points to the greater complexity of O3 photochemistry as well as stratospheric input to the troposphere; more specifically, in MAM there is a band of highest values between approximately 25° and 35°N, whereas in JJA there is a clear gradient from low to high values over the ocean from 25° to 45°N. A strong seasonal cycle of O3 over the WNAO was also reported by others (Parrish et al., 2014; Robson et al., 2018). For polluted continental areas in the northern mid-latitudes, a peak is expected in the summer owing to pronounced photochemical activity, whereas over more remote continental areas the peak often is in late spring due to both stratospheric inputs and photochemical production over the entire Northern Hemisphere (Parrish et al., 2013). Furthermore, an O3 maximum in very clean and remote atmospheres is expected in spring (Holton et al., 1995; Monks, 2000), which is consistent with Figure 4 showing relatively high values over the open ocean and with a domain-wide mean concentration of 43.80 ± 1.54 DU. The intriguing spatial distribution and generally high values in MAM are supportive of a broader northern hemispheric spring O3 phenomenon as others have noted (e.g., Monks, 2000). In particular, the seasonal cycle of tropospheric O3 column over Bermuda shows a springtime maximum (Figure 4), which is consistent with O3 vertical profile measurements (Oltmans et al., 1996). The chemical transport model analysis by Q. Li et al. (2002) indicated that transport of North American pollution behind cold fronts is mainly responsible for the springtime surface O3 maximum at Bermuda. The latitudinal profile of O3 in DJF resembles that of JJA (i.e., low to high from south to north) whereas that in SON is similar to MAM except the band of peak O3 levels is shifted slightly to the north between approximately 30° and 40°N.
Figure 4.

MERRA-2 tropospheric O3 column (Dobson Units [DU]) over eastern North America and the Western North Atlantic Ocean (WNAO) region. Seasonal average values are shown for December-January-February (DJF), March, April, May (MAM), June, July, and August (JJA), and September-October-November (SON) between 2014 and 2018.
3.2.3. Total and Speciated AOD
To expand upon the aerosol composition analysis of the U.S. East Coast from Section 3.1.1, a summary of aerosol characteristics is now presented for both the U.S. East Coast and the WNAO region using columnar data that offer broader spatiotemporal coverage. It is cautioned from the outset that while comparisons are presented between these AOD results and the surface data from Section 3.1.1, AOD is a vertically integrated quantity of the entire atmospheric column. Seasonal maps of total and speciated AOD show the temporal variability of different pollution sources over the broad study region (Figure 5 and Figures S10–S12). Total and speciated AOD exhibited strong seasonal variability, with key details described below.
Figure 5.

MERRA-2 total and speciated (sea salt, SO42−, black carbon, organic carbon, and dust) aerosol optical depth (AOD) over eastern North America and the Western North Atlantic Ocean (WNAO) region for June, July, and August (JJA) between 2014 and 2018. MERRA-2 total speciated for December-January-February (DJF), March, April, May (MAM), and September-October-November (SON) can be found in the SI (Figures S10–S12).
The domain-wide AOD during DJF (0.112 ± 0.019) was the lowest of any season over the WNAO (Figure S10), while the highest values were observed during the MAM (0.162 ± 0.027; Figure S11) and JJA (0.165 ± 0.031; Figure 5) seasons. Sea salt and SO42− are the largest contributors to total AOD regardless of season. Sea salt in particular exhibits the highest mean domain-wide AOD values during DJF (0.033 ± 0.096) and SON (0.037 ± 0.073; Figure S12) and the lowest mean value in JJA (0.027 ± 0.060). Albeit small, differences in sea salt between those seasons may be linked to the dependence of sea salt emissions on wind speed (friction velocity), with stronger winds in DJF and weaker winds in JJA. IMPROVE results showed the highest sea salt mass concentrations in the MAM season (Figure 1) with the exception of the northernmost site (Acadia NP), which showed highest levels in DJF (Figure S1) and, thus, was consistent with the MERRA-2 results. Almost all IMPROVE sites showed the lowest sea salt concentrations in JJA (except Casco Bay in SON), consistent with the MERRA-2 results.
North American pollution outflow to the WNAO is apparent from the spatial AOD distribution of SO42−, black carbon, and organic carbon (Figure 5 and Figures S10–S12), which are in close agreement with the spatial pattern of CO (Figure 3). Higher SO42− AOD can be observed along the North American East Coast with a decreasing gradient moving east over the Atlantic Ocean. The maximum domain-wide SO42− AOD occurred during MAM (0.065 ± 0.120) and JJA (0.067 ± 0.129) with a minimum value during SON (0.047 ± 0.087). These results are in good agreement with IMPROVE data along the coast showing the highest ammonium sulfate concentrations usually in either MAM or JJA with minimum values in SON for almost all sites. The total AOD attributed to black carbon was low over the broader study region, in accordance with IMPROVE data results for elemental carbon, which was a very minor component of RCFM. No seasonal difference was observed for black carbon AOD between MAM (0.008 ± 0.013) and JJA (0.008 ± 0.015) or between DJF (0.005 ± 0.010) and SON (0.005 ± 0.011). Organic carbon aerosols become more important in the increasingly photochemically active seasons (MAM [0.035 ± 0.062] and JJA [0.043 ± 0.116]) and especially in JJA as already confirmed by the surface IMPROVE data.
IMPROVE data earlier suggested that North African dust influence was strongest over the southeast U.S. (especially Florida) in JJA, while Asian dust impacted the northeast U.S. more significantly in MAM (Aldhaif et al., 2020). The speciated AOD results support the IMPROVE findings in terms of the location of the dust local maximum for various seasons over the WNAO (i.e., in southern parts in JJA and in northern parts in MAM). Average domain-wide values for dust AOD were 0.024 ± 0.033 and 0.021 ± 0.051 for MAM and JJA, respectively.
The previous spatial maps could not illustrate vertical profiles, which are important for describing the degree of vertical mixing in different atmospheric layers, in addition to identifying the potential for long-range transport for different aerosol types. For insight into the vertical structure of total and speciated aerosol mass, we analyze MERRA-2 aerosol mass mixing ratio for two latitudinal bands at 32°N and 37°N, which are representative of the WNAO region. The former and latter are representative of horizontal bands containing Bermuda and Hampton, Virginia (U.S.), respectively, which are of significance owing to being major bases for both surface-based atmospheric research and aircraft flights (Sorooshian et al., 2020). Since similar features were observed for both latitudinal bands (32°N and 37°N), only vertical profiles for the summer along the 32°N parallel are presented in Figure 6. Additional figures for other seasons and for both latitudes are Figures S13–S19.
Figure 6.

Longitude-pressure cross-sections of MERRA-2 total and speciated (sea salt, SO42−, black carbon, organic carbon, and dust) aerosol mass mixing ratios (μg m−3 Standard Temperature and Pressure [STP]) at a latitude of 32°N. Values represent the seasonal average for June, July, and August (JJA) between 2014 and 2018. Black vertical lines are representative of the longitudinal boundaries (60°–85°W) of the Western North Atlantic Ocean (WNAO) region as defined in this work. The white areas represent the topography diagnosed from local surface pressure.
The vertical profiles of the total aerosol mass mixing ratio at 32°N reveal stronger transport and mixing to the free troposphere during JJA (Figure 6), especially when compared to the season with least mixing (DJF; Figure S13). Intercontinental aerosol transport in the upper troposphere is suggested in Figures 6 and S13–S15 and manifested in a plume-like structure with modest longitudinal variability as compared to the low altitude mixing ratios. This is more pronounced for SO42−, black carbon, and organic carbon aerosols in the colder seasons (DJF, SON) when their mass mixing ratios show a minimum in the middle troposphere over the WNAO. The enhanced levels of these three aerosol types in the free troposphere over the WNAO can be linked to large-scale vertical transport and convective mixing of aerosols (or their precursors) out of the boundary layer over the North American continent (e.g., Fast et al., 2016) or long-range transport. In boreal summer, a prominent feature in the tropospheric aerosol distribution is the Asian Tropopause Aerosol Layer (ATAL), a layer of aerosol enhancements in the upper troposphere formed by convective lifting of pollution from Asian sources such as fossil fuel combustion and deserts (e.g., Himalayas-Gangetic Plain, Sichuan Basin) during the Asian Summer Monsoon (Fairlie et al., 2020; Lau et al., 2018; Vernier et al., 2011). The long-range transport of the ATAL aerosols (and precursors) to the rest of the world, including the WNAO, warrants more research. For example, the upcoming Asian summer monsoon Chemical and CLimate Impact Project (ACCLIP; https://www.eol.ucar.edu/field_projects/acclip) will investigate the transport pathway of ATAL-associated air to the global upper troposphere and lower stratosphere (UTLS).
As expected, sea salt is mostly confined in the boundary layer and close to its chief source (i.e., the ocean surface), in agreement with airborne measurements (e.g., Murphy et al., 2019; Reid et al., 2001; Schlosser et al., 2020). Similar to sea salt, dust generally decreased with altitude but was different in that significantly high levels remained up to higher altitudes especially in MAM and JJA with some degree of layering. As already shown, MAM and JJA are the two seasons characterized by long-range transport from regions such as Asia and Africa, respectively. As stressed in past work (Colarco et al., 2003; Peyridieu et al., 2010) and motivated by these results, additional characterization of the vertical distribution of dust, especially in relation to clouds, is important for future work over the WNAO. This aerosol type likely has variable physicochemical properties based on its source region and transport pathway that have yet to be characterized in a comprehensive way across the WNAO.
The MERRA-2 AOD and mass mixing ratio analysis is complemented with the vertically resolved aerosol extinction coefficient from CALIOP (note that AOD is defined as the vertically integrated aerosol extinction coefficient). We overcome the sparse spatial sampling of CALIOP by averaging aerosol extinction profiles for three WNAO sub-domains: South (25°–32°N, 82°–72°W, black), Central (32°–39°N, 78°–68°W, red), and North (39°–45°N, 72°–62°W, black). The profiles of aerosol extinction coefficient feature seasonal changes consistent with the total AOD maps (Figure 7). For example, maximum extinctions below 1 km are observed in MAM and JJA for the South and Central sub-domains, in agreement with AOD. Moreover, there are impressively high aerosol extinctions in the free troposphere (>1.5 km) for spring and summer, with the fraction of AOD contributed by aerosols above 1.5 km in summer being 22%, 31%, and 35% over the South, Central, and North sub-domains, respectively. In contrast, aerosols are mainly confined to the boundary layer (<1.5 km) in DJF, accounting for 89% (South), 84.4% (Central), and 87% of the total AOD (11%, 15.6%, and 13% free tropospheric contribution). It is also striking that there are such similar extinction profiles for the three sub-domains in DJF, with a relatively homogeneous vertical structure for the Central and North regions, suggestive of a well-mixed boundary layer. Given the complex vertical variability of aerosol extinction coefficient, it is clear that surface observations and AOD alone are insufficient for characterizing boundary layer aerosols, and their role as CCN in stratiform and shallow cumulus clouds.
Figure 7.

Seasonal mean aerosol extinction coefficient at 532 nm from CALIOP for three regions over the Western North Atlantic Ocean (WNAO): South (25°–32°N, 82°–72°W, black), Central (32°–39°N, 78°–68°W, red), and North (39°–45°N, 72°–62°W, black).
3.2.4. Airborne Remotely Sensed Aerosol Properties
Aerosol microphysical and optical properties inferred from airborne RSP measurements obtained during TCAP in July 2012 and SABOR in July 2014 are presented in Figure 8, together with a tabulation of mean values in Table S10. The results are broadly consistent with the MERRA-2 climatology in JJA (Figure 6), where a clear gradient from high to low total AOD values was observed from the East Coast to over the open Atlantic Ocean.
Figure 8.
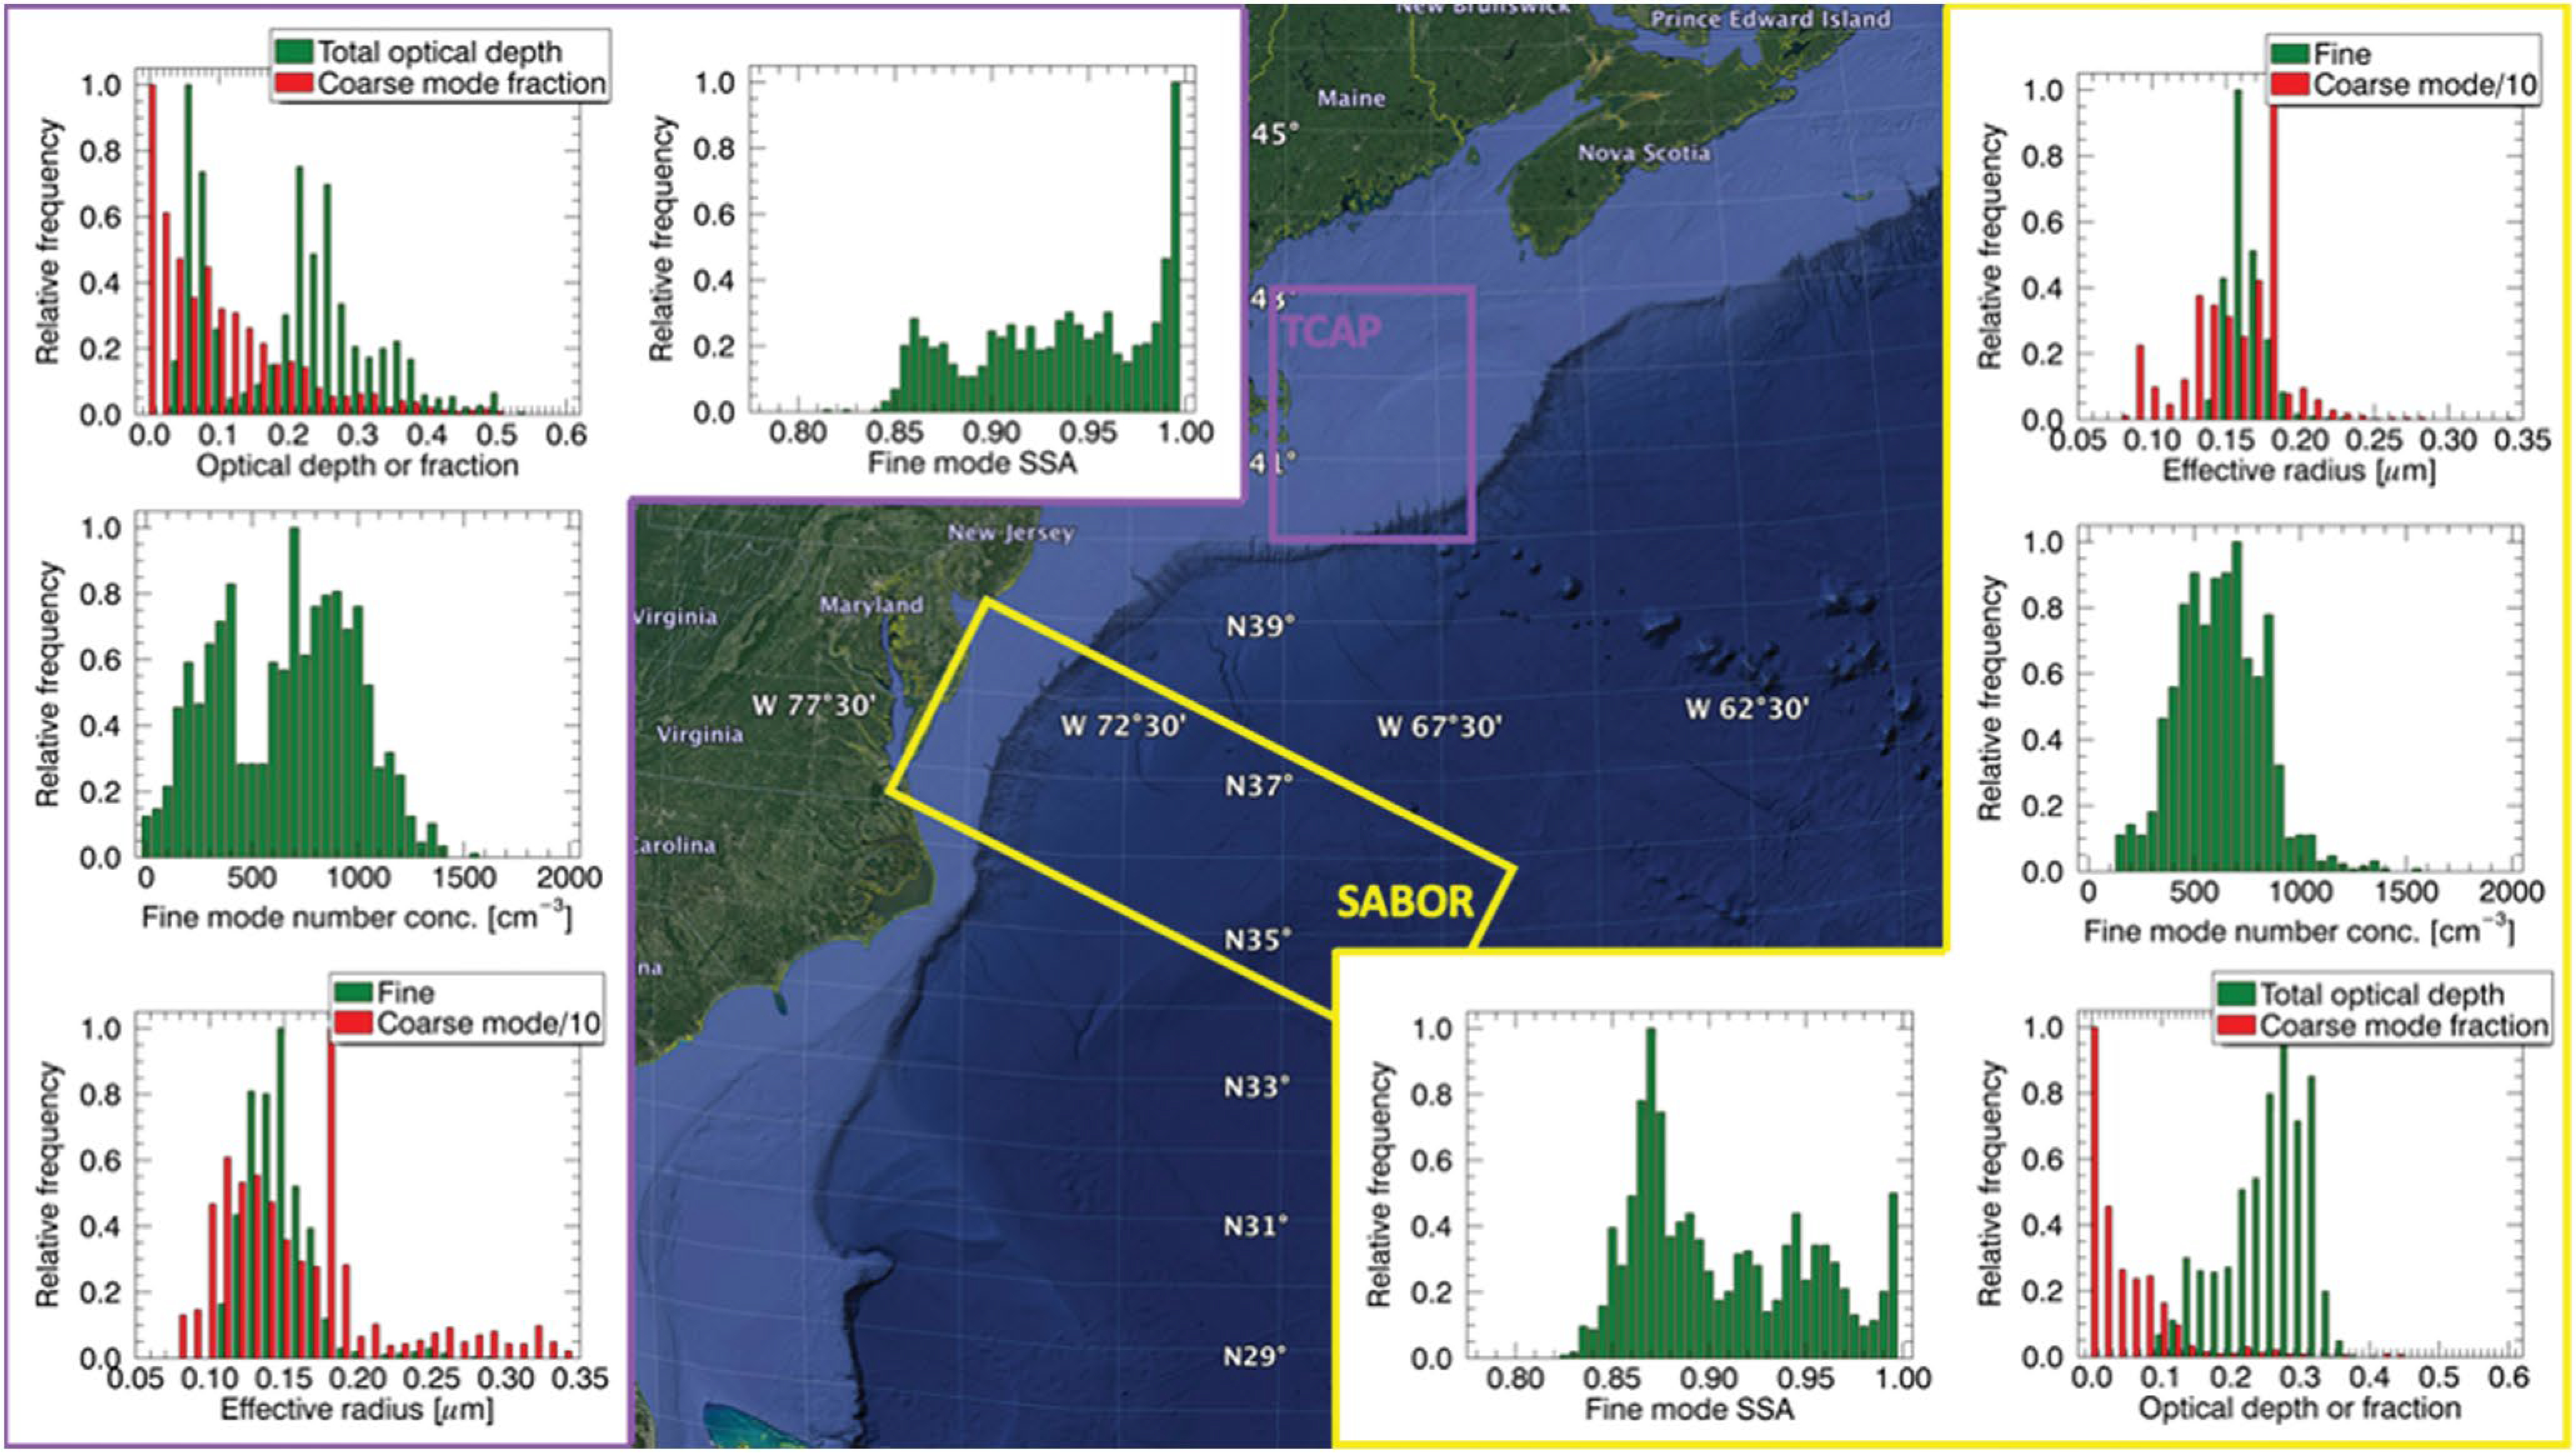
Summary of remotely sensed aerosol properties inferred form airborne Research Scanning Polarimeter (RSP) measurements during the Two-Column Aerosol Project (TCAP) (N = 1,172; left panels outlined in purple) and Ship-Aircraft Bio-Optical Research (SABOR) (N = 1,227; right panels outlined in yellow) field campaigns over the Western North Atlantic Ocean (WNAO). Note that aerosol optical depth (AOD) and single scattering albedo (SSA) are defined at 555 nm. The coarse mode fraction is defined as fraction of coarse mode optical depth relative to the total optical depth. Numerical average values for properties shown here are summarized in Table S10.
The northern TCAP region is characterized by mildly absorbing aerosol mixtures indicative of sulfates and organic carbon (Berg et al., 2016) with a mean SSA of 0.94. In contrast, the more southern SABOR region is dominated by more strongly absorbing aerosol (smaller values of SSA, with a mean value of 0.91) consistent with a larger contribution by black carbon and with somewhat larger aerosol sizes. However, this example also illustrates the spatiotemporal variations on small scales that are relevant for airborne campaigns such as the ongoing multi-year ACTIVATE mission. For example, during TCAP, a weather system progressed through the area on July 20, 2012, bringing increased wind speeds and precipitation. After this event, mean AOD values, fine mode number concentrations, and the fraction of light absorbed (single scattering co-albedo) were, respectively, 30%, 36%, and 53% of their previous values, while the mean coarse mode of AOD and coarse mode effective radius were higher by 11% and 34%, respectively. These changes are consistent with a decreased contribution of sulfates and organics and increased sea salt loading and particle size. The impact of this weather system is apparent in the bimodal distributions of the fine mode number concentration and optical depth. Higher number concentrations (>500 cm−3) were observed before the passage of the weather system through the TCAP operating area, while lower values (<500 cm−3) were recorded afterward. A similar bimodal distribution is noted for the optical depth with values above 0.1 before the weather system and subsequently below this value (<0.1) once the weather system was over.
During SABOR, in addition to aerosols from local sources, there was variable but persistent, transported smoke in the free troposphere (Stamnes et al., 2018) from summertime forest fires in the northwestern U.S. and Canada that contributed to generally lower values of SSA (50% of points below 0.90) compared to TCAP (77% of points above 0.90). Although both TCAP and SABOR exhibited SSAs no less than 0.84, this observation is in agreement with Lacagnina et al. (2015) that linked low SSAs during JJA to forest fires. Single scattering albedo values in other regions for smoke particles varied as follows: 0.81–0.89 in Southern Africa (Magi et al., 2003) and 0.80–0.85 at mid-latitudes (Levine, 1991). In contrast, and pointing to the complexity of different types of wildfires and plume history, other reports of SSA from wildfire samples over North America ranged from 0.90 to 0.99 (e.g., Corr et al., 2012; Shingler et al., 2016), where the enhancement in scattering was attributed to aging. During SABOR, the higher SSAs come primarily from near-shore observations where weakly absorbing aerosols from local sources contribute more to the total amount of aerosols than farther offshore. This interpretation is consistent with the aerosol typing provided by HSRL measurements (Burton et al., 2012), where near-shore observations revealed urban pollution in the boundary layer with smoke above (Stamnes et al., 2018). The smoke during SABOR showed a similar spatial pattern of decrease in optical depth due to dilution as the air mass moved offshore, consistent with results already shown for CO. However, little change in the fine mode SSA or particle size (i.e., effective radius) was observed as the optical depth decreased offshore. Any changes would be small compared to the weather system-induced change during TCAP. The analysis is complicated by limited sampling across different air masses and long and short-range transport. Even though most of the coarse mode effective radius retrievals for both field campaigns are in the same range (0.9–2.1 μm), during TCAP the coarse mode had greater variability with values between 0.8 and 3.4 μm.
3.3. Long-Term Observations and Simulations
3.3.1. Carbon Monoxide
For another perspective on the CO data over the WNAO region, Figure S20 shows the Mann-Kendall pixel-based normalized S statistics (range between −1 and −0.5) for monthly data for the 16-year period between 2003 and 2018. Negative normalized S statistics indicate a long-term decrease and positive values show an increase in CO. To investigate the presence of a statistically significant trend, the non-parametric Mann-Kendall method considers the relative ranks of CO values in a time series and yields information on whether the null hypothesis of an insignificant monotonic trend in data at the 95% confidence level can be rejected or not. A long-term decrease is dominant over the WNAO, consistent with regulatory efforts aimed to reduce anthropogenic emissions.
As a major sink of OH (Thompson, 1992) and a source of peroxyl radicals (Honrath et al., 2004), CO plays an important role in tropospheric chemistry. Carbon monoxide’s long-term decrease is significant as controlling emissions of precursor gases like methane and CO can significantly reduce the growth rate of tropospheric O3 concentrations (Thompson, 1992). A strong correlation between CO and O3, especially during the summer, shows that pollution transport from the United States appears to provide a significant contribution to the total tropospheric O3 over the Northern Hemisphere (Chin et al., 1994). Important effects on tropospheric chemistry and budgets of these and other related gases have been documented at downwind sites such as Bermuda (Milne et al., 2000) and the Azores (Honrath et al., 2004).
3.4. Aerosols
To study inter-annual variability and long-term analysis of aerosols over the WNAO and the East Coast of North America, a 35-year (1980–2014) historical model simulation is analyzed using the aerosol-climate model CAM5-EAST. As a first step to gain confidence in the analysis, aerosol spatial distributions are compared to MERRA-2 results from Section 3.2.3. Consistent with MERRA-2 results, AOD peaks in JJA over the WNAO and the East Coast of North America with dominant anthropogenic contributions near the continent and natural sources over the remote ocean (mostly sea salt but having evidence of long-range transported dust in the subtropics). Sea salt dominates AOD over the remote ocean in other seasons (Figure 9). Note that the AOD simulated in CAM5-EAST is lower than that in MERRA-2, especially in the MAM (Figure S11). This is likely due to the use of different anthropogenic emission datasets and higher contributions from dust and sea salt in MERRA-2 associated with data assimilation (Randles et al., 2017; Wu et al., 2020).
Figure 9.

Spatial distribution of seasonal aerosol optical depth (AOD), averaged over 2005–2014, contributed by all types of aerosol simulated in CAM5-EAST (left panels; including SO42−, primary organic matter, black carbon, secondary organic aerosol, dust, and sea salt) and by anthropogenic and biogenic aerosols only (right panels; excluding dust and sea salt). The black boxes mark the domain of interest (60°–85°W, 25°–50°N) for more detailed analyses shown in subsequent figures.
The CAM5-EAST simulated the annual mean column burdens (mg m−2) of SO42−, black carbon, and primary organic matter for a period between 1980 and 2014 over the WNAO region. The column burden has a long-term decrease, mostly due to the reduction in U.S. domestic emissions with the relative contribution primarily coming from the eastern U.S. (NEU and SEU, Figure S21). In recent years, foreign emissions (e.g., EAS) have become more important to the column burden near the U.S. East Coast (Yang et al., 2018). The annual mean near-surface SO42, black carbon, and primary organic matter concentrations are predominantly from northeastern and southeastern U.S. sources. All three types of aerosols have a long-term decrease with SO42− being the strongest. Therefore, the CAM5-EAST trend analysis is consistent with previous reports (e.g., Yang et al., 2018) that regulatory activities have yielded significant reductions in major anthropogenic constituents in the atmosphere of both the WNAO and North American East Coast regions (Figure S22).
Simulated CAM5-EAST SO42− concentrations agree well with the IMPROVE site observations for all four seasons (Figure 10a). Nevertheless, CAM5-EAST substantially underestimates near-surface black carbon concentrations in all seasons (Figure 10b) likely due to an overly strong wet removal and/or large uncertainty in black carbon emissions (e.g., H. Wang et al., 2013; Yang et al., 2018). The organic aerosol concentrations in the eastern U.S. are strongly overestimated by CAM5-EAST, especially in JJA and SON (Figure 10c). The organic aerosol is mainly contributed by secondary organic aerosol, which is crudely treated in many climate models, including CAM5-EAST (e.g., H. Wang et al., 2020). Future work is certainly warranted to continue improving modeling of these aerosol processes and features.
Figure 10.
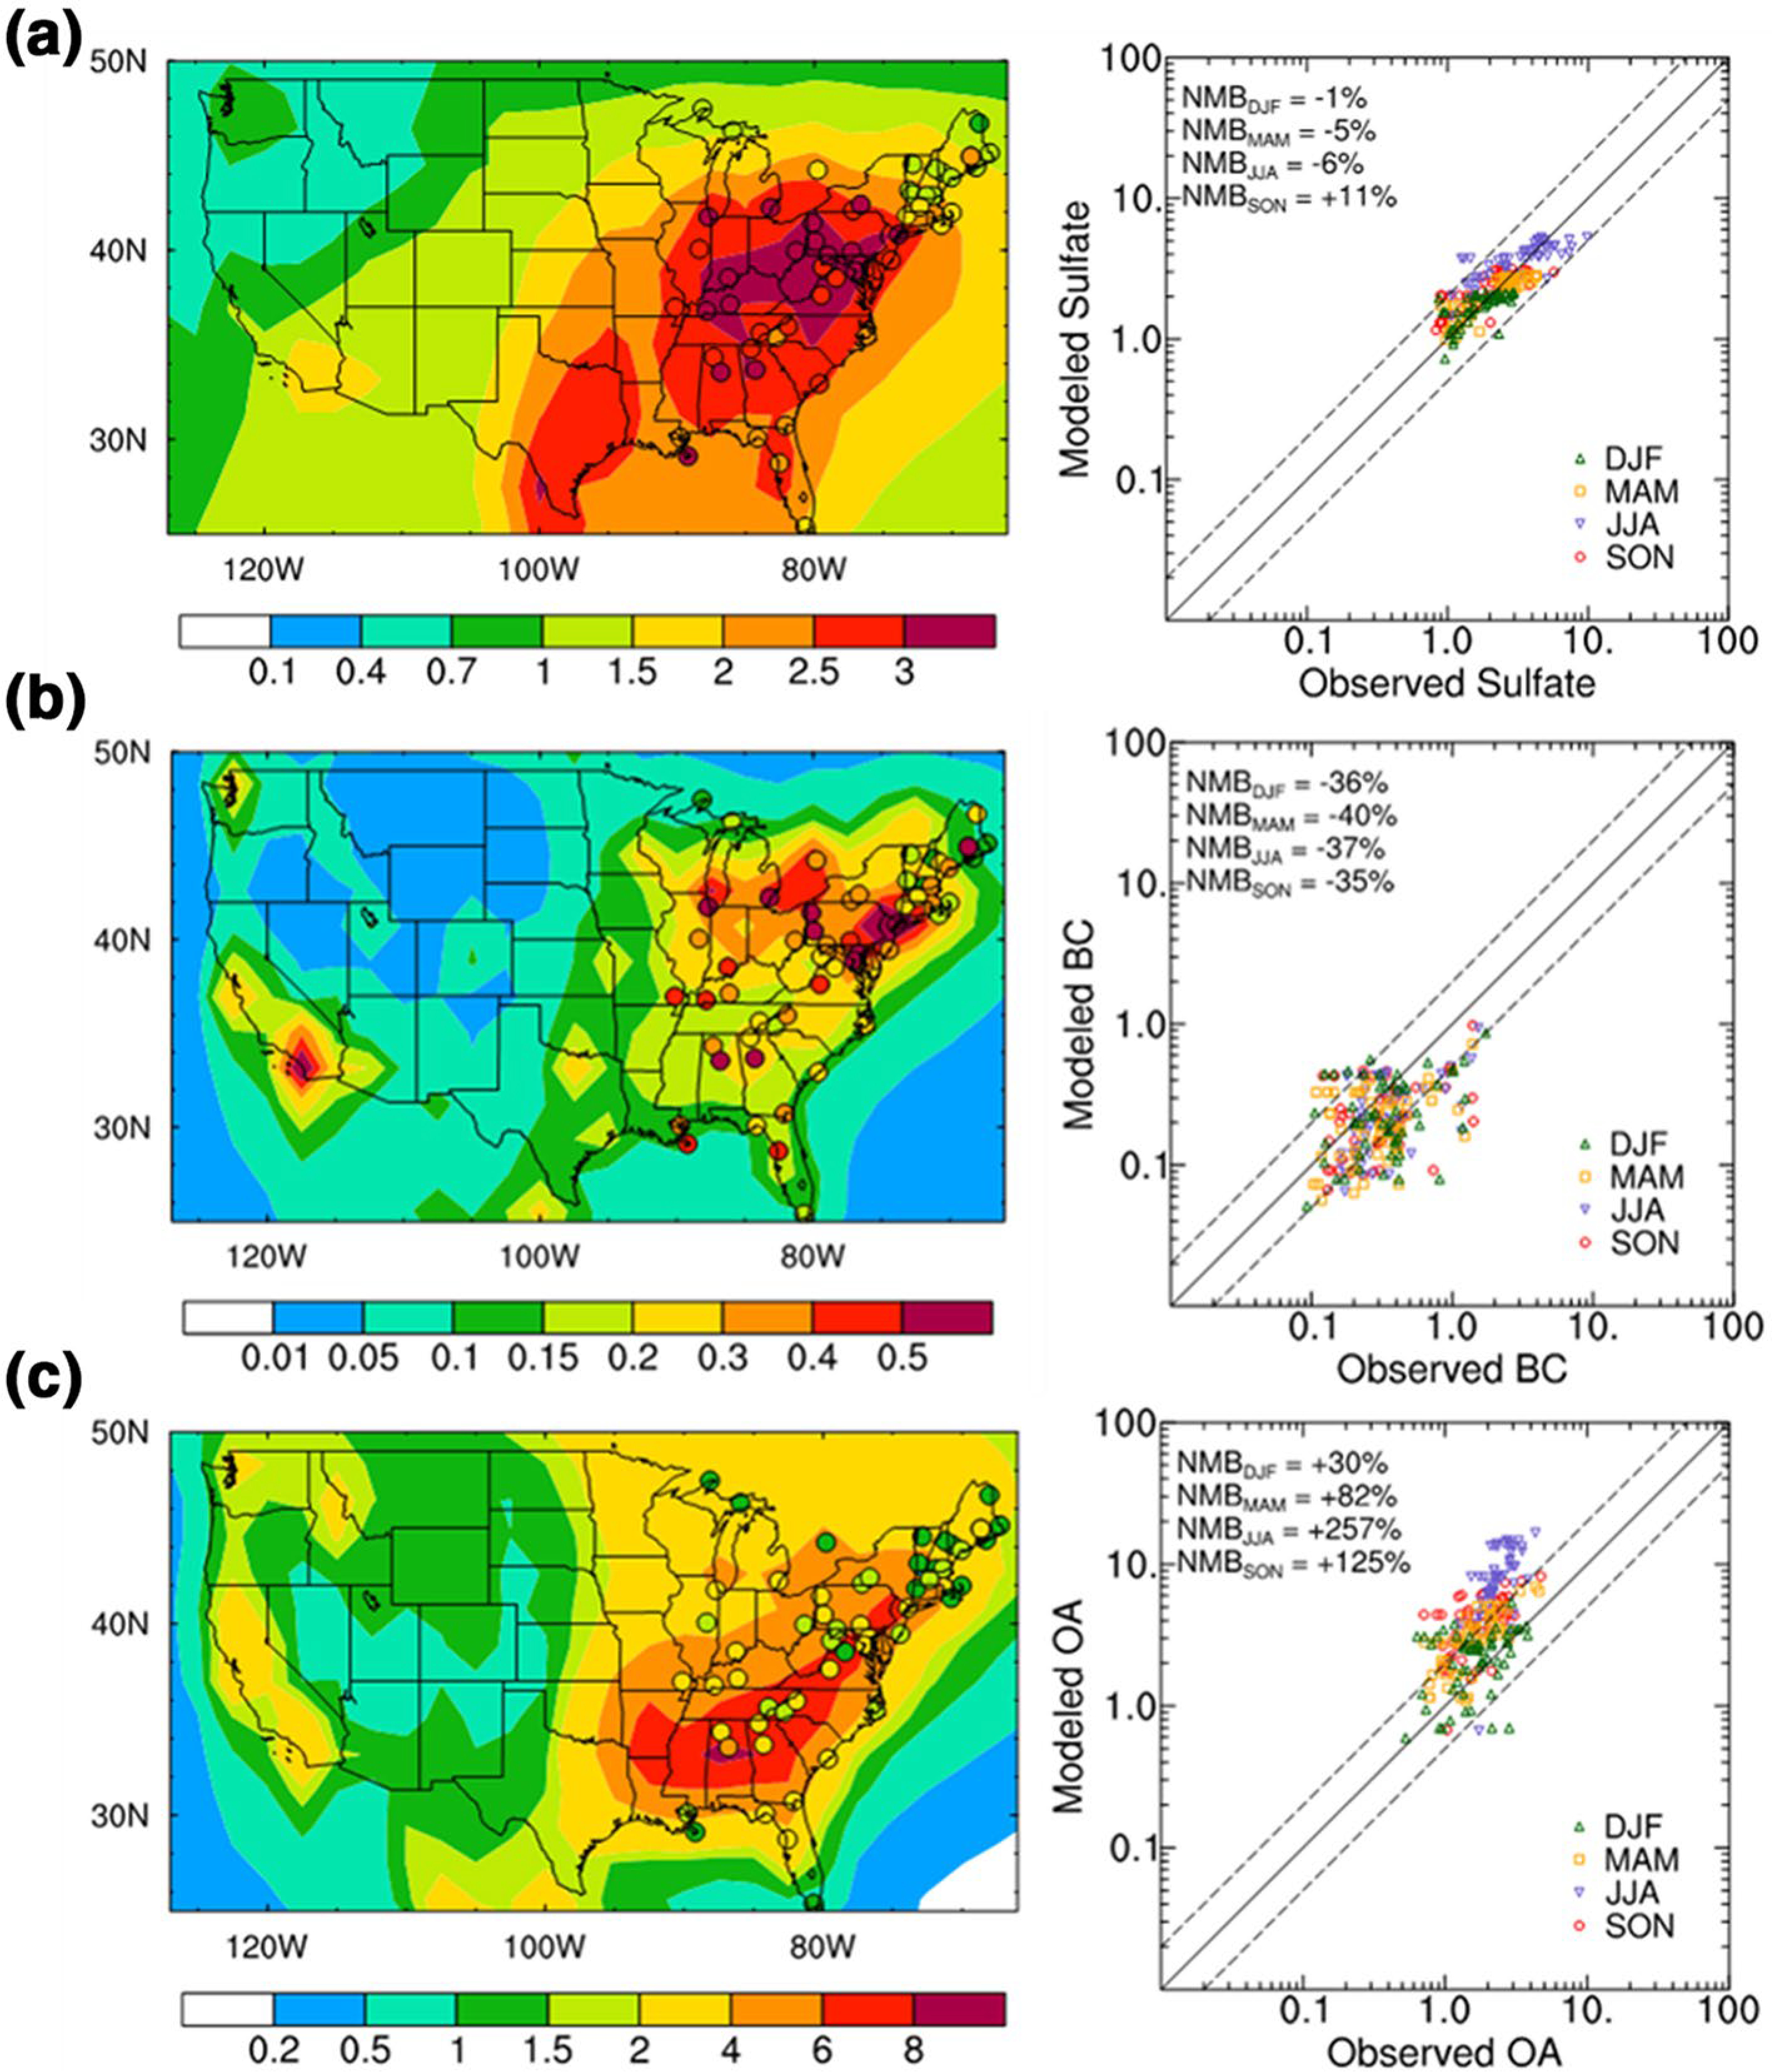
Spatial distribution of CAM5-EAST simulated near-surface for (a) SO42−, (b) black carbon, and (c) organic aerosol (OA = primary organic matter + secondary organic aerosol) concentrations (μg m−3) and observations from IMPROVE, denoted by background colors and filled circles, respectively, averaged over 2005–2014 (left panels) and scatter plots between the simulated and observed seasonal mean concentration at the IMPROVE sites (right panels). The solid line in the right panels marks the 1:1 ratio, and dashed lines mark the 1:2 and 2:1 ratio. Numbers at the upper left corner are the normalized mean bias (NMB, %) for each season calculated as NMB = 100%×Σ(Mi − Oi ) / ΣOi, where Mi and Oi denote modeled and observed values, respectively, at site i.
4. Conclusions
This study is the first in a 2-part series examining the atmospheric characteristics over the North American East Coast and WNAO. The focus of this manuscript was to analyze surface observational, satellite, reanalysis, and model simulation datasets to summarize the spatial and temporal properties of gas, aerosol, and wet deposition chemistry. Key findings include the following:
The majority of U.S. East Coast sites exhibited their peak RCFM levels in JJA, assisted in part by secondary aerosol formation, dust, and biomass burning. A couple of sites in the Northeast U.S. instead peaked in DJF, likely driven by wintertime biomass burning. RCFM was generally dominated by organic matter and ammonium sulfate. Dust from Northern Africa was most influential for sites south of Cape Cod in Massachusetts, especially for JJA. In contrast, other sources of dust (presumably Asian dust) were more influential at Cape Cod and to the north, especially for MAM. Elemental carbon was the least abundant RCFM constituent for all sites (<6 ± 3%), with the highest mass fraction reported in the northeastern site of Casco Bay regardless of the season.
Wet deposition pH ranged seasonally between 4.5 and 5.4 along the East Coast and was usually highest in MAM owing partly to the abundance of alkaline species associated with dust. Sea salt constituents, Cl− and Na+, dominated the wet deposition ion concentrations for all sites for most seasons. For many sites, NO3− was the most abundant species in JJA. Numerous differences exist between the spatiotemporal profiles of wet deposition chemistry versus RCFM composition warranting additional investigation.
Tropospheric CO showed a clear gradient from high to low values from the East Coast to over the open ocean, regardless of season. Maximum domain-wide values were in MAM. JJA exhibited the widest variability in CO values, with the overall highest values of any season observed over the U.S. East Coast near to New York City due largely to oxidation of volatile organic compounds.
Tropospheric O3 was highest in JJA and lowest in DJF owing to peak photochemical activity in the former season. However, relatively high values were also observed in MAM with a different spatial pattern over the WNAO, signifying the greater complexity of O3 inputs to the troposphere as compared to CO. More specifically, the different behavior in MAM is due to broader hemisphere-wide processes associated with stratospheric input and photochemical production.
AOD exhibited maximum domain-wide values during JJA and lowest values in DJF, with sea salt and SO42− being the most dominant components. Seasonal differences in free tropospheric aerosols are apparent from CALIOP data, with a higher fraction of the total AOD contributed by the free tropospheric in JJA, whereas aerosols are primarily confined to the boundary layer in DJF. Sulfate, black carbon, and organic carbon exhibit spatial distributions similar to CO indicative of outflow and dilution off the North American East Coast, as was confirmed by airborne remote sensing data. Dust AOD is relatively more enhanced in the southern part of the WNAO in JJA while a seasonal maximum for the northern region appears in MAM (like IMPROVE data), with the seasonal mismatch likely linked to different dust sources.
Stronger transport and mixing to the free troposphere are evident during JJA in contrast to DJF, which has the least mixing. Sulfate, black carbon, and organic carbon exhibited more layering in the colder seasons (DJF, SON) due in part to emissions from Asian sources (e.g., fossil fuel combustion and deserts) lifted via deep convection to form the ATAL during the Asian Summer Monsoon.
Long-term analysis of CO and speciated aerosols confirm that regulatory activities have resulted in significant reductions in pollutants stemming from anthropogenic sources. Of the aerosol components simulated, SO42− exhibited the steepest decline in concentration relative to black carbon and primary organic matter. Foreign emissions (e.g., East Asia) appear to have become more important to the column burden near the U.S. East Coast in recent years.
Supplementary Material
Key Points:
Significant reductions in CO and particulate SO42−, black carbon, and primary organic matter are observed over multiple decades
High aerosol extinctions in free troposphere during March-April-May and June-July-August, whereas aerosols mostly confined to boundary layer at other times
Organic matter and ammonium sulfate usually dominated PM2.5 composition, whereas sea salt was most abundant in wet deposition
Acknowledgments
The authors acknowledge funding from NASA grant 80NSSC19K0442 in support of ACTIVATE, a NASA Earth Venture Suborbital-3 (EVS-3) investigation funded by NASA’s Earth Science Division and managed through the Earth System Science Pathfinder Program Office. H. Liu and B. Zhang acknowledge funding support from NASA grant 80NSSC19K0389. H. Wang and Y. Yang the Pacific Northwest National Laboratory (PNNL) also acknowledge support by the U.S. DOE Office of Science, Biological and Environmental Research as part of the Earth and Environmental System Modeling (EESM) program. PNNL is operated for the DOE by Battelle Memorial Institute under contract DE-AC05-76RLO1830. The authors acknowledge helpful comments in the preparation of this manuscript by Xubin Zeng and Michael Brunke.
Footnotes
Supporting Information:
Data Availability Statement
Data products used in this work are available at websites summarized above and also here again: IMPROVE and NADP/NTN (http://views.cira.colostate.edu/fed/), NASA products(https://search.earthdata.nasa.gov/search). The CAM5-EAST simulations were performed and archived at DOE’s National Energy Research Scientific Computing Center (NERSC). The data are available through a data repository on the ACTIVATE website (https://www-air.larc.nasa.gov/cgi-bin/ArcView/activate.2019?MANUSCRIPT=1). Part of the data analysis was done using computer resources provided by the NASA Center for Climate Simulation (NCCS) at Goddard Space Flight Center.
References
- Ahmady-Birgani H, Ravan P, Schlosser JS, Cuevas-Robles A, AzadiAghdam M, & Sorooshian A (2020). On the chemical nature of wet deposition over a major desiccated lake: Case study for Lake Urmia Basin. Atmospheric Research, 234, 104762. [Google Scholar]
- Akagi S, Yokelson RJ, Burling I, Meinardi S, Simpson I, Blake DR, et al. (2013). Measurements of reactive trace gases and variable O3 formation rates in some South Carolina biomass burning plumes. Atmospheric Chemistry and Physics, 13, 1141–1165. [Google Scholar]
- Aldhaif AM, Lopez DH, Dadashazar H, & Sorooshian A (2020). Sources, frequency, and chemical nature of dust events impacting the United States East Coast. Atmospheric Environment, 231, 117456. [DOI] [PMC free article] [PubMed] [Google Scholar]
- Aryal RP, Voss KJ, Terman PA, Keene WC, Moody JL, Welton EJ, & Holben BN (2014). Comparison of surface and column measurements of aerosol scattering properties over the Western North Atlantic Ocean at Bermuda. Atmospheric Chemistry and Physics, 14(14), 7617–7629. 10.5194/acp-14-7617-2014 [DOI] [Google Scholar]
- Barrett TE, Ponette-Gonzalez AG, Rindy JE, & Weathers KC (2019). Wet deposition of black carbon: A synthesis. Atmospheric Environment, 213, 558–567. 10.1016/j.atmosenv.2019.06.033 [DOI] [Google Scholar]
- Bates DR, & Witherspoon AE (1952). The photo-chemistry of some minor constituents of the Earth’s atmosphere (CO2, CO, CH4, N2O). Geophysical Journal International, 6(5), 324–324. 10.1111/j.1365-246X.1952.tb03020.x [DOI] [Google Scholar]
- Beaupre SR, Kieber DJ, Keene WC, Long MS, Maben JR, Lu X, et al. (2019). Oceanic efflux of ancient marine dissolved organic carbon in primary marine aerosol. Science Advances, 5(10), eaax6535. 10.1126/sciadv.aax6535 [DOI] [PMC free article] [PubMed] [Google Scholar]
- Behrenfeld MJ, Moore RH, Hostetler CA, Graff J, Gaube P, Russell LM, et al. (2019). The North Atlantic Aerosol and Marine Ecosystem Study (NAAMES): Science motive and mission overview. Frontiers in Marine Science, 6, 122. 10.3389/fmars.2019.00122 [DOI] [Google Scholar]
- Berg LK, Fast JD, Barnard JC, Burton SP, Cairns B, Chand D, et al. (2016). The two-column aerosol project: Phase I—Overview and impact of elevated aerosol layers on aerosol optical depth. Journal of Geophysical Research: Atmospheres, 121(1), 336–361. 10.1002/2015jd023848 [DOI] [Google Scholar]
- Bosilovich M, Lucchesi R, & Suarez M (2016). MERRA-2: File Specification Note Global Modeling and Assimilation Office No. 9. Version 1.1.
- Buchard V, da Silva AM, Colarco PR, Darmenov A, Randles CA, Govindaraju R, et al. (2015). Using the OMI Aerosol Index and absorption aerosol optical depth to evaluate the NASA MERRA aerosol reanalysis. Atmospheric Chemistry and Physics, 15(10), 5743–5760. 10.5194/acp-15-5743-2015 [DOI] [Google Scholar]
- Buchard V, Randles CA, da Silva AM, Darmenov A, Colarco PR, Govindaraju R, & Yu H (2017). The MERRA-2 Aerosol Reanalysis, 1980 Onward. Part II: Evaluation and case studies. Journal of Climate, 30(17), 6851–6872. 10.1175/Jcli-D-16-0613.1 [DOI] [PMC free article] [PubMed] [Google Scholar]
- Burton SP, Ferrare RA, Hostetler CA, Hair JW, Rogers RR, Obland MD, et al. (2012). Aerosol classification using airborne high spectral resolution lidar measurements – Methodology and examples. Atmospheric Measurement Techniques, 5(1), 73–98. 10.5194/amt-5-73-2012 [DOI] [Google Scholar]
- Cairns B, Russell EE, & Travis LD (1999). The research scanning polarimeter: Calibration and ground-based measurements. Paper presented at the polarization: Measurement, analysis, and remote sensing II. [Google Scholar]
- Carlson TN, & Prospero JM (1971). Large-scale movement of Saharan Air impulses over Western Tropical Atlantic. Bulletin of the American Meteorological Society, 52(8), 283–297. [Google Scholar]
- Chan E, & Vet RJ (2010). Baseline levels and trends of ground level ozone in Canada and the United States. Atmospheric Chemistry and Physics, 10(18), 8629–8647. 10.5194/acp-10-8629-2010 [DOI] [Google Scholar]
- Chen QJ, Sherwen T, Evans M, & Alexander B (2018). DMS oxidation and sulfur aerosol formation in the marine troposphere: A focus on reactive halogen and multiphase chemistry. Atmospheric Chemistry and Physics, 18(18), 13617–13637. 10.5194/acp-18-13617-2018 [DOI] [Google Scholar]
- Chin M, Ginoux P, Kinne S, Torres O, Holben BN, Duncan BN, et al. (2002). Tropospheric aerosol optical thickness from the GOCART model and comparisons with satellite and Sun photometer measurements. Journal of the Atmospheric Sciences, 59(3), 461–483. [DOI] [Google Scholar]
- Chin M, Jacob DJ, Munger JW, Parrish DD, & Doddridge BG (1994). Relationship of ozone and carbon-monoxide over North-America. Journal of Geophysical Research, 99(D7), 14565–14573. 10.1029/94jd00907 [DOI] [Google Scholar]
- Cicerone R (1988). How has the atmospheric concentration of CO changed? In The changing atmosphere report (pp. 49–61). New York, NY: John Wiley. [Google Scholar]
- Cogbill CV, & Likens GE (1974). Acid precipitation in the Northeastern United States. Water Resources Research, 10(6), 1133–1137. [Google Scholar]
- Colarco PR, Toon OB, Reid JS, Livingston JM, Russell PB, Redemann J, et al. (2003). Saharan dust transport to the Caribbean during PRIDE: 2. Transport, vertical profiles, and deposition in simulations of in situ and remote sensing observations. Journal of Geophysical Research, 108(D19), 1–15. 10.1029/2002jd002659 [DOI] [Google Scholar]
- Cook BI, Miller RL, & Seager R (2009). Amplification of the North American “Dust Bowl” drought through human-induced land degradation. Proceedings of the National Academy of Sciences, 106(13), 4997–5001. 10.1073/pnas.0810200106 [DOI] [PMC free article] [PubMed] [Google Scholar]
- Cooper OR, Parrish D, Ziemke J, Cupeiro M, Galbally I, Gilge S, et al. (2014). Global distribution and trends of tropospheric ozone: An observation-based review. Elementa-Science of the Anthropocene, 2, 000029. doi:12952/journal.elementa.000029 [Google Scholar]
- Corr CA, Hall SR, Ullmann K, Anderson BE, Beyersdorf AJ, Thornhill KL, et al. (2012). Spectral absorption of biomass burning aerosol determined from retrieved single scattering albedo during ARCTAS. Atmospheric Chemistry and Physics, 12(21), 10505–10518. 10.5194/acp-12-10505-2012 [DOI] [Google Scholar]
- Creamean JM, Spackman JR, Davis SM, & White AB (2014). Climatology of long-range transported Asian dust along the west coast of the United States. Journal of Geophysical Research-Atmospheres, 119(21), 12171–12185. 10.1002/2014jd021694 [DOI] [Google Scholar]
- Crosbie E, Youn JS, Balch B, Wonaschutz A, Shingler T, Wang Z, et al. (2015). On the competition among aerosol number, size and composition in predicting CCN variability: A multi-annual field study in an urbanized desert. Atmospheric Chemistry and Physics, 15(12), 6943–6958. 10.5194/acp-15-6943-2015 [DOI] [PMC free article] [PubMed] [Google Scholar]
- Dadashazar H, Ma L, & Sorooshian A (2019). Sources of pollution and interrelationships between aerosol and precipitation chemistry at a central California site. Science of the Total Environment, 651(Pt 2), 1776–1787. 10.1016/j.scitotenv.2018.10.086 [DOI] [PMC free article] [PubMed] [Google Scholar]
- de Gouw JA, Warneke C, Stohl A, Wollny AG, Brock CA, Cooper OR, et al. (2006). Volatile organic compounds composition of merged and aged forest fire plumes from Alaska and Western Canada. Journal of Geophysical Research, 111(D10), 1–20. 10.1029/2005jd00617520411040 [DOI] [Google Scholar]
- Doherty OM, Riemer N, & Hameed S (2008). Saharan mineral dust transport into the Caribbean: Observed atmospheric controls and trends. Journal of Geophysical Research, 113(D7), 35190594. 10.1029/2007jd009171 [DOI] [Google Scholar]
- Driscoll CT, Lawrence GB, Bulger AJ, Butler TJ, Cronan CS, Eagar C, et al. (2001). Acidic deposition in the Northeastern United States: Sources and inputs, ecosystem effects, and management strategies. Bioscience, 51(3), 180–198. 10.1641/0006-3568(2001)051[0180:Aditnu]2.0.Co2 [DOI] [Google Scholar]
- Duncan BN, & Logan JA (2008). Model analysis of the factors regulating the trends and variability of carbon monoxide between 1988 and 1997. Atmospheric Chemistry and Physics, 8(24), 7389–7403. 10.5194/acp-8-7389-2008 [DOI] [Google Scholar]
- Fairlie TD, Liu H, Vernier JP, Campuzano-Jost P, Jimenez JL, Jo D, et al. (2020). Estimates of regional source contributions to the Asian Tropopause Aerosol Layer using a chemical transport model. Journal of Geophysical Research: Atmosphere, 125(4), e2019JD031506. 10.1029/2019JD031506 [DOI] [Google Scholar]
- Falkovich AH, Ganor E, Levin Z, Formenti P, & Rudich Y (2001). Chemical and mineralogical analysis of individual mineral dust particles. Journal of Geophysical Research, 106(D16), 18029–18036. 10.1029/2000jd900430 [DOI] [Google Scholar]
- Fast JD, Berg LK, Zhang K, Easter RC, Ferrare RA, Hair JW, et al. (2016). Model representations of aerosol layers transported from North America over the Atlantic Ocean during the Two-Column Aerosol Project. Journal of Geophysical Research: Atmosphere, 121(16), 9814–9848. [Google Scholar]
- Fehsenfeld FC, Ancellet G, Bates TS, Goldstein AH, Hardesty RM, Honrath R, et al. (2006). International Consortium for Atmospheric Research on Transport and Transformation (ICARTT): North America to Europe – Overview of the 2004 Summer Field Study. Journal of Geophysical Research, 111(D23), 1–36. 10.1029/2006jd00782920411040 [DOI] [Google Scholar]
- Feng J, Chan E, & Vet R (2019). Air quality in the Eastern United States and Eastern Canada for 1990–2015: 25 years of change in response to emission reductions of SO2 and NOx in the region. Atmospheric Chemistry and Physics Discussions, 1–69. 10.5194/acp-2019-567 [DOI] [Google Scholar]
- Fishman J, & Seiler W (1983). Correlative nature of ozone and carbon-monoxide in the troposphere – Implications for the tropospheric ozone budget. Journal of Geophysical Research, 88(Nc6), 3662–3670. 10.1029/JC088iC06p03662 [DOI] [Google Scholar]
- Frossard AA, Gerard V, Duplessis P, Kinsey JD, Lu X, Zhu Y, et al. (2019). Properties of Seawater surfactants associated with primary marine aerosol particles produced by bursting bubbles at a model air-sea interface. Environmental Science & Technology, 53(16), 9407–9417. 10.1021/acs.est.9b02637 [DOI] [PubMed] [Google Scholar]
- Gelaro R, McCarty W, Suarez MJ, Todling R, Molod A, Takacs L, et al. (2017). The modern-era retrospective analysis for research and applications, Version 2 (MERRA-2). Journal of Climate, 30(14), 5419–5454. 10.1175/Jcli-D-16-0758.1 [DOI] [PMC free article] [PubMed] [Google Scholar]
- Hair JW, Hostetler CA, Cook AL, Harper DB, Ferrare RA, Mack TL, et al. (2008). Airborne high spectral resolution lidar for profiling aerosol optical properties. Applied Optics, 47(36), 6734–6752. 10.1364/ao.47.006734 [DOI] [PubMed] [Google Scholar]
- Hand JL, Prenni AJ, Schichtel BA, Malm WC, & Chow JC (2019). Trends in remote PM2.5 Residual Mass across the United States: Implications for Aerosol Mass Reconstruction in the IMPROVE Network. Atmospheric Environment, 203, 141–152. 10.1016/j.atmosenv.2019.01.049 [DOI] [Google Scholar]
- Hand JL, Schichtel BA, Malm WC, & Frank NH (2013). Spatial and temporal trends in PM2.5 organic and elemental carbon across the United States. Advances in Meteorology, 1–13, Article ID 367674. 10.1155/2013/367674 [DOI] [Google Scholar]
- Hand JL, Schichtel BA, Malm WC, & Pitchford ML (2012). Particulate sulfate ion concentration and SO2 emission trends in the United States from the early 1990s through 2010. Atmospheric Chemistry and Physics, 12(21), 10353–10365. 10.5194/acp-12-10353-2012 [DOI] [Google Scholar]
- Holloway JS, Jakoubek RO, Parrish DD, Gerbig C, Volz-Thomas A, Schmitgen S, et al. (2000). Airborne intercomparison of vacuum ultraviolet fluorescence and tunable diode laser absorption measurements of tropospheric carbon monoxide. Journal of Geophysical Research, 105(D19), 24251–24261. 10.1029/2000jd900237 [DOI] [Google Scholar]
- Holton JR, Haynes PH, Mcintyre ME, Douglass AR, Rood RB, & Pfister L (1995). Stratosphere-troposphere exchange. Reviews of Geophysics, 33(4), 403–439. 10.1029/95rg02097 [DOI] [Google Scholar]
- Honrath RE, Owen RC, Val Martin M, Reid JS, Lapina K, Fialho P, et al. (2004). Regional and hemispheric impacts of anthropogenic and biomass burning emissions on summertime CO and O3 in the North Atlantic lower free troposphere. Journal of Geophysical Research, 109(D24), D24310. 10.1029/2004jd005147 [DOI] [Google Scholar]
- Jongeward AR, Li ZQ, He H, & Xiong XX (2016). Natural and anthropogenic aerosol trends from satellite and surface observations and model simulations over the North Atlantic Ocean from 2002 to 2012. Journal of the Atmospheric Sciences, 73(11), 4469–4485. 10.1175/Jas-D-15-0308.1 [DOI] [Google Scholar]
- Jung E, Albrecht B, Prospero JM, Jonsson HH, & Kreidenweis SM (2013). Vertical structure of aerosols, temperature, and moisture associated with an intense African dust event observed over the Eastern Caribbean. Journal of Geophysical Research: Atmospheres, 118(10), 4623–4643. 10.1002/jgrd.50352 [DOI] [Google Scholar]
- Keene WC, Galloway JN, Likens GE, Deviney FA, Mikkelsen KN, Moody JL, & Maben JR (2015). Atmospheric wet deposition in remote regions: Benchmarks for environmental change. Journal of the Atmospheric Sciences, 72(8), 2947–2978. 10.1175/Jas-D-14-0378.1 [DOI] [Google Scholar]
- Keene WC, Moody JL, Galloway JN, Prospero JM, Cooper OR, Eckhardt S, & Maben JR (2014). Long-term trends in aerosol and precipitation composition over the Western North Atlantic Ocean at Bermuda. Atmospheric Chemistry and Physics, 14(15), 8119–8135. 10.5194/acp-14-8119-2014 [DOI] [Google Scholar]
- Kim MH, Omar AH, Tackett JL, Vaughan MA, Winker DM, Trepte CR, et al. (2018). The CALIPSO Version 4 automated aerosol classification and lidar ratio selection algorithm. Atmospheric Measurement Techniques, 11(11), 6107–6135. 10.5194/amt-11-6107-2018 [DOI] [PMC free article] [PubMed] [Google Scholar]
- Koçak M, Mihalopoulos N, & Kubilay N (2007). Chemical composition of the fine and coarse fraction of aerosols in the Northeastern Mediterranean. Atmospheric Environment, 41(34), 7351–7368. [Google Scholar]
- Lacagnina C, Hasekamp OP, Bian H, Curci G, Myhre G, Noije T, et al. (2015). Aerosol single-scattering albedo over the global oceans: Comparing PARASOL retrievals with AERONET, OMI, and AeroCom models estimates. Journal of Geophysical Research: Atmosphere, 120(18), 9814–9836. 10.1002/2015jd023501 [DOI] [Google Scholar]
- Lang Q, Zhang Q, & Jaffe R (2002). Organic aerosols in the Miami area, USA: Temporal variability of atmospheric particles and wet/dry deposition. Chemosphere, 47(4), 427–441. 10.1016/s0045-6535(01)00318–6 [DOI] [PubMed] [Google Scholar]
- Lau WKM, Yuan C, & Li Z (2018). Origin, maintenance and variability of the Asian Tropopause Aerosol Layer (ATAL): The roles of monsoon dynamics. Scientific Reports, 8(1), 3960. 10.1038/s41598-018-22267-z [DOI] [PMC free article] [PubMed] [Google Scholar]
- Lawler MJ, Finley BD, Keene WC, Pszenny AAP, Read KA, von Glasow R, & Saltzman ES (2009). Pollution-enhanced reactive chlorine chemistry in the eastern tropical Atlantic boundary layer. Geophysical Research Letters, 36(8), 1–5. 10.1029/2008gl036666 [DOI] [Google Scholar]
- Levine JS (1991). Global biomass burning: Atmospheric, climatic, and biospheric implications (Vol. 23, pp. 1075–1077). Williamsburg, VA, United States: Massachusetts Institute of Technology Press. [Google Scholar]
- Levy H (1971). Normal atmosphere: Large radical and formaldehyde concentrations predicted. Science, 173(3992), 141–143. 10.1126/science.173.3992.141 [DOI] [PubMed] [Google Scholar]
- Levy H, Mahlman JD, Moxim WJ, & Liu SC (1985). Tropospheric ozone – The role of transport. Journal of Geophysical Research, 90(Nd2), 3753–3772. 10.1029/JD090iD02p03753 [DOI] [Google Scholar]
- Li R, Cui LL, Zhao YL, Zhang ZY, Sun TM, Li JL, et al. (2019). Wet deposition of inorganic ions in 320 cities across China: Spatio-temporal variation, source apportionment, and dominant factors. Atmospheric Chemistry and Physics, 19(17), 11043–11070. 10.5194/acp-19-11043-2019 [DOI] [Google Scholar]
- Li Q, Jacob DJ, Fairlie TD, Liu H, Martin RV, & Yantosca RM (2002). Stratospheric versus pollution influences on ozone at Bermuda: Reconciling past analyses. Journal of Geophysical Research, 107(D22), ACH 1–1–ACH 1–16. [Google Scholar]
- Li QB, Jacob DJ, Park R, Wang YX, Heald CL, Hudman R, et al. (2005). North American pollution outflow and the trapping of convectively lifted pollution by upper-level anticyclone. Journal of Geophysical Research, 110(D10), D10301. 10.1029/2004jd005039 [DOI] [Google Scholar]
- Likens GE, & Bormann FH (1974). Acid rain: A serious regional environmental problem. Science, 184(4142), 1176–1179. 10.1126/science.184.4142.1176 [DOI] [PubMed] [Google Scholar]
- Likens GE, Bormann FH, & Johnson NM (1972). Acid rain. Environment: Science and Policy for Sustainable Development, 14(2), 33. 10.1080/00139157.1972.9933001 [DOI] [Google Scholar]
- Logan JA, Prather MJ, Wofsy SC, & McElroy MB (1981). Tropospheric chemistry: A global perspective. Journal of Geophysical Research, 86(C8), 7210–7254. 10.1029/JC086iC08p07210 [DOI] [Google Scholar]
- Lomas MW, Bates NR, Johnson RJ, Knap AH, Steinberg DK, & Carlson CA (2013). Two Decades and counting: 24-years of sustained open ocean biogeochemical measurements in the Sargasso Sea. Deep-Sea Research Part II – Topical Studies in Oceanography, 93, 16–32. 10.1016/j.dsr2.2013.01.008 [DOI] [Google Scholar]
- Lopez DH, Rabbani MR, Crosbie E, Raman A, Arellano AF Jr, & Sorooshian A (2016). Frequency and character of extreme aerosol events in the Southwestern United States: A case study analysis in Arizona. Atmosphere, 7(1), 1. 10.3390/atmos7010001 [DOI] [PMC free article] [PubMed] [Google Scholar]
- Loughner CP, Tzortziou M, Shroder S, & Pickering KE (2016). Enhanced dry deposition of nitrogen pollution near coastlines: A case study covering the Chesapeake Bay Estuary and Atlantic Ocean Coastline. Journal of Geophysical Research: Atmospheres, 121(23), 14221–14238. 10.1002/2016jd025571 [DOI] [Google Scholar]
- Loye-Pilot M, & Morelli J (1988). Fluctuations of ionic composition of precipitations collected in corsica related to changes in the origins of incoming aerosols. Journal of Aerosol Science, 19(5), 577–585. [Google Scholar]
- Magi BI, Hobbs PV, Schmid B, & Redemann J (2003). Vertical profiles of light scattering, light absorption, and single scattering albedo during the dry, biomass burning season in southern Africa and comparisons of in situ and remote sensing measurements of aerosol optical depths. Journal of Geophysical Research, 108(D13), n/a–n/a. 10.1029/2002jd002361 [DOI] [Google Scholar]
- Michaels AF, & Knap AH (1996). Overview of the US JGOFS Bermuda Atlantic Time-series Study and the Hydrostation S program. Deep-Sea Research Part II: Topical Studies in Oceanography, 43(2–3), 157–198. 10.1016/0967-0645(96)00004-5 [DOI] [Google Scholar]
- Milne PJ, Prados AI, Dickerson RR, Doddridge BG, Riemer DD, Zika RG, et al. (2000). Nonmethane hydrocarbon mixing ratios in continental outflow air from Eastern North America: Export of ozone precursors to Bermuda. Journal of Geophysical Research, 105(D8), 9981–9990. 10.1029/1999jd901117 [DOI] [Google Scholar]
- Monks PS (2000). A review of the observations and origins of the spring ozone maximum. Atmospheric Environment, 34(21), 3545–3561. 10.1016/S1352-2310(00)00129-1 [DOI] [Google Scholar]
- Mora M, Braun RA, Shingler T, & Sorooshian A (2017). Analysis of remotely sensed and surface data of aerosols and meteorology for the Mexico Megalopolis Area between 2003 and 2015. Journal of Geophysical Research: Atmospheres, 122(16), 8705–8723. 10.1002/2017JD026739 [DOI] [PMC free article] [PubMed] [Google Scholar]
- Moulin C, Lambert CE, Dulac F, & Dayan U (1997). Control of atmospheric export of dust from North Africa by the North Atlantic Oscillation. Nature, 387(6634), 691–694. 10.1038/42679 [DOI] [Google Scholar]
- Muhs DR, Budahn JR, Prospero JM, & Carey SN (2007). Geochemical evidence for African dust inputs to soils of western Atlantic islands: Barbados, the Bahamas, and Florida. Journal of Geophysical Research, 112(F2), 1–26. 10.1029/2005jf000445 [DOI] [Google Scholar]
- Muhs DR, Budahn JR, Prospero JM, Skipp G, & Herwitz SR (2012). Soil genesis on the island of Bermuda in the Quaternary: The importance of African dust transport and deposition. Journal of Geophysical Research, 117, 26. [Google Scholar]
- Muller D, Hostetler CA, Ferrare RA, Burton SP, Chemyakin E, Kolgotin A, et al. (2014). Airborne Multiwavelength High Spectral Resolution Lidar (HSRL-2) Observations during TCAP 2012: Vertical profiles of optical and microphysical properties of a smoke/urban haze plume over the Northeastern Coast of the US. Atmospheric measurement techniques, 7(10), 3487–3496. 10.5194/amt-7-3487-2014 [DOI] [Google Scholar]
- Murphy DM, Froyd KD, Bian HS, Brock CA, Dibb JE, DiGangi JP, et al. (2019). The distribution of sea-salt aerosol in the global troposphere. Atmospheric Chemistry and Physics, 19(6), 4093–4104. 10.5194/acp-19-4093-2019 [DOI] [Google Scholar]
- Myhre G, Shindell D, & Pongratz J (2014). Anthropogenic and natural radiative forcing. In Climate change 2013: The physical science basis. Contribution of Working Group I to the Fifth assessment report of the intergovernmental panel on climate change (pp. 659–740). Cambridge: Cambridge University Press. [Google Scholar]
- Novelli PC, Masarie KA, & Lang PM (1998). Distributions and recent changes of carbon monoxide in the lower troposphere. Journal of Geophysical Research, 103(D15), 19015–19033. 10.1029/98jd01366 [DOI] [Google Scholar]
- Novelli PC, Steele LP, & Tans PP (1992). Mixing ratios of carbon-monoxide in the troposphere. Journal of Geophysical Research, 97(D18), 20731–20750. 10.1029/92jd02010 [DOI] [Google Scholar]
- NRC. (1992). Rethinking the ozone problem in urban and regional air pollution, Washington, DC, United States: National Academies Press. [Google Scholar]
- Oltmans S, Levy H, Harris J, Merrill J, Moody J, Lathrop J, et al. (1996). Summer and spring ozone profiles over the North Atlantic from ozonesonde measurements. Journal of Geophysical Research: Atmosphere, 101(D22), 29179–29200. [Google Scholar]
- Owen RC, Cooper OR, Stohl A, & Honrath RE (2006). An analysis of the mechanisms of North American pollutant transport to the Central North Atlantic Lower Free Troposphere. Journal of Geophysical Research, 111(D23), 1–14. 10.1029/2006jd00706220411040 [DOI] [Google Scholar]
- Parrington M, Palmer PI, Henze DK, Tarasick DW, Hyer EJ, Owen RC, et al. (2012). The influence of boreal biomass burning emissions on the distribution of tropospheric ozone over North America and the North Atlantic during 2010. Atmospheric Chemistry and Physics, 12(4), 2077–2098. 10.5194/acp-12-2077-2012 [DOI] [Google Scholar]
- Parrish DD, Lamarque JF, Naik V, Horowitz L, Shindell DT, Staehelin J, et al. (2014). Long-term Changes in lower tropospheric baseline ozone concentrations: Comparing chemistry-climate models and observations at Northern Midlatitudes. Journal of Geophysical Research: Atmospheres, 119(9), 5719–5736. 10.1002/2013jd021435 [DOI] [Google Scholar]
- Parrish DD, Law KS, Staehelin J, Derwent R, Cooper OR, Tanimoto H, et al. (2013). Lower tropospheric ozone at Northern Midlatitudes: Changing seasonal cycle. Geophysical Research Letters, 40(8), 1631–1636. 10.1002/grl.50303 [DOI] [Google Scholar]
- Pechtl S, & von Glasow R (2007). Reactive chlorine in the marine boundary layer in the outflow of polluted continental air: A model study. Geophysical Research Letters, 34(11), L11813. 10.1029/2007gl029761 [DOI] [Google Scholar]
- Petron G, Granier C, Khattatov B, Lamarque JF, Yudin V, Muller JF, & Gille J (2002). Inverse modeling of carbon monoxide surface emissions using climate monitoring and diagnostics laboratory network observations. Journal of Geophysical Research, 107(D24), 4761. 10.1029/2001jd001305 [DOI] [Google Scholar]
- Peyridieu S, Chedin A, Tanre D, Capelle V, Pierangelo C, Lamquin N, & Armante R (2010). Saharan dust infrared optical depth and altitude retrieved from AIRS: A focus over North Atlantic – Comparison to MODIS and CALIPSO. Atmospheric Chemistry and Physics, 10(4), 1953–1967. 10.5194/acp-10-1953-2010 [DOI] [Google Scholar]
- Prospero JM, & Carlson TN (1972). Vertical and areal distribution of Saharan Dust over Western Equatorial North-Atlantic Ocean. Journal of Geophysical Research, 77(27), 5255. 10.1029/JC077i027p05255 [DOI] [Google Scholar]
- Prospero JM, Landing WM, & Schulz M (2010). African dust deposition to Florida: Temporal and spatial variability and comparisons to models. Journal of Geophysical Research, 115(D13), 10–1029. 10.1029/2009jd012773 [DOI] [Google Scholar]
- Putaud JP, Van Dingenen R, Dell’Acqua A, Raes F, Matta E, Decesari S, et al. (2004). Size-segregated aerosol mass closure and chemical composition in Monte Cimone (I) during MINATROC. Atmospheric Chemistry and Physics, 4, 889–902. 10.5194/acp-4-889-2004 [DOI] [Google Scholar]
- Randles CA, Da Silva AM, Buchard V, Colarco PR, Darmenov A, Govindaraju R, & Flynn CJ (2017). The MERRA-2 aerosol reanalysis, 1980 – Onward, Part I: System description and data assimilation evaluation. Journal of Climate, 30(17), 6823–6850. 10.1175/JCLI-D-16-0609.1 [DOI] [PMC free article] [PubMed] [Google Scholar]
- Reid JS, Jonsson HH, Smith MH, & Smirnov A (2001). Evolution of the vertical profile and flux of large sea-salt particles in a coastal zone. Journal of Geophysical Research, 106(D11), 12039–12053. 10.1029/2000jd900848 [DOI] [Google Scholar]
- Rienecker MM, Suarez MJ, Todling R, Bacmeister J, Takacs L, Liu H-C, et al. (2008). The GEOS-5 data assimilation system – Documentation of Versions 5.0.1, 5.1.0, and 5.2.0. Retrieved from https://gmao.gsfc.nasa.gov/pubs/docs/Rienecker369.pdf
- Robson J, Sutton RT, Archibald A, Cooper F, Christensen M, Gray LJ, et al. (2018). Recent multivariate changes in the North Atlantic Climate System, with a focus on 2005–2016. International Journal of Climatology, 38(14), 5050–5076. 10.1002/joc.5815 [DOI] [Google Scholar]
- Rogers HM, Ditto JC, & Gentner DR (2020). Evidence for impacts on surface-level air quality in the Northeastern U.S. from long-distance transport of smoke from North American Fires during the Long Island Sound Tropospheric Ozone Study (LISTOS) 2018. Atmospheric Chemistry and Physics, 20(2), 671–682. 10.5194/acp-20-671-2020 [DOI] [Google Scholar]
- Rogers RR, Hair JW, Hostetler CA, Ferrare RA, Obland MD, Cook AL, et al. (2009). NASA LaRC airborne high spectral resolution lidar aerosol measurements during MILAGRO: Observations and validation. Atmospheric Chemistry and Physics, 9(14), 4811–4826. 10.5194/acp-9-4811-2009 [DOI] [Google Scholar]
- Savoie DL, & Prospero JM (1977). Aerosol concentration statistics for Northern Tropical Atlantic. Journal of Geophysical Research, 82(37), 5954–5964. 10.1029/JC082i037p05954 [DOI] [Google Scholar]
- Sawamura P, Moore RH, Burton SP, Chemyakin E, Muller D, Kolgotin A, et al. (2017). HSRL-2 aerosol optical measurements and microphysical retrievals vs. airborne in situ measurements during DISCOVER-AQ 2013: An intercomparison study. Atmospheric Chemistry and Physics, 17(11), 7229–7243. 10.5194/acp-17-7229-2017 [DOI] [Google Scholar]
- Schlosser JS, Braun RA, Bradley T, Dadashazar H, MacDonald AB, Aldhaif AA, et al. (2017). Analysis of aerosol composition data for western United States wildfires between 2005 and 2015: Dust emissions, chloride depletion, and most enhanced aerosol constituents. Journal of Geophysical Research: Atmospheres, 122(16), 8951–8966. 10.1002/2017jd026547 [DOI] [PMC free article] [PubMed] [Google Scholar]
- Schlosser JS, Dadashazar H, Edwards EL, Hossein Mardi A, Prabhakar G, Stahl C, et al. (2020). Relationships between supermicrometer sea salt aerosol and Marine boundary layer conditions: Insights from repeated identical flight patterns. Journal of Geophysical Research: Atmosphere, 125(12), e2019JD032346. 10.1029/2019jd032346 [DOI] [PMC free article] [PubMed] [Google Scholar]
- Schroder JC, Campuzano-Jost P, Day DA, Shah V, Larson K, Sommers JM, et al. (2018). Sources and secondary production of organic aerosols in the Northeastern United States during WINTER. Journal of Geophysical Research: Atmosphere, 123(14), 7771–7796. 10.1029/2018jd028475 [DOI] [Google Scholar]
- Schwikowski M, Seibert P, Baltensperger U, & Gaggeler HW (1995). A study of an outstanding Saharan Dust Event at the High-Alpine Site Jungfraujoch, Switzerland. Atmospheric Environment, 29(15), 1829–1842. 10.1016/1352-2310(95)00060-C [DOI] [Google Scholar]
- Sevimoğlu O, & Rogge WF (2019). Seasonal variations of PM10—Trace elements, PAHs and Levoglucosan: Rural sugarcane growing area versus coastal urban area in Southeastern Florida, USA. Part II: Elemental concentrations. Particuology, 46, 99–108. 10.1016/j.partic.2019.05.001 [DOI] [Google Scholar]
- Shah V, Jaegle L, Thornton JA, Lopez-Hilfiker FD, Lee BH, Schroder JC, et al. (2018). Chemical feedbacks weaken the wintertime response of particulate sulfate and nitrate to emissions reductions over the Eastern United States. Proceedings of the National Academy of Sciences, 115(32), 8110–8115. 10.1073/pnas.1803295115 [DOI] [PMC free article] [PubMed] [Google Scholar]
- Shingler T, Crosbie E, Ortega A, Shiraiwa M, Zuend A, Beyersdorf A, et al. (2016). Airborne characterization of subsaturated aerosol hygroscopicity and dry refractive index from the surface to 6.5 km during the SEAC(4)RS campaign. Journal of Geophysical Research: Atmospheres, 121(8), 4188–4210. 10.1002/2015jd024498 [DOI] [Google Scholar]
- Sickles JE II, & Shadwick DS (2007). Changes in air quality and atmospheric deposition in the Eastern United States: 1990–2004. Journal of Geophysical Research, 112(D17), 1–18. 10.1029/2006jd007843 [DOI] [Google Scholar]
- Sickles JE II, & Shadwick DS (2015). Air quality and atmospheric deposition in the Eastern US: 20 years of change. Atmospheric Chemistry and Physics, 15(1), 173–197. 10.5194/acp-15-173-2015 [DOI] [Google Scholar]
- Sorooshian A, Anderson B, Bauer SE, Braun RA, Cairns B, Crosbie E, et al. (2019). Aerosol–cloud–meteorology interaction airborne field investigations: Using lessons learned from the U.S. West Coast in the design of ACTIVATE off the U.S. East Coast. Bulletin of the American Meteorological Society, 100(8), 1511–1528. 10.1175/bams-d-18-0100.1 [DOI] [PMC free article] [PubMed] [Google Scholar]
- Sorooshian A, Corral AF, Braun RA, Cairns B, Crosbie E, Ferrare R, et al. (2020). Atmospheric research over the Western North Atlantic Ocean Region and North American East Coast: A review of past work and challenges ahead. Journal of Geophysical Research: Atmospheres, 125(6). 10.1029/2019JD031626 [DOI] [PMC free article] [PubMed] [Google Scholar]
- Sorooshian A, Shingler T, Harpold A, Feagles CW, Meixner T, & Brooks PD (2013). Aerosol and precipitation chemistry in the southwestern United States: spatiotemporal trends and interrelationships. Atmospheric Chemistry and Physics, 13(15), 7361–7379. 10.5194/acp-13-7361-2013 [DOI] [PMC free article] [PubMed] [Google Scholar]
- Spivakovsky CM, Logan JA, Montzka SA, Balkanski YJ, Foreman-Fowler M, Jones DBA, et al. (2000). Three-dimensional climatological distribution of tropospheric OH: Update and evaluation. Journal of Geophysical Research: Atmospheres, 105(D7), 8931–8980. 10.1029/1999jd901006 [DOI] [Google Scholar]
- Stamnes S, Hostetler C, Ferrare R, Burton S, Liu X, Hair J, et al. (2018). Simultaneous polarimeter retrievals of microphysical aerosol and ocean color parameters from the “MAPP” algorithm with comparison to high-spectral-resolution lidar aerosol and ocean products. Applied Optics, 57(10), 2394–2413. 10.1364/AO.57.002394 [DOI] [PMC free article] [PubMed] [Google Scholar]
- Steinberg DK, Carlson CA, Bates NR, Johnson RJ, Michaels AF, & Knap AH (2001). Overview of the US JGOFS Bermuda Atlantic Time-Series Study (BATS): A decade-scale look at ocean biology and biogeochemistry. Deep-Sea Research Part II – Topical Studies in Oceanography, 48(8–9), 1405–1447. 10.1016/S0967-0645(00)00148-X [DOI] [Google Scholar]
- Sullivan AP, Guo H, Schroder JC, Campuzano-Jost P, Jimenez JL, Campos T, & Weber RJ (2019). Biomass burning markers and residential burning in the WINTER aircraft campaign. Journal of Geophysical Research: Atmosphere, 124(3), 1846–1861. 10.1029/2017jd028153 [DOI] [Google Scholar]
- Tackett JL, Winker DM, Getzewich BJ, Vaughan MA, Young SA, & Kar J (2018). CALIPSO Lidar Level 3 aerosol profile product: Version 3 algorithm design. Atmospheric Measurement Techniques, 11(7), 4129–4152. 10.5194/amt-11-4129-2018 [DOI] [PMC free article] [PubMed] [Google Scholar]
- Tai APK, Mickley LJ, & Jacob DJ (2010). Correlations between Fine Particulate Matter (PM2.5) and meteorological variables in the United States: Implications for the sensitivity of PM2.5 to climate change. Atmospheric Environment, 44(32), 3976–3984. 10.1016/j.atmosenv.2010.06.060 [DOI] [Google Scholar]
- Thompson AM (1992). The oxidizing capacity of the Earth’s atmosphere: Probable past and future changes. Science, 256(5060), 1157–1165. 10.1126/science.256.5060.1157 [DOI] [PubMed] [Google Scholar]
- VanCuren RA, & Cahill TA (2002). Asian aerosols in North America: Frequency and concentration of fine dust. Journal of Geophysical Research, 107(D24), AAC 19–11–AAC 19–16. 10.1029/2002jd002204 [DOI] [Google Scholar]
- Vernier JP, Thomason LW, & Kar J (2011). CALIPSO detection of an Asian tropopause aerosol layer. Geophysical Research Letters, 38(7), 1–6. 10.1029/2010gl046614 [DOI] [Google Scholar]
- von Glasow R, Jickells TD, Baklanov A, Carmichael GR, Church TM, Gallardo L, et al. (2013). Megacities and large urban agglomerations in the coastal zone: Interactions between atmosphere, land, and marine ecosystems. Ambio, 42(1), 13–28. 10.1007/s13280-012-0343-9 [DOI] [PMC free article] [PubMed] [Google Scholar]
- Wang H, Easter RC, Rasch PJ, Wang M, Liu X, Ghan SJ, et al. (2013). Sensitivity of remote aerosol distributions to representation of cloud-aerosol interactions in a global climate model. Geoscientific Model Development, 6(3), 765–782. 10.5194/gmd-6-765-2013 [DOI] [Google Scholar]
- Wang H, Easter RC, Zhang R, Ma PL, Singh B, Zhang K, et al. (2020). Aerosols in the E3SM Version 1: New developments and their impacts on radiative forcing. Journal of Advances in Modeling Earth Systems, 12(1), e2019MS001851. [Google Scholar]
- Wang HL, Rasch PJ, Easter RC, Singh B, Zhang RD, Ma PL, et al. (2014). Using an explicit emission tagging method in global modeling of source-receptor relationships for black carbon in the Arctic: Variations, sources, and transport pathways. Journal of Geophysical Research: Atmospheres, 119(22), 12888–12909. 10.1002/2014jd022297 [DOI] [Google Scholar]
- Wargan K, Labow G, Frith S, Pawson S, Livesey N, & Partyka G (2017). Evaluation of the ozone fields in NASA’s MERRA-2 reanalysis. Journal of Climate, 30(8), 2961–2988. 10.1175/JCLI-D-16-0699.1 [DOI] [PMC free article] [PubMed] [Google Scholar]
- Warneke C, de Gouw JA, Stohl A, Cooper OR, Goldan PD, Kuster WC, et al. (2006). Biomass burning and anthropogenic sources of CO over New England in the Summer 2004. Journal of Geophysical Research, 111(D23), D23S15. 10.1029/2005jd006878 [DOI] [Google Scholar]
- Wells KC, Witek M, Flatau P, Kreidenwei SM, & Westphal DL (2007). An analysis of seasonal surface dust aerosol concentrations in the western US (2001–2004): Observations and model predictions. Atmospheric Environment, 41(31), 6585–6597. 10.1016/j.atmosenv.2007.04.034 [DOI] [Google Scholar]
- WHO. (2006). WHO air quality guidelines for particulate matter, ozone, nitrogen dioxide and sulfur dioxide : Global update 2005: Summary of risk assessment. Geneva, Switzerland: World Health Organization. [Google Scholar]
- Williams MW, & Melack JM (1991). Solute chemistry of snowmelt and runoff in an Alpine Basin, Sierra-Nevada. Water Resources Research, 27(7), 1575–1588. 10.1029/90wr02774 [DOI] [Google Scholar]
- Wotawa G, Novelli PC, Trainer M, & Granier C (2001). Inter-annual variability of summertime CO concentrations in the Northern hemisphere explained by Boreal forest fires in North America and Russia. Geophysical Research Letters, 28(24), 4575–4578. 10.1029/2001gl013686 [DOI] [Google Scholar]
- Wu M, Liu X, Yu H, Wang H, Shi Y, Yang K, et al. (2020). Understanding processes that control dust spatial distributions with global climate models and satellite observations. Atmospheric Chemistry and Physics Discussions, 2020, 1–52. 10.5194/acp-2020-160 [DOI] [Google Scholar]
- Yang Y, Wang HL, Smith SJ, Easter R, Ma PL, Qian Y, et al. (2017). Global source attribution of sulfate concentration and direct and indirect radiative forcing. Atmospheric Chemistry and Physics, 17(14), 8903–8922. 10.5194/acp-17-8903-2017 [DOI] [Google Scholar]
- Yang Y, Wang HL, Smith SJ, Zhang RD, Lou SJ, Yu HB, et al. (2018). Source apportionments of aerosols and their direct radiative forcing and long-term trends over Continental United States. Earths Future, 6(6), 793–808. 10.1029/2018ef000859 [DOI] [Google Scholar]
- Yokelson RJ, Crounse JD, DeCarlo PF, Karl T, Urbanski S, Atlas E, et al. (2009). Emissions from biomass burning in the Yucatan. Atmospheric Chemistry and Physics, 9(15), 5785–5812. 10.5194/acp-9-5785-2009 [DOI] [Google Scholar]
- Yoon J, Burrows JP, Vountas M, von Hoyningen-Huene W, Chang DY, Richter A, & Hilboll A (2014). Changes in atmospheric aerosol loading retrieved from space-based measurements during the past decade. Atmospheric Chemistry and Physics, 14(13), 6881–6902. 10.5194/acp-14-6881-2014 [DOI] [Google Scholar]
- Yu H, Yang Y, Wang H, Tan Q, Chin M, Levy RC, et al. (2020). Interannual variability and trends of combustion aerosol and dust in major continental outflows revealed by MODIS retrievals and CAM5 simulations during 2003. Atmospheric Chemistry and Physics, 20(1), 139–161. 10.5194/acp-20-139-2020 [DOI] [PMC free article] [PubMed] [Google Scholar]
- Zhang YD, Luo G, & Yu FQ (2019). Seasonal variations and long-term trend of dust particle number concentration over the Northeastern United States. Journal of Geophysical Research: Atmospheres, 124(23), 13140–13155. 10.1029/2019jd031388 [DOI] [Google Scholar]
- Zhao TXP, Laszlo I, Guo W, Heidinger A, Cao C, Jelenak A, Sullivan J (2008). Study of long-term trend in aerosol optical thickness observed from operational AVHRR Satellite Instrument. Journal of Geophysical Research, 113(D7), D07201. 10.1029/2007jd009061 [DOI] [Google Scholar]
- Zhou XL, Davis AJ, Kieber DJ, Keene WC, Maben JR, Maring H, et al. (2008). Photochemical production of hydroxyl radical and hydroperoxides in water extracts of nascent marine aerosols produced by bursting bubbles from Sargasso Seawater. Geophysical Research Letters, 35(20), 1–5. 10.1029/2008gl035418 [DOI] [Google Scholar]
- Zhou Y, Mao H, Demerjian K, Hogrefe C, & Liu J (2017). Regional and hemispheric influences on temporal variability in baseline carbon monoxide and ozone over the Northeast US. Atmospheric Environment, 164, 309–324. 10.1016/j.atmosenv.2017.06.017 [DOI] [PMC free article] [PubMed] [Google Scholar]
- Zuidema P, Alvarez C, Kramer SJ, Custals L, Izaguirre M, Sealy P, et al. (2019). Is summer African dust arriving earlier to Barbados? The updated long-term in situ dust mass concentration time series from ragged point, Barbados, and Miami, Florida. Bulletin of the American Meteorological Society, 100(10), 1981–1986. 10.1175/bams-d-18-0083.1 [DOI] [Google Scholar]
Associated Data
This section collects any data citations, data availability statements, or supplementary materials included in this article.
Supplementary Materials
Data Availability Statement
Data products used in this work are available at websites summarized above and also here again: IMPROVE and NADP/NTN (http://views.cira.colostate.edu/fed/), NASA products(https://search.earthdata.nasa.gov/search). The CAM5-EAST simulations were performed and archived at DOE’s National Energy Research Scientific Computing Center (NERSC). The data are available through a data repository on the ACTIVATE website (https://www-air.larc.nasa.gov/cgi-bin/ArcView/activate.2019?MANUSCRIPT=1). Part of the data analysis was done using computer resources provided by the NASA Center for Climate Simulation (NCCS) at Goddard Space Flight Center.