

ABSTRACT
Background
Epidemiological studies have been inconsistent regarding the relations between diabetes risk and the consumption of eggs and nutrients in eggs, such as choline, betaine, and cholesterol. There have been few studies among elderly women.
Objectives
The objective of this study was to examine associations between consumption of eggs, cholesterol, choline, and betaine and the risk of diabetes among elderly US women.
Methods
Multivariable Cox regression was used with data from the prospective Women's Health Initiative. Population attributable risks were calculated. Consumption of eggs alone (not mixed in foods) and nutrients were assessed with an FFQ. Diabetes incidence was defined as the first incidence of self-reported diabetes treated with oral diabetes medication or insulin injections.
Results
There were 46,263 women at follow-up baseline. During 13.3 y and 592,984 person-years of follow-up, there were 5480 incident diabetes cases. Higher egg, cholesterol, and choline consumption were each significantly associated with increases in diabetes risk. The associations for eggs and choline were not significant after adjustment for cholesterol consumption. The association for eggs was attenuated after adjustment for non-egg cholesterol consumption, with 1 significant HR in the top consumption quintile (≥3 eggs/wk) of 1.15 (95% CI: 1.05, 1.27; P for linear trend = 0.0001). The population attributable risks for obesity, overweight, consumption of ≥3 eggs/wk, inadequate exercise, and poor diet were 25.0 (95% CI: 22.3, 27.6), 12.8 (95% CI: 11.1, 14.5), 4.2 (95% CI: 2.3, 6.1), 3.5 (95% CI: 1.2, 5.8), and 3.1 (95% CI: 0.5, 5.7), respectively.
Conclusions
As egg consumption increased to ≥3 eggs/wk, there was a steady increase in diabetes risk that may have been due to the cholesterol in the eggs. The population attributable risk for ≥3 eggs/wk was far lower than that for being obese or overweight.
Keywords: egg consumption, dietary cholesterol, dietary choline, dietary betaine, diabetes risk, population attributable risk, nutrition epidemiology, Women's Health Initiative, postmenopausal females
Introduction
Type 2 diabetes (diabetes) is a major public health problem, and its prevalence has recently risen substantially in the United States (1) and worldwide (2). Eggs are a popular food, and egg consumption is postulated to play an important role in diabetes development (3).
However, empirical results regarding the association between egg consumption and diabetes risk are conflicting. For instance, a 12-wk, randomized trial found that daily egg consumption improved fasting blood glucose among overweight or obese diabetic American participants (4). Longitudinal epidemiological analyses have found higher egg consumption to be associated with 1) lower diabetes incidence in a Finnish male cohort (5); 2) higher diabetes risk in 2 prospective American studies, 1 in women and the other in men (6); and 3) no significant diabetes risk in a few other cohorts (7–10).
The high cholesterol content in eggs has been associated with hypercholesterolemia, which can negatively influence blood glucose homeostasis (11). Several prospective epidemiological studies found that increases in dietary cholesterol consumption were associated with elevations in diabetes incidence (6, 12), but there have also been reports of no significant (10, 13) and inverse (13) cholesterol–diabetes associations.
Eggs are not only a source of cholesterol but also a source of choline and betaine. Choline can be transformed into different metabolites in the body, including betaine, which is also present naturally in foods (14). One cross-sectional Canadian study found that higher choline and betaine intakes were associated with lower insulin resistance (15). Prospective epidemiological studies have observed elevated diabetes risk to be associated with 1) higher choline intake among African Americans and Chinese adults (16) and American adults (17) and 2) higher choline or betaine intake among American women (18). However, there have also been findings of an inverse choline–diabetes association among Finnish men (19) and no significant choline–diabetes or betaine–diabetes association among American men (18).
In summary, the epidemiological evidence regarding the long-term eggs–diabetes association is inconsistent. Also, there have been few studies of the associations between consumption of cholesterol, choline, and betaine and diabetes risk and no studies of the associations between consumption of these nutrients in eggs and the risk of diabetes. In addition, there is a dearth of such epidemiological studies focused on elderly women.
Our objective, therefore, was to assess the associations of egg, cholesterol, choline, and betaine consumption with diabetes risk among postmenopausal women in the prospective Women's Health Initiative (WHI) cohort. Based on the results of prior studies, we hypothesized that 1) the eggs–diabetes and the cholesterol–diabetes associations would be positive; 2) the choline–diabetes and betaine–diabetes associations would be inverse; and 3) the cholesterol in eggs contributes to increases, and the choline in eggs contributes to decreases, in diabetes risk as egg consumption increases.
Methods
Participants
The design of the WHI has been detailed in a prior publication (20). Briefly, 161,808 postmenopausal women aged 50–79 y at baseline were enrolled at 41 nationwide clinical centers into the WHI observational study (OS) or ≥1 overlapping clinical trials (CTs) between 1993 and 1998. The OS is a prospective cohort study with ongoing collection of data on factors such as participant characteristics, lifestyle habits, morbidity, and mortality.
Starting with the 93,676 OS participants, we excluded those 1) with self-reported energy consumption <600 or >5000 kcal/d (21); 2) with missing data on exposure variables; 3) with implausible BMIs (in kg/m2; <15 or >50) or height [<122 cm (4 ft)] at the initial visit (year 0) or at the year 3 visit, which was our follow-up baseline; 4) who reported pre-existing major chronic disease, including diabetes, angina, myocardial infarction, stroke, heart failure, coronary artery bypass graft, percutaneous coronary intervention, emphysema, kidney dialysis, or cancer at follow-up baseline—in order to avoid potential reverse causation from dietary changes due to such diseases; and 5) those with missing data on pre-existing major chronic disease or any exposure, outcome, or confounder variables at follow-up baseline. Figure 1 shows the data for egg and cholesterol consumption. For choline and betaine consumption, the only difference was in the last 2 panels: 3,232 (6.5%) of participants were excluded for missing exposure or covariate variables, leaving 46,228 participants in our analytic sample.
FIGURE 1.
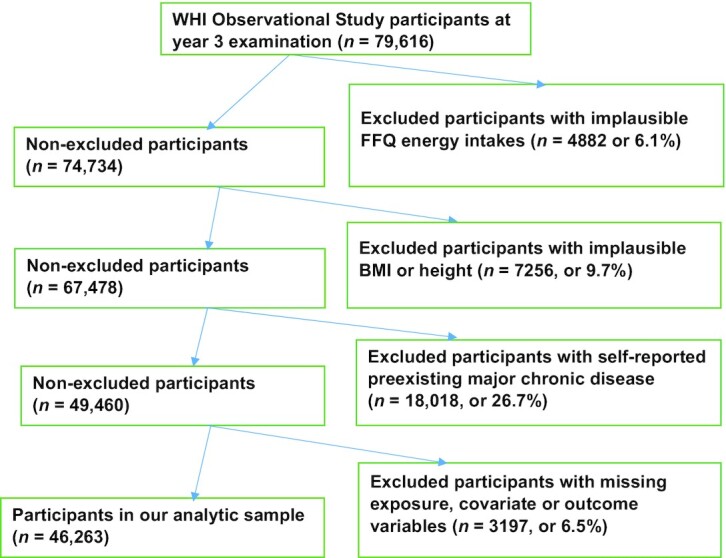
Participant flowchart of the participants in the study. WHI, Women's Health Initiative.
The missing rate for all exposure outcome and confounder variables was <2.9%, considerably less than 5%. Hence, loss of power or bias due to missing cases is not considered to be of concern in our complete cases analysis (22).
Outcome variable
Our outcome variable was the first incidence of diabetes treated with oral diabetes medication or insulin injections, self-reported on semiannual and/or annual survey questionnaires. This measure has been found to be a reliable indicator of diagnosed diabetes in the WHI data (23). The diabetes diagnosis date was calculated as the halfway point between the survey when the diagnosis was first reported and the previous survey. Participants were followed from baseline (year 3) to diagnosis of diabetes, death, loss to follow-up, or March 31, 2018, whichever occurred first. Participants lost to follow-up were censored.
Exposure variables
The WHI semiquantitative FFQ was administered at years 0 and 3 (24). The WHI data on consumption of cholesterol, choline, and betaine were calculated using the Nutrition Data System for Research software developed by the Nutrition Coordinating Center at the University of Minnesota. The software merged the food consumption data from the WHI FFQ with the nutrients-in-foods data in the Nutrition Coordinating Center's food and nutrition database to yield the total amount of cholesterol, choline, and betaine consumed by each WHI participant who completed the FFQ. The FFQ asked for the portion size and frequency of egg consumption during the prior 3 mo. Eggs in cakes, prepared foods, and recipes were not included in the question. Portion size was to be specified as small (<1 egg), medium (2 eggs), or large (≥3 eggs), and the frequency of consumption was to be specified as 1 of 9 options from never or <1/mo to ≥2/d. We calculated a continuous version of egg consumption from portion size and frequency of consumption and used it to assess linearity of the eggs–diabetes association.
Statistical methods
Cox proportional hazards regression models were used to calculate multivariable adjusted HRs for diabetes in different quintiles of egg, cholesterol, choline, and betaine consumption. Our follow-up baseline was year 3. This enabled us to use the mean daily intake of eggs and the 3 egg nutrients at years 0 and 3 as exposure variables to best account for intraindividual variation due to random errors in FFQ data, particularly in egg consumption (25). Tests for linear trend across quintiles of exposure variables used the median value in each quintile as a continuous variable. Schoenfeld residuals were used to check proportionality assumptions.
Correlations between pairs of exposure variables that were entered simultaneously in our models were not high enough to cause any multicollinearity problems. In our analytic sample, the highest Pearson correlation coefficient for eggs was with cholesterol (0.83), for cholesterol it was with choline (0.81), for choline it was with cholesterol (0.81), and for betaine it was with choline (0.47).
Tests of interaction were conducted by inserting a cross-product of the exposure variable and the variable being tested into our full-model. These variables, selected a priori, were age, BMI, and physical activity.
To determine the independent association between the cholesterol and choline in the eggs and diabetes risk, we tested several a priori hypotheses. Also, to assess the independent association of cholesterol, choline, and betaine with diabetes risk, because they tend to occur together in many foods, we tested a priori hypotheses concerning the changes in the associations of these nutrients with diabetes risk after adjusting for the consumption of the other 2 nutrients. (These hypotheses are described in the Supplemental Methods.)
Our basic model covariates were age and race/ethnicity (self-reported white, black, other). We then identified potential covariates based on our knowledge of risk factors for diabetes and available empirical evidence (26). We conducted forward inclusion and backward elimination with the inclusion criterion of a >10% change in ≥1 of the HRs to select the following extra covariates for our full models: BMI based on measured weight and height; BMI change [calculated as BMI at year 3 (follow-up baseline) minus BMI at year 0]; Alternative Healthy Eating Index 2010 (AHEI-2010) (27); non-egg daily energy consumption (derived from FFQ data, assuming eggs eaten were medium-size eggs and there were 63 kcal/egg); physical activity (total energy expended from recreational physical activity in metabolic equivalent hours per week); smoking status (never, past, current); coffee consumption (0–6 cups/d) (28); alcohol consumption in number of drinks per week (0, 0 to <1, 1 to <6, ≥6), and educational level (less than high school grad, high school grad to less than college, college grad to less than master's degree, master's degree or higher).
We employed restricted cubic splines (RCSs) versions (29) of the following continuous covariates and ordinal and categorical covariates with >5 levels because the ability of RCSs to capture nonlinear effects yielded a significant increase in the model's likelihood ratio compared with the continuous, ordinal, or categorical versions: age, physical activity, coffee consumption, BMI, and energy consumption.
To place our results in a broader health perspective, we calculated population attributable risk percentage (PAR%) for all exposure and covariate variables separately (partial PAR%) and combined (full PAR%). The techniques and SAS macro developed by Spiegelman et al. (30) were used for this purpose.
Our sample size calculations using the methods in Hsieh and Lavori (31) showed a need for 3767 events to determine significance of an HR increase of 0.25 in quintiles of exposure with a 2-sided α of 0.05 and 80% power for all exposure variables.
A 2-sided P value of <0.05 was considered significant. SAS version 9.4 (SAS Institute) was used for all analyses. The WHI study is registered at clinictrials.gov as NCT00000611. Our manuscript was prepared using the Strengthening the Reporting of Observational Studies in Epidemiology (STROBE) guidelines for observational studies (32).
Ethics
The WHI study protocol (available at www.whi.org) was approved by institutional review boards at each participating institution, and all participants provided written informed consent. The study was conducted in accordance with the Helsinki Declaration of 1975 as revised in 1983.
Results
Participant baseline characteristics
The mean ± SD number of eggs consumed per week (which did not include eggs in cakes, prepared foods, or recipes) in our analytic sample was 1.87 ± 2.13. A majority (81.7%) of the participants reported consuming ≥1.6 eggs/mo, and 6536 (14.1%) reported consuming none or <1 egg/mo. The mean ± SD intake (in milligrams per day) of cholesterol, choline, betaine, non-egg cholesterol, and non-egg choline was 206.7 ± 125.4, 273.4 ± 108.0, 171.2 ± 93.6, 157.8 ± 80.5, and 234.9 ± 90.7, respectively. The percentage of cholesterol and choline intake from eggs was 23.7% and 14.1%, respectively. Higher frequency of egg intake was associated with 1) higher cholesterol, choline, total energy, non-egg energy, regular coffee intake, and BMI; and 2) a higher proportion of participants whose highest educational level was high school graduation, who were Hispanic, current smokers, consumed ≥6 alcoholic drinks per day, and had pre-existing major chronic disease and a 3-y BMI increase (Table 1). Conversely, higher frequency of egg intake was associated with 1) lower amounts of physical activity and 2) a lower proportion of participants who had a graduate degree.
TABLE 1.
Baseline characteristics of postmenopausal women with different frequencies of egg consumption in the Women's Health Initiative1
| Frequency of egg consumption (no. of eggs) | |||||
|---|---|---|---|---|---|
| <1.6/mo | 1.6/mo to <4/mo | 4/mo to <6.6/mo | 6.6/mo to <3/ wk | ≥3/wk | |
| Characteristics | (n = 8465) | (n = 9702) | (n = 8483) | (n = 9392) | (n = 10,221) |
| Egg intake, eggs/d | 0.01 ± 0.01 | 0.04 ± 0.01 | 0.09 ± 0.01 | 0.15 ± 0.03 | 0.35 ± 0.19 |
| Total cholesterol intake, mg/d | 119.5 ± 53.1 | 147.9 ± 53.4 | 176.7 ± 58.2 | 216.8 ± 64.5 | 322.2 ± 119.3 |
| Non-egg cholesterol, mg/d | 117.6 ± 60.3 | 134.0 ± 61.3 | 148.9 ± 66.3 | 165.4 ± 74.4 | 204.9 ± 93.5 |
| Total betaine intake, mg/d | 177.8 ± 85.4 | 170.8 ± 79.1 | 174.5 ± 78.4 | 180.5 ± 81.4 | 186.8 ± 84.8 |
| Total choline intake, mg/d | 226.6 ± 75.9 | 237.6 ± 74.1 | 258.3 ± 77.2 | 284.7 ± 81.3 | 346.3 ± 102.4 |
| Age, y | 66.4 ± 7.2 | 66.3 ± 7.2 | 66.5 ± 7.1 | 66.2 ± 7.1 | 66.1 ± 7.1 |
| BMI, kg/m2 | 25.7 ± 4.8 | 26.2 ± 4.8 | 26.6 ± 4.9 | 27.1 ± 5.1 | 28.0 ± 5.5 |
| Physical activity,2 MET-h/wk | 16.4 ± 15.8 | 14.9 ± 14.7 | 14.5 ± 14.3 | 14.2 ± 14.5 | 13.6 ± 14.5 |
| Total dietary energy, kcal/d | 1369 ± 470 | 1405 ± 487 | 1479 ± 504 | 1578 ± 544 | 1733 ± 629 |
| Non-egg dietary energy, kcal/d | 1368 ± 470 | 1398 ± 487 | 1467 ± 504 | 1556 ± 543 | 1685 ± 624 |
| Healthy Eating Index3 | 56.5 ± 10.9 | 55.4 ± 10.5 | 55.6 ± 10.5 | 55.2 ± 10.7 | 54.5 ± 11.2 |
| Regular coffee intake, cups/d | 1.05 ± 1.47 | 1.17 ± 1.48 | 1.21 ± 1.50 | 1.27 ± 1.52 | 1.41 ± 1.66 |
| 3-y BMI change in kg/m2, % | |||||
| 3-y BMI decrease (<−0.90) | 15.2 | 15.1 | 14.5 | 16.5 | 17.9 |
| Referent (<−0.90 to <1.48) | 67.0 | 67.0 | 67.2 | 65.0 | 61.8 |
| 3-y BMI loss (≥1.48) | 17.8 | 18.0 | 18.3 | 18.5 | 20.4 |
| Self-reported race/ethnicity, % | |||||
| White | 85.8 | 88.1 | 88.7 | 88.8 | 86.7 |
| Black | 7.0 | 5.0 | 4.5 | 4.3 | 5.3 |
| Hispanic | 2.2 | 2.4 | 2.5 | 3.0 | 3.7 |
| Other | 5.0 | 4.5 | 4.3 | 4.0 | 4.4 |
| Education,2 % | |||||
| Less than high school grad | 2.8 | 2.8 | 2.6 | 2.8 | 3.8 |
| High school grad to less than BA or BS | 46.7 | 49.6 | 48.9 | 50.5 | 52.5 |
| BA or BS to less than MA or MS | 26.0 | 26.0 | 27.7 | 26.0 | 24.3 |
| MA or MS or higher | 24.6 | 21.5 | 20.8 | 20.7 | 19.5 |
| Alcohol intake, % | |||||
| 0 drinks/wk | 43.7 | 38.0 | 35.8 | 35.5 | 37.3 |
| <1 drink/wk | 19.6 | 21.4 | 20.3 | 21.3 | 20.2 |
| 1 to <6 drinks/wk | 23.5 | 26.3 | 28.6 | 27.6 | 26.0 |
| ≥6 drinks/wk | 13.1 | 14.3 | 15.3 | 15.5 | 16.5 |
| Smoking, % | |||||
| Never | 54.6 | 53.2 | 54.4 | 51.9 | 50.2 |
| Former | 42.5 | 43.2 | 42.1 | 43.9 | 44.2 |
| Current | 2.9 | 3.6 | 3.5 | 4.2 | 5.6 |
| Pre-existing major chronic disease, %4,5 | 25.9 | 25.6 | 25.5 | 27.0 | 28.2 |
Values are means ± SDs for continuous variables. Percentages are used for categorical variables. Data are for observational study participants in the analytic sample (see Figure 1). All characteristics showed significant differences between levels of egg intake (P < 0.05) based on ANOVA, Welch's ANOVA, or chi-square test. P for trend was <0.05 for all continuous variables, except for age (P = 0.0.36). P for trend, based on Cochran–Armitage test, was <0.05 for all binary variables. BA, Bachelor of Arts; BS, Bachelor of Science; MA, Master of Arts; MET, metabolic equivalent; MS, Master of Science.
Physical activity and educational level were quantified by WHI researchers. Physical activity was total energy expended in recreational physical activity.
The Revised Alternative Healthy Eating Index (27).
For this variable, participants satisfied all the exclusion criteria in Figure 1, except being free of pre-existing major chronic disease.
Pre-existing serious chronic disease (yes/no) included diabetes, heart attacks, stroke, heart failure, coronary artery bypass graft, revascularization (percutaneous transluminal coronary angioplasty), and cancer.
Prospective association between exposure variables and the risk of diabetes
During 13.3 y and 592,984 person-years of follow-up, there were 5480 incident cases of diabetes. There was a significant dose–response linear trend of higher diabetes risk for higher egg intake with a significant HR in the 5th consumption quintile in our full-model analysis (Table 2). Adjusting for cholesterol consumption, with or without further adjusting for choline consumption, removed the significance of the positive linear trend and the 5th quintile HR (Table 3). Adjusting for non-egg cholesterol consumption, with or without further adjusting for non-egg choline consumption, left a significant linear trend and attenuated the magnitude of the significant HR slightly. Figure 2 shows the survival function for this analysis. Adjusting for total choline consumption led to small decreases in the HRs, and adjusting for non-egg choline consumption made essentially no changes in the HRs. We did not adjust the eggs–diabetes association for betaine intake because there is a substantially lower concentration of betaine (0.3 mg/100 g of egg) than choline (293.8 mg/100 g) or cholesterol (372.7 mg/100 g) in eggs (33).
TABLE 2.
Egg, cholesterol, choline, and betaine consumption, HRs, and 95% CIs for incident diabetes in the Women's Health Initiative1
| Quintiles of consumption2 | ||||||
|---|---|---|---|---|---|---|
| Covariates in the model | 13 | 2 | 3 | 4 | 5 | P-linear4 |
| Exposure: egg consumption | ||||||
| Cases/women5 | 888/8465 | 1054/9702 | 948/8483 | 1133/9392 | 1457/10,221 | |
| Age and race/ethnicity6 | 1.00 | 1.05 (0.96, 1.15) | 1.09 (1.00, 1.20) | 1.21 (1.11, 1.32) | 1.48 (1.36, 1.61) | <0.0001 |
| Full model7 | 1.00 | 1.00 (0.91, 1.09) | 1.02 (0.93, 1.12) | 1.08 (0.99, 1.18) | 1.22 (1.11, 1.33) | <0.0001 |
| Exposure: total cholesterol consumption | ||||||
| Cases/women | 841/8582 | 1032/9891 | 1118/9890 | 1216/9447 | 1273/8453 | |
| Age and race/ethnicity | 1.00 | 1.09 (0.99, 1.19) | 1.17 (1.07, 1.28) | 1.39 (1.27, 1.52) | 1.68 (1.54, 1.83) | <0.0001 |
| Full model | 1.00 | 1.04 (0.94, 1.14) | 1.07 (0.98, 1.18) | 1.23 (1.11, 1.35) | 1.31 (1.18, 1.46) | <0.0001 |
| Exposure: total choline consumption | ||||||
| Cases/women | 795/7495 | 1068/9799 | 1176/10,038 | 1145/9812 | 1292/9084 | |
| Age and race/ethnicity | 1.00 | 1.01 (0.92, 1.11) | 1.08 (0.99, 1.18) | 1.08 (0.99, 1.19) | 1.36 (1.25, 1.49) | <0.0001 |
| Full model | 1.00 | 1.04 (0.94, 1.14) | 1.11 (1.00, 1.22) | 1.12 (1.00, 1.25) | 1.30 (1.15, 1.47) | <0.0001 |
| Exposure: total betaine consumption | ||||||
| Cases/women | 885/7705 | 1097/9330 | 1179/9656 | 1192/9790 | 1123/9747 | |
| Age and race/ethnicity | 1.00 | 0.99 (0.91, 1.09) | 1.02 (0.93, 1.11) | 1.01 (0.92, 1.10) | 0.93 (0.85, 1.02) | 0.08 |
| Full model | 1.00 | 0.99 (0.90, 1.08) | 1.00 (0.92, 1.10) | 0.99 (0.90, 1.09) | 0.90 (0.81, 1.002) | 0.04 |
HRs and 95% CIs were determined by means of Cox regression. The 4 nutrient exposure variables were each the mean of the year 0 and year 3 values at year 3 (follow-up baseline), when the WHI FFQ was administered. Incident diabetes was the first occurrence of self-reported diabetes treated with pills or injections between the year 3 survey and March 31, 2018. Our analytic sample included observational study participants without 1) implausible FFQ energy intakes (defined as mean intakes <600 or >5000 kcal/d), BMI (<15 or >50), or height <122 cm (4 ft); 2) any of the following pre-existing major chronic conditions at follow-up baseline: diabetes, angina, myocardial infarction, stroke, heart failure, emphysema, kidney dialysis, coronary artery bypass graft, percutaneous coronary intervention, or cancer; or 3) missing values on any pre-existing major chronic condition or any exposure, outcome, or confounder variables. MET, metabolic equivalent; WHI, Women's Health Initiative.
Quintile categories at baseline (year 3) were as follows: egg consumption: <1.6/mo, 1.6 to <4/mo, 4 to <6.6/mo, 6.6 to <3/wk, and ≥3/wk; cholesterol (mg/day): <115.6, 115.6 to <159.3, 159.3 to <206.0, 206.0 to <276.0, and ≥276.0; choline (mg/day): <184.0, 184.0 to <233.1, 233.1 to <280.7, 280.7 to <343.7, and ≥343.7; betaine (mg/day): <103.5, 103.5 to <140.6, 140.6 to <179.3, 179.3 to <234.1, and ≥234.1. Egg, cholesterol, choline, and betaine consumption were assessed by means of a semiquantitative FFQ.
Referent category.
Tests for linear trend were performed by using the median in each exposure quintile as the sole exposure variable in the model.
Cases, the number of incident diabetes events during the 13.3-y follow-up period. Women, the number of participants without pre-existing serious chronic disease at year 3 (baseline) who met all inclusion criteria. The number of cases for the full model is lower than that for the model with age, race/ethnicity, and WHI study arm as covariates because of missing values for some of the extra covariates in the full model. For each exposure variable, analyses with age, race/ethnicity, and WHI study arm as covariates used the same lower number of cases and women as analyses for the full model.
Race/ethnicity was self-reported.
Basic model covariates were age (years) and self-reported race/ethnicity (white, black, Hispanic, other). The full model included additional continuous and categorical variables. The continuous variables were BMI, 3-y BMI change, the revised Alternative Healthy Eating Index (27), non-egg daily energy intake for models with eggs as the exposure variable, and total daily energy intake for models with an egg nutrient as the exposure variable. Energy intake was derived from FFQ data; physical activity (total energy expended from recreational physical activity in MET-h/wk); smoking status (never, past, current); alcohol intake in drinks/wk (0, 0 to <1, 1 to <6, and >6); educational level (less than high school grad, high school grad to some college, college grad to less than master's degree, master's degree or higher), and coffee consumption (0–6 cups/d).
TABLE 3.
Egg, cholesterol, choline, and betaine consumption, adjusted for intake of different nutrients, and HRs and 95% CIs for incident diabetes in the Women's Health Initiative1
| Consumption quintiles2 | ||||||
|---|---|---|---|---|---|---|
| Adjustment variables | 13 | 2 | 3 | 4 | 5 | P-linear4 |
| Exposure: egg consumption | ||||||
| Cases/women5 | 887/1459 | 1054/9690 | 946/8476 | 1132/9388 | 1457/10,215 | |
| Total cholesterol | 1.00 | 0.98 (0.90, 1.08) | 0.99 (0.89, 1.09) | 1.01 (0.91, 1.12) | 1.09 (0.96, 1.22) | 0.07 |
| Total choline | 1.00 | 1.00 (0.91, 1.09) | 1.01 (0.92, 1.11) | 1.06 (0.97, 1.16) | 1.17 (1.07, 1.29) | <0.0001 |
| Total cholesterol and total choline | 1.00 | 0.98 (0.90, 1.08) | 0.98 (0.89, 1.09) | 1.00 (0.90, 1.12) | 1.08 (0.96, 1.22) | 0.08 |
| Non-egg cholesterol6 | 1.00 | 0.99 (0.90, 1.08) | 1.01 (0.92, 1.10) | 1.05 (0.95, 1.15) | 1.15 (1.05, 1.27) | <0.0001 |
| Non-egg choline6 | 1.00 | 1.00 (0.91, 1.09) | 1.02 (0.93, 1.12) | 1.08 (0.99, 1.18) | 1.22 (1.12, 1.33) | <0.0001 |
| Non-egg cholesterol and non-egg choline | 1.00 | 0.99 (0.90, 1.08) | 1.00 (0.91, 1.10) | 1.04 (0.95, 1.15) | 1.15 (1.05, 1.27) | 0.0001 |
| Exposure: total cholesterol consumption | ||||||
| Cases/women | 841/8578 | 1029/9879 | 1118/9885 | 1215/9437 | 1273/8449 | |
| Total choline | 1.00 | 1.04 (0.94, 1.15) | 1.08 (0.97, 1.21) | 1.23 (1.09, 1.39) | 1.29 (1.13, 1.48) | <0.0001 |
| Total choline and total betaine | 1.00 | 1.03 (0.94, 1.14) | 1.07 (0.96, 1.20) | 1.21 (1.08, 1.37) | 1.26 (1.10, 1.45) | 0.0002 |
| Exposure: total choline consumption | ||||||
| Cases/women | 795/7,495 | 1068/9799 | 1176/10,038 | 1145/9812 | 1292/9084 | |
| Total cholesterol | 1.00 | 0.99 (0.89, 1.09) | 1.00 (0.89, 1.13) | 0.96 (0.84, 1.09) | 1.06 (0.90, 1.24) | 0.39 |
| Total cholesterol and total betaine | 1.00 | 1.00 (0.90, 1.11) | 1.02 (0.90, 1.15) | 0.98 (0.85, 1.12) | 1.10 (0.93, 1.29) | 0.19 |
| Exposure: total betaine consumption | ||||||
| Cases/women | 885/7705 | 1097/9330 | 1179/9656 | 1192/9790 | 1123/9747 | |
| Total cholesterol | 1.00 | 0.99 (0.90, 1.08) | 1.01 (0.92, 1.10) | 0.99 (0.90, 1.09) | 0.91 (0.82, 1.01) | 0.08 |
| Total cholesterol and total choline | 1.00 | 0.99 (0.90, 1.09) | 1.01 (0.92, 1.11) | 0.99 (0.90, 1.09) | 0.90 (0.81, 1.003) | 0.03 |
HRs and 95% CIs were determined by means of Cox regression. The 4 baseline nutrient exposure variables were each the mean of the year 0 and year 3 values at year 3 (follow-up baseline), when the WHI FFQ was readministered. Incident diabetes was the first occurrence of self-reported diabetes treated with pills or injections between the year 3 baseline survey and March 31, 2018. All models were full models that were adjusted for age (years), self-reported race/ethnicity (white, black, other), and several continuous and categorical variables. The full model included additional continuous and categorical variables. The continuous variables were BMI, 3-y BMI change, the Revised Alternative Healthy Eating Index (27), non-egg daily energy intake for models with eggs as the exposure variable, and total daily energy intake for models with an egg nutrient as the exposure variable. Energy intake was derived from FFQ data, physical activity (total energy expended from recreational physical activity in MET-h/wk), smoking status (never, past, current), alcohol intake in drinks/wk (0, 0 to <1, 1 to <6, >6), educational level (less than high school grad, high school grad to some college, college grad to less than master's degree, master's degree or higher), and coffee consumption (0–6 cups/d). Our analytic sample included observational study participants without 1) implausible FFQ energy intakes (defined as mean intakes <600 or >5000 kcal/d), BMI (<15 or >50), or height <122 cm (4 ft); 2) any of the following pre-existing major chronic conditions at follow-up baseline: diabetes, angina, myocardial infarction, stroke, heart failure, emphysema, kidney dialysis, coronary artery bypass graft, percutaneous coronary intervention, or cancer; or 3) missing values on any pre-existing major chronic condition or any exposure, outcome, or confounder variables. MET, metabolic equivalent; WHI, Women's Health Initiative.
Quintile categories at baseline (year 3) were as follows: egg consumption: <1.6/mo, 1.6 to <4/mo, 4 to <6.6/mo, 6.6/mo to <3/wk, and ≥3/wk; cholesterol (mg/day): <115.6, 115.6 to <159.3, 159.3 to <206.0, 206.0 to <276.0, and ≥276.0; choline (mg/day): <184.0, 184.0 to < 233.1, 233.1 to <280.7, 280.7 to <343.7, and ≥343.7; betaine (mg/day): <103.5, 103.5 to <140.6, 140.6 to <179.3, 179.3 to <234.1, and ≥234.1. Egg, cholesterol, choline, and betaine consumption were assessed by means of a semiquantitative FFQ.
Referent category.
Tests for linear trend were performed by using the median in each exposure quintile as the sole exposure variable in the model.
Cases, the number of incident diabetes events during the 13.3-y follow-up period. Women, the number of participants without pre-existing serious chronic disease at year 3 (baseline) who met all our inclusion criteria.
Non-egg cholesterol consumption was total cholesterol consumption minus the number of medium-sized eggs consumed multiplied by the cholesterol content of such eggs (164 mg/egg). Non-egg choline consumption was total choline consumption minus the number of medium-sized eggs consumed multiplied by the choline content of such eggs (129 mg/egg). Both the cholesterol content and the choline content of medium-sized eggs were obtained from the US Department of Agriculture, Agricultural Research Service (33).
FIGURE 2.
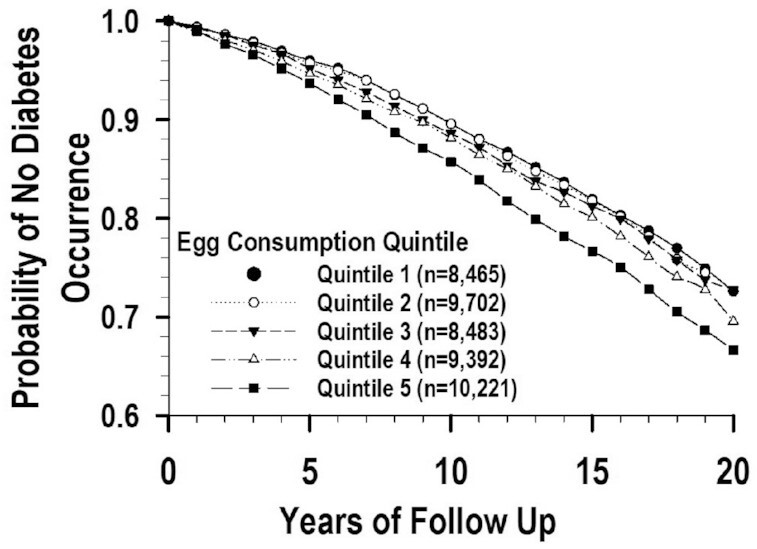
Survival functions for the eggs and diabetes association adjusted for non-egg cholesterol in the Women's Health Initiative.
We observed a significant dose–response linear trend toward higher diabetes risk for higher cholesterol intake in our full-model analysis (Table 2). Adjusting for choline and betaine consumption resulted in minimal changes to the HRs (Table 3). There was a significant dose–response linear trend of higher diabetes risk for higher choline intake in our full-model analysis (Table 2). Adjusting for cholesterol or cholesterol and betaine consumption removed the significance of all results (Table 3). There was a significant linear trend but no significant HRs for betaine in relation to diabetes (Table 2). Results did not change after adjusting for cholesterol consumption or cholesterol and choline consumption (Table 3).
Tests of interaction for age, physical activity, and BMI in the associations involving our main full-model findings with eggs, eggs adjusted for non-egg cholesterol, eggs adjusted for cholesterol, and cholesterol as the exposure variable yielded significant results only for age in the eggs–diabetes association, whether or not adjusted for cholesterol or non-egg cholesterol (P = 0.04), and in the cholesterol–diabetes association (P = 0.002). Analyses within age categories showed that there were no significant HRs at or above the median age (66.5 y), except for the 5th consumption cholesterol quintile, in which the HR (95% CI; n, number of events) was 1.24 (1.06, 1.46; n = 485). For age below the median, there were significant HRs for all 4 exposure variables (Supplemental Table 1). The results in the 5th quintile of consumption were 1.40 (1.21, 1.63; n = 788), 1.34 (1.20, 1.51; n = 856), 1.22 (1.04, 1.43; n = 856), and 1.26 (1.11, 1.43; n = 856) for consumption of cholesterol, eggs (unadjusted), eggs adjusted for cholesterol consumption, and eggs adjusted for non-egg cholesterol consumption, respectively.
Population attributable risks
After adjusting for non-egg cholesterol intake, the PAR% for intake of ≥3 eggs/d (4.2%) was only 16.8% and 32.8% as high as for being obese (25.0%) and overweight (12.8%), respectively (Table 4). The PAR%s for the 3rd through 5th quintile of egg consumption adjusted for non-egg cholesterol were all lower than those for unadjusted egg consumption, for which the PAR% for consumption of ≥3 eggs/wk was only 22.1% and 43.1% as high as for being obese and overweight, respectively (Supplemental Table 2). The PAR% for the 5th quintile of unadjusted cholesterol consumption (≥276.0 mg/d) was 25.2% and 49.2% as high as for being obese and overweight, respectively (Supplemental Table 3). The PAR% for each covariate was not much different across the 3 models.
TABLE 4.
PAR% of diabetes incidence with consumption of eggs adjusted for non-egg cholesterol as an exposure in the WHI1
| Exposure variables | Covariates | At risk/referent | Follow-up, 10,000 person-years (at risk/referent) | Diabetes cases per 10,000 person-years (at risk/referent) | Partial PAR% (95% CI) |
|---|---|---|---|---|---|
| Egg intake adjusted for non-egg cholesterol intake, full PAR%: 68.2 (50.2, 80.5) | |||||
| Egg intake, 5th quintile | ≥3/wk/<1.6/mo | 13/11 | 116/81 | 4.2 (2.3, 6.1) | |
| Egg intake, 4th quintile | 6.6/mo to <3/wk/<1.6/mo | 12/11 | 95/81 | 1.2 (−0.3, 2.7) | |
| Egg intake, 3rd quintile | 4 to <6.6/mo/<1.6/mo | 11/11 | 86/81 | 0.3 (−1.0, 1.6) | |
| Obesity, kg/m2 | ≥30/18.5 to <25 | 12/25 | 174/56 | 25.0 (22.3, 27.6) | |
| Overweight, kg/m2 | 25 to <30/18.5 to <25 | 21/25 | 93/56 | 12.8 (11.1, 14.5) | |
| Alcohol, drinks/wk | <1/≥1 | 33/36 | 106/76 | 9.6 (6.0, 13.3) | |
| Advanced age, y | ≥70/<60 | 17/15 | 96/88 | 7.8 (6.0, 9.7) | |
| Self-reported race/ethnicity | Non-white/white | 6/73 | 144/87 | 6.1 (4.8, 7.4) | |
| Old age, y | 60–69/<60 | 27/15 | 93/88 | 5.3 (2.6, 8.1) | |
| Smoking | Ever/never | 28/43 | 95/90 | 4.4 (1.9, 6.8) | |
| Non-egg cholesterol—5th quintile, mg/d | ≥210.4/<95.5 | 10/11 | 121/76 | 4.2 (1.8, 6.6) | |
| Regular coffee, cups/d | 0/≥0 | 31/39 | 97/88 | 4.1 (1.3, 7.0) | |
| Non-egg energy, kcal/d | ≥1255/<1255 | 21/53 | 93/93 | 3.6 (1.4, 5.9) | |
| Exercise, MET-h/wk | <6/≥6 | 18/56 | 114/83 | 3.5 (1.2, 5.8) | |
| AHEI-2010 | <52.3/≥52.3 | 22/51 | 108/83 | 3.1 (0.5, 5.7) | |
| Non-egg cholesterol—4th quintile, mg/d | 162.4 to <210.4/<95.5 | 12/11 | 99/76 | 2.8 (0.7, 4.9) | |
| 3-y BMI decrease, kg/m2 | <−0.9/−0.9 to <1.48 | 9/39 | 101/82 | 2.5 (1.3, 3.7) | |
| 3-y BMI increase, kg/m2 | ≥1.48/−0.9 to <1.48 | 11/39 | 123/82 | 2.3 (0.6, 3.9) | |
| Non-egg cholesterol—3rd quintile, mg/d | 128.6 to <162.4/<95.5 | 13/11 | 87/76 | 1.1 (−0.8, 3.0) | |
| Non-egg cholesterol—2nd quintile, mg/d | 95.5 to <128.6/<95.5 | 13/11 | 83/76 | 0.6 (−1.1, 2.3) | |
| Education level | Less than high school grad/more than high school grad | 9/68 | 106/90 | 0.6 (−0.8, 1.9) | |
PAR%s were calculated for the exposure and covariate variables separately (partial PAR%) and combined (full PAR%). The techniques and SAS macro developed by Spiegelman et al. (30) were used for this purpose. The egg consumption exposure variable was the mean of the year 0 and year 3 values at year 3 (follow-up baseline), when the WHI FFQ was readministered. The 2nd quintile of egg consumption was not included in the analysis because it did not yield an HR >1.0 (30). Incident diabetes was the first occurrence of self-reported diabetes treated with pills or injections between the year 3 baseline survey and March 31, 2018. Our analytic sample included observational study participants without 1) implausible FFQ energy intakes (defined as mean intakes <600 or >5000 kcal/d), BMI (<15 or >50), or height <122 cm (4 ft); 2) any of the following pre-existing major chronic conditions at follow-up baseline: diabetes, angina, myocardial infarction, stroke, heart failure, emphysema, kidney dialysis, coronary artery bypass graft, percutaneous coronary intervention, or cancer; or 3) missing values on any pre-existing major chronic condition or any exposure, outcome, or confounder variables. AHEI-2010, Alternative Healthy Eating Index 2010; MET, metabolic equivalent; PAR%, population attributable risk percentage; WHI, Women's Health Initiative.
Secondary and sensitivity analyses
We conducted exploratory sensitivity analyses using our Cox regression full models for the following 4 associations: eggs–diabetes, eggs–diabetes adjusted for cholesterol consumption, eggs–diabetes adjusted for non-egg cholesterol consumption, and cholesterol–diabetes. First, to test the effects of potential reverse causation, we excluded women who developed diabetes within the first 2 y of follow-up and then repeated the analyses. Second, to assess whether excluding women with pre-existing major chronic disease may have biased our results, we repeated the analyses after excluding only pre-existing diabetes. Third, we used only the year-3 baseline assessments of egg and cholesterol as exposure variables in order to assess the effects of our original use of the mean of the year 0 and year 3 assessments as exposure variables. Fourth, in order to test the effects of unhealthy foods that could accompany egg intake, we added consumption of bacon, breakfast sausage, or scrapple as a covariate. We also added consumption of saturated fat in separate analyses. Adding these variables as covariates did not meet our covariate inclusion criterion (>10% change in any of the non-referent HRs) and made very small changes in HRs. The largest change was a 2.46% increase in the 5th-quintile HR for eggs adjusted for non-egg cholesterol as exposure variable after adding saturated fat as a covariate. Finally, we used the average value at year 0 and year 3 for the following covariates to assess the extent to which this change would modify our results: exercise, smoking, alcohol intake, coffee intake, AHEI-2010, and non-egg energy intake. The results of these 5 analyses (Supplemental Table 4) were not substantially different from those in Tables 2 and 3.
Discussion
We found a dose–response linear trend of higher diabetes risk for greater egg intake and an elevated risk in the 5th consumption quintile (≥3 eggs/wk) in our sample of postmenopausal women from the prospective WHI cohort. Cholesterol consumption exhibited a similar pattern with elevated risk in the 4th and 5th consumption quintiles. After adjusting the eggs–diabetes association for total cholesterol consumption, the linear trend and elevated risk were no longer significant. These results suggest that consumption of the cholesterol in eggs and other foods was responsible for much of our observed increases in diabetes risk. We also found that adjusting the eggs–diabetes association for non-egg cholesterol consumption yielded a significant linear trend and a significant but attenuated elevated risk in the top consumption quintile. These observations were not much changed in 5 sensitivity analyses. Taken together, these findings suggest that after accounting for the cholesterol in consumed foods other than eggs, egg consumption increases of ≥3 eggs/wk were associated with steady elevations in diabetes risk that were probably primarily due to the cholesterol in the eggs.
Our significant dose–response linear trend of higher diabetes risk associated with higher cholesterol consumption at or above the 4th quintile was unchanged after adjusting for choline and betaine consumption. Thus, American postmenopausal women may experience an increase in diabetes risk from cholesterol consumption ≥206.0 mg/d.
Our PAR results showed that after adjusting for non-egg cholesterol consumption, the percentage of diabetes cases attributed to consumption of ≥3 eggs/wk was only approximately one-sixth and one-third as high as that attributed to being obese and overweight, respectively. This finding is consistent with the well-established high diabetes risk associated with body weight above normal levels (34) and suggests that frequent consumption of eggs among elderly women is unlikely to elevate diabetes risk to the same extent as being obese or overweight.
As outlined in the Introduction, different prior longitudinal epidemiological analyses have yielded increases, decreases, or no significant changes in diabetes risk with increases in egg intake. The heterogeneity of these results is evident in other similar analyses (35–38) and is consonant with the heterogeneity observed in a recent systematic review and meta-analysis (38). Such heterogeneity suggests that our results should be compared with results from cohorts of similar size, age range, nationality, and gender. Our analysis involved 46,263 elderly American women. We observed increases in diabetes risk, a result that is probably best compared with a prior analysis with a large (n = 82,750) cohort of elderly American women whose result was similar to ours, rather than another with a smaller (n = 2229) cohort of elderly American women that found no significant changes (10).
Adjusting the eggs–diabetes association for total cholesterol consumption attenuated the elevated diabetes risk and left only 1 significant HR in the top sextile of egg consumption in the longitudinal American Women's Health Study (6). This result is similar to our finding that adjusting for total cholesterol consumption attenuated elevated diabetes risk and left no significant HRs. We also found that adjusting for non-egg cholesterol consumption attenuated elevated diabetes risk and left a significant positive HR in the top consumption quintile. These 2 results were the basis for our conclusion that the cholesterol in eggs was probably mainly responsible for elevating diabetes risk in our top consumption quintile. We did not find any published studies that adjusted for non-egg cholesterol consumption.
Our finding of a significant dose–response linear trend of higher diabetes risk for higher cholesterol intake is consistent with the results of several longitudinal epidemiological studies (6, 12), but not with the negative cholesterol–diabetes association found in the longitudinal Cardiovascular Health Study (10). The mechanisms by which cholesterol intake may contribute to higher diabetes risk are still unclear. Hypercholesterolemia is a risk factor for hyperglycemia, partly because it directly reduces insulin secretion from the pancreatic β-cells (11). However, dietary cholesterol intake is not consistently supported as a contributor to hypercholesterolemia in human studies.
A cross-sectional Canadian cohort study by Gao et al. (15) found that increases in choline and betaine intake were both significantly associated with decreases in insulin resistance. These results are not consistent with our finding of no significant HRs for the unadjusted betaine–diabetes association or with our positive unadjusted choline–diabetes association. It is possible that the difference in study design could help explain these different results. Our unadjusted betaine–diabetes results, but not our unadjusted choline–diabetes results, are consistent with the results of a prospective analysis by Yang et al. (16), who found no significant choline–diabetes or betaine–diabetes association among white American adults. It is possible that age, gender, or lifestyle differences between WHI's and Yang et al.’s participants account for the differences in the choline–diabetes results. Our positive choline diabetes association was no longer significant after adjustment for cholesterol intake. A possible explanation is that cholesterol and choline coexist in many animal foods, such as eggs, meat, and fish, such that our adjustment for cholesterol also removed cholesterol-associated diabetes risk from the choline–diabetes association.
Our study has several strengths. The WHI data set 1) has been compiled and validated using proven methods (15); 2) provides a measure of diabetes incidence that has proven reliable (23); 3) contains established diabetes risk factor variables that we employed as covariates, and this undoubtedly helped reduce residual confounding; and 4) is large enough to provide adequate statistical power for all our subgroup analyses. Our sensitivity analyses supported aspects of our analysis. For instance, our AHEI-2010 covariate was well able to capture the effects of “unhealthy” foods such as bacon, breakfast sausage, or scrapple on diabetes risk. Other investigators, such as Drouin-Chartier et al. (38), have arrived at a similar conclusion. In addition, saturated fat does not qualify as a covariate in our analysis. This result is consonant with the results of a systematic review and meta-analysis that concluded that saturated fat is not associated with diabetes risk (39).
Our study has limitations. Although our full models included several demographic, biometric, and lifestyle covariates, residual confounding is possible. Furthermore, our dietary and nutrient intake assessments were based on FFQ data that tend to contain self-reporting biases (24) and are subject to measurement error (40), which can distort risk estimates. In this regard, our exposure variables were the mean of the year 0 and year 3 assessments that thereby allowed us to make corrections for random measurement error. Also, the results of our sensitivity analysis using only the year 3 assessments suggest that the effects of random measurement error were relatively minor for our nutrient exposure variables. Our measure of egg consumption did not account for eggs mixed into foods such as cakes and other prepared or home-cooked foods. The actual amount of egg consumed may therefore be higher than in our exposure variable. This may have biased our HRs toward the null. Our participants were exclusively postmenopausal women, so our findings are not generalizable to men or younger women.
In conclusion, our study in the WHI prospective cohort of US postmenopausal women showed that consumption of ≥3 eggs/wk was followed by a steady increase in diabetes risk that was probably primarily due to the cholesterol in the eggs. Cholesterol consumption showed similar patterns to egg consumption, but with somewhat higher risk in the top 2 consumption quintiles. The proportion of diabetes risk attributed to consuming ≥3 eggs/wk was much lower than that attributed to being obese or overweight. The results of our observational study are prone to residual confounding and require confirmation.
Supplementary Material
Acknowledgements
We thank the WHI investigators (Supplemental Table 5) for their efforts in the collection of the WHI data.
The authors’ responsibilities were as follows—JAG and XJ: developed the overall research plan and wrote, reviewed, and edited the manuscript; JAG: procured and analyzed data and had primary responsibility for final content; LGS, NS, and AHS; reviewed and edited the manuscript; and all authors: read and approved the final manuscript. The authors report no conflicts of interest.
Notes
The WHI program is funded by the National Heart, Lung, and Blood Institute, National Institutes of Health, US Department of Health and Human Services through contracts HHSN268201600018C, HHSN268201600001C, HHSN268201600002C, HHSN268201600003C, and HHSN268201600004C. The funding agencies had no role in the study design; collection, analysis, and interpretation of data; writing of the report; or any aspect of the submission of the report for publication.
Supplemental Methods and Supplemental Tables 1–5 are available from the “Supplementary data” link in the online posting of the article and from the same link in the online table of contents at https://academic.oup.com/ajcn/.
Abbreviations used: AHEI-2010, Alternative Healthy Eating Index 2010; CT; Women's Health Initiative clinical trial; OS, Women's Health Initiative observational study; PAR%, population attributable risk percentage; RCS, restricted cubic spline; WHI, Women's Health Initiative.
Contributor Information
James A Greenberg, Department of Health and Nutrition Sciences, Brooklyn College of the City University of New York, Brooklyn, NY, USA.
Xinyin Jiang, Department of Health and Nutrition Sciences, Brooklyn College of the City University of New York, Brooklyn, NY, USA.
Lesley F Tinker, Division of Public Health Sciences, Fred Hutchinson Cancer Research Center, Seattle, WA, USA.
Linda G Snetselaar, Department of Epidemiology, School of Public Health, University of Iowa, Iowa City, IA, USA.
Nazmus Saquib, Research Unit, College of Medicine, Sulaiman Al-Rajhi Colleges, Al Bukairiyah, Saudi Arabia.
Aladdin H Shadyab, Herbert Wertheim School of Public Health and Human Longevity Science, University of California, San Diego, La Jolla, CA, USA.
Data Availability
Data described in the manuscript, code book, and analytic code will be made available upon request to the corresponding author. Copies of the de-identified data used in our study will be made available upon request to, and pending approval by, the Women's Health Initiative Publications and Presentations Committee.
References
- 1. Fang M. Trends in the prevalence of diabetes among U.S. adults: 1999–2016. Am J Prev Med. 2018;55(4):497–505. [DOI] [PubMed] [Google Scholar]
- 2. Chen L, Magliano DJ, Zimmet PZ. The worldwide epidemiology of type 2 diabetes mellitus—present and future perspectives. Nat Rev Endocrinol. 2012;8(4):228–36. [DOI] [PubMed] [Google Scholar]
- 3. Geiker NRW, Larsen ML, Dyerberg J, Stender S, Astrup A. Egg consumption, cardiovascular diseases and type 2 diabetes. Eur J Clin Nutr. 2018;72(1):44–56. [DOI] [PubMed] [Google Scholar]
- 4. Pourafshar S, Akhavan NS, George KS, Foley EM, Johnson SA, Keshavarz B, Navaei N, Davoudi A, Clark EA, Arjmandi BH. Egg consumption may improve factors associated with glycemic control and insulin sensitivity in adults with pre- and type II diabetes. Food Funct. 2018;9(8):4469–79. [DOI] [PubMed] [Google Scholar]
- 5. Virtanen JK, Mursu J, Tuomainen TP, Virtanen HE, Voutilainen S. Egg consumption and risk of incident type 2 diabetes in men: the Kuopio Ischaemic Heart Disease Risk Factor Study. Am J Clin Nutr. 2015;101:1088–96. [DOI] [PubMed] [Google Scholar]
- 6. Djoussé L, Gaziano JM, Buring JE, Lee IM. Egg consumption and risk of type 2 diabetes in men and women. Diabetes Care. 2009;32(2):295–300. [DOI] [PMC free article] [PubMed] [Google Scholar]
- 7. Sabaté J, Burkholder-Cooley NM, Segovia-Siapco G, Oda K, Wells B, Orlich MJ, Fraser GE. Unscrambling the relations of egg and meat consumption with type 2 diabetes risk. Am J Clin Nutr. 2018;108(5):1121–8. [DOI] [PMC free article] [PubMed] [Google Scholar]
- 8. Djoussé L, Petrone AB, Hickson DA, Talegawkar SA, Dubbert PM, Taylor H, Tucker KL. Egg consumption and risk of type 2 diabetes among African Americans: the Jackson Heart Study. Clin Nutr. 2016;35(3):679–84. [DOI] [PMC free article] [PubMed] [Google Scholar]
- 9. Zazpe I, Beunza JJ, Bes-Rastrollo M, Basterra-Gortari FJ, Mari-Sanchis A, Martínez-González MA;Sun Project Investigators . Egg consumption and risk of type 2 diabetes in a Mediterranean cohort: the Sun Project. Nutr Hosp. 2013;28(1):105–11. [DOI] [PubMed] [Google Scholar]
- 10. Djoussé L, Kamineni A, Nelson TL, Carnethon M, Mozaffarian D, Siscovick D, Mukamal KJ. Egg consumption and risk of type 2 diabetes in older adults. Am J Clin Nutr. 2010;92(2):422–7. [DOI] [PMC free article] [PubMed] [Google Scholar]
- 11. Hao M, Head WS, Gunawardana SC, Hasty AH, Piston DW. Direct effect of cholesterol on insulin secretion: a novel mechanism for pancreatic β-cell dysfunction. Diabetes. 2007;56(9):2328–38. [DOI] [PubMed] [Google Scholar]
- 12. Tajima R, Kodama S, Hirata M, Horikawa C, Fujihara K, Yachi Y, Yoshizawa S, Lida KT, Sone H. High cholesterol intake is associated with elevated risk of type 2 diabetes mellitus—a meta-analysis. Clin Nutr. 2014;33(6):946–50. [DOI] [PubMed] [Google Scholar]
- 13. Kurotani K, Nanri A, Goto A, Mizoue T, Noda M, Oba S, Sawada N, Tsugane S; Japan Public Health Center-based Prospective Study Group.. Cholesterol and egg intakes and the risk of type 2 diabetes: the Japan Public Health Center-based Prospective Study. Br J Nutr. 2014;112(10):1636–43. [DOI] [PubMed] [Google Scholar]
- 14. Craig SA. Betaine in human nutrition. Am J Clin Nutr. 2004;80(3):539–49. [DOI] [PubMed] [Google Scholar]
- 15. Gao X, Wang Y, Sun G. High dietary choline and betaine intake is associated with low insulin resistance in the Newfoundland population. Nutrition. 2017;33:28–34. [DOI] [PubMed] [Google Scholar]
- 16. Yang JJ, Lipworth LP, Shu XO, Blot WJ, Xiang YB, Steinwandel MD, Li H, Gao YT, Zheng W, Yu D. Associations of choline-related nutrients with cardiometabolic and all-cause mortality: results from 3 prospective cohort studies of blacks, whites, and Chinese. Am J Clin Nutr. 2020;111(3):644–56. [DOI] [PMC free article] [PubMed] [Google Scholar]
- 17. Zhou L, Li X, Li S, Wen X, Peng Y, Zhao L. Relationship between dietary choline intake and diabetes mellitus in the National Health and Nutrition Examination Survey 2007–2010. J Diabetes. 2020; [Epub ahead of print]. doi:10.1111/1753-0407.13143. [DOI] [PubMed] [Google Scholar]
- 18. Dibaba DT, Johnson KC, Kucharska-Newton AM, Meyer K, Zeisel SH, Bidulescu A. The association of dietary choline and betaine with the risk of type 2 diabetes: The Atherosclerosis Risk in Communities (ARIC) study. Diabetes Care. 2020;43(11):2840–6. [DOI] [PMC free article] [PubMed] [Google Scholar]
- 19. Virtanen JK, Tuomainen TP, Voutilainen S. Dietary intake of choline and phosphatidylcholine and risk of type 2 diabetes in men: the Kuopio Ischaemic Heart Disease Risk Factor Study. Eur J Nutr. 2020;59(8):3857–61. [DOI] [PMC free article] [PubMed] [Google Scholar]
- 20. The Women's Health Initiative Study Group.. Design of the Women's Health Initiative clinical trial and observational study. Control Clin Trials. 1998;19(1):61–109. [DOI] [PubMed] [Google Scholar]
- 21. Goldberg GR, Black AE, Jebb SA, Cole TJ, Murgatroyd PR, Coward WA, Prentice AM. Critical evaluation of energy consumption data using fundamental principles of energy physiology: I. Derivation of cut-off limits to identify under-recording. Eur J Clin Nutr. 1991;45(12):569–81. [PubMed] [Google Scholar]
- 22. Graham JW. Missing data analysis: making it work in the real world. Annu Rev Psychol. 2009;60:549–76. [DOI] [PubMed] [Google Scholar]
- 23. Jackson JM, DeFor TA, Crain AL, Kerby TJ, Strayer LS, Lewis CE, Whitlock EP, Williams SB, Vitolins MZ, Rodabough RJet al. Validity of diabetes self-reports in the Women's Health Initiative. Menopause. 2014;21(8):861–8. [DOI] [PMC free article] [PubMed] [Google Scholar]
- 24. Patterson RE, Kristal AR, Tinker LF, Carter RA, Bolton MP, Agurs-Collins T. Measurement characteristics of the Women's Health Initiative food frequency questionnaire. Ann Epidemiol. 1999;9(3):178–87. [DOI] [PubMed] [Google Scholar]
- 25. Willett W. Nutritional epidemiology. 3rd ed. New York: Oxford University Press; 2013. [Google Scholar]
- 26. Wu Y, Ding Y, Tanaka Y, Zhang W. Risk factors contributing to type 2 diabetes and recent advances in the treatment and prevention. Int J Med Sci. 2014;11(11):1185–200. [DOI] [PMC free article] [PubMed] [Google Scholar]
- 27. Chiuve SE, Fung TT, Rimm EB, Hu FB, McCullough ML, Wang M, Stampfer MJ, Willett WC. Alternative dietary indices both strongly predict risk of chronic disease. J Nutr. 2012;142(6):1009–18. [DOI] [PMC free article] [PubMed] [Google Scholar]
- 28. Grosso G, Godos J, Galvano F, Giovannucci EL. Coffee, caffeine, and health outcomes: an umbrella review. Annu Rev Nutr. 2017;37:131–56. [DOI] [PubMed] [Google Scholar]
- 29. Harrell FE. Regression modeling strategies: with applications to linear models, logistic and ordinal regression, and survival analysis. 2nd ed. New York: Springer-Verlag; 2015. pp. 18–30. [Google Scholar]
- 30. Spiegelman D, Hertzmark E, Wand HC. Point and interval estimates of partial population attributable risks in cohort studies: examples and software. Cancer Causes Control. 2007;18(5):571–9. [DOI] [PubMed] [Google Scholar]
- 31. Hsieh FY, Lavori PW. Sample-size calculations for the Cox proportional hazards regression model with nonbinary covariates. Control Clin Trials. 2000;21(6):552–60. [DOI] [PubMed] [Google Scholar]
- 32. von Elm E, Altman DG, Egger M, Pocock SJ, Gøtzsche PC, Vandenbroucke JP; STROBE Initiative.. Strengthening the Reporting of Observational Studies in Epidemiology (STROBE) statement: guidelines for reporting observational studies. BMJ. 2007;335(7624):806–8. [DOI] [PMC free article] [PubMed] [Google Scholar]
- 33. US Department of Agriculture, Agricultural Research Service, Food Data Central.. Eggs, Grade A, large, egg whole. FDC ID 171287. [Internet]. April 1, 2019; [cited August 18, 2020]. Available from https://fdc.nal.usda.gov/fdc-app.html#/food-details/171287/nutrients. [Google Scholar]
- 34. Hu FB, Manson JE, Stampfer MJ, Colditz G, Liu S, Solomon CG, Willett WC. Diet, lifestyle, and the risk of type 2 diabetes mellitus in women. N Engl J Med. 2001;345(11):790–7. [DOI] [PubMed] [Google Scholar]
- 35. Lee J, Kim J. Egg consumption is associated with a lower risk of type 2 diabetes in middle-aged and older men. Nutr Res Pract. 2018;; 12(5):396–405. [DOI] [PMC free article] [PubMed] [Google Scholar]
- 36. Lajous M, Bijon A, Fagherazzi G, Balkau B, Boutron-Ruault MC, Clavel-Chapelon F. Egg and cholesterol intake and incident type 2 diabetes among French women. Br J Nutr. 2015;114(10):1667. [DOI] [PubMed] [Google Scholar]
- 37. Vang A, Singh PN, Lee JW, Haddad EH, Brinegar CH. Meats, processed meats, obesity, weight gain, and occurrence of diabetes among adults: findings from Adventist Health Studies. Ann Nutr Metab. 2008;52(2):96–104. [DOI] [PubMed] [Google Scholar]
- 38. Drouin-Chartier JP, Schwab AL, Chen S, Li Y, Sacks FM, Rosner B, Manson JE, Willett WC, Stampfer MJ, Hu FBet al. Egg consumption and risk of type 2 diabetes: findings from 3 large US cohort studies of men and women and a systematic review and meta-analysis of prospective cohort studies. Am J Clin Nutr. 2020:112(3):619–30. [DOI] [PMC free article] [PubMed] [Google Scholar]
- 39. de Souza RJ, Mente A, Maroleanu A, Cozma AI, Ha V, Kishibe T, Uleryk E, Budylowski P, Schünemann H, Beyene Jet al. Intake of saturated and trans unsaturated fatty acids and risk of all-cause mortality, cardiovascular disease, and type 2 diabetes: systematic review and meta-analysis of observational studies. BMJ. 2015;351:h3978. [DOI] [PMC free article] [PubMed] [Google Scholar]
- 40. Knuiman MW, Divitini ML, Buzas JS, Fitzgerald PE. Adjustments for regression dilution in epidemiological regression analysis. Ann Epidemiol. 1998;8:56–63. [DOI] [PubMed] [Google Scholar]
Associated Data
This section collects any data citations, data availability statements, or supplementary materials included in this article.
Supplementary Materials
Data Availability Statement
Data described in the manuscript, code book, and analytic code will be made available upon request to the corresponding author. Copies of the de-identified data used in our study will be made available upon request to, and pending approval by, the Women's Health Initiative Publications and Presentations Committee.