Abstract
Advanced and accurate forecasting of COVID‐19 cases plays a crucial role in planning and supplying resources effectively. Artificial Intelligence (AI) techniques have proved their capability in time series forecasting non‐linear problems. In the present study, the relationship between weather factor and COVID‐19 cases was assessed, and also developed a forecasting model using long short‐term memory (LSTM), a deep learning model. The study found that the specific humidity has a strong positive correlation, whereas there is a negative correlation with maximum temperature, and a positive correlation with minimum temperature was observed in various geographic locations of India. The weather data and COVID‐19 confirmed case data (1 April to 30 June 2020) were used to optimize univariate and multivariate LSTM time series forecast models. The optimized models were utilized to forecast the daily COVID‐19 cases for the period 1 July 2020 to 31 July 2020 with 1 to 14 days of lead time. The results showed that the univariate LSTM model was reasonably good for the short‐term (1 day lead) forecast of COVID‐19 cases (relative error <20%). Moreover, the multivariate LSTM model improved the medium‐range forecast skill (1–7 days lead) after including the weather factors. The study observed that the specific humidity played a crucial role in improving the forecast skill majorly in the West and northwest region of India. Similarly, the temperature played a significant role in model enhancement in the Southern and Eastern regions of India.
Keywords: COVID‐19, India, LSTM, prediction, SARS‐CoV‐2, specific humidity, temperature
1. INTRODUCTION
Severe acute respiratory syndrome coronavirus 2 (SARS CoV‐2) that causes the coronavirus disease 2019 (COVID‐2019) first emerged in Wuhan, China in early December 2019 (Li et al., 2020; Shen et al., 2020). Since then the disease has quickly spread around the world and established local transmission in many countries including the Americas, Europe, Africa and Asia. This rapid spread of the COVID‐19 cases may be due to a lack of proper information about disease etiology and transmission patterns during the early stage of the epidemic (Zhong et al., 2020). On 7 January 2020, this novel strain of SARS CoV‐2 was isolated and confirmed the circulation in the populace and causes COVID‐19. On 30 January 2020, WHO (World Health Organisation) declared the COVID‐19 outbreak as a public health emergency of international concern (WHO, 2020a) and confirmed as a global pandemic on 11 March 2020 (Cucinotta & Vanelli, 2020). The pandemics disrupt human life, public healthcare systems and economies are unprecedented, and impacts will continue till the vaccine is developed. During the first wave of the pandemic, many countries have been locked down and non‐essential services were shut down and adopted social distancing and face mask‐wearing made compulsory. As of 22 October 2020, more than 40 million COVID‐19 cases and 1.1 million deaths were reported globally (WHO, 2020b).
SARS‐CoV‐2 belongs to the genus Betacoronavirus which includes the SARS CoV‐1, Middle East Respiratory Syndrome (MERS), and two other human coronaviruses (HCoV‐OC43 and HCoV‐HKU1) (Kissler et al., 2020). The SARS‐CoV‐2 spread faster than the two of its ancestor viruses SARS‐CoV‐1 and MERS may be due to high transmission rates produced by asymptomatic carriers (Bai et al., 2020; Vellingiri et al., 2020). HCoV‐OC43 and HCoV‐HKU1 are the most common causes of the common cold and respiratory illness outbreaks during winter time in temperature regions (Killerby et al., 2020; Neher et al., 2020; Su et al., 2016). Similarly, the SARS‐COV 2 is closely related to bat‐derived viruses bat‐SL‐CoVZC45 and bat‐SL‐CoVZXC21 and distinct from SARS‐CoV‐1 (−79% similarity) and MERS‐CoV (−50% similarity) (Jiang et al., 2020; Lai et al., 2020; Liu et al., 2020). SARS‐CoV‐2 is deadly because the case fatality rates are much higher than influenza (Fauci et al., 2020; de Wit et al., 2016). During the initial period of outbreak the case fatality rate (CFR) was 15%, subsequently, with more data emerged, the CFR decreased to between 43% and 110%, and later to 34% (Chen, Zhou, et al., 2020; Wang Det al., 2020; WHO, 2020b) and currently, the CFR is 2.75% (calculated based on COVID‐19 cases and deaths reported worldwide as of 22 October 2020) (WHO, 2020b).
Along with other countries the COVID‐19 cases are also reported in India. The first case of COVID‐19 was identified on 30 January 2020, in Kerala state, India, and it was imported from China (Rawat, 2020). The number of corona cases is gradually increasing across the nation hence, to flatten the curve, India suspended visas for all international travelers from 13 March 2020, onwards. Followed by a travel ban, the Government of India announced a nation‐wide lockdown (from 25 March to 31 May 2020) to minimize human activity across the country (Ministry of Health & Family Welfare, GOI). The unlock processes started on 1st June 2020, except for containment zones. Similarly, COVID‐19 testing capability has been increased rapidly to identify and isolate the infected populace for minimizing the spread. The all India positivity rate (percentage of confirmed among the total tests) is between 8% and 9%, whereas some of the states located in south India have more positivity rates including Maharashtra (20%), Andhra Pradesh (12.3%), Karnataka (12%), Goa (10.4), and Tamil Nadu (8.6%) (ICMR, 2020). Indian Council of Medical Research (ICMR) conducted the COVID‐19 tests among the severe acute respiratory illness (SARI) patients during an early phase of the pandemic in India and found that 1.8% (104 out of 5,911) of SARI patients tested positive for COVID‐19 from 52 districts located in 20 states/Union Territories. The positivity rate was zero during the period 15 February to 14 March 2020, and increased up to 2.6% during the period 15 March to 02 April 2020. The seroepidemiological survey conducted between 11 May and 4 June 2020, in 700 villages/wards, from the 70 districts of the 21 states of India shows that 0.73% (6.4million) of the adults exposed to the coronavirus (Gupta et al., 2020; ICMR COVID study group Abraham et al., 2020; Murhekar et al., 2020). As of 22 October 2020, 7.76 million COVID‐19 cases and 1.17 million deaths were reported in India (My Gov; https://www.mygov.in).
Environmental factors can affect the epidemiological transmission of many infectious diseases. Several studies have revealed that climate and weather conditions could influence the spatial and temporal distribution of infectious diseases (Dhara et al., 2013; Shuman, 2010). The coronaviridae family viruses SARS CoV‐1 and MERs CoV are also shown seasonal variations and prefer low temperature and humidity (Casanova et al., 2010). Similarly, at the early stage of the COVID‐19 pandemic, researchers have reported that the temperature had a positive association and humidity had a negative association with the cases in many regions of the World (Bashir et al., 2020; Briz‐Redón et al., 2020; Chen, Liang, et al., 2020; Liu et al., 2020; Ma et al., 2020; Oliveiros et al., 2020; Sahin, 2020; Wang, Hu, et al., 2020; Wang, Tang, et al., 2020). However, a negative linear relationship between temperature and daily cumulative cases of COVID‐19 is also observed (Prata et al., 2020). Many studies have suggested that the COVID‐19 spread is more in the cold and temperate climate than the warm and tropical climate, consistent with the behaviour of a seasonal flu respiratory virus (Bloom‐Feshbach et al., 2013).
Machine learning and deep learning techniques are the branches of Artificial Intelligence (AI) and provide powerful predictive capabilities and superiority over conventional statistical modelling (Beam & Kohane, 2018; Miguel‐Hurtado et al., 2016; Singal et al., 2013). Despite the high predictive power these algorithms are not widely exposed in public health data analysis. Here, we aim to apply a deep learning algorithm on integrated data sets (epidemiology and climate data) and deployed the multivariate long short‐term memory (LSTM) modelling framework used to forecast COVID‐19 trends in India. Similarly, the LSTM has been used successfully to forecast dengue and influenza (Leonenko et al., 2017; Nadda et al., 2020). Moreover, previous studies have used relative humidity and absolute humidity to understand their role in COVID‐19 transmission. But, studies on the influenza virus show that specific humidity is an important factor for disease transmission. Hence the present study used the specific humidity along with other climatic factors to understand COVID‐19 transmission and forecast in India.
2. METHODS
2.1. Data
All 28 states and 08 Union Territories of India covering latitude (8°N–38°N) and longitude (68°E–98°E) were considered for the study. Daily counts of laboratory‐confirmed COVID‐19 cases of all the states of India were collected from the Ministry of Health and Family Welfare (MoHFW), Government of India from 1 April to 31 July 2020. Similarly, the daily meteorological parameters of a specified period consist of temperature (minimum, maximum and mean) and specific humidity (SH) extracted from NCEP/NCAR reanalysis data (Kalnay et al.,1996) (https://psl.noaa.gov/).
2.2. Cross‐correlation analysis
To understand the weather impact on COVID‐19 cases, the cross‐correlation analysis was carried out to identify the similarities between the lagged meteorological parameters (X) and daily count of COVID‐19 cases (Y) for different states in India during the period 1 April to 31 July 2020. The cross‐correlation coefficients analysis helps identify whether the antecedent (lagged) meteorological parameters are useful predictors for modelling the COVID‐19 cases over different states in India. The cross‐correlation coefficient values are computed as:
where t, d, N represent the time in days, lag in days (0–14), and the total number of days (122) in time series data, respectively.
2.3. Long‐short term memory (LSTM) model
A Long Short‐Term Memory (LSTM) network is a kind of Recurrent Neural Network (RNN) that attempts to model time or sequence dependencies (Arora et al., 2020; Hochreiter & Schmidhuber, 1997; Sagheer & Mostafa, 2019; Shastri et al., 2020). LSTM falls under the category of deep learning and it is performed by feeding back the output of a neural network layer at time t to the input of the same network layer at time t + 1. The proposed work was carried out using the Keras implementation of an LSTM network (Figure 1). The computations were carried out on a five‐node system each with an eight‐core Intel i7‐9700 CPU working at 3 GHz and 32 GB memory each with Keras.
FIGURE 1.
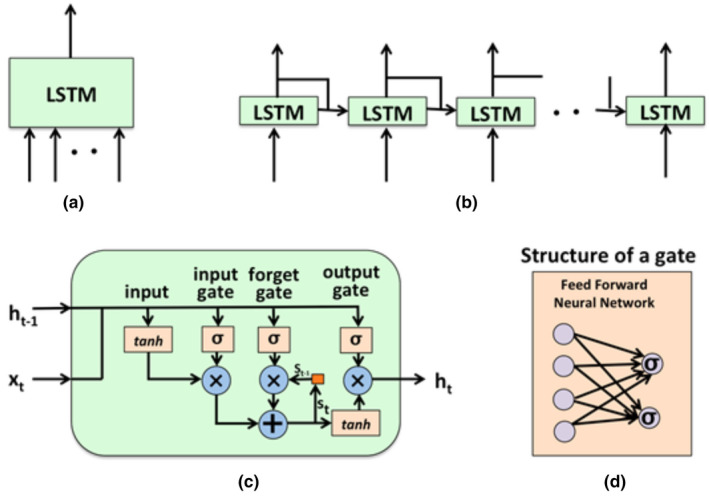
Keras implementation of multi‐parameter LSTM (a) The basic LSTM structure (b) Unrolled representation of LSTM (c) Architecture of an LSTM cell (d) Internal structure of a cell gate
The block diagram of a basic multi‐input LSTM network and the memory transformation between each cell of LSTM was presented in Figure 1a and b. The LSTM cell consists of three gates: input gate (it ), forget gate (ft ), and output gate (ot ) with different functionality (Figure 1c). The forget gate is responsible for forgetting information that is not required anymore, while the input gate is used for adding new useful information. The output gate updates the hidden states at every time step. Each gate is a feed‐forward neural network with many hidden units as shown in Figure 1d. The mathematical representation of LSTM is given below in Equations (1)–(5) (Hochreiter & Schmidhuber, 1997).
| (1) |
| (2) |
| (3) |
| (4) |
where σ, i, f, o, and g represent the sigmoid function, input gate, forget gate, output gate, and un‐gated input transformation, respectively. The weights (wi, wf, wo, wg and ui, uf, uo, ug ) are represented in a matrix format, bias (bi, bf, bo, bg ) are represented in vectors, and S t‐1 represents the cell state of the previous time step.
The present study utilized both univariate and multivariate LSTM models for forecasting the daily COVID‐19 cases for different states in India. Hence, the time‐series data (1 April to 31 July 2020) selected for the study was divided into two parts, the first three months (April–June) data utilized for training, and the last one‐month (July) data was utilized for testing purposes. The control experiment (CTL) was conducted with the univariate LSTM model and other four experiments (CTL_SH, CTL_Tmax, CTL_Tmin, CTL_Tmean) were conducted with the multivariate LSTM model to understand the weather impact on coronavirus transmission (Table 1). The univariate and multivariate LSTM models were optimized with a minimum error method (considering different hyper‐parameters, such as the number of units in the hidden layer, the number of hidden layers, and so on.) and utilized for forecasting purposes. Hence, state‐level COVID‐19 cases are forecasted (1‐day forecast window) for July 2020 with different initial condition data (lag:1–14 days; Table 1) using univariate and multivariate LSTM models and evaluated with observed data. Further, we have also generated the forecasts with a different combination of the weather parameters and evaluated them with the observed data of high prevalence states for COVID‐19 in India.
TABLE 1.
Description of the LSTM models utilized for the experimental forecast
| Experiments | Input data (1–14 days lag) | Output data (Daily) |
|---|---|---|
| CTL | COVID−19 cases | Forecasted COVID−19 cases |
| CTL_SH | COVID−19 cases and specific humidity | Forecasted COVID−19 cases |
| CTL_Tmax | COVID−19 cases and maximum temperature | Forecasted COVID−19 cases |
| CTL_Tmin | COVID−19 cases and minimum temperature | Forecasted COVID−19 cases |
| CTL_Tmean | COVID−19 cases and mean temperature | Forecasted COVID−19 cases |
Abbreviations: CTl: Control experiment, SH: Specific Humidity, Tmax: Maximum Temperature, Tmin: Minimum Temperature, Tmean: Mean Temperature.
2.4. Model evaluation
2.4.1. Relative error (RE)
The relative error is the ratio between the absolute error and the absolute value of the observation. The average relative error in the forecasting of COVID‐19 daily cases for July (31 days) is calculated as
where X (m,t) and X (o,t) are the model forecasted and observed COVID‐19 cases for the day (t). The computed average relative error was utilized to verify the performance of each model with different lags in predicting the future COVID‐19 cases for the selected states in India.
3. RESULTS
3.1. Spatio‐Temporal variability of COVID‐19 cases and climate in India
Figure 2 illustrates the spatial distribution of monthly COVID‐19 cases for different states of India, from which a geographical heterogeneity of cases was observed. Before the onset of the Southwest monsoon (i.e. April and May), there were only 182,143 cumulative cases observed in India, and the majority of the cases were reported from the Western (Maharashtra, Gujarat, Rajasthan), Northern (Madhya Pradesh, Uttar Pradesh, Delhi) and Southern states of India (Tamil Nadu) (Figure 2). After the onset of the monsoon, there was a rapid growth in cases (cumulative cases during June and July >1.4 milliom) and by the end of July, more than 1.6 million cases were reported in India (Figure 2). However, the maximum number of cases were reported from the Southern states (Maharashtra, Andhra Pradesh, Tamil Nadu, and Karnataka), and moderate cases from the states located in Central, East, and Western parts of India. Similarly, a low number of COVID‐19 cases are reported from the states located in the North and Northeast region of India.
FIGURE 2.
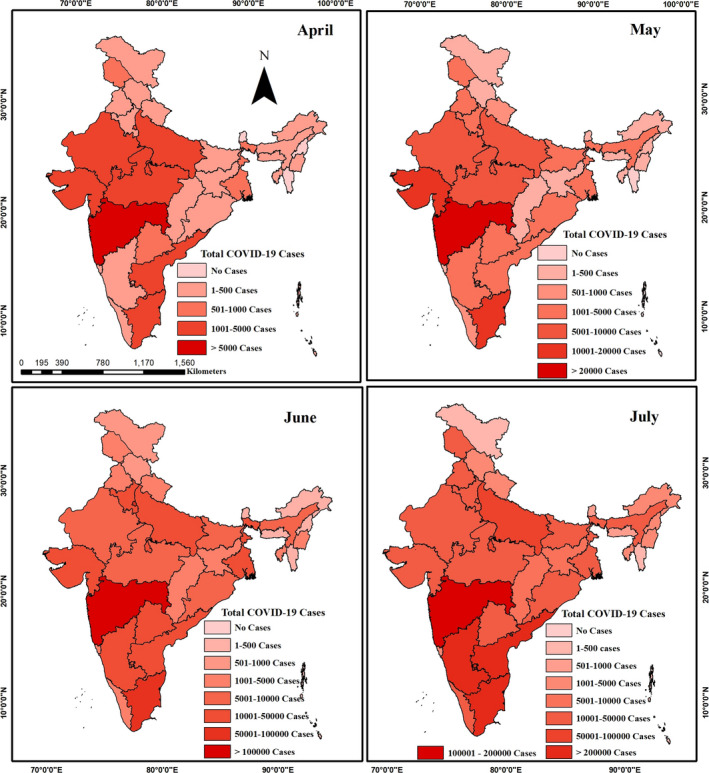
Spatial maps of monthly cumulated COVID‐19 cases over different states in India during pre‐monsoon (April and May) and monsoon season (June and July) of the year 2020
Figure 3 depicts the Spatio‐temporal variation of 2m‐specific humidity (SH), 2m‐maximum temperature (Tmax), 2m‐minimum temperature (Tmin), and 2m‐mean temperature (Tmean) during April, May, June and July of the current year over India. It was observed that the monthly average SH values were very low (<0.01 kg/kg) over Central India (CI), Northwest India (NWI), and North India (NI); moderate (0.01–0.02 kg/kg) SH values over the states located in East and West coast of India; and high (>0.02 kg/kg) over Kerala and Tamil Nadu during the early stage (April and May) of the pandemic. Whereas, the SH was slowly increased from South to North during the monsoon season (June and July) and the high values were observed in July over the Central and East India region. The spatial map of maximum temperature show that most of the regions in Central and Northwest India record more than 40°C during the pre‐monsoon season and it is reduced to <30°C during the monsoon progress over the South and Northeast India. Similarly, the minimum temperature ranges between 20 and 30°C during the pre‐monsoon period and reduced to 20 and 24°C during the onset of monsoon were observed.
FIGURE 3.
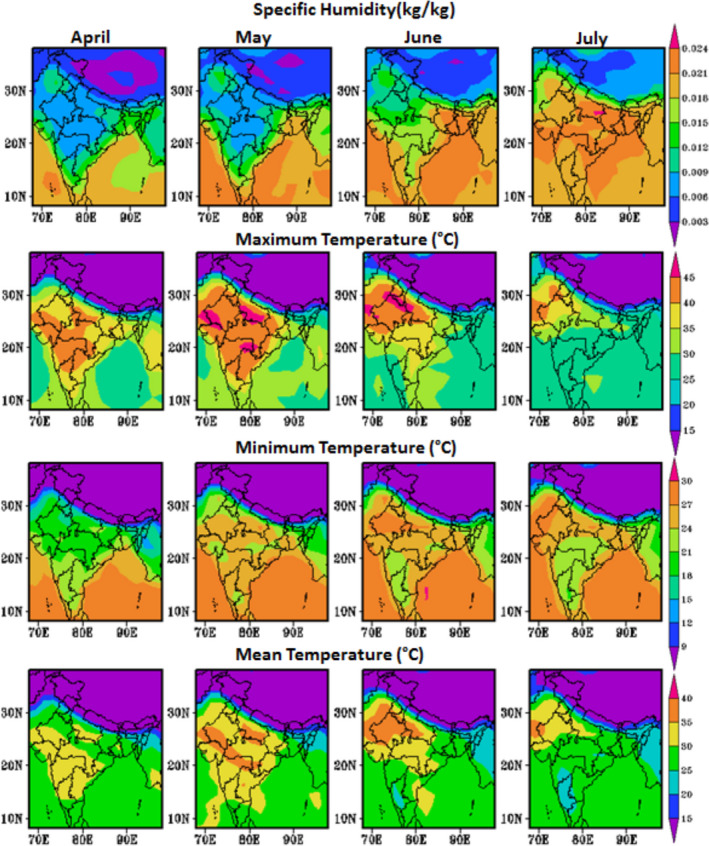
Spatial‐temporal variation of surface meteorological parameters (2m‐specific humidity, 2m‐mean temperature, 2m‐maximum temperature, and 2m‐minimum temperature) during the pre‐monsoon and monsoon season over India
3.2. Association between weather and COVID‐19
To understand the weather effect on COVID‐19 cases, the lag (0–14 days) correlation coefficients (CC) computed between daily COVID‐19 cases and surface meteorological parameters (SH, Tmax, Tmin, Tmean) for the period 01 April to 31 July 2020. Similarly, the study considered 14 days lag correlations due to the symptoms of COVID‐19 that will appear after the incubation period which is typically ranging between 1 and 14 days. The correlation coefficient values for lag1, lag7, and lag14 over different states of India shown in Figure 4. The correlation maps describe that the specific humidity has a strong positive association with COVID‐19 cases for most of the states in India. Maximum correlation (>0.75) values were found in Central and NorthWest India, and moderate correlation (0.5–0.75) values were found in the East coast and some parts of North India (Figure 4). It was observed that the lag7 correlations are slightly better than the lag1 in the majority of the states. The mean temperature and maximum temperature have a strong negative association with COVID‐19 cases over South India and a positive association with foothills of the Himalayas region. Similarly, minimum temperature also has a strong positive association over the North, Northwest, and Northeast India but a weak negative association was found over the South India region (Figure 4).
FIGURE 4.
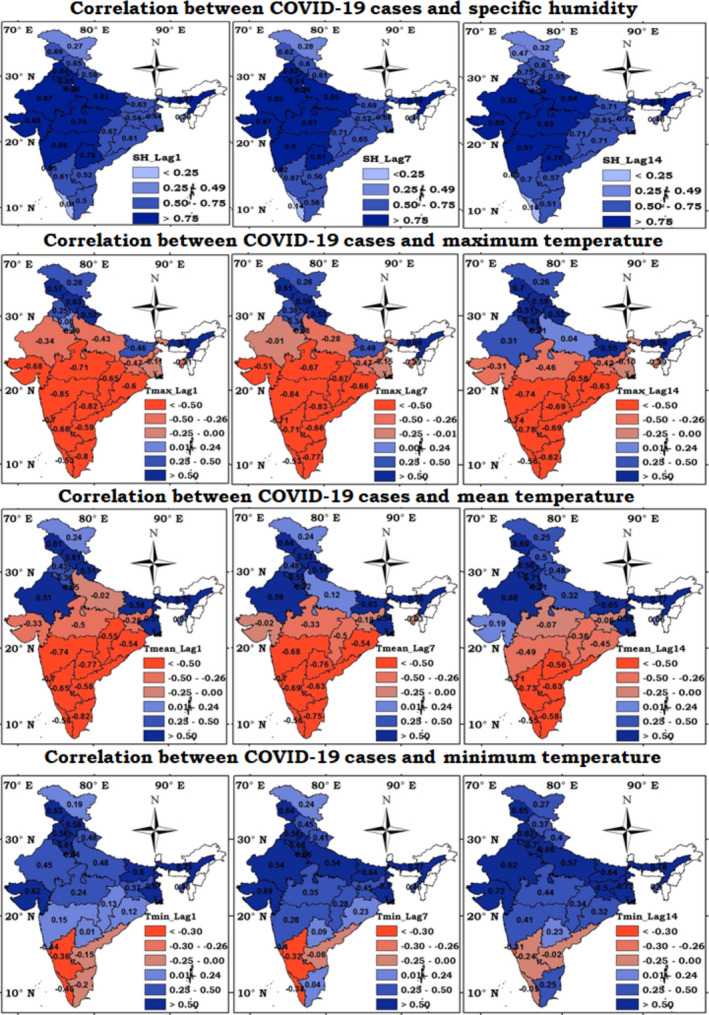
Correlation between confirmed COVID‐19 cases and meteorological parameters (2m‐specific humidity, 2m‐mean temperature, 2m‐maximum temperature, and 2m‐minimum temperature) during the period 01 April to 31 July 2020
3.3. Univariate LSTM model
The present study utilized the three months (01 April to 30 June 2020) data for training and one‐month data (01 July to 31 July 2020) for testing the model. The proposed univariate LSTM model was trained and optimized with time‐series data of confirmed COVID‐19 cases and fit the model for forecasting COVID‐19 cases. The model performance is evaluated with the robust statistical technique of relative error for each forecasted day. The results show that the average relative error (31 days) for univariate LSTM (CTL) is reasonably good (<20%) with lag1 (short‐term forecast, i.e. 24‐hr forecast) for most of the states in India. It is also noted that the univariate LSTM model outperformed compared to the multivariate LSTM model for the states of Andhra Pradesh, Karnataka, Delhi, Bihar, Odisha, and Uttar Pradesh (Figure 5). The univariate LSTM captured the trend very well for both estimated and observed cases in these states (Figure 6). However, the major disadvantage of the univariate model is that the forecast skill is decreased with long‐term lead data.
FIGURE 5.
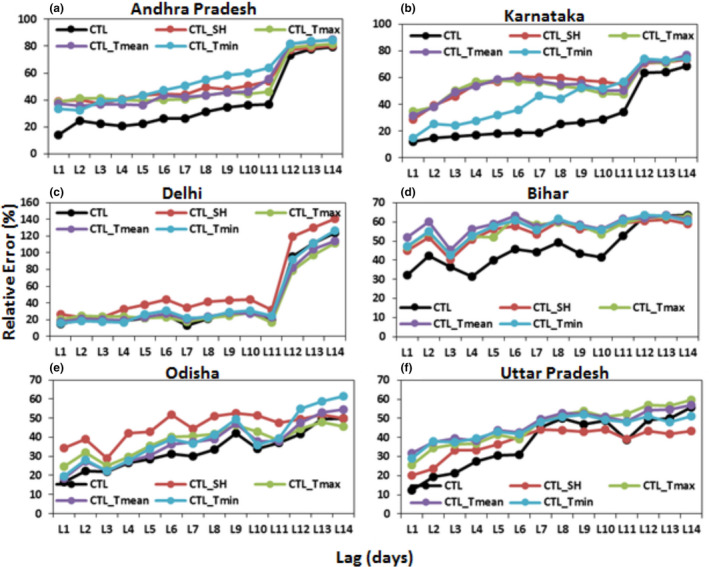
Skill (Average relative error) of univariate (CTL) and multivariate (CTL_SH, CTL_Tmax, CTL_Tmin, CTL_Tmean) LSTM models during the test period (1 July to 31 July 2020) for the states of Andhra Pradesh, Karnataka, Delhi, Bihar, Odisha and Uttar Pradesh. Where L1 to L14 represents the 1 to 14 days of lag data utilized for forecasting of the next day COVID‐19 cases
FIGURE 6.
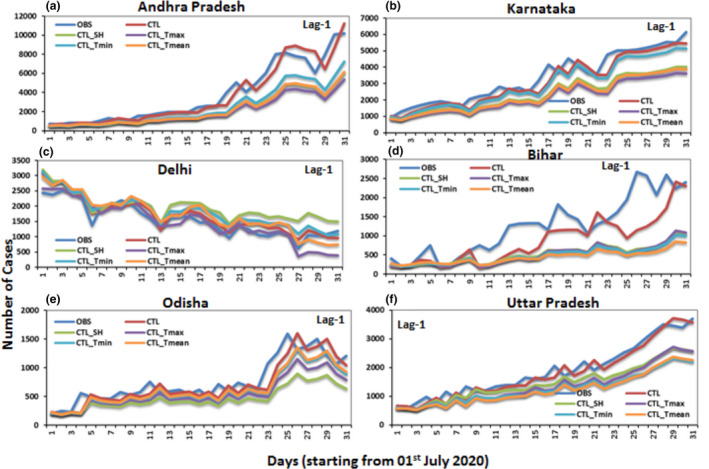
Time series data of COVID‐19 cases forecasted by univariate (CTL) and multivariate (CTL_SH, CTL_Tmax, CTL_Tmin, CTL_Tmean) LSTM models during the test period (1 July to 31 July 2020) for the states of Andhra Pradesh, Karnataka, Delhi, Bihar, Odisha and Uttar Pradesh
Andhra Pradesh and Karnataka are COVID‐19 affected states in South India, the cases were very low during the pre‐monsoon season, whereas the virus transmission was so rapid in monsoon season and more than 0.1 million cases reported in July from these states. The univariate LSTM model which is optimized with the confirmed case data performed well (relative error <15% for Lag1) in capturing the exponential growth of the pandemic, whereas the multivariate model optimized with the weather data underestimated the confirmed cases in these states. The LSTM model has shown its capability not only in increasing the trend but also in capturing the decreasing trend in Delhi (relative error =15%). Similarly, the multivariate LSTM model optimized with minimum temperature has shown slight improvement than univariate LSTM in lead 2, 3, and 4 days lead forecasts in Delhi (Figure 5c). It is also observed that the exponential growth of cases in Uttar Pradesh and Bihar states and the univariate model well captured the observed values and weather integrated multivariate LSTM model underestimate observed cases (Figure 5d,f ).
3.4. Multivariate LSTM model
The states (Maharashtra, Madhya Pradesh, Gujarat, Rajasthan, Haryana, and Punjab) located in West, Northwest India, shown excellent forecasting skill for the multivariate LSTM model (CTL_SH; model optimized with the specific humidity and COVID‐19 cases) compared to the univariate LSTM model. It was also observed that the correlation coefficient between specific humidity and COVID‐19 cases was significant in these regions. Moreover, the study shows that the forecasting skill of the model was improved with the lagged specific humidity (lag1‐lag7) over these regions and it is a significant sign for medium‐range forecasting (Figure 8).
FIGURE 8.
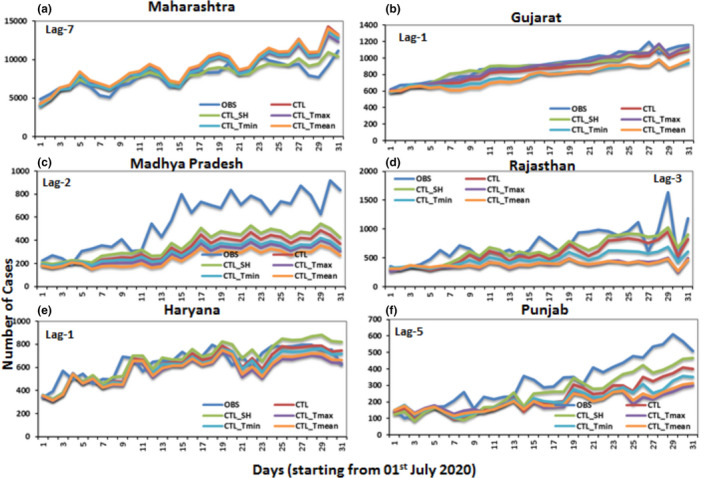
Time series data of COVID‐19 cases forecasted by univariate (CTL) and multivariate (CTL_SH, CTL_Tmax, CTL_Tmin, and CTL_Tmean) LSTM models during the test period (1 July to 31 July 2020) for the states of Maharashtra, Gujarat, Madhya Pradesh, Rajasthan, Haryana and Punjab
Among all the states, the state of Maharashtra reported the highest number of COVID‐19 cases in India. The multivariate LSTM model (CTL_SH) with specific humidity shown better performance (relative error <8%) with lag7 data (Figure 7a). Similarly, the forecasting plot (with one‐week advance data) shows that the model with other weather variables (CTL, CTL_Tmax, CTL_Tmin, and CTL_Tmean) were overestimating the daily cases whereas the specific humidity (CTL_SH) followed the observed trend and close to the observed data (Figure 8a). Similarly, the forecast skill was adequate with the specific humidity for the states of Gujarat (lag1), Madhya Pradesh (lag3), Rajasthan (lag3), Haryana (lag1), and Punjab (lag5) (Figure 8b‐f).
FIGURE 7.
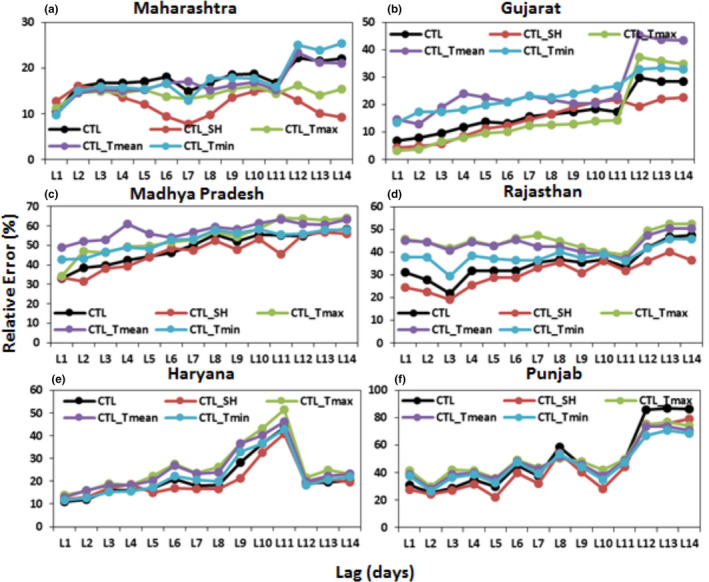
Skill (Average relative error) of univariate (CTL) and multivariate (CTL_SH, CTL_Tmax, CTL_Tmin, CTL_Tmean) LSTM models during the test period (1 July to 31 July 2020) for the states of Maharashtra, Gujarat, Madhya Pradesh, Rajasthan, Haryana and Punjab. Where L1 to L14 represents the 1 to 14 days of lag data utilized for forecasting of the next day COVID‐19 cases
In the case of high humid regions (Kerala, Tamil Nadu, and West Bengal) the forecast skill is improved with the multivariate LSTM model which is optimized with the temperature data (Figure 9). The forecast skill was outperformed with lead 1 (relative error <10%) for Tamil Nadu and West Bengal states and the skill is improved with the maximum and mean temperature. However, in Kerala, the forecast skill was slightly low (relative error between 20% and 30%) with all variables, and a slight improvement was observed in the model which was optimized with the minimum temperature. The forecast plot clearly shows that the temperature‐based LSTM models close to the observations compare to the humidity‐based model in these humid states (Figure 9).
FIGURE 9.
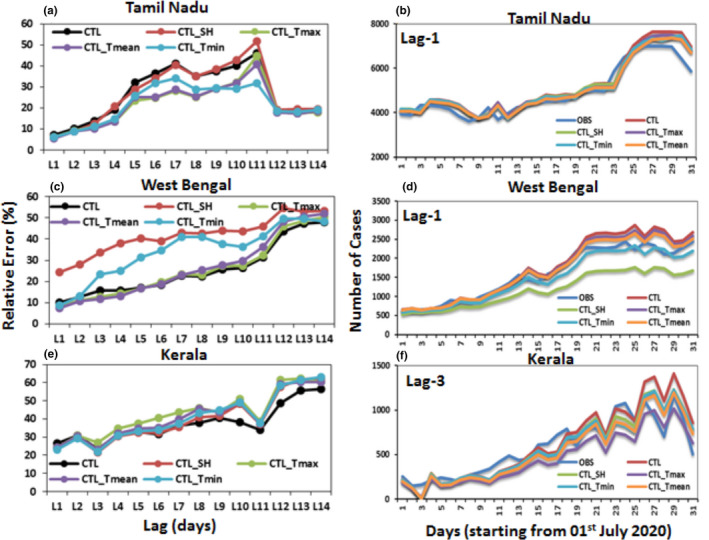
Skill (Average relative error) of univariate (CTL) and multivariate (CTL_SH, CTL_Tmax, CTL_Tmin, CTL_Tmean) LSTM models during the test period (1 July to 31 July 2020) for the states of Tamil Nadu, West Bengal, and Kerala. Where L1 to L14 represents the 1 to 14 days of lag data utilized for forecasting of the next day COVID‐19 cases
4. DISCUSSION
The COVID‐19 cases started during the winter season (the first case reported on 30 January 2020) and the maximum number of cases were reported over Maharashtra and Kerala before the national wide lockdown (25 March 2020) implemented in India. The virus transmission was so rapid after the onset of the monsoon and the maximum number of positive cases were reported from Maharashtra, Karnataka, Andhra Pradesh, Tamil Nadu, Uttar Pradesh, Kerala, Delhi and West Bengal. Based on the earlier studies, the RNN based LSTM models have been shown an adequate skill in short‐range (one day lead) forecasting of COVID‐19 cases (Arora et al., 2020; Shastri et al., 2020). Hence, the present study developed weather‐integrated multivariate LSTM models to improve prediction skills in short to long‐range forecasting of daily cases of COVID‐19 over different states in India. The output of our proposed model can help planners and health authorities to implement appropriate control measures. The state‐wise predictions will help the public health authorities to balance the disease load which medical facilities can take, and this would also help to resume the economic activities otherwise it may create livelihood challenge for the people.
During the early stage of the pandemic, Wu et al. (2020) reported that the humidity and temperature affect COVID‐19 cases. The initial understanding is that the daily new cases have shown reduction with an increase in temperature (1°C increase associated with a 3.08% reduction) and humidity (1% increase associated with a 0.85% reduction). Lin et al. (2020) also studied the temperature and humidity effect on COVID‐19 transmission in the Asian countries and observed that the high relative humidity with low‐temperature increases the COVID‐19 transmission, and high humidity with high temperature reduce the COVID‐19 transmission. Similarly, to understand the impact of weather on the survival of coronavirus, Dbouk and Drikakis, (2020) conducted a study with heat and mass transfer correlations and found that the reduction in coronavirus viability under low humidity and high‐temperature condition. They also found that the high relative humidity increases the airborne virus viability in any environmental temperature conditions.
COVID‐19 transmission rates are mainly depending on the evaporation rate of the contaminated saliva droplets which is released from the infected person to the surrounding environment (Dbouk & Drikakis, 2020). The evaporation rate mainly depends on humidity, temperature and wind speed. The contaminated droplets are more resistant to evaporation when the relative humidity is close to the saturation point, which will allow the contaminated droplet cloud to move longer distances from the source (Dbouk & Drikakis, 2020). A recent study revealed that the droplets (released from the infected person while speaking) size larger than 50 µm fall to the ground very fast, whereas the droplet less than this size slowly reduce their radii based on the evaporation rate of the surrounding environment and remain airborne for a longer duration (Netz & Eaton, 2020). Hence, the higher (lower) relative humidity increase (decrease) the airborne virus viability during the calm wind conditions and possible pathway for acceleration in a COVID‐19 disease outbreak.
To understand the COVID‐19 disease transmission over different states in India, we have analysed the potential evaporation data during pre‐monsoon and monsoon seasons and presented the spatio‐temporal values in Figure 10. At the early stage of the pandemic (pre‐monsoon season), the maximum number of cases were reported from Maharashtra, Gujarat, Rajasthan, Delhi and Uttar Pradesh (Central, north, west, and north‐west India) but the disease transmission was very low (monthly cumulative cases <20,000) during the pre‐monsoon season. The potential evaporation rates (>500 W/m2) were very high in central, north, west and northwest India regions during the pre‐monsoon season due to the high maximum temperatures (>40°C) and low specific humidity (<0.01 kg/kg) for these regions (Figures 3 and 9). The virus viability and travel distance may be low due to the high maximum temperatures and low specific humidity. The national wide lockdown and the unfavourable weather conditions during the pre‐monsoon season reduced the disease transmission over central, west, and north‐west states in India. The potential evaporation rates were slowly reduced in June (after monsoon onset) and reported very low values (<200 W/m2) during July in the south, east, and northeast India regions. These low evaporation rates due to low temperatures and high specific humidity increased the virus viability in the atmosphere (aggravation of airborne transmission) may be the possible reason for the significant increase of COVID‐19 cases in the South India (Figure 10).
FIGURE 10.
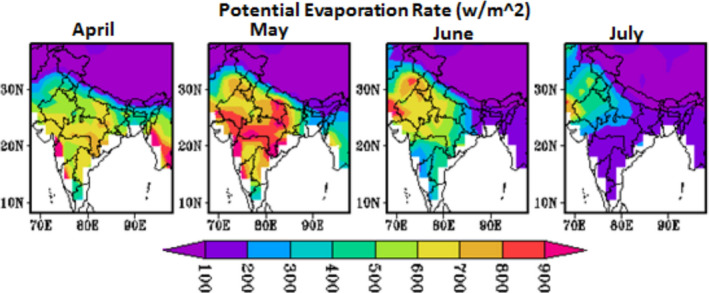
Spatial‐temporal variation of potential evaporation rate (W/m2) during pre‐monsoon and monsoon season over India for the year 2020
The study has few limitations. The important limitation is that the study results can be under or overestimated owing to massive under‐reporting of COVID‐19 cases due to low diagnostic capacity and under testing during the initial phases of the outbreak. Inadequate facilities in primary health care centres, limited or no diagnostic services and delay in the diagnosis also affect the case numbers. Similarly, the latency period of COVID‐19 infection, that is, the period of time in which newly infected individuals are asymptomatic and non‐infectious and this latent infection period was underscored during the epidemic period, which leads to rapid transmission, and the potential of the virus to trigger an epidemic. In addition, limited access to the meteorological observations, in the present study the state‐level meteorological data extracted from low‐resolution NCEP data. Besides these, the training data set is relatively small, which may lead to deviations in the accuracy of predictions. The predictive performance of this system is expected to increase when the training volume is increased. The models developed in the present study are weather integrated models, the present framework has been limited in capturing many aspects such as the effect of lockdown interventions, inter‐state population mobility/population migration, non‐pharmaceutical interventions, disinfection measures, population immunity, and other demographic and socioeconomic factors. The other limitation is that the study did not consider seasonal patterns of COVID‐19 transmission. The forecast model consists of a very limited number of parameters which might weaken the practical significance of the model, hence it is important to consider more parameters that would reduce uncertainty in the model predictions by increasing the predictive performance, and then the results will be more accurate.
It's worth noting the assumptions and premises of LSTM a deep learning model. Accuracy in time series forecasting is a challenging problem due to the dynamic nature of data and non‐stationarity. Moreover, data volatility at any point in the time series can harm the forecasting stability. In the case of COVID‐19 observations, the data is influenced by various parameters such as changing guidelines by the government health agencies from time to time, varying reporting policies by different states, geographically varying lockdowns/unlocks, lack of sufficient testing capabilities, and varying time lags in testing to the outcome. However, one of the most important causes that pollute the data is the time‐to‐time reconciliation due to the inconsistencies in the observations. Hence, traditional time series forecasting models such as Holt's and S‐shaped curves are not suitable in this case due to the random patterns in the day‐to‐day COVID‐19 case data over different states in India. The forecast accuracy may be poor in traditional time series models because the models are built based on assumptions that the data is correlated, and the existing patterns in the time series data will continue in the future. The LSTM models (based on deep learning approaches) are more suitable to handle such non‐linear correlated data (COVID‐19 time series data) due to their long‐term memory, computationally efficiency, and flexibility of including the covariates in the model. In this sense, the proposed LSTM approach can capture the dynamic behaviour of data and have a superior ability to model the nonlinear statistical dependencies in the data which significantly improves the forecasting accuracy. Similarly, the proposed model can be easily applied in disease forecasting problems in comparison to conventional forecasting methods.
5. CONCLUSIONS
Our results suggested that the skill of the univariate LSTM model which is optimized with confirmed COVID‐19 time series data was outperformed for highly affected states like Andhra Pradesh, Karnataka, Uttar Pradesh, Delhi, Bihar and Odisha. It was also noticed that the skill of the univariate model is good in short‐range forecasting (lag1) and the skill is decreasing with increasing lead period. The major findings of the study explained that the medium range (1–7 days lead) forecasting skill has shown adequate skill in some of the states in India when the LSTM models are integrated with time‐series weather data including specific humidity and temperature. The results show that the developed multivariate LSTM models optimized with specific humidity (CTL_SH) shown adequate skills in the medium‐range forecast of daily COVID cases over the states located in the west and northwest India region. It was also observed that the developed multivariate LSTM models with temperature time series data performed very well over the states located in high humid regions including Kerala, Tamil Nadu, and West Bengal. The present study demonstrated the forecasting skill of the LSTM model is improved at medium and long‐range scales due to the integration of weather data in India. The forecasting skill may improve further by incorporating high‐resolution weather data, increasing the length of training data, and optimization methods in LSTM models. Further, these models help the public health authorities for outbreak preparedness, better management of logistics and policy decisions.
CONFLICT OF INTEREST
The authors declare no competing financial interests exist.
ETHICAL STATEMENT
The authors declare that an ethical statement is not applicable because the case information has been gathered.
ACKNOWLEDGEMENTS
The authors are grateful to the Directors of the Council of Scientific and Industrial Research‐Indian Institute of Chemical Technology, Hyderabad, and 4PI, Bangalore for their encouragement and support. The present work is supported by the DST (Department of Science and Technology) under Epidemiology Data Analytics (EDA) of Interdisciplinary cyber‐physical systems (ICPS) programme (Grant number: DST/ICPS/EDA/2018), Govt. of India. The authors are grateful to the MoHFW (Ministry of Health and Family Welfare), Govt. India for providing the state level COVID‐19 data, and NCEP/NCAR for providing meteorological data. Srinivasa Rao Mutheneni acknowledges the Ministry of Environment, Forest & Climate Change (MoEF& CC), Government of India for funding the project environmental information system (ENVIS: Resource Partner on Climate Change and Public Health). The funders had no role in study design, data collection, and analysis, decision to publish, or preparation of the manuscript. CSIR‐IICT communication number of the article is IICT/Pubs./2020/152.
Bhimala KR, Patra GK, Mopuri R, Mutheneni SR. Prediction of COVID‐19 cases using the weather integrated deep learning approach for India. Transbound Emerg Dis. 2022;69:1349–1363. 10.1111/tbed.14102
DATA AVAILABILITY STATEMENT
The data used in this study are available from the corresponding author upon request.
REFERENCES
- Arora, P. , Kumarc, H. , & Panigrahi, B. K. (2020). Prediction and analysis of COVID‐19 positive cases using deep learning models: A descriptive case study of India. Chaos, Solitons & Fractals, 139, 110017. 10.1016/j.chaos.2020.110017 [DOI] [PMC free article] [PubMed] [Google Scholar]
- Bai, Y. , Yao, L. , Wei, T. , Tian, F. , Jin, D. Y. , Chen, L. , & Wang, M. (2020). Presumed asymptomatic carrier transmission of COVID‐19. JAMA, 323(14), 1406–1407. 10.1001/jama.2020.2565 [DOI] [PMC free article] [PubMed] [Google Scholar]
- Bashir, M. F. , Ma, B. , Komal, B. , Bashir, M. A. , Tan, D. , & Bashir, M. (2020). Correlation between climate indicators and COVID‐19 pandemic in (p. 138835). Science of The Total Environment. [DOI] [PMC free article] [PubMed] [Google Scholar]
- Beam, A. L. , & Kohane, I. S. (2018). Big data and machine learning in health care. JAMA, 319, 1317–1318. 10.1001/jama.2017.18391 [DOI] [PubMed] [Google Scholar]
- Bloom‐Feshbach, K. , Alonso, W. J. , Charu, V. , Tamerius, J. , Simonsen, L. , Miller, M. A. , & Viboud, C. (2013). Latitudinal variations in seasonal activity of influenza and respiratory syncytial virus (RSV): A global comparative review. PLoS One, 8(2), e54445. 10.1371/journal.pone.0054445 [DOI] [PMC free article] [PubMed] [Google Scholar]
- Briz‐Redón, Á. , & Serrano‐Aroca, Á. (2020). A spatio‐temporal analysis for exploring the effect of temperature on COVID‐19 early evolution in Spain. Science of the Total Environment, , 728, 138811.– 10.1016/j.scitotenv.2020.138811 [DOI] [PMC free article] [PubMed] [Google Scholar]
- Casanova, L. M. , Jeon, S. , Rutala, W. A. , Weber, D. J. , & Sobsey, M. D. (2010). Effects of air temperature and relative humidity on coronavirus survival on surfaces. Applied and Environmental Microbiology, 76(9), 2712–2717. 10.1128/AEM.02291-09 [DOI] [PMC free article] [PubMed] [Google Scholar]
- Chen, B. , Liang, H. , Yuan, X. , Hu, Y. , Xu, M. , Zhao, Y. , & Zhu, X. (2020). Roles of meteorological conditions in COVID‐19 transmission on a worldwide scale. MedRxiv, 20037168, 10.1101/2020.03.16.20037168 [DOI] [Google Scholar]
- Chen, N. , Zhou, M. , Dong, X. , Qu, J. , Gong, F. , Han, Y. , … Zhang, L. (2020). Epidemiological and clinical characteristics of 99 cases of 2019 novel coronavirus pneumonia in Wuhan, China: A descriptive study. Lancet, 395(10223), 507–513. 10.1016/S0140-6736(20)30211-7 [DOI] [PMC free article] [PubMed] [Google Scholar]
- Cucinotta, D. , & Vanelli, M. (2020). WHO declares COVID‐19 a pandemic. Acta Biomed, 91(1), 157–160. 10.23750/abm.v91i1.9397 [DOI] [PMC free article] [PubMed] [Google Scholar]
- Dbouk, T. , & Drikakis, D. (2020). On respiratory droplets and face masks. Physics of Fluids, 32(6). [DOI] [PMC free article] [PubMed] [Google Scholar]
- de Wit, E. , van Doremalen, N. , Falzarano, D. , & Munster, V. J. (2016). SARS and MERS: Recent insights into emerging coronaviruses. Nature Reviews Microbiology, 14(8), 523–534. 10.1038/nrmicro.2016.81 [DOI] [PMC free article] [PubMed] [Google Scholar]
- Dhara, V. R. , Schramm, P. J. , & Luber, G. (2013). Climate change & infectious diseases in India: Implications for health care providers. The Indian Journal of Medical Research, 138(6), 847–852. [PMC free article] [PubMed] [Google Scholar]
- Fauci, A. S. , Lane, H. C. , & Redfield, R. R. (2020). Covid‐19 ‐ Navigating the Uncharted. The New England Journal of Medicine, 382(13), 1268–1269. 10.1056/NEJMe2002387 [DOI] [PMC free article] [PubMed] [Google Scholar]
- Gupta, N. , Praharaj, I. , Bhatnagar, T. , Vivian Thangaraj, J. W. , Giri, S. , Chauhan, H. , … ICMR COVID Team . (2020). Severe acute respiratory illness surveillance for coronavirus disease 2019, India, 2020. The Indian Journal of Medical Research, 151(2&3), 236–240. 10.4103/ijmr.IJMR_1035_20 [DOI] [PMC free article] [PubMed] [Google Scholar]
- Hochreiter, S. , & Schmidhuber, J. (1997). Long short‐term memory. Neural Computation, 9(8), 1735–1780. 10.1162/neco.1997.9.8.1735 [DOI] [PubMed] [Google Scholar]
- ICMR . (2020). Indian Council of Medical Research. https://www.icmr.gov.in/. Accessed on 08 06 2020
- ICMR Covid Study Group . (2020). Laboratory surveillance for SARS‐CoV‐2 in India: Performance of testing & descriptive epidemiology of detected COVID‐19, January 22 ‐ April 30, 2020. The Indian Journal of Medical Research, 151(5), 424–437. 10.4103/ijmr.IJMR_1896_20 [DOI] [PMC free article] [PubMed] [Google Scholar]
- Jiang, S. , Du, L. , & Shi, Z. (2020). An emerging coronavirus causing pneumonia outbreak in Wuhan, China: Calling for developing therapeutic and prophylactic strategies. Emerging Microbes & Infections, 9(1), 275–277. 10.1080/22221751.2020.1723441 [DOI] [PMC free article] [PubMed] [Google Scholar]
- Kalnay, E. , Kanamitsu, M. , Kistler, R. , Collins, W. , Deaven, D. , Gandin, L. , & Joseph, D. (1996). The NCEP/NCAR 40‐year reanalysis project. Bulletin of the American Meteorological Society, 77(3), 437–472. [DOI] [Google Scholar]
- Killerby, M. E. , Biggs, H. M. , Haynes, A. , Dahl, R. M. , Mustaquim, D. , Gerber, S. I. , & Watson, J. T. (2018). Human coronavirus circulation in the United States 2014–2017. Journal of Clinical Virology, 101, 52–56. 10.1016/j.jcv.2018.01.019 [DOI] [PMC free article] [PubMed] [Google Scholar]
- Kissler, S. M. , Tedijanto, C. , Goldstein, E. , Grad, Y. H. , & Lipsitch, M. (2020). Projecting the transmission dynamics of SARS‐CoV‐2 through the postpandemic period. Science, 368(6493), 860–868. 10.1126/science.abb5793 [DOI] [PMC free article] [PubMed] [Google Scholar]
- Lai, C. C. , Shih, T. P. , Ko, W. C. , Tang, H. J. , & Hsueh, P. R. (2020). Severe acute respiratory syndrome coronavirus 2 (SARS‐CoV‐2) and coronavirus disease‐2019 (COVID‐19): The epidemic and the challenges. International Journal of Antimicrobial Agents, 55(3), 105924. 10.1016/j.ijantimicag.2020.105924 [DOI] [PMC free article] [PubMed] [Google Scholar]
- Leonenko, V. N. , Bochenina, K. O. , & Kesarev, S. A. (2017). Influenza peaks forecasting in Russia: Assessing the applicability of statistical methods. Procedia Computer Science, 108, 2363–2367. 10.1016/j.procs.2017.05.196 [DOI] [Google Scholar]
- Li, Q. , Guan, X. , Wu, P. , Wang, X. , Zhou, L. , Tong, Y. , & Feng, Z. (2020). Early transmission dynamics in Wuhan, China, of novel coronavirus‐infected pneumonia. New England Journal of Medicine, 382(13), 1199–1207. 10.1056/NEJMoa2001316 [DOI] [PMC free article] [PubMed] [Google Scholar]
- Lin, J. , Huang, W. , Wen, M. , Li, D. , Ma, S. , Hua, J. , … Sun, S. (2020). Containing the spread of coronavirus disease 2019 (COVID‐19): Meteorological factors and control strategies. Science of the Total Environment, 744, 140935. 10.1016/j.scitotenv.2020.140935 [DOI] [PMC free article] [PubMed] [Google Scholar]
- Liu, J. , Zhou, J. , Yao, J. , Zhang, X. , Li, L. , Xu, X. , … Zhang, K. (2020). Impact of meteorological factors on the COVID‐19 transmission: A multi‐city study in China. Science of the Total Environment, 726, 138513. [DOI] [PMC free article] [PubMed] [Google Scholar]
- Ma, Y. , Zhao, Y. , Liu, J. , He, X. , Wang, B. O. , Fu, S. , … Luo, B. (2020). Effects of temperature variation and humidity on the death of COVID‐19 in Wuhan, China. Science of the Total Environment, 726, 138226. 10.1016/j.scitotenv.2020.138226 [DOI] [PMC free article] [PubMed] [Google Scholar]
- Miguel‐Hurtado, O. , Guest, R. , Stevenage, S. V. , Neil, G. J. , & Black, S. (2016). Comparing machine learning classifiers and linear/logistic regression to explore the relationship between hand dimensions and demographic characteristics. PLoS One, 11, e0165521. 10.1371/journal.pone.0165521 [DOI] [PMC free article] [PubMed] [Google Scholar]
- Ministry of Health and Family Welfare. https://www.mohfw.gov.in/. Accessed on 07.06.2020
- Murhekar, M. V. , Bhatnagar, T. , Selvaraju, S. , Rade, K. , Saravanakumar, V. , Thangaraj, J. W. V. , … Anand, P. K. (2020). Prevalence of SARS‐CoV‐2 infection in India: Findings from the national serosurvey, May‐June 2020. Indian Journal of Medical Research, 152(1), 48–60. [DOI] [PMC free article] [PubMed] [Google Scholar]
- My gov. https://www.mygov.in/covid‐19. Accessed on 22.10.2020
- Nadda, W. , Boonchieng, W. , & Boonchieng, E. (2020). "Dengue Fever Detection using Long Short‐term Memory Neural Network," 2020 17th International Conference on Electrical Engineering/Electronics, Computer, Telecommunications and Information Technology (ECTI‐CON), Phuket, Thailand, 755‐758. 10.1109/ECTI-CON49241.2020.9158315 [DOI]
- Neher, R. A. , Dyrdak, R. , Druelle, V. , Hodcroft, E. B. , & Albert, J. (2020). Potential impact of seasonal forcing on a SARS‐CoV‐2 pandemic. Swiss Medical Weekly, 150, w20224. 10.4414/smw.2020.20224 [DOI] [PubMed] [Google Scholar]
- Netz, R. R. , & Eaton, W. A. (2020). Physics of virus transmission by speaking droplets. Proceedings of the National Academy of Sciences, 202011889. 10.1073/pnas.2011889117 [DOI] [PMC free article] [PubMed] [Google Scholar]
- Oliveiros, B. , Caramelo, L. , Ferreira, N. C. , & Caramelo, F. (2020). Role of temperature and humidity in the modulation of the doubling time of COVID‐19 cases. MedRxiv, 20031872, 10.1101/2020.03.05.20031872 [DOI] [Google Scholar]
- Prata, D. N. , Rodrigues, W. , & Bermejo, P. H. (2020). Temperature significantly changes COVID‐19 transmission in (sub) tropical cities of Brazil. The Science of the Total Environment, 729, 138862. 10.1016/j.scitotenv.2020.138862 [DOI] [PMC free article] [PubMed] [Google Scholar]
- Rawat, M. (2020). Coronavirus in India: Tracking country's first 50 COVID‐19 cases; what numbers tell. Retrieved from https://www.indiatoday.in/india/story/coronavirus‐in‐india‐tracking‐country‐s‐first‐50‐covid‐19‐cases‐what‐numbers‐tell‐1654468‐2020‐03‐12 Accessed 20 April 2020
- Sagheer, A. , & Mostafa, K. (2019). Time series forecasting of petroleum production using deep LSTM recurrent networks. Neurocomputing, 323, 203–213. [Google Scholar]
- Şahin, M. (2020). Impact of weather on COVID‐19 pandemic in Turkey. Science of the Total Environment, 728, 138810. 10.1016/j.scitotenv.2020.138810 10.1016/j.scitotenv.2020.138810 [DOI] [PMC free article] [PubMed] [Google Scholar]
- Shastri, S. , Singh, K. , Kumar, S. , Kour, P. , & Mansotra, V. (2020). Time series forecasting of Covid‐19 using deep learning models: India‐USA comparative case study. Chaos, Solitons & Fractals, 140, 110227. 10.1016/j.chaos.2020.110227 [DOI] [PMC free article] [PubMed] [Google Scholar]
- Shen, Q. , Guo, W. , Guo, T. , Li, J. , He, W. , Ni, S. , … Peng, H. (2020). Novel coronavirus infection in children outside of Wuhan, China. Pediatrpulmonol, 55(6), 1424–1429. 10.1002/ppul.24762 [DOI] [PMC free article] [PubMed] [Google Scholar]
- Shuman, E. K. (2010). Global climate change and infectious diseases. New England Journal of Medicine, 362, 1061–1063. 10.1056/NEJMp0912931 [DOI] [PubMed] [Google Scholar]
- Singal, A. G. , Mukherjee, A. , Elmunzer, B. J. , Higgins, P. D. , Lok, A. S. , Zhu, J. , … Waljee, A. K. (2013). Machine learning algorithms outperform conventional regression models in predicting development of hepatocellular carcinoma. The American Journal of Gastroenterology, 108(11), 1723–1730. 10.1038/ajg.2013.332 [DOI] [PMC free article] [PubMed] [Google Scholar]
- Su, S. , Wong, G. , Shi, W. , Liu, J. , Lai, A. , Zhou, J. , … Gao, G. F. (2016). Epidemiology, genetic recombination, and pathogenesis of coronaviruses. Trends in Microbiology, 24(6), 490–502. 10.1016/j.tim.2016.03.003 [DOI] [PMC free article] [PubMed] [Google Scholar]
- Vellingiri, B. , Jayaramayya, K. , Iyer, M. , Narayanasamy, A. , Govindasamy, V. , Giridharan, B. , … Subramaniam, M. D. (2020). COVID‐19: A promising cure for the global panic. Science of the Total Environment, 725, 138277. [DOI] [PMC free article] [PubMed] [Google Scholar]
- Wang, D. , Hu, B. , Hu, C. , Zhu, F. , Liu, X. , Zhang, J. , … Peng, Z. (2020). Clinical characteristics of 138 hospitalized patients with 2019 novel coronavirus‐infected pneumonia in Wuhan, China. JAMA, 323(11), 1061–1069. 10.1001/jama.2020.1585 [DOI] [PMC free article] [PubMed] [Google Scholar]
- Wang, J. , Tang, K. , Feng, K. , & Lv, W. (2020). High temperature and high humidity reduce the transmission of COVID‐19. (March 9, 2020). Retrieved from 10.2139/ssrn.3551767 [DOI]
- World Health Organisation . (2020b). https://covid19.who.int/?gclid=EAIaIQobChMI696d9t7H7AIVWX8rCh0kQg2HEAAYASAAEgLAdfD_BwE. Accessed on October 22, 2020
- World Health Organisation. (2020a). https://www.who.int/emergencies/diseases/novel‐coronavirus2019?gclid=EAIaIQobChMI3dD35r3v6QIVVw4rCh0XqwAdEAAYASAAEgLWBvD_BwE. Accessed on 07.06.2020
- Wu, Y. , Jing, W. , Liu, J. , Ma, Q. , Yuan, J. , Wang, Y. , … Liu, M. (2020). Effects of temperature and humidity on the daily new cases and new deaths of COVID‐19 in 166 countries. Science of the Total Environment, 729, 139051. 10.1016/j.scitotenv.2020.139051 [DOI] [PMC free article] [PubMed] [Google Scholar]
- Zhong, L. , Mu, L. , Li, J. , Wang, J. , Yin, Z. , & Liu, D. (2020). Early prediction of the 2019 Novel Coronavirus Outbreak in the Mainland China based on simple mathematical model. IEEE Access, 8, 51761–51769. 10.1109/ACCESS.2020.2979599 [DOI] [PMC free article] [PubMed] [Google Scholar]
Associated Data
This section collects any data citations, data availability statements, or supplementary materials included in this article.
Data Availability Statement
The data used in this study are available from the corresponding author upon request.


