Abstract
One of the challenges of catalysis is the transformation of inert C−H bonds to useful products. Copper‐containing monooxygenases play an important role in this regard. Here we show that low‐temperature oxygenation of dinuclear copper(I) complexes leads to unusual tetranuclear, mixed‐valent μ4‐peroxo [CuI/CuII]2 complexes. These Cu4O2 intermediates promote irreversible and thermally activated O−O bond homolysis, generating Cu2O complexes that catalyze strongly exergonic H‐atom abstraction from hydrocarbons, coupled to O‐transfer. The Cu2O species can also be produced with N2O, demonstrating their capability for small‐molecule activation. The binding and cleavage of O2 leading to the primary Cu4O2 intermediate and the Cu2O complexes, respectively, is elucidated with a range of solution spectroscopic methods and mass spectrometry. The unique reactivities of these species establish an unprecedented, 100 % atom‐economic scenario for the catalytic, copper‐mediated monooxygenation of organic substrates, employing both O‐atoms of O2.
Keywords: catalysis, copper, metalloenzymes, oxygenation, Raman spectroscopy
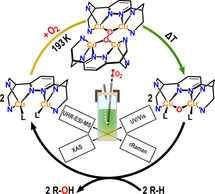
UV/Vis and rRaman spectroscopies complemented by XAS and UHR‐ESI mass spectrometry are employed to monitor the binding of O2 in a tetranuclear copper cluster, followed by homolytic O−O bond cleavage. The resulting mono‐μ‐oxo dicopper(II) complexes catalytically oxygenate a variety of hydrocarbons, establishing an unprecedented, 100 % atom‐economic scenario for the monooxygenation of organic substrates from gaseous O2.
Introduction
The transformation of inert C−H bonds to useful products is one of the great challenges of chemistry. [1] Successful strategies to address this problem will preferentially involve catalysts based on earth‐abundant metals, operating under mild conditions and in an atom‐ as well as energy efficient fashion. [2] One of the most interesting candidates in this regard is copper, also due to its role in copper‐dependent monooxygenases.[ 3a , 3b , 4 ] For example, methane monooxygenases (MMOs) enable methanotrophic bacteria to catalyze the conversion of methane to methanol under ambient conditions. Mimicking this reactivity with synthetic model systems thus is of high scientific and technological interest.[ 2 , 3 , 4 , 5 , 6 , 7 ] Whereas nature's predominant form of MMO, particulate methane monooxygenase (pMMO), contains copper, a dinuclear iron active site performs this reaction in soluble methane monooxygenase (sMMO). The identity of the active site in pMMO is, however, subject to controversy. The methane‐to‐methanol conversion mediated by this enzyme has been proposed to occur (i) on a mononuclear copper site,[ 4b , 4c , 8 , 9 ] (ii) through a dinuclear copper–oxygen species[ 10 , 11 , 12 ] or (iii) within a tricopper cluster.[ 1 , 6 , 13 , 14 ]
In both forms of MMO, just like in other copper‐ and iron‐containing monooxygenases,[ 1 , 3a , 3b ] the oxygen atom of O2 that is not transferred to the organic substrate is converted to water. This is the reason for the fact that these enzymes require two reducing equivalents per transferred O‐atom, usually from NAD(P)H.[ 3c , 15 , 16 ] Whereas the formation of water adds thermodynamic driving force to the oxygenation reaction,[ 3c , 15 , 16 ] the synthesis of these reductants consumes energy,[ 3c , 16 ] and doubtlessly a significant advantage would be achieved if both O‐atoms of O2 could be used for oxygen transfer. Although such a mechanism does not seem to exist in nature, we herein provide evidence for exactly this scenario in synthetic model chemistry. Specifically, we show that low‐temperature oxygenation of dinuclear CuI complexes supported by the ligands bdpdz [17] and bdptz [18] leads to tetranuclear, mixed‐valent μ4‐peroxo [CuI/CuII]2 complexes. Upon warming to 238 K, these undergo homolytic O−O bond cleavage, generating two mono‐μ‐oxo dicopper(II) complexes which in turn catalyze O transfer to organic substrates. Notably, a related dicopper mono‐μ‐oxo species has been found to perform the challenging methane‐to‐methanol conversion in oxygen‐activated, copper‐containing Cu‐ZSM‐5, serving as an inorganic model system of pMMO. [11] Therefore, the Cu2O motif has also been discussed as a possible intermediate in the enzyme and currently is considered as one of the important copper–oxygen species besides the common Cu2O x cores.[ 19 , 20 , 21 , 22 , 23 , 24 ] These developments have spurred an intense search for new dicopper complexes exhibiting a μ‐oxo unit. In the meantime, a limited number of such systems has been synthesized and characterized. An excellent review describing these reports has been published by Limberg et al. [19]
Results and Discussion
The multidentate N‐donor ligands bdpdz [17] and bdptz [18] exhibiting a central pyridazine and a phthalazine moiety, respectively, were synthesized by slight modifications of the published procedures; the latter ligand was characterized by X‐ray structure determination (Supporting Information Sections S2 and S3.1). Addition of two equivalents of [Cu(CH3CN)4]PF6 or [Cu(CH3CN)4]OTf to these ligands in acetonitrile provided the complexes [CuI 2(bdpdz)(CH3CN)2]X2 (1 a‐X) and [CuI 2(bdptz)(CH3CN)2]X2 (1 b‐X; X=PF6 or OTf) in almost quantitative yields. [25] Attempts to obtain single crystals of 1 b‐OTf yielded red crystals which were investigated by single‐crystal X‐ray diffraction analysis. The molecular structure obtained, however, revealed a trinuclear mixed‐valent CuICuIICuI‐complex, demonstrating the ability of these ligands to accommodate both copper(I) and copper(II) centers (see below and Section S3.2). [25]
Low‐temperature oxygenation of 1 a‐OTf, 1 a‐PF6, 1 b‐OTf and 1 b‐PF6 was performed in acetone by employing O2 as well as two oxygen‐atom transfer (OAT) reagents and monitored by UV/Vis and resonance Raman spectroscopy. The obtained results were corroborated by ESI mass spectrometry and X‐ray absorption spectroscopy, complemented by DFT calculations. Combined evidence from these data leads to characterization of a mono‐μ‐oxo dicopper(II) species (Scheme 1) along with the identification of an unusual tetranuclear mixed‐valent μ4‐peroxo [CuI/CuII]2 intermediate in both types of complexes (see below).
Scheme 1.
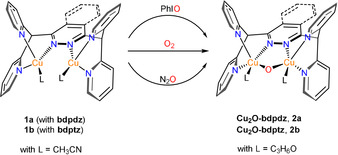
Access to the Cu2O complexes: The counterions X are hexafluorophosphate (PF6 −) or triflate (OTf−) and are omitted for clarity.
Upon reaction of 1 a and 1 b with dioxygen at 183 K the color of the solution changes from yellow to pale green, going along with a change of the initial spectrum of the precursor (Figure 1 a, black) to a product spectrum containing two absorption features—a broad shoulder at 390 nm (ϵ=2770 m −1 cm−1) and a band at 621 nm (ϵ=222 m −1 cm−1) (Figure 1 a, blue; Table 1). The formation of a pale green solution was already described for 1 b‐OTf by Lippard and co‐workers in different solvents at 195 K. [25] Gradual warming of the solution to 248 K causes a deepening of the color to intense green. In the corresponding spectrum (Figure 1 a, red) the near‐UV band splits into two shoulders at 370 nm (ϵ=2642 m −1 cm−1) and 421 nm (ϵ=1350 m −1 cm−1) whereas the 621 nm band shifts to 630 nm (ϵ=213 m −1 cm−1). The intense green color, which for the first time has been associated with a μ‐oxo dicopper(II) moiety by Karlin et al. in 1984, is a strong indication for the formation of a Cu2O core.[ 19 , 26 ] In order to test this hypothesis we employed the common OAT reagent iodosobenzene[ 12 , 19 , 27 ] to generate the Cu2O species (Scheme 1). In fact, upon reaction of 1 a/1 b with PhIO in acetone at 238 K the color changes from yellow to intense green and a spectrum emerges (Figure 1 a inset, violet) that is very similar to that obtained with O2. We also investigated whether the same species can be obtained using nitrous oxide as OAT reagent.[ 28 , 29 , 30 ] To this end, 1 b‐PF6 was reacted at 193 K with N2O and the temperature was slowly increased to 233 K (Figure S18). A color change from yellow to intense green occurred which was accompanied by N2 evolution (Supplementary Video 1). The final spectrum (Figure 1 a, inset, green) was again found to be almost identical to that obtained for the reaction with PhIO and O2, respectively, exhibiting two shoulders at 369 nm (ϵ=2593 m −1 cm−1) and 416 nm (ϵ=1378 m −1 cm−1) and a distinct absorption band at 631 nm (ϵ=220 m −1 cm−1). Notably, absorption features around 600 nm have been observed for other Cu2O complexes as well (Table S6), supporting our assignment.[ 12 , 19 , 27 , 31 , 32 ]
Figure 1.
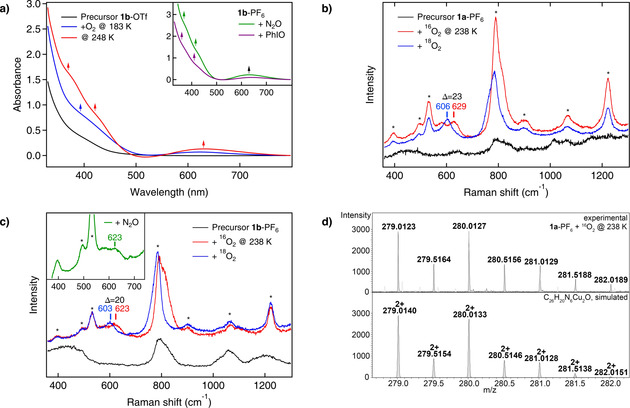
Generating the mono‐μ‐oxo species. a) Reaction with dioxygen: Absorption spectra of an acetone solution of 1 b‐OTf before (black) and upon reaction with O2 (blue, red). The UV/Vis spectra of the green solution obtained after reaction of 1 b‐PF6 dissolved in acetone with nitrous oxide (green) at 233 K or with an excess of PhIO (violet) at 238 K are shown in the inset. b) Resonance Raman spectra of 1 a‐PF6 before (black) and upon reaction with 16O2 (red) and 18O2 (blue) at 238 K. c) Resonance‐enhanced vibrational spectra of 1 b‐PF6 before (black) and after the reaction with 16O2 (red), 18O2 (blue) and upon reaction with nitrous oxide (green) at 238 K. d) Characteristic cutout of the UHR‐ESI mass spectrum obtained upon reaction of 1 a‐PF6 with 16O2 at 238 K, confirming the formation of the mono‐μ‐oxo complex. The corresponding species is also detected in the experiment with 18O2 (see Figure S35). General remarks: UV/Vis: l=1 cm. Raman: The asterisks mark solvent signals of acetone. The laser excitation wavelength was 393 nm.
Table 1.
Spectroscopic data elucidating the binding and cleavage of O2. Overview of the experimentally and theoretically obtained data for the bdpdz (1 a) and bdptz (1 b) systems after oxygenation, leading to the corresponding Cu2O (2 a/b) or Cu4O2 (3 a/b) complexes.
|
|
Cu2O |
|
Cu4O2 [b] |
|||||||
|---|---|---|---|---|---|---|---|---|---|---|
|
Absorption feature |
TDDFT [a] |
2 a‐PF6 |
2 a‐OTf |
2 b‐PF6 |
2 b‐OTf |
|
3 a‐PF6 |
3 a‐OTf |
3 b‐PF6 |
3 b‐OTf |
|
λ [nm] (ϵ [m −1 cm−1]) |
390/380 |
370 (2739) |
371 (2391) |
368 (2488) |
370 (2642) |
|
397 (1956) |
398 (2754) |
393 (2150) |
390 (2770) |
|
431/434 |
421 (1282) |
422 (1119) |
417 (1343) |
421 (1350) |
|
N.A. |
N.A. |
N.A. |
N.A. |
|
|
554+701/572 |
630 (264) |
630 (219) |
633 (207) |
630 (213) |
|
619 (200) |
613 (160) |
619 (168) |
621 (222) |
|
|
|
|
|
|
|
|
|
|
|
|
|
|
Vibrational mode (Δ18O2) [cm−1] |
DFT [c] |
2 a‐PF6 |
2 a‐OTf |
2 b‐PF6 |
2 b‐OTf |
|
DFT [d] |
3 a‐PF6 |
3 b‐PF6 |
3 b‐OTf |
|
ν Cu−O [e] |
563 (35)/ 587 (29) |
629 (23) |
619 (11) |
623 (20) |
619 (8) |
|
523 (28)/ 534 (27) |
607 (14) |
607 (16) |
604 (8) |
|
ν O−O |
N.A. |
N.A. |
N.A. |
N.A. |
N.A. |
|
854 (50)/ 849 (49) |
854 (62) |
854 (52) |
855 (57) |
General remarks: Solvent: acetone; oxygenations were carried out at least duplicate; values presented here are averaged; c=0.6–1.0 mm. [a] Values are given as follows: 2 a (bdpdz)/2 b (bdptz). Based on the assumption that acetone is the coordinating solvent; values with acetonitrile instead of acetone can be found in Table S9. DFT: B3LYP/def2‐TZVP(‐f). [b] The given molar absorption coefficients at these maxima are based on the assumption that the species is tetranuclear. [c] Based on the assumption that acetone is the coordinating solvent; values without acetone or with acetonitrile can be found in Table S9. DFT: PBE‐D3(BJ)/def2‐SVP. Detailed assignments as well as schematic representations of the vibrational modes can be found in Section S6.1. [d] Calculations were performed without any coligands like acetone or acetonitrile. 1 a: d O–O=1.412 Å and 1 b: d O–O=1.414 Å. DFT: PBE‐D3(BJ)/def2‐SVP. Detailed assignments as well as schematic representations of the vibrational modes can be found in Section S6.1. [e] ν Cu−O=νas Cu−O; ν s Cu−O not observed.
In order to provide further spectroscopic evidence for the formation of Cu2O cores, resonance Raman (rR) spectroscopy was employed. Upon reaction of 1 a‐PF6 with dioxygen at 238 K, an isotope‐sensitive peak emerges at 629 cm−1 (Δ=23 cm−1; Figure 1 b). DFT calculations performed for the Cu2O complex of 1 a predict a symmetric and an antisymmetric Cu−O vibration at 437 cm−1 (Δ=19 cm−1) and 563 cm−1 (Δ=35 cm−1), respectively (Table 1 and Section S6.1 for a full vibrational analysis). Based on its frequency, the observed mode is assigned to the antisymmetric vibration whereas the symmetric vibration is not observed. This can be explained by assuming that the oxo→CuII CT transition is localized. [33] The excited state thus exhibits a distortion along ν as Cu−O, and only this mode gets resonantly enhanced. [33]
Similar observations were made for 1 b‐PF6 upon reaction with dioxygen at 238 K. In this case, ν as Cu−O appears at 623 cm−1 (Δ=20 cm−1; Figure 1 c). [33] The observed vibrational frequencies and isotope shifts are in good agreement with the literature (Table 1 and Table S8).[ 11 , 12 , 19 , 20 , 27 , 34 , 35 , 36 ]
To further confirm the identity of the Cu2O complex and support the respective UV/Vis data (see above), rR investigations were also performed with nitrous oxide (Figure 1 c). Addition of N2O into a solution of 1 b‐PF6 at 193 K leads to the emergence of two new peaks in the rR spectrum both of which can be attributed to free N2O (Figure S19). [37] Upon increasing the temperature the N2O features decrease in intensity and N2 is liberated (see above). At 238 K a new peak emerges at 623 cm−1 (Figure 1 c, inset), in analogy to the reaction with dioxygen (Figure 1 c, red). To the best of our knowledge, no other low‐molecular weight dicopper(I) complex has so far been found to form a mono‐μ‐oxo core with N2O at such low temperatures, underscoring the extraordinary capability of our systems for small‐molecule activation.[ 19 , 22 , 28 , 29 , 30 , 38 , 39 ]
The spectroscopic data are corroborated by UHR‐ESI MS. Reaction of 1 a‐PF6 with dioxygen (or PhIO; Section S4.1) at 238 K provides the mass spectrum shown in Figure 1 d, which is in excellent agreement with the calculated spectrum and isotopic distribution pattern of the doubly positively charged Cu2O species [2 a‐PF6]2+ (m/z: calc. 279.0140, obs. 279.0123). Upon reaction with 18O2 the peak shifts by one mass unit to m/z 280.0137, as expected (Figure S35).
The fact that 1 a and 1 b are able to form Cu2O species not only by using OAT reagents but also by reaction with O2 suggests that they are able to bind dioxygen and subsequently cleave the O−O bond of the resulting peroxo complex (cf. Scheme 2). Correspondingly, we assume that the UV/Vis spectrum observed upon oxygenation of 1 b at 183 K (Figure 1 a, blue) does not originate from a Cu2O complex, but rather from the initially formed dioxygen adduct.
Scheme 2.
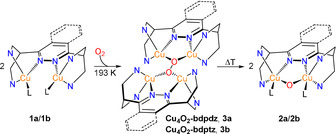
Formation of the Cu2O core via homolytic O−O bond cleavage of the tetranuclear, mixed‐valent μ4‐peroxo species (Cu4O2). The pyridine rings have been omitted for clarity and simplified by the N‐donor atoms.
In order to obtain more information about this intermediate and its O−O cleavage leading to the Cu2O species, variable‐temperature rR experiments were performed. Reaction of 1 b‐PF6 with dioxygen at 193 K leads to a rR spectrum which exhibits two isotope‐sensitive peaks at 854 and 607 cm−1 (Δ=52 and 16 cm−1, respectively; Figure 2 a, red and blue). Importantly, the observed Raman spectrum is not compatible with a 1:1 adduct of 1 b and dioxygen (cf. Section S6.7 and Scheme S5), but can only be interpreted on the basis of a tetranuclear mixed‐valent μ4‐peroxo [CuI/CuII]2 complex with a Cu4O2 core (Scheme 2, center). A DFT‐based vibrational analysis of this species is presented in Section S6.1. Correspondingly, the peak at 854 cm−1 is attributed to the O−O stretch and the peak at 607 cm−1 to a Cu−O mode (Table 1). Similar results are obtained upon reaction of 1 a‐PF6 with dioxygen at 193 K with νO−O being observed at 854 cm−1 (Δ=62 cm−1) and ν Cu−O at 607 cm−1 (Δ=14 cm−1; Figure S29). Note that O−O stretches around 850 cm−1 have also been observed in other Cu4O2 clusters (cf. Table S8).[ 34 , 35 , 36 , 40 ]
Figure 2.
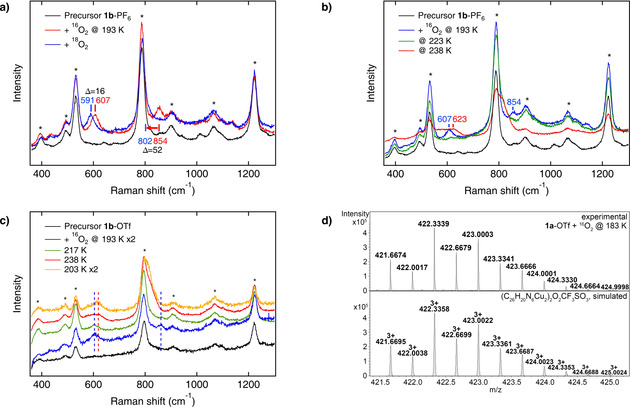
Mechanistic investigations: Breaking the O−O bond. a) Resonance Raman spectra of 1 b‐PF6 before (black) and after the reaction with 16O2 (red) and 18O2 (blue) at 193 K. b) Resonance Raman spectra of 1 b‐PF6 before (black) and upon reaction with dioxygen at three different temperatures (blue: 193 K; green: 223 K; red: 238 K). c) O−O bond homolysis of the Cu4O2 intermediate is irreversible; i.e., once the Cu2O complex of 1 b‐OTf is formed (red), the spectrum of the mono‐μ‐oxo species is retained after re‐cooling (orange). The spectra at 193 K and 203 K are rescaled by factor 2. d) Characteristic cutout of the UHR‐ESI mass spectrum obtained upon reaction of 1 a‐OTf with 16O2 at 183 K, confirming the mixed‐valent μ4‐peroxo complex. The corresponding species is also detected in the experiment with 18O2 (see Figure S36). General remarks: Raman: The asterisks mark solvent signals of acetone. The laser excitation wavelength was 393 nm.
Upon increasing the temperature from 193 K (Figure 2 b, blue) to 223 K (Figure 2 b, green) the peroxo‐core associated features (including the O−O stretch) clearly vanish, and further warming to 238 K leads to a spectrum (Figure 2 b, red) that is identical to the red trace of Figure 1 c; i.e., corresponds to the mono‐μ‐oxo species (Figure S30). This confirms that the tetranuclear peroxo complex promotes thermally activated, homolytic O−O bond cleavage, leading to two Cu2O species. Supposedly, this process does not occur in a single step as shown in Figure 2 a, but involves a more complex reaction sequence. [36] In any case, if the solution containing the Cu2O species of 1 b‐OTf is cooled again from 238 K down to 203 K (Figure 2 c), the features of the Cu4O2 core do not re‐appear, but the mono‐μ‐oxo feature at 619 cm−1 is retained. These observations are supported by UV/Vis spectroscopy (Figures S20 and S21). The transformation process shown in Scheme 2 thus is irreversible.
To support the low‐temperature spectroscopic data, cryo‐UHR‐ESI MS was employed again. Upon reaction of an acetone solution of 1 a‐OTf with O2 at 183 K the mass spectrum presented in Figure 2 d is obtained, which shows a peak with an isotopic pattern and m/z value corresponding to the Cu4O2 trication [3 a‐OTf]3+ (Scheme 2). Note that this species contains two CuI, two CuII and one peroxide, as anticipated. Along with two bdpdz ligands and one triflate this leads to the observed m/z value of 421.6674 (m/z calc. 421.6695) and total charge of 3+. Upon reaction with 18O2 the characteristic peak shifts by 4/3 mass units to m/z 423.0011 (m/z calc. 423.0057; Figure S36). Importantly, no mono‐μ‐oxo species can be detected at 183 K for 1 a‐OTf, in agreement with the thermally activated character of the Cu4O2→Cu2O conversion (see above).
Detailed information on the oxidation state and the nearest‐neighbor environment of the copper centers in the Cu2O and Cu4O2 complexes is provided by extended X‐ray absorption fine structure (EXAFS) and X‐ray absorption near‐edge structure (XANES). Upon oxygenation of the CuI precursor (1 b‐PF6) to the Cu4O2 complex (3 b‐PF6) and further conversion to the Cu2O species (2 b‐PF6), the edge position (measured at 50 % of the edge jump) in the Cu K‐edge XANES spectra shifts to higher energy by 0.7 and by additional 0.2 eV, respectively, reflecting a stepwise transition from CuI to CuII. Moreover, the spectrum of 1 b‐PF6 (Figure 3 a,b, black) shows a distinct feature at 8982.2 eV, the intensity of which is reduced by about 40 % upon oxygenation at 193 K, leading to 3 b‐PF6 (Figure 3 a,b, blue). At 238 K, a further intensity decrease by about 10 % is observed which reflects the conversion of 3 b‐PF6 to 2 b‐PF6 (Figure 3 a,b, red). This feature is assigned to the electric‐dipole allowed transition from Cu 1s to the lowest‐energy Cu 4p orbitals. [41] Through antibonding interactions deriving from the bridging peroxo and oxo ligands, respectively, these orbitals are partially shifted to higher energy, explaining the intensity decrease of the peak at 8982.2 eV and intensity increase of peaks at higher energy (Figure 3 a). Concomitantly, a pre‐edge feature appears at 8977.5 eV for the Cu4O2 intermediate that gets more intense upon conversion to the Cu2O species, reflecting the emergence and further increase of CuII character (Figure 3 b).[ 42 , 43 ] Similar observations are made for 1 a‐PF6 before and after reaction with dioxygen at 183 K and 238 K (Section S8.1).
Figure 3.
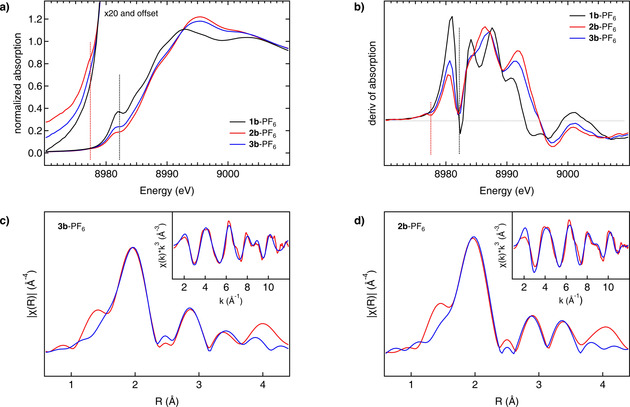
Gaining electronic and structural insights into the reaction of the CuI precursors with O2. a) Cu K‐edge XANES spectra of the precursor 1 b‐PF6 before (black line, CuI) and after the reaction with dioxygen at 183 K (blue line, Cu4O2) and 238 K (red line, Cu2O) with enlarged pre‐edge region. b) Derivatives of the spectra given in (a), showing the XANES region in more detail (see text). c) Phase‐corrected Cu K‐edge Fourier transform of EXAFS of 3 b‐PF6 at 183 K (red). Inset: k 3‐weighted Cu K‐edge EXAFS of 3 b‐PF6 (red). The best fit for both spectra is shown in blue. d) Phase‐corrected Cu K‐edge Fourier transform of EXAFS of 2 b‐PF6 at 238 K (red). Inset: k 3‐weighted Cu K‐edge EXAFS of 2 b‐PF6 (red). The best fit (blue) is obtained by using the theoretical model with two acetone ligands coordinating with their carbonyl O‐atoms (O)s.
Further structural insights are provided by EXAFS analysis. For the Cu4O2 and Cu2O complexes of 1 b‐PF6 the phase‐corrected Cu K‐edge Fourier transform of EXAFS can be found in Figure 3 c and 3 d, respectively; the insets show the k 3‐weighted Cu K‐edge EXAFS. Similar results are obtained for 1 a‐PF6 (Section S8.1). Good agreement between the data and the fits is obtained by use of theoretical models with two acetone coligands for the Cu2O and no solvent ligands for the Cu4O2 species. The most important bond lengths and interatomic distances around the Cu centers derived from Cu K‐edge EXAFS are shown in Figure 4. Apart from O−O cleavage, the most significant structural change relates to the Cu–Cu distance which decreases by 0.36 Å upon going from the Cu4O2 to the Cu2O complex.
Figure 4.
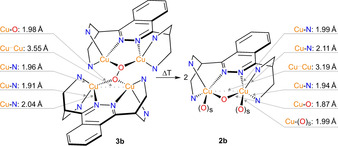
Key geometric parameters (selected bond lengths and Cu⋅⋅⋅Cu distances) of the oxygenated complexes (2 b and 3 b) of 1 b‐PF6 based on EXAFS data. The pyridine rings have been omitted for clarity and simplified by the N‐donor atoms.
The ability of the mono‐μ‐oxo complexes 2 a and 2 b to catalyze the monooxygenation of hydrocarbons was evaluated with a range of aliphatic substrates exhibiting bond dissociation energies (BDEs) from 75 to 82 kcal mol−1; i.e., 9H‐xanthene (XEN),[ 44 , 45 ] 9,10‐dihydro‐anthracene (DHA),[ 45 , 46 , 47 ] fluorene,[ 44 , 45 , 48 ] triphenylmethane[ 45 , 49 ] and diphenylmethane (DPM) [44] (Table 2 and Section S10). A three‐step protocol was applied in these experiments, and quantification was done by use of GC–MS (cf. Sections S2.8 and S10). Addition of 20 equiv of xanthene (BDE=75 kcal mol−1) to the Cu2O derivatives of 1 a and 1 b resulted in the conversion to 9H‐xanthen‐9‐one (XON). Yields between 7 and 13 %, corresponding to a TON of 1–3, were obtained (Table 2). Subsequently, the activities of 2 a and 2 b towards the conversion of DHA (BDE=78 kcal mol−1) to 9,10‐anthraquinone (AQ) were tested. Employing 10 equiv of DHA led to TONs between 2 and 5 (11–24 %), the highest TON being achieved with 2 b‐OTf (Table 2 and Scheme 3).
Table 2.
Catalytic activity for the oxygenation of hydrocarbons. Overview of the obtained data for the catalytic activity of the model systems 2 a and 2 b towards various substrates.
|
BDE [kcal mol−1] |
Substrate→Product |
TON[a] 2 a‐PF6/2 a‐OTf |
TON[a] 2 b‐PF6/2 b‐OTf |
|---|---|---|---|
|
75 |
XEN→XON |
1/3 |
1/2 |
|
78 |
DHA→A |
3/2 |
2/1 |
|
78 |
DHA→AQ[b] |
3/2 |
4/5 |
|
82 |
DPM→Ph2CO |
2/2 |
2/2 |
General remarks: Conditions: 1 equiv of 2 a or 2 b and 20, 10 or 50 equiv of XEN, DHA or DPM, respectively, were applied (cf. Section S2.8). Blind reactions were also performed using [Cu(CH3CN)4]PF6 or [Cu(CH3CN)4]OTf and O2 instead of 2 a or 2 b. All control experiments lead to poorer results compared to the activity with 2 a or 2 b (see Table S17). For abbreviations see text. [a] TON=Turnover Number; is defined as the equiv of product made per equiv of catalyst (=Cu2O complex). [b] 10 equiv of DHA were used; representing 20‐fold excess of substrate. The given TON refers to the initially formed disecondary alcohol and does not include the subsequent oxidation.
Scheme 3.
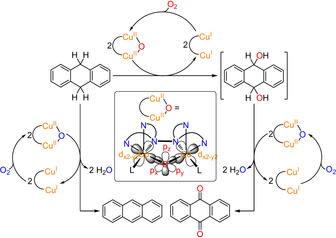
Reactivity studies and proposed mechanism for the oxygenation of DHA. Reaction of DHA in the presence of the Cu2O catalyst leads to anthraquinone (AQ) via a disecondary alcohol (9,10‐dihydroxy‐9,10‐dihydroanthracene) which is formed as primary oxygenation product. The subsequent oxidation may also be catalyzed by the Cu2O species (right). As a byproduct, anthracene is formed by twofold H‐atom abstraction proceeding without O‐transfer (left). In all reactions the formed CuI−CuI species are re‐oxidized to the Cu2O complex with O2, following the pathway of Scheme 2. In contrast to the actual monooxygenation reaction (top), both the twofold two‐electron oxidation of the disecondary alcohol and the double HAT generate water which may deactivate the catalyst. Inset: Simplified structure of the Cu2O complex showing the orbitals involved in the substrate oxygenation, i.e., the d orbitals of the copper centers and the px, py and pz orbitals of the oxo ligand. L=coordinating solvent molecule (C3H6O).
To confirm that the AQ oxygen atoms derive from dioxygen, these experiments were repeated with 18O2 instead of 16O2, leading to a shift of the AQ peak in the HR‐EI MS by 4 mass units (Section S10.3). As a side reaction the formation of anthracene (A; 6–14 % corresponding to a TON of 1–3) via double H‐atom transfer (HAT) was observed (Scheme 3, left). This dehydrogenation as well as two‐electron oxidation of the initially formed disecondary alcohols generate water (Scheme 3), which possibly deactivates the catalyst.[ 12 , 19 ]
To clearly demonstrate that the Cu2O species is the actual source of the oxygen atom incorporated into the substrate, we performed reactivity studies towards DHA under anaerobic conditions. Before adding DHA, the solution was purged with N2 to remove dioxygen, and the further reaction was performed anaerobically. Importantly, GC–MS analysis showed a conversion to AQ similar to that obtained in an analogous experiment where O2 was present during reaction with the substrate (Table S20). Moreover, the formation of AQ could also be detected if N2O was employed instead of O2 to generate the Cu2O intermediate (Section S10.4).
Oxygenation of 50 equiv of diphenylmethane (BDE=82 kcal mol−1) led to benzophenone (Ph2CO) with a TON of 2 for all catalysts (Table 2). In order to theoretically explore whether our Cu2O complexes may also be able to break the C−H bond of substrates with higher BDEs than diphenylmethane the O−H bond dissociation free energy (BDFE) of the μ‐hydroxo CuI/CuII complex resulting from HAT to the Cu2O complex was determined by DFT (Section S9.4). Notably, this calculation gave a value of 111 kcal mol−1, even exceeding the CH‐BDFE of methane (96 kcal mol−1). [50]
The origin of this strong HAT activity lies in the geometric and electronic structure of this species. In particular, the doubly filled, in‐plane px and py orbitals of the bridging oxo group each overlap with a singly occupied Cu‐d orbital, representing the SOMO of each copper‐containing subunit (Scheme 3, inset). Upon approach of a C−H group from the substrate to the oxo group, one electron shifts from O‐px to the right copper (or O‐py to the left copper; cf. Scheme 4). This leaves a single electron in the respective p orbital which abstracts an H‐atom from the substrate, forming an O−H bond and an alkyl radical.[ 19 , 51 ]
Scheme 4.
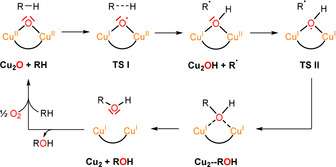
Proposed reaction mechanism for the hydrocarbon‐to‐alcohol conversion. Starting from the Cu2O complex and the hydrocarbon (RH), a transition state (TS I) is proposed leading to the Cu2OH complex. In the next step, the R radical binds to the mixed‐valent Cu2OH species, leading to TS II and finally the alcohol (ROH) is released. The reaction can proceed again, when the dicopper(I) complex Cu2 is reacted with dioxygen.
In the second step one electron shifts from the other doubly occupied, in‐plane oxygen p orbital to the remaining CuII center and a C−O bond is formed with the alkyl radical generated in the initial HAT process. As a result, one O‐atom is inserted into the C−H bond of the substrate, and the oxygenated product (i.e., the alcohol) is weakly bound to two closed‐shell CuI centers, allowing its facile release. A new catalytic cycle starts with the bonding of O2 to the dicopper(I) complex, regenerating the active Cu2O species (Scheme 4).
Conclusion
Copper‐dependent monooxygenases like pMMO transform inert C−H bonds under ambient conditions, using dioxygen and NAD(P)H. Thereby one oxygen atom of O2 is incorporated into the substrate and the other oxygen atom is converted to water. In this study we describe small‐molecule dicopper(I) complexes which also oxygenate hydrocarbons to the corresponding alcohols and ketones in the presence of dioxygen. In contrast to the enzyme, however, both oxygen atoms of O2 are transferred to the organic substrates and no reductant is needed. Using a range of solution spectroscopies, we monitor the initial binding of O2 in a tetranuclear copper intermediate as well as its homolytic cleavage, leading to two mono‐μ‐oxo dicopper(II) complexes which in turn catalytically oxygenate a variety of hydrocarbons. Although the BD(F)Es of these are well below that of methane, the calculated BDFE of our Cu2O species exceeds the C−H BDFE of the latter substrate. This derives from their unique electronic and geometric structure, allowing facile electron transfer from doubly occupied O‐2p orbitals into singly occupied Cu‐d orbitals upon approach of the substrate. In combination, the formation of highly reactive Cu2O species from dioxygen and their catalytic oxygen‐transfer activity to hydrocarbons establish an unprecedented, 100 % atom‐economic scenario for the monooxygenation of organic substrates from gaseous O2.
Conflict of interest
The authors declare no conflict of interest.
Supporting information
As a service to our authors and readers, this journal provides supporting information supplied by the authors. Such materials are peer reviewed and may be re‐organized for online delivery, but are not copy‐edited or typeset. Technical support issues arising from supporting information (other than missing files) should be addressed to the authors.
Supplementary
Acknowledgements
The authors thank CAU Kiel for support of this research. Moreover, parts of this research were carried out at beamline P64 and P65 at the PETRA III storage ring at DESY, a member of the Helmholtz Association. We thank Wolfgang Caliebe and Edmund Welter for their support at beamline P64 and P65, respectively. B.G.‐L. gratefully acknowledges the Bundesministerium für Bildung und Forschung (BMBF) project 05K19GU5 for funding. S.B. gratefully acknowledges the Deutsche Forschungsgemeinschaft (DFG) for financial support under project RU 773/8‐1. Open access funding enabled and organized by Projekt DEAL.
R. Jurgeleit, B. Grimm-Lebsanft, B. M. Flöser, M. Teubner, S. Buchenau, L. Senft, J. Hoffmann, M. Naumova, C. Näther, I. Ivanović-Burmazović, M. Rübhausen, F. Tuczek, Angew. Chem. Int. Ed. 2021, 60, 14154.
Dedicated to Professor Wolfgang Kaim on the occasion of his 70th birthday
Contributor Information
Prof. Dr. Michael Rübhausen, Email: mruebhau@physnet.uni-hamburg.de.
Prof. Dr. Felix Tuczek, Email: ftuczek@ac.uni-kiel.de.
References
- 1. Wang V. C.-C., Maji S., Chen P. P.-Y., Lee H. K., Yu S. S.-F., Chan S. I., Chem. Rev. 2017, 117, 8574–8621. [DOI] [PubMed] [Google Scholar]
- 2.
- 2a. He M. Y., Sun Y. H., Han B. X., Angew. Chem. Int. Ed. 2013, 52, 9620–9633; [DOI] [PubMed] [Google Scholar]; Angew. Chem. 2013, 125, 9798–9812; [Google Scholar]
- 2b. Zakaria Z., Kamarudin S. K., Renewable Sustainable Energy Rev. 2016, 65, 250–261. [Google Scholar]
- 3.
- 3a. Rolff M., Schottenheim J., Decker H., Tuczek F., Chem. Soc. Rev. 2011, 40, 4077–4098; [DOI] [PubMed] [Google Scholar]
- 3b. Hamann J. N., Herzigkeit B., Jurgeleit R., Tuczek F., Coord. Chem. Rev. 2017, 334, 54–66; [Google Scholar]
- 3c. Baba T., Miyaji A. in Application of Biocatalysts for the Production of Methanol from Methane. In: Catalysis and the Mechanism of Methane Conversion to Chemicals, Springer, Singapore, 2020, pp. 73–101.. [Google Scholar]
- 4.
- 4a. Ross M. O., Rosenzweig A. C., J. Biol. Inorg. Chem. 2017, 22, 307–319; [DOI] [PMC free article] [PubMed] [Google Scholar]
- 4b. Ross M. O., MacMillan F., Wang J., Nisthal A., Lawton T. J., Olafson B. D., Mayo S. L., Rosenzweig A. C., Hoffman B. M., Science 2019, 364, 566–570; [DOI] [PMC free article] [PubMed] [Google Scholar]
- 4c. Koo C. W., Rosenzweig A. C., Chem. Soc. Rev. 2021, 50, 3424–3436; [DOI] [PMC free article] [PubMed] [Google Scholar]
- 4d. Jackson R. B., Solomon E. I., Canadell J. G., Cargnello M., Field C. B., Nat. Sustainability 2019, 2, 436–438. [Google Scholar]
- 5.
- 5a. Sharma R., Poelman H., Marin G. B., Galvita V. V., Catalysts 2020, 10, 194; [Google Scholar]
- 5b. Lee J. Y., Karlin K. D., Curr. Opin. Chem. Biol. 2015, 25, 184–193. [DOI] [PMC free article] [PubMed] [Google Scholar]
- 6. Chen Y.-H., Wu C.-Q., Sung P.-H., Chan S. I., Chen P. P.-Y., ChemCatChem 2020, 12, 3088–3096. [Google Scholar]
- 7. Liang Y., Wei J., Qiu X., Jiao N., Chem. Rev. 2018, 118, 4912–4945. [DOI] [PubMed] [Google Scholar]
- 8. Cao L., Caldararu O., Rosenzweig A. C., Ryde U., Angew. Chem. Int. Ed. 2018, 57, 162–166; [DOI] [PMC free article] [PubMed] [Google Scholar]; Angew. Chem. 2018, 130, 168–172. [Google Scholar]
- 9. Ro S. Y., Schachner L. F., Koo C. W., Purohit R., Remis J. P., Kenney G. E., Liauw B. W., Thomas P. M., Patrie S. M., Kelleher N. L., Rosenzweig A. C., Nat. Commun. 2019, 10, 2675. [DOI] [PMC free article] [PubMed] [Google Scholar]
- 10. Miyanishi M., Abe T., Hori Y., Shiota Y., Yoshizawa K., Inorg. Chem. 2019, 58, 12280–12288. [DOI] [PubMed] [Google Scholar]
- 11. Woertink J. S., Smeets P. J., Groothaert M. H., Vance M. A., Sels B. F., Schoonheydt R. A., Solomon E. I., Proc. Natl. Acad. Sci. USA 2009, 106, 18908–18913. [DOI] [PMC free article] [PubMed] [Google Scholar]
- 12. Haack P., Kärgel A., Greco C., Dokic J., Braun B., Pfaff F. F., Mebs S., Ray K., Limberg C., J. Am. Chem. Soc. 2013, 135, 16148–16160. [DOI] [PMC free article] [PubMed] [Google Scholar]
- 13. Chan S. I., Lu Y. J., Nagababu P., Maji S., Hung M. C., Lee M. M., Hsu I. J., Minh P. D., Lai J. C. H., Ng K. Y., Ramalingam S., Yu S. S. F., Chan M. K., Angew. Chem. Int. Ed. 2013, 52, 3731–3735; [DOI] [PubMed] [Google Scholar]; Angew. Chem. 2013, 125, 3819–3823. [Google Scholar]
- 14. Chen P. P.-Y., Yang R. B.-G., Lee J. C.-M., Chan S. I., Proc. Natl. Acad. Sci. USA 2007, 104, 14570–14575. [DOI] [PMC free article] [PubMed] [Google Scholar]
- 15. Ullrich V., Angew. Chem. Int. Ed. Engl. 1972, 11, 701–712; [DOI] [PubMed] [Google Scholar]; Angew. Chem. 1972, 84, 689–701. [Google Scholar]
- 16. Holtmann D., Hollmann F., ChemBioChem 2016, 17, 1391–1398. [DOI] [PMC free article] [PubMed] [Google Scholar]
- 17. Manzur J., García A. M., Letelier R., Spodine E., Peña O., Grandjean D., Olmstead M. M., Noll B. C., J. Chem. Soc. Dalton Trans. 1993, 905–911. [Google Scholar]
- 18. Barrios A. M., Lippard S. J., J. Am. Chem. Soc. 1999, 121, 11751–11757. [Google Scholar]
- 19. Haack P., Limberg C., Angew. Chem. Int. Ed. 2014, 53, 4282–4293; [DOI] [PubMed] [Google Scholar]; Angew. Chem. 2014, 126, 4368–4380. [Google Scholar]
- 20. Réglier M., Jorand C., Waegell B., J. Chem. Soc. Chem. Commun. 1990, 1752–1755. [Google Scholar]
- 21. Snyder B. E. R., Bols M. L., Schoonheydt R. A., Sels B. F., Solomon E. I., Chem. Rev. 2018, 118, 2718–2768. [DOI] [PubMed] [Google Scholar]
- 22. Yelin S., Limberg C., Catal. Lett. 2020, 150, 1–11. [Google Scholar]
- 23. Ali G., VanNatta P. E., Ramirez D. A., Light K. M., Kieber-Emmons M. T., J. Am. Chem. Soc. 2017, 139, 18448–18451. [DOI] [PubMed] [Google Scholar]
- 24.
- 24a. Mirica L. M., Ottenwaelder X., Stack T. D. P., Chem. Rev. 2004, 104, 1013–1046; [DOI] [PubMed] [Google Scholar]
- 24b. Solomon E. I., Ginsbach J. W., Heppner D. E., Kieber-Emmons M. T., Kjaergaard C. H., Smeets P. J., Tian L., Woertink J. S., Faraday Discuss. 2011, 148, 11–39; [DOI] [PMC free article] [PubMed] [Google Scholar]
- 24c. Keown W., Gary J. B., Stack T. D. P., J. Biol. Inorg. Chem. 2017, 22, 289–305; [DOI] [PMC free article] [PubMed] [Google Scholar]
- 24d. Elwell C. E., Gagnon N. L., Neisen B. D., Dhar D., Spaeth A. D., Yee G. M., Tolman W. B., Chem. Rev. 2017, 117, 2059–2107. [DOI] [PMC free article] [PubMed] [Google Scholar]
- 25. Kuzelka J., Mukhopadhyay S., Spingler B., Lippard S. J., Inorg. Chem. 2004, 43, 1751–1761. [DOI] [PubMed] [Google Scholar]
- 26. Karlin K. D., Gultneh Y., Hayes J. C., Zubieta J., Inorg. Chem. 1984, 23, 519–521. [Google Scholar]
- 27. Haack P., Limberg C., Ray K., Braun B., Kuhlmann U., Hildebrandt P., Herwig C., Inorg. Chem. 2011, 50, 2133–2142. [DOI] [PubMed] [Google Scholar]
- 28. Tolman W. B., Angew. Chem. Int. Ed. 2010, 49, 1018–1024; [DOI] [PMC free article] [PubMed] [Google Scholar]; Angew. Chem. 2010, 122, 1034–1041. [Google Scholar]
- 29. Tsai M.-L., Hadt R. G., Vanelderen P., Sels B. F., Schoonheydt R. A., Solomon E. I., J. Am. Chem. Soc. 2014, 136, 3522–3529. [DOI] [PubMed] [Google Scholar]
- 30. Pauletaa S. R., Carepob M. S. P., Moura I., Coord. Chem. Rev. 2019, 387, 436–449. [Google Scholar]
- 31. Obias H. O., Lin Y., Murthy N. N., Pidcock E., Solomon E. I., Ralle M., Blackburn N. J., Neuhold Y.-M., Zuberbühler A. D., Karlin K. D., J. Am. Chem. Soc. 1998, 120, 12960–12961. [Google Scholar]
- 32. Kitajima N., Koda T., Moro-oka Y., Chem. Lett. 1988, 17, 347–350. [Google Scholar]
- 33. Ling J., Nestor L. P., Czernuszewicz R. S., Spiro T. G., Fraczkiewicz R., Sharma K. D., Loehr T. M., Sanders-Loehr J., J. Am. Chem. Soc. 1994, 116, 7682–7691. [Google Scholar]
- 34. Churchill M. R., Davies G., El-Sayed M. A., Fournier J. A., Hutchinson J. P., Zubieta J. A., Inorg. Chem. 1984, 23, 783–787. [Google Scholar]
- 35. El-Sayed M. A., El-Toukhy A., Davies G., Inorg. Chem. 1985, 24, 3387–3390. [Google Scholar]
- 36. Davies G., El-Sayed M. A., Henary M., Inorg. Chem. 1987, 26, 3266–3272. [Google Scholar]
- 37. Trogler W. C., Coord. Chem. Rev. 1999, 187, 303–327. [Google Scholar]
- 38. Xiao D., Bloch E., Mason J. A., Queen W. L., Hudson M. R., Planas N., Borycz J., Dzubak A. L., Verma P., Lee K., Bonino F., Crocellà V., Yano J., Bordiga S., Truhlar D. G., Gagliardi L., Brown C. M., Long J. R., Nat. Chem. 2014, 6, 590–595. [DOI] [PubMed] [Google Scholar]
- 39. Vanelderen P., Vancauwenbergh J., Sels B. F., Schoonheydt R. A., Coord. Chem. Rev. 2013, 257, 483–494. [Google Scholar]
- 40.
- 40a. Reim J., Krebs B., Angew. Chem. Int. Ed. Engl. 1994, 33, 1969–1971; [Google Scholar]; Angew. Chem. 1994, 106, 2040–2041; [Google Scholar]
- 40b. Reim J., Werner R., Haase W., Krebs B., Chem. Eur. J. 1998, 4, 289–298; [Google Scholar]
- 40c. Meyer F., Pritzkow H., Angew. Chem. Int. Ed. 2000, 39, 2112–2115; [PubMed] [Google Scholar]; Angew. Chem. 2000, 112, 2199–2202. [Google Scholar]
- 41. Kau L.-S., Spira-Solomon D. J., Penner-Hahn J. E., Hodgson K. O., Solomon E. I., J. Am. Chem. Soc. 1987, 109, 6433–6442. [Google Scholar]
- 42. DuBois J. L., Mukherjee P., Stack T. D. P., Hedman B., Solomon E. I., Hodgson K. O., J. Am. Chem. Soc. 2000, 122, 5775–5787. [Google Scholar]
- 43. Tomson N. C., Williams K. D., Dai X., Sproules S., DeBeer S., Warren T. H., Wieghardt K., Chem. Sci. 2015, 6, 2474–2487. [DOI] [PMC free article] [PubMed] [Google Scholar]
- 44. Zhang X., Bordwell F. G., J. Org. Chem. 1992, 57, 4163–4168. [Google Scholar]
- 45. Ehudin M. A., Quist D. A., Karlin K. D., J. Am. Chem. Soc. 2019, 141, 12558–12569. [DOI] [PMC free article] [PubMed] [Google Scholar]
- 46. Solomon E. I., Heppner D. E., Johnston E. M., Ginsbach J. W., Cirera J., Qayyum M., Kieber-Emmons M. T., Kjaergaard C. H., Hadt R. G., Tian L., Chem. Rev. 2014, 114, 3659–3853. [DOI] [PMC free article] [PubMed] [Google Scholar]
- 47. Bordwell F. G., Cheng J., Ji G. Z., Satish A. V., Zhang X., J. Am. Chem. Soc. 1991, 113, 9790–9795. [Google Scholar]
- 48. Bordwell F. G., Cheng J.-P., Harrelson J. A., J. Am. Chem. Soc. 1988, 110, 1229–1231. [Google Scholar]
- 49. Mitra M., Nimir H., Demeshko S., Bhat S. S., Malinkin S. O., Haukka M., Lloret-Fillol J., Lisensky G. C., Meyer F., Shteinman A. A., Browne W. R., Hrovat D. A., Richmond M. G., Costas M., Nordlander E., Inorg. Chem. 2015, 54, 7152–7164. [DOI] [PubMed] [Google Scholar]
- 50. Najafian A., Cundari T. R., Organometallics 2018, 37, 3111–3121. [Google Scholar]
- 51. Xu J., Liu B., J. Phys. Chem. C 2019, 123, 10356–10366. [Google Scholar]
Associated Data
This section collects any data citations, data availability statements, or supplementary materials included in this article.
Supplementary Materials
As a service to our authors and readers, this journal provides supporting information supplied by the authors. Such materials are peer reviewed and may be re‐organized for online delivery, but are not copy‐edited or typeset. Technical support issues arising from supporting information (other than missing files) should be addressed to the authors.
Supplementary


