

Abstract
Kinetic characterizations of protein translocation on DNA are nontrivial because the simultaneous presence of multiple different mechanisms makes it difficult to extract the information specific to a particular translocation mechanism. In this study, we have developed new approaches for the kinetic investigations of proteins’ sliding and intersegment transfer (also known as ‘direct transfer’) in the target DNA search process. Based on the analytical expression of the mean search time for the discrete–state stochastic model, we derived analytical forms of the apparent rate constant kapp for protein-target association in systems involving competitor DNA and the intersegment transfer mechanism. Our analytical forms of kapp facilitate the experimental determination of the kinetic rate constants for intersegment transfer and sliding in the target association process. Using stopped-flow fluorescence data for the target association kinetics along with the analytical forms of kapp, we have studied the translocation of the Egr-1 zinc-finger protein in the target DNA association process. Sliding was analyzed using the DNA length-dependent kapp data. Using the dependence of kapp on the concentration of competitor DNA, we determined the second-order rate constant for intersegment transfer. Our results indicate that a major pathway in the target association process for the Egr-1 zinc-finger protein is the one involving intersegment transfer to a nonspecific site and the subsequent sliding to the target.
Keywords: Protein-DNA interaction, Kinetics, Target search process, Stopped-flow, Fluorescence
Introduction
Since Riggs et al. discovered amazingly rapid target location by the E. coli lac repressor in 1970,1 the mechanisms that allow DNA-binding proteins to efficiently locate their target DNA sites have been studied both experimentally and theoretically (e.g. reviews in refs 2–9). It was shown that nonspecific DNA binding plays an important role in increasing the efficiency with which proteins locate their specific target DNA sites. Berg et al. conceptually defined three major mechanisms for protein translocation on DNA:10 1) sliding, 2) dissociation and re-association, and 3) intersegment transfer (also known as direct transfer). Sliding is the random walk of protein while being bound to DNA and can be regarded as one-dimensional diffusion. Translocations via dissociation and re-association are categorized into long-range translocation to an uncorrelated site and short-range translocation (known as ‘hopping’) to a nearby site. Intersegment transfer is direct transfer of protein from one DNA duplex to another (without going through the intermediary of free protein) via an intermediate where a protein molecule transiently bridges two DNA duplexes.
These distinct translocation mechanisms can coexist, and their relative contributions to the overall efficiency of a target DNA search should depend on proteins. For example, intersegment transfer is considered to be unlikely for proteins that cannot bridge two DNA duplexes transiently. The efficiency of each translocation mechanism should also depend on environmental factors, such as ionic strength, DNA density, DNA geometry, and the presence of other proteins. Characterizing a particular translocation mechanism is difficult due to the simultaneous presence of distinct mechanisms, particularly when molecular ensembles are measured in bulk solutions. Recently, remarkable advancements in single-molecule biophysics enabled the direct observation of protein sliding on DNA.3,11–17 Elegant biochemical methods were also developed for kinetic investigations of one-dimensional search.18–25 These methodological advances have substantially deepened the understanding of protein sliding on DNA. However, there is a lack of experiment-based knowledge about the kinetics of the other translocation mechanisms and the interplay between the distinct mechanisms during the target search process.
The least understood of the above-mentioned major translocation mechanisms is intersegment transfer. While many theoretical papers on the target DNA search have overlooked intersegment transfer, recent experimental studies clearly showed the significance of intersegment transfer, at least for several proteins.26–34 As explained below, intersegment transfer appears to be a second-order process and was studied via biochemical or biophysical measurements of apparent exchange29,33,34 or dissociation27,30,32 rates as a function of DNA concentration. Although previous studies suggested the importance of intersegment transfer, its actual kinetic contribution to the target association process remains to be addressed.
In this paper, we present a new theoretical framework and experimental approaches to quantitatively investigate the kinetics of intersegment transfer and sliding in the target association process. Using this methodology, we study the target search kinetics of the inducible transcription factor Egr-1 (also known as Zif268), which plays important roles in the brain and the cardiovascular system. In the brain, Egr-1 is induced by synaptic signals and activates genes for long-term memory formation and consolidation.35,36 In the cardiovascular system, Egr-1 serves as a stress-inducible transcription factor that activates the genes for defense responses against vascular stress and injury.37,38 Egr-1 recognizes a 9-bp target DNA sequence, GCGTGGGCG, via three zinc-finger domains.39 Within its short lifetime (~½ – 1 hour),37 the induced Egr-1 protein regulates a particular set of genes, allowing the cells to rapidly respond to the stimuli. It is thus important to understand how Egr-1 efficiently scans DNA. Our current study provides insights into the roles of sliding and intersegment transfer in the target search by Egr-1.
Theory
Here we provide the theoretical framework for our stopped-flow kinetic method that is applicable to proteins that form a stable complex with their target DNA site. The studied systems involve three macromolecular components: the probe DNA, protein, and nonspecific competitor DNA (Figure 1A). The probe DNA contains a target site and a fluorescent group that is tethered to a position near the target. The fluorescence from the probe changes upon binding of the protein to the target site. The time course of the change is monitored immediately after a solution of the protein is rapidly mixed with a solution containing the probe DNA and the competitor DNA. We specifically deal with systems in which the total concentrations of the protein, the probe DNA, and the competitor DNA (Ptot, Dtot, and Ctot, respectively) satisfy the following:
| [1] |
Figure 1.
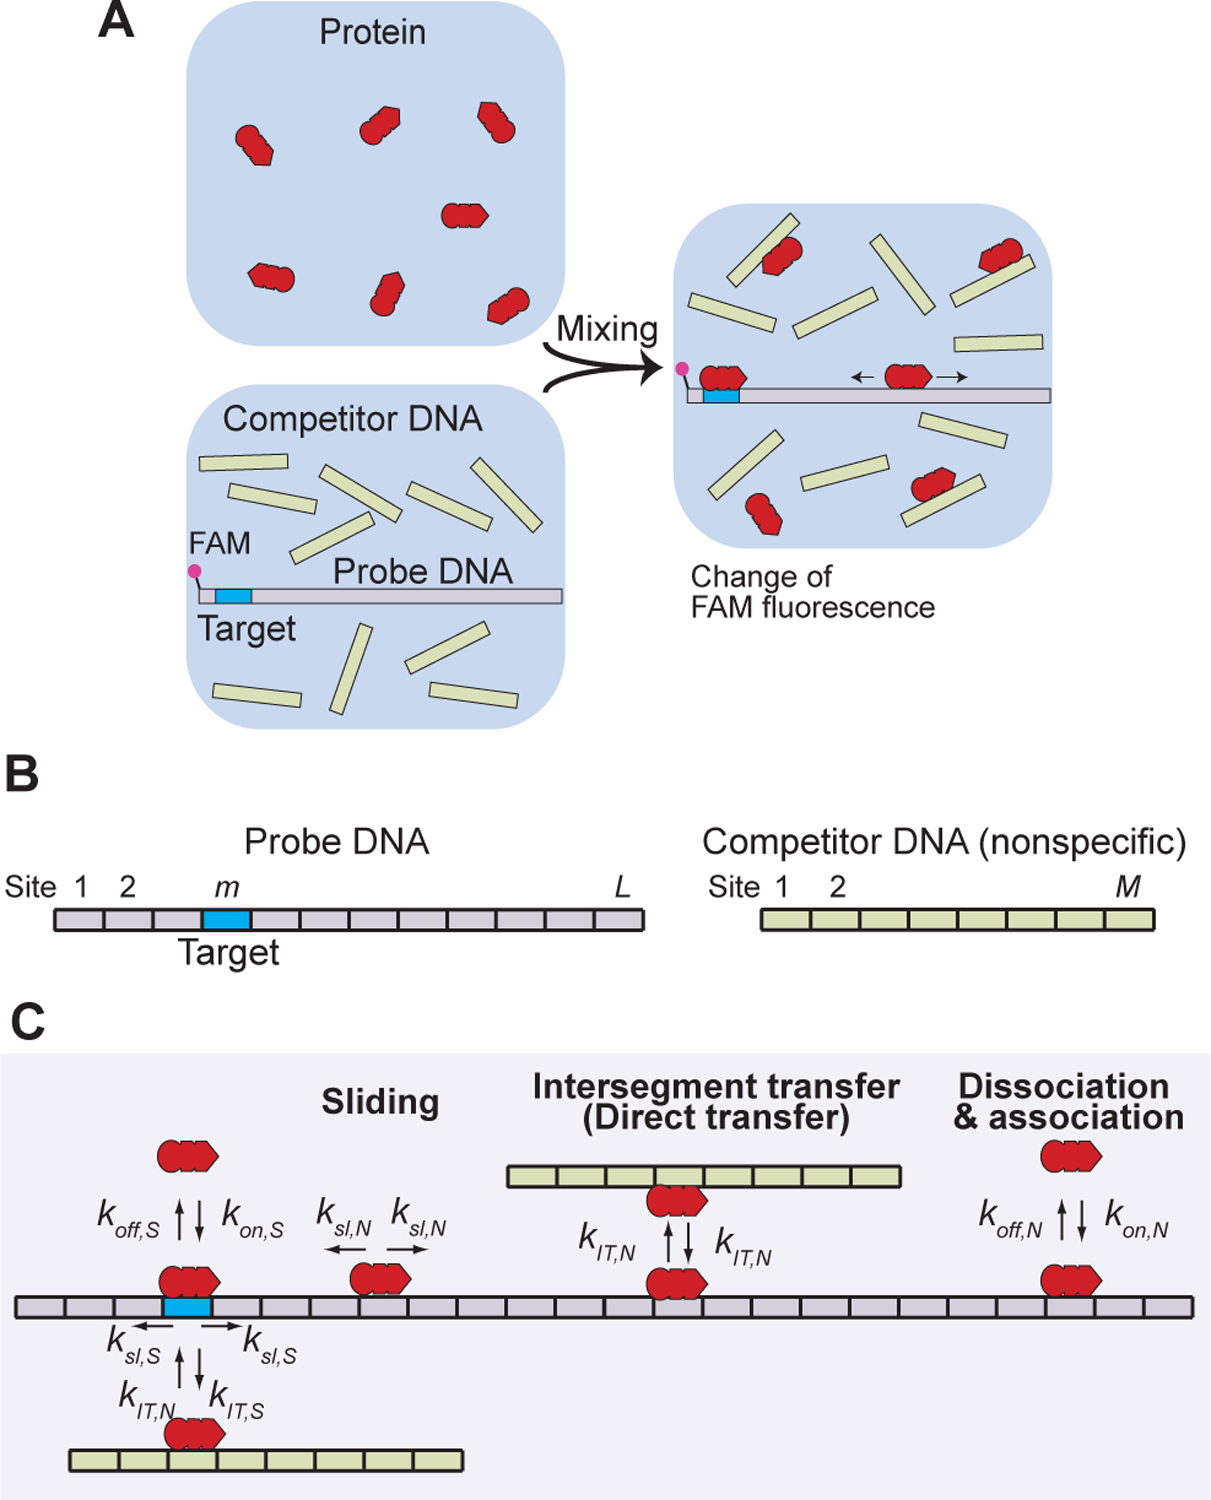
Experimental design and kinetic model used in this study. (A) Stopped-flow fluorescence assay of the target DNA search kinetics. (B) Discrete binding sites on the probe and competitor DNA duplexes. (C) Rate constants involved in our kinetic model for the target association process. The rate constants ksl,N and ksl,S for sliding and the rate constants koff,N and koff,S for dissociation are first-order rate constants (units, s−1), whereas the rate constants kIT,N and kIT,S for intersegment transfer and the rate constants kon,N and kon,S for association are second-order rate constants (units, M−1 s−1). A rate constant for sliding is defined for sliding from one site to an adjacent site (i.e., shift by 1 bp). The rate constant ksl,N is related to the one-dimensional diffusion coefficient D1 for sliding, as indicated by Eq. 15. A complete set of rate equations for this kinetic model is given in the Supplemental Information.
These conditions can be used only for proteins that exhibit high specificity to their target. Because of these inequalities, the relevant second-order processes occur in a pseudo-first-order manner, which simplifies the kinetic analysis of experimental data.40 The fluorescence time-course data are used to determine an apparent pseudo-first-order rate constant, kapp, for binding of the target to the protein. Due to the large excess of competitor DNA, only one protein can bind to the probe DNA, which allows for accurate kinetic measurement of sliding without interference due to the presence of multiple protein molecules on the same DNA. Moreover, the target DNA search in the presence of a large excess of competitor DNA represents a more realistic case and provides insights into the search processes in vivo.
Intersegment transfer as a phenomenological second-order process
Intersegment transfer of a protein between two DNA duplexes can be represented by:
| [2] |
where PD represents a protein-DNA complex; DbPDa, the DNA-bridging intermediate; kf1 and kf2, second-order rate constants for formation of the intermediate; and kd1 and kd2, first-order rate constants for dissociation of the intermediate into a protein-DNA complex and free DNA. If the intermediate is a transient and low-population state, the intersegment transfer appears to be a second-order process:
| [3] |
Using a steady-state approximation (Supplemental Information), the apparent second-order rate constants kIT,ab and kIT,ba are given by:
| [4] |
| [5] |
If kd1 = kd2 and the duplexes Da and Db exhibit the same affinity, then kIT,ab = kIT,ba = ½kfI = ½kf2. Because of the second-order nature, the overall rate for intersegment transfer is proportional to the free DNA concentration. In fact, this nature has been essential in the experimental detection of intersegment transfer.27–30,32–34,41,42
In contrast, the overall rate for translocation via dissociation and re-association is virtually independent of the free DNA concentration when the DNA concentration is higher than the dissociation constant Kd. This translocation is represented by:
| [6] |
When [D] » Kd, the rate limiting step for this scheme is the dissociation (a first-order process) because this inequality corresponds to koff « kon[D]. In this case, an increase in [D] does not affect the overall rate because the rate-limiting step is of first order. Thus, intersegment transfer can be distinguished experimentally from translocation via dissociation and re-association.
Discrete-state kinetic model for target DNA search
Our kinetic model for a target DNA search assumes discrete states in nonspecific protein-DNA association and is similar to the model used by Veksler and Kolomeisky.43 The discrete nature of nonspecific protein-DNA association is supported by the recent solution NMR studies on nonspecific protein-DNA complexes.29,34,44–46 As shown in Figure 1B, the probe DNA in our model contains a total of L sites, of which only the m-th site from an edge is a target, and all the others are nonspecific sites. Competitor DNA contains a total of M nonspecific sites. Our kinetic model addresses dissociation, association, sliding, and intersegment transfer (Figure 1C). Based on the above-mentioned considerations, our kinetic model treats intersegment transfer as a second-order process between a protein-DNA complex and free DNA. Although intersegment transfer can occur between two distant sites on the same molecule if the DNA length is significantly longer than the persistence length (i.e., ~150 bp), such intra-molecular intersegment transfer is not considered here because only relatively short (< 150 bp) DNA duplexes are used in our experiments. The model involves the intrinsic (as opposed to apparent) association rate constants kon,N and kon,S, the dissociation rate constants koff,N and koff,S, the first-order rate constants ksl,N and ksl,S for sliding, and the second-order rate constants kIT,N and kIT,S for intersegment transfer (annotations N and S are for nonspecific and specific sites, respectively). These kinetic rate constants are schematically summarized in Figure 1C. A complete set of the rate equations for our kinetic model is given in the Supplemental Information. Numerical integration of the rate equations, which can readily be performed with a standard ordinary-differential-equation (ODE) solver, provides the populations of the individual species as a function of time (details given in the Supplemental Information). The ODE-based simulations allowed us to assess the analytical forms of kapp presented below.
Mean search time of the Veksler-Kolomeisky model
For systems involving neither competitor DNA nor intersegment transfer, Veksler and Kolomeisky derived a general analytical expression for the mean time TP for a protein, which is initially in the free state, to reach the target:43
| [7] |
In this expression, the relevant parameters are as follows:
| [8] |
| [9] |
| [10] |
| [11] |
where kin is the rate constant for the free protein to bind to any site on the probe DNA; kout, the rate constant for the bound protein to leave the probe DNA; L, the total number of sites; and m, the target position. Hereafter, this general analytical expression is referred to as the VK model.
kapp for systems involving competitor DNA in the absence of intersegment transfer
Now we address the systems involving competitor DNA under the conditions of Dtot « Ptot « Ctot. Owing to these inequalities, the association of proteins with the competitor DNA reaches quasi-equilibrium far more rapidly than the association with the target. Based on this assumption and the VK model, the apparent pseudo-first-order rate constant kapp for the target to bind to the protein in the absence of intersegment transfer is given by:
| [12] |
where fp is the fraction of the protein in the free state:
| [13] |
The derivation of Eq. 12 is provided in the Supplemental Information. Kd,N (= koff,N / kon,N) is the dissociation constant for each nonspecific site, and Kd,S is the dissociation constant for the target. The parameter ϕ is the number of possible orientations for each nonspecific site. Due to structural pseudo-C2 symmetry for DNA, ϕ = 2 for proteins that bind as monomer; ϕ = 1 for symmetric dimers. When ϕ = 2 is used, microscopic parameters (e.g., Kd,N, koff,N, kIT,N) are defined for each orientation. Additional considerations on systems with ϕ = 2 are given in the Supplemental Information. The kapp constants from this analytical expression (Eq. 12) agree well with those from the ODE-based simulations (Figure 2A).
Figure 2.
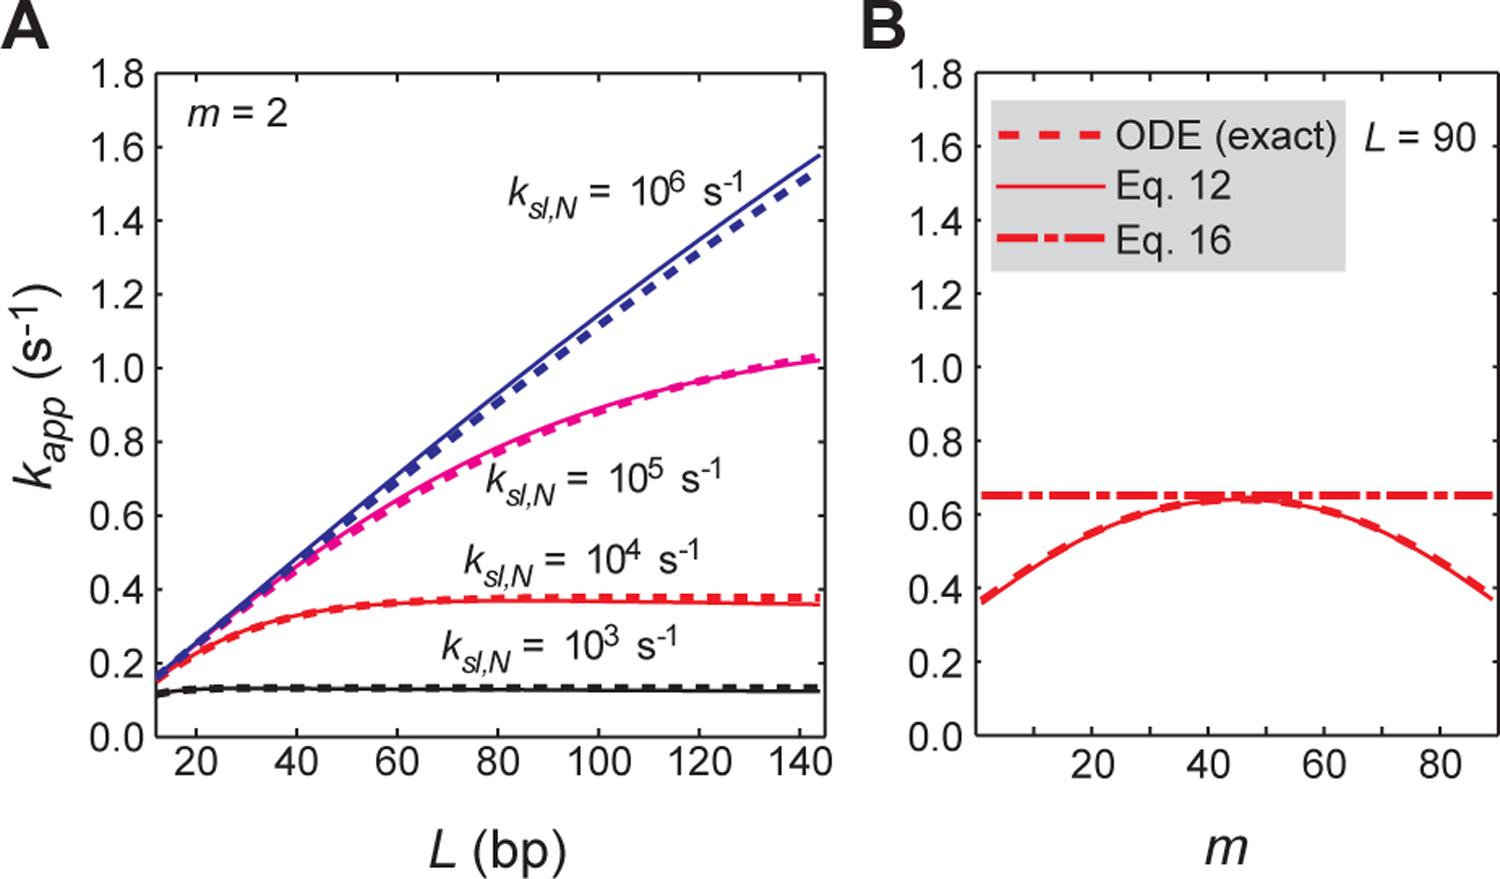
Validation of the VK model-based analytical form of kapp (Eq. 12) for systems involving competitor DNA but with no intersegment transfer. (A) Rate constant kapp for target association as a function of the total number of sites L. The position of the target was set to m = 2. The dashed lines were obtained from the ODE-based numerical kinetics simulations. The solid lines were obtained using Eq. 12. ksl,N = 103, 104, 105, and 106 s−1 and koff,N = 10 s−1 were used. Under these conditions, effective sliding lengths λ are 10 (black), 32 (red), 100 (magenta), and 316 (blue) bp. (B) Rate constants kapp as a function of the target position m for probe DNA with L = 90. For this panel, ksl,N = 104 s−1 and koff,N = 10 s−1 (an effective sliding length λ = 32 bp) were used. The dotted line is from the ODE-based numerical simulations; the solid line, from the VK model-based analytical form of kapp (Eq. 12); and the dashed line, from the modified Berg’s approximation (Eq. 16). For both panels A and B, Dtot = 2.5 nM; Ptot = 50 nM, Kd,N = 4 μM; Kd,S = 0.1 nM; Ctot = 2 μM; ϕ = 1; and M = 20.
VK model vs. Berg’s approximation
For systems without competitor DNA, Berg et al. showed that if the target site is located in the middle of rod-like DNA, the apparent rate constant kapp can be approximated by:10
| [14] |
where D1 is a one-dimensional diffusion constant for sliding, and l is the distance between two adjacent sites (3.4 Å) along the DNA axis. This expression assumes an approximate continuum state for sliding, whereas the VK model assumes discrete states. It is straightforward to derive a simple relationship between D1 and ksl,N:
| [15] |
Eq. 15 indicates that D1 is equivalent to ksl,N when D1 is given in bp2 s−1. For systems involving competitor DNA, Eq. 14 can be modified to the following:
| [16] |
As demonstrated in Figure 2B, the modified Berg’s approximation (Eq. 16) provides an accurate kapp only if the target is located at m ≈ L / 2. This limitation occurs because Eqs. 14 and 16 assume that the antenna effect (i.e., enhancement of target association via association with nonspecific sites followed by sliding)7,47 applies to the same degree for both sides of the target. When the target is located near the edge of the DNA, only one side provides a significant degree of the antenna effect, and therefore the search kinetics can slow down by up to ~2-fold.43 The VK-model-based expression (Eq. 12) provides an accurate kapp for any m value, because this model accounts for different antenna effects for the two sides. This property of the VK-model-based expression is especially important when an extrinsic fluorescent group in close proximity to the target is used to detect the formation of the specific complex.
kapp for systems with competitor DNA in the presence of intersegment transfer
Under the condition of Dtot « Ptot « Ctot, the fraction of the protein bound to the competitor DNA (fCP) is given by:
| [17] |
If intersegment transfer is efficient, a major pathway in the target association kinetics can be the pathway from the competitor DNA to the target via intersegment transfer and subsequent sliding. Using the mean time TCP for the search via this additional pathway, the kapp constant is given approximately by:
| [18] |
Because the VK model does not assume any particular mechanisms for protein’s arrival to and departure from the probe DNA, TCP is given in the same form as TP (i.e., Eqs 7–11), but with kin and kout substituted to:
| [19] |
| [20] |
The rate constant kout for TP should also be substituted to kout,CP for the systems involving the intersegment transfer mechanism because the protein on a nonspecific site of the probe DNA can leave the probe DNA via intersegment transfer as well (with a pseudo-first-order rate constant ). As shown in Figure 3, the kapp constants calculated using this analytical expression (Eq. 18) agree well with those from the ODE-based numerical simulations.
Figure 3.
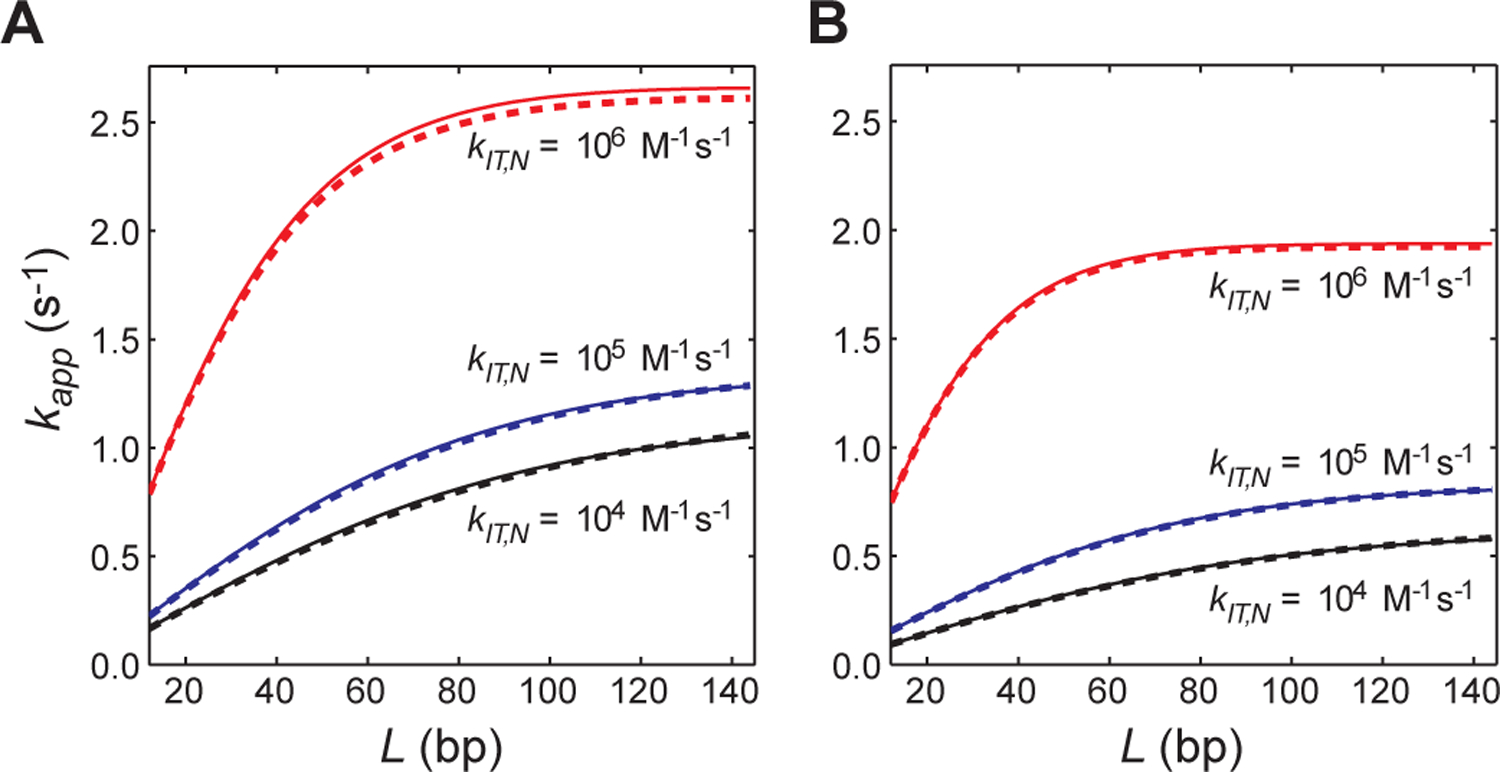
Validation of the VK model-based analytical forms of kapp for systems involving competitor DNA and intersegment transfer (Eq. 18). (A) Rate constant kapp for target association as a function of the total number of sites L. A single orientation per site (i.e., ϕ = 1) was assumed. The sliding rate constant ksl,N = 105 s−1 was used. The other conditions are exactly the same as those for Figure 2A except that intersegment transfer is taken into consideration. The rate constants for intersegment transfer are indicated. (B) Rate constant kapp for target association as a function of the total number of sites L under conditions identical to those for the panel A, except that 2 orientations per site are assumed (i.e., ϕ = 2). The kinetic and thermodynamic parameters are defined for each orientation. For both panels, the dashed lines were obtained from the ODE-based numerical kinetics simulations, whereas the solid lines were obtained with Eq. 18. Details of the ODE-based simulations are given in the Supplemental Information.
Sliding and dependence of kapp on length of the probe DNA
Although some previous studies used the DNA-length dependence of target association to investigate sliding,20,24,48–50 the previous analytical expressions (e.g. Eq. 14) were applicable only to systems involving neither competitor DNA nor intersegment transfer. With our analytical form of kapp, we can determine the rate constant ksl,N for sliding from experimental data for systems involving competitor DNA and intersegment transfer. In Eq. 18, the dependence of kapp on ksl,N arises from TP and TCP. Note that TP and TCP share exactly the same S (Eq. 10) and y (Eq. 11), which are the only parameters containing the rate constant ksl,N for sliding. Because of this similarity, the length dependence for Eq. 12 with kout substituted to kout,CP is virtually indistinguishable from that for Eq. 18. The rate constants ksl,N can be accurately determined from length-dependent kapp data via nonlinear least-squares fitting with Eq. 12, even for systems involving intersegment transfer. This is convenient for experimental research. An important parameter for sliding is the effective sliding length λ given by:43
| [21] |
Again, kout should be substituted to kout,CP if intersegment transfer is involved. As is evident from Eq. 11 (also from Eq. 16), λ is directly relevant to the length dependence of kapp. When L < λ, kapp is virtually proportional to L because of the extended antenna effect. As noted previously, an increase in L beyond 2λ does not enhance the antenna effect.7 Because this asymptotic length dependence is important for determining ksl,N and λ, the length L should be varied with the maximum being larger than (or at least comparable to) λ.
Intersegment transfer and dependence of kapp on concentration of competitor DNA
In the absence of intersegment transfer, the kapp constant is virtually proportional to Ctot−1 when ϕMCtot » Kd,N as noted by Lin and Riggs.51 This proportionality is obvious from Eqs 12 and 13. At a higher concentration of competitor DNA, the protein can be trapped at nonspecific sites more easily, which slows down the target association process. However, intersegment transfer can counteract this trapping effect. In the presence of intersegment transfer, the escape of a protein from competitor DNA can become faster at a higher concentration of competitor DNA because intersegment transfer is a second-order process whose rate is proportional to the concentration of the DNA in the free state. When the fCP / TCP term in Eq. 18 is significantly larger than the fP / TP term, the dependence of kapp on Ctot becomes substantially weaker than the proportionality to Ctot−1. By measuring kapp as a function of Ctot, the rate constant kIT,N for intersegment transfer can be determined via nonlinear least-squares fitting with Eq. 18. The term involving fCP / TCP in Eq. 18 corresponds to the contribution of the pathway that involves intersegment transfer followed by sliding to the overall target association kinetics. Thus, the role of intersegment transfer in the target association process can be directly assessed.
Results
In the current study, we investigated the target search kinetics for the DNA-binding domain of human Egr-1. Hereafter, this protein construct comprising three zinc fingers is referred to as the ‘Egr-1 zinc-finger protein’ for simplicity’s sake. The association of the Egr-1 zinc-finger protein with DNA was monitored via the fluorescence from the fluorescent group that was covalently attached to a DNA terminus. We used the DNA duplexes shown in Figure 4.
Figure 4.
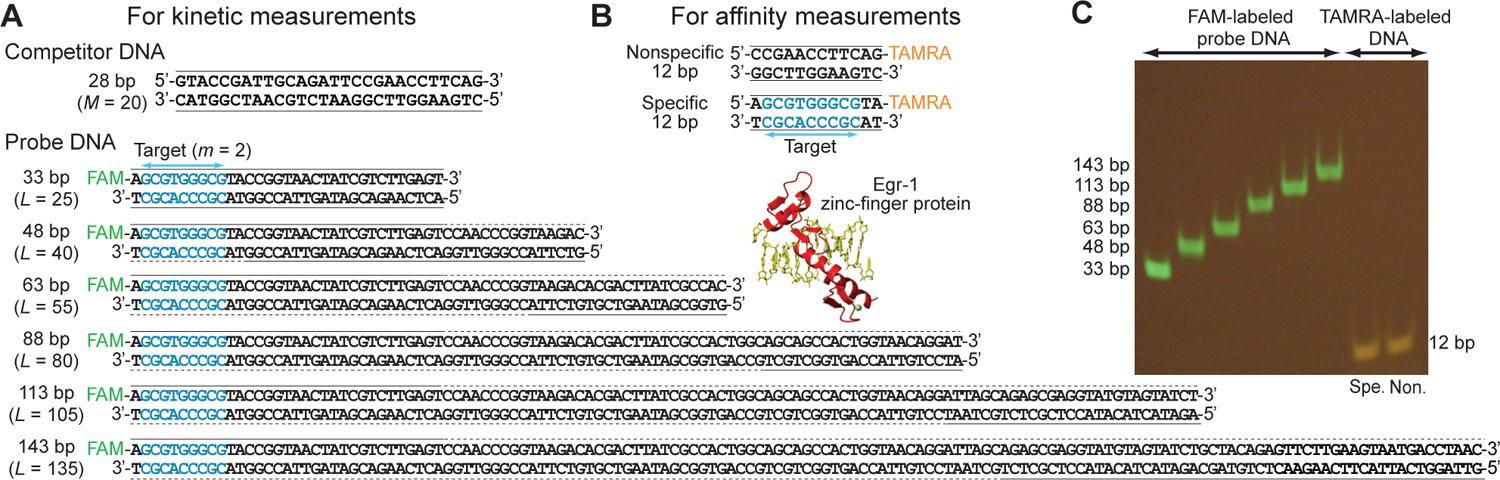
DNA duplexes used in the current study on the Egr-1 zinc-finger protein. (A) DNA duplexes used for kinetic measurements. The solid lines indicate chemically synthesized nucleotides, whereas the dotted lines indicate enzymatically extended nucleotides. (B) DNA duplexes used for affinity measurements. (C) PAGE of the fluorescent DNA duplexes, which were visualized via fluorescence from the covalently attached FAM or TAMRA.
Dissociation constants for nonspecific and specific complexes
Analyses of sliding and intersegment transfer based on the discrete kinetic model require the equilibrium constants for the nonspecific and specific complexes. We measured the affinities using 12-bp nonspecific and specific DNA duplexes with tetramethylrhodamine (TAMRA) attached to the 3’-terminus (Figure 4). The apparent Kd constants were determined from the fluorescence anisotropy as a function of protein concentration. TAMRA was used for the Kd measurements because it exhibits a large change in fluorescence anisotropy upon binding of the protein to DNA. We measured the apparent Kd for the 12-bp nonspecific DNA to be 0.58 ± 0.08 μM at 80 mM KCl (Figure 5). Because the previous structural studies for the specific and nonspecific DNA complexes of Egr-1 showed that Egr-1 binds to DNA as a monomer and covers 9 bp,34,39 the 12-bp nonspecific DNA has 8 [= 2 × (12 – 9 + 1)] overlapping sites (this number corresponds to ϕM). Assuming that the apparent Kd can be approximated by koff,N / (ϕMkon,N) in this case where only one protein molecule can bind to the 12-bp DNA, the dissociation constant Kd,N for each nonspecific site was calculated to be 4.6 μM (= 0.58 × 8). This value was used in the calculations to determine ksl,N and kIT,N (see below). For the 12-bp specific DNA containing the target site, the affinity at 80 mM KCl was too strong to directly measure with the same fluorescence method. However, we were able to measure the dissociation constant Kd at higher ionic strengths (Figure 5). By extrapolating from these data along with the counterion condensation theory,52,53 Kd,S at 80 mM KCl were estimated to be ~0.1 nM.
Figure 5.
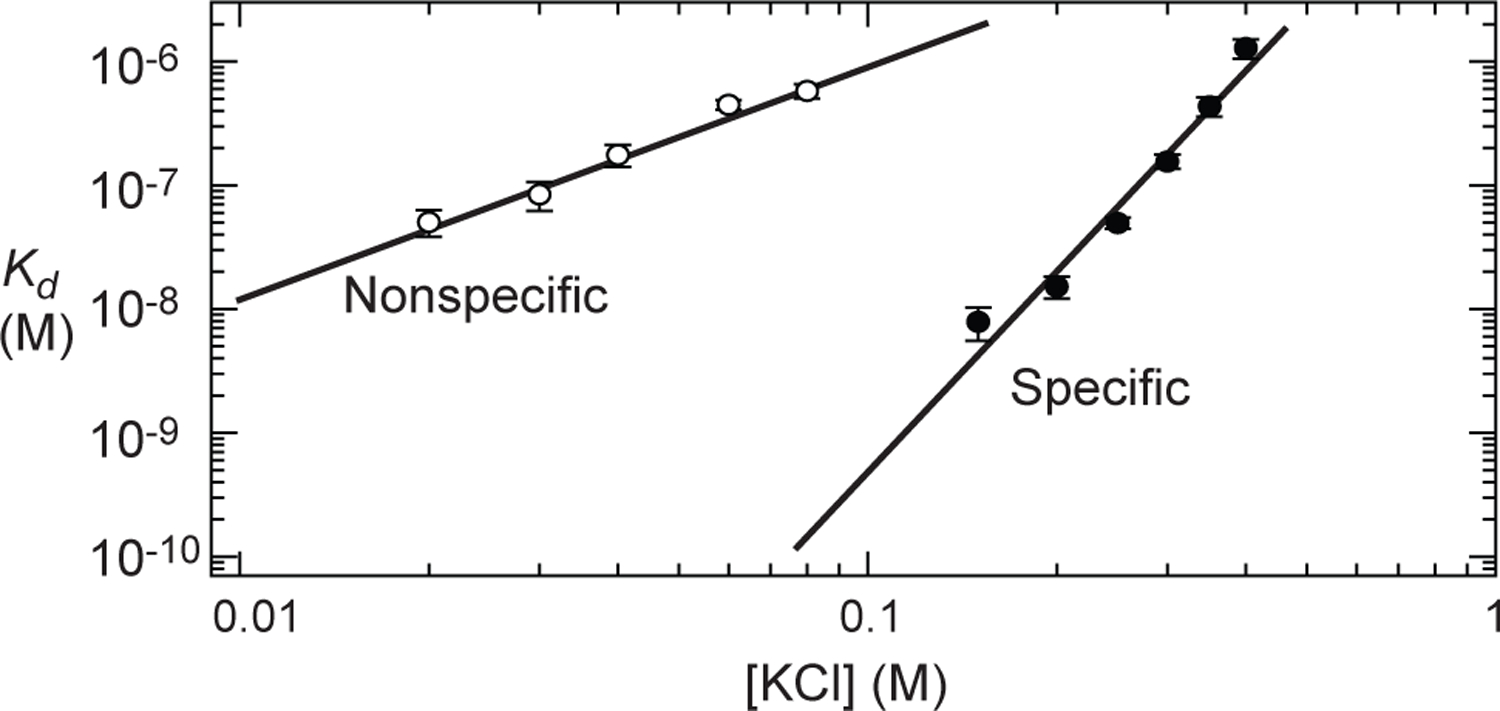
Dissociation constant Kd for nonspecific and specific complexes between the Egr-1 protein and 12-bp DNA at various concentrations of KCl. These data were obtained by measuring the TAMRA fluorescence anisotropy as a function of protein concentration. For each complex, the solid line represents a linear extrapolation assuming a linear relationship (solid lines) between logKd and log[KCl], which is based on the counterion condensation theory.52,53
Change of FAM fluorescence intensity upon Egr-1 target association
To detect the binding of Egr-1 to the target site on the probe DNA duplexes, we monitored the change in fluorescence intensity of 5’-terminal fluorescein amidite (FAM), which was located near the Egr-1 target (at the second position from the terminus; see Figure 4). We chose this fluorescent probe for our stopped-flow kinetic experiments because the FAM-labeled DNA exhibited stronger fluorescence intensity (but weaker anisotropy) than the TAMRA-labeled DNA exhibited. The FAM emission spectra recorded for the 113-bp probe DNA in the presence and absence of the Egr-1 zinc-finger protein and competitor DNA are shown in Figure 6A. Although no spectral change was observed upon the addition of competitor DNA to the solution of probe DNA, a significant (up to ~18%) reduction in the fluorescence intensity was observed when the Egr-1 zinc-finger protein was added. This change in FAM fluorescence is presumably due to its close proximity to the DNA-bound protein, as observed for other proteins.54,55 Varying the concentration of the Egr-1 zinc-finger protein, we measured the FAM fluorescence intensity from the probe DNA (2.5 nM) in the presence of 2 μM competitor DNA at equilibrium (Figure 6B). The titration data clearly show a high-affinity protein-DNA interaction with Kd « 1 nM at 80 mM KCl. This high affinity is consistent with the above-mentioned data for the 12-bp DNA containing a target site. Thus, these results indicate that the change in the FAM fluorescence intensity reflects the association of Egr-1 with the target (rather than other sites) on the probe DNA.
Figure 6.
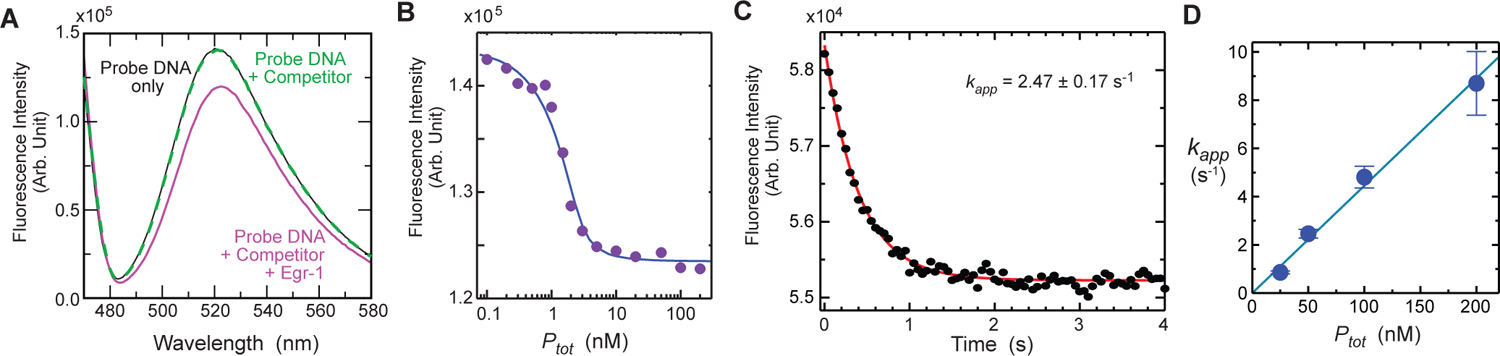
FAM fluorescence data for the target association of the Egr-1 zinc-finger protein with the 113-bp probe DNA (Dtot = 2.5 nM) in the presence of 28-bp competitor DNA (Ctot = 2 μM). The buffer conditions were 10 mM Tris•HCl (pH 7.5), 80 mM KCl, and 200 nM ZnCl2. (A) Change in the FAM emission spectra upon protein binding. The black solid line is the spectrum recorded for the probe DNA only; the green dotted line, for the probe DNA plus competitor DNA; and the magenta solid line, with the probe DNA, competitor DNA, and protein (Ptot = 100 nM). (B) FAM fluorescence intensity measured as a function of Ptot in the presence of the competitor DNA. (C) Stopped-flow time-course data of the FAM fluorescence intensity immediately after mixing the protein solution (Ptot = 50 nM) with the solution containing the probe and competitor DNA duplexes. The red curve represents the best fit to a mono-exponential function. (D) Protein-concentration dependence of the apparent pseudo-first-order kinetic rate constant kapp for target association. The apparent second-order rate constant for association was determined to be 4.5 × 10⁷ M−1 s−1. The error bars represent the standard deviations for 8 – 10 replicates.
Target association kinetics for the Egr-1 zinc-finger protein
Using a stopped-flow device, we recorded the time courses of FAM fluorescence intensity immediately after mixing the protein solution with a solution containing the probe and competitor DNA duplexes. In this experiment, the emission light that passed through a long-pass filter (515 nm cutoff) was detected without using monochromator. Although this configuration allowed higher sensitivity, the percentage change in the emission intensity upon the target association was smaller due to a higher non-fluorescent background. Figure 6C shows the fluorescence time-course data obtained under conditions of Dtot = 2.5 nM, Ptot = 50 nM, and Ctot = 2 μM. Under these conditions together with the above-mentioned equilibrium constants, 95% of the protein molecules are bound to the 28-bp competitor DNA at the quasi-equilibrium that occurs immediately after mixing, and 96% of the target on the 113-bp DNA is bound to the protein at the conclusion of the binding reaction. To analyze the kinetics of distinct translocation mechanisms, we measured the apparent rate constant kapp using various settings of L, Ptot, and Ctot (all satisfying Dtot « Ptot « Ctot). In all cases, the fluorescence intensity changed in a mono-exponential manner, and an apparent pseudo-first-order rate constant kapp was determined via mono-exponential fitting. Figure 6D shows the dependence of kapp on Ptot in the presence of competitor DNA (Ctot = 2 μM). As our analytical forms (i.e., Eqs. 12, 16, and 18) predict, the rate constant kapp was proportional to Ptot. The slope of the plot corresponds to an apparent second-order rate constant ka for target association (ka = 4.5 × 10⁷ M−1 s−1 for Figure 6D). Although ka was used in some previous studies of protein translocation on DNA,20,25,48 we used the pseudo-first-order rate constant kapp instead when investigating sliding and intersegment transfer, as demonstrated below. This makes the investigations quicker yet remains equivalent to the use of ka because kapp was found to be proportional to Ptot for all other conditions tested (Supplemental Information). In all the following experiments, we used Ptot = 50 nM, because at this concentration, kapp was typically less than 5 s−1 and could be measured precisely (with errors < 10%) with our current method.
Dependence on the length of the probe DNA
To investigate the sliding kinetics of Egr-1 using dependence of kapp on the length of the probe DNA, we prepared 33-, 48-, 63-, 83-, 113- and 143-bp DNA duplexes, each containing a single target site and a FAM probe, as shown in Figure 4. With the stopped-flow fluorescence method, the rate constant kapp for target association was measured with 50 nM protein, 2.5 nM probe DNA, and 2,000 nM nonspecific DNA duplex (28 bp) at 80 mM KCl (Figure 7). As predicted in Figures 2 and 3, our experimental kapp data showed that the length dependence was an increasing function with a steeper slope for shorter lengths and an obvious asymptote for longer lengths. For example, the kapp constant for the 63-bp probe DNA was 64% larger than that for the 33-bp probe DNA, whereas the kapp constants for the 143-bp and 113-bp probe DNA duplexes were identical within experimental error. Qualitatively, these results suggest that the effective sliding length λ is comparable to the DNA lengths used in this experiment.
Figure 7.
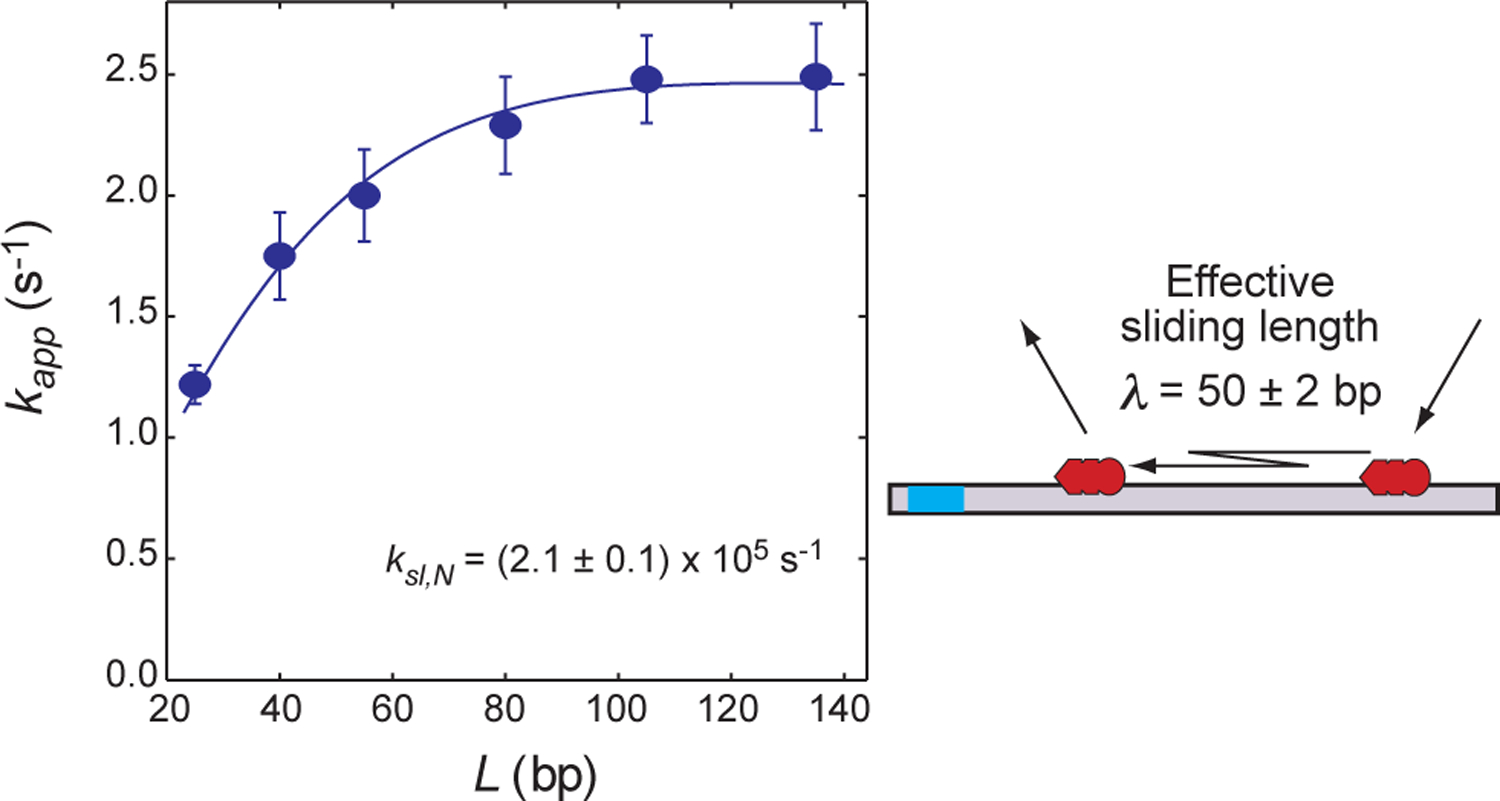
DNA-length dependence of the target association kinetics measured for the Egr-1 zinc-finger protein at 80 mM KCl (Dtot = 2.5 nM; Ptot = 50 nM; and Ctot = 2 μM). The pseudo-first-order rate constant kapp for target association is plotted as a function of the total number of sites on the probe DNA. The blue curve represents the best fit to Eq. 12. The effective sliding length λ is given by Eq. 21. Note that an increase in L beyond 2λ does not enhance the target association. The error bars represent the standard deviations for 8 – 10 replicates.
Kinetic rate constant for sliding of Egr-1 on DNA
The analytical forms of the kapp constants allow us to determine the sliding rate constant ksl,N from the length-dependent kapp data for Egr-1 in the system involving a large excess of competitor DNA. As described above, the determination of ksl,N does not require accurate information on intersegment transfer. For a DNA length > 30 bp, the effective diffusion coefficient (Dprotein + DDNA), which is relevant to the Smoluchowski limit, should be dominated by the three-dimensional diffusion coefficient Dprotein for the Egr-1 zinc-finger protein (10 kDa; hydrodynamic radius, ~15 Å). Therefore, the length dependence of the diffusion coefficient DDNA for DNA does not have to be taken into consideration in the analysis of the length-dependent kapp data for the investigation of sliding.10 Because Egr-1 binds to DNA as a monomer, Eq. 12 with ϕ = 2 was employed for nonlinear least-squares fitting to determine the rate constant ksl,N. The parameter L was set to A – B + 1, where A is the total length of DNA in bp and B is the length of each nonspecific site. As mentioned above, B was set to 9 bp. Thus, the values of L were 25, 40, 55, 80, 105, and 135 for the 33-bp, 48-bp, 63-bp, 88-bp, 113-bp and 143-bp probe DNA duplexes, respectively. The target position was m = 2 for all the probe DNA duplexes. Calculation of kapp using Eq. 12 requires four parameters: ksl,N, kout, Kd,N, and Kd,S. In the current case with Kd,S / (fCPPtot) << 1, information about Kd,S is not essential in the calculation (see Eq. 12). With the experimentally obtained dissociation constant Kd,N, the rate constant kon,N was treated as koff,N / Kd,N, while the other two parameters, ksl,N and kout, were optimized via nonlinear least-squares fitting. The resultant best-fit curve is shown in Figure 7. The rate constant ksl,N was determined to be (2.1 ± 0.2) ×105 s−1 for the sliding of the Egr-1 zinc-finger protein at 80 mM KCl. This rate constant corresponds to D1 = (2.4 ± 0.1) ×10−2 μm2 s−1. Using Eq. 21, the effective sliding length λ was determined to be 50 ± 2 bp.
Dependence on the concentration of the competitor DNA
Using the 113-bp probe DNA, we measured the apparent rate constant kapp for target association at six different concentrations of competitor DNA (Ctot = 0.5, 1.0, 2.0, 4.0, 6.0 and 8.0 μM). The results are shown in Figure 8A. The kapp constant was found to decrease upon increasing Ctot. As described above, kapp should be virtually proportional to Ctot−1 if intersegment transfer is not involved in the target search process and ϕMCtot » Kd,N. Although this inequality was satisfied, our data for the Egr-1 zinc-finger protein showed that kapp constant was not proportional to Ctot−1. For example, our experiment showed that the ratio of the kapp constant at Ctot = 2.0 μM to that at Ctot = 8.0 μM was only 1.3, instead of 4. These results qualitatively suggest that intersegment transfer contributes significantly to the target association process.
Figure 8.
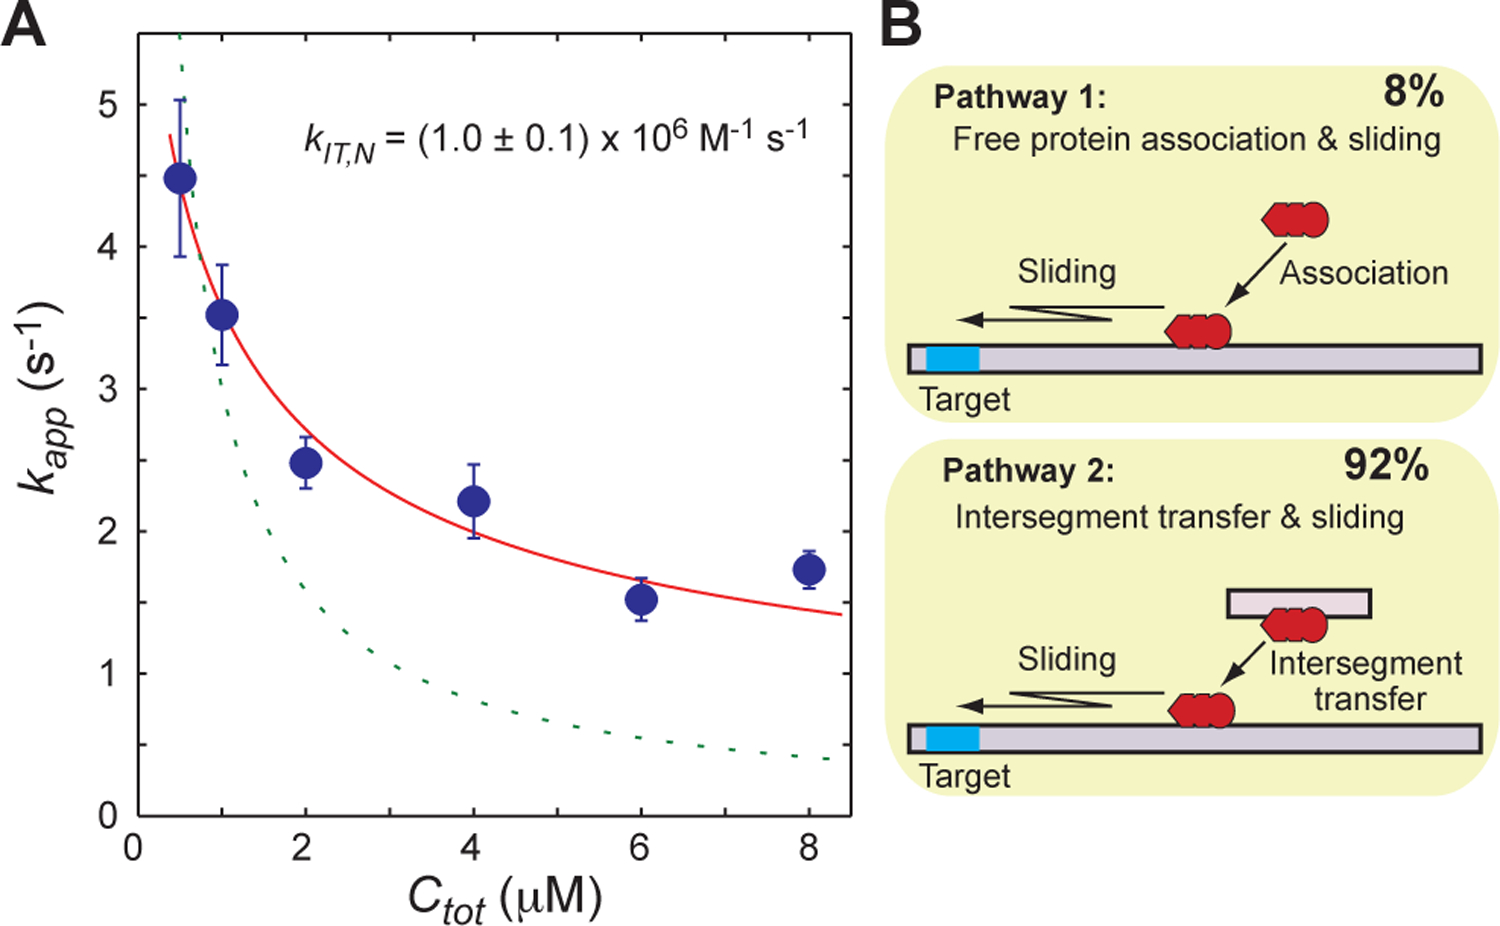
(A) Competitor DNA concentration (Ctot) dependence of the apparent rate constant kapp measured for Egr-1 (Ptot = 50 nM) at 80 mM KCl. The 113-bp probe DNA was used (Dtot = 2.5 nM). The circles represent the experimentally measured kapp constants. The error bars represent the standard deviations for 8 – 10 replicates. The solid red lines are the best-fit curve to Eq. 18, which accounts for intersegment transfer. The dotted green lines are the best-fit curve to Eq. 12, which does not account for intersegment transfer. (B) Contributions of major target association pathways under the current experimental conditions.
Kinetic rate constant for intersegment transfer of Egr-1
Using the Ctot-dependent kapp data, we determined the rate constant kIT,N for intersegment transfer. The analytical form of kapp for systems involving intersegment transfer (Eq. 18) was employed for nonlinear least-squares fitting to determine kIT,N. The calculation of kapp with Eq. 18 requires five parameters: kIT,N, koff,N, ksl,N, Kd,N, and Kd,S. Again, in the current case with Kd,S / (fCPPtot) << 1, information about Kd,S is not essential in the calculation. As described above, kon,N was treated as koff,N / Kd,N. Because ksl,N was determined from the length-dependent kapp data, only two parameters, kIT,N and koff,N, were optimized in the fitting calculation. This procedure provided an excellent fit to the experimental Ctot-dependence data (Figure 8A; solid curves). In contrast, fitting with Eq. 12 (no intersegment transfer) provided only a poor fit to the experimental Ctot-dependence data (Figure 8A; dotted curves). Because these two models for fitting differ in the degree of freedom, Akaike’s information criterion (AIC) was used for model assessment. The AIC values for the fittings with Eqs 12 and 18 were 187.9 and 7.4, respectively. These results clearly indicate that the model that accounted for intersegment transfer is far better to describe the Ctot-dependent kapp data. The rate constant kIT,N for intersegment transfer was determined to be (1.0 ± 0.1) × 106 M−1 s−1 for the Egr-1 zinc-finger protein at 80 mM KCl. The kinetic parameters determined in our current study are summarized in Table I.
Table I.
Kinetic parameters for translocation of the Egr-1 zinc-finger protein on nonspecific DNA sites determined from the stopped-flow fluorescence data.
| Parameters | Values and uncertainties a) |
|---|---|
| - Sliding - | |
| ksl,N (s−1) b) | (2.1 ± 0.1) × 105 |
| D1 (μm2 s−1) c) | (2.4 ± 0.1) × 10−2 |
| - Intersegment transfer - | |
| kit,N (M−1 s−1) d) | (1.0 ± 0.1) × 106 |
| - Dissociation - | |
| koff,N (s−1) f) | 10 ± 4 |
| kout (s−1) g) | 83 ± 3 |
| - Association - | |
| kon,N (M−1 s−1) h) | (2.3 ± 0.8) × 106 |
| - Effective sliding length - | |
| λ (bp) i) | 50 ± 2 |
Uncertainties in reported values were estimated with a 68% confidence interval in fitting.
From the data shown in Figure 7.
From ksl,N along with Eq. 15.
From the data shown in Figure 8.
From the data shown in Figure 8.
From the data shown in Figure 7. This actually corresponds to kout,CP because of the strong presence of intersegment transfer.
From koff,N and Kd,N.
From ksl,N and kout along with Eq. 21.
Intersegment transfer → sliding as the major pathway for target association
Our methodology permits kinetic measurements of intersegment transfer between nonspecific DNA sites in the presence of the target site. Owing to this unique feature, we can directly examine the role of intersegment transfer in the target association process. The analytical form of kapp (Eq. 18) for the system involving competitor DNA and intersegment transfer includes the contributions of two major pathways for target association (Figure 8B). The term in Eq. 18 represents the contribution from the pathway involving the association of the free protein with a nonspecific site on the probe DNA and the subsequent sliding to the target (“Pathway 1”). The term in Eq. 18 represents the contribution from the pathway involving the intersegment transfer of competitor-bound protein to a nonspecific site on the probe DNA and the subsequent sliding to the target (“Pathway 2”). From the obtained kinetic rate constants, the relative contribution of Pathway 2 in the presence of 2 μM competitor DNA was calculated to be 92%. This result clearly indicates the importance of intersegment transfer in the presence of a large excess of competitor DNA.
Discussion
Extremely efficient intersegment transfer of Egr-1 between nonspecific DNA sites
Our current study shows that intersegment transfer of Egr-1 between nonspecific DNA sites is extremely efficient. The intersegment transfer rate constant kIT,N is only two-fold smaller than the association rate constant kon,N (Table I). In our previous NMR study, the second-order rate constant for the intersegment transfer of Egr-1 between two different 28-bp nonspecific DNA duplexes was measured at 20 mM KCl to be 3.6 × 10⁶ M−1 s−1.34 This value corresponds to kIT,N = 1.8 × 10⁵ M−1 s−1, assuming that the number of sites is M = 20 in 28-bp DNA (note that kIT,N is defined for each pair of departure and arrival sites). Although the value of kIT,N = 1.0 ×10⁶ M−1 s−1 from our current study is ~6-fold larger, the difference in ionic strength (20 mM vs. 80 mM KCl) can easily account for this discrepancy. In fact, in the case of the HoxD9 homeodomain, the kinetic rate constant for intersegment transfer at 60 mM NaCl was 10-fold larger than that at 20 mM NaCl.56 Interestingly, the intersegment transfer of Egr-1 between the target DNA sites is > million-fold slower (kIT,S = 0.8 M−1 s−1),42 presumably due to the absence of domain motions that facilitate formation of the transient DNA-bridging intermediate for intersegment transfer.34 Our current fluorescence data and the previous NMR data are consistent in that both indicate the very efficient intersegment transfer of Egr-1 between nonspecific DNA sites.
Intersegment transfer as a mechanism to counteract trapping by high-concentration DNA
Nonspecific binding to DNA can substantially enhance the protein-target association via the antenna effect and reduced dimensionality.2–9 However, trapping by nonspecific sites can substantially slow down the target association process at a high concentration of DNA.4,7 For example, Eq. 12 for the systems in the absence of intersegment transfer indicate that kapp constant is proportional to Ctot−1, which represents a stronger trapping effect at a higher DNA concentration. However, our data (Figure 8) clearly show that this dependence on Ctot becomes significantly weaker in the presence of intersegment transfer, allowing the protein to find its target site efficiently.
Although intersegment transfer was defined as direct transfer between two DNA chains via a transient DNA-bridging intermediate (Scheme 2), this intermediate has never been directly observed experimentally, as far as we know. Only coarse-grained molecular dynamics (CGMD) simulations directly inferred the DNA-bridging intermediates in intersegment transfer.34,57–59 If the breakage of the bridging intermediate is the rate-limiting step, intersegment transfer should appear to be a first-order process that cannot be detected by DNA concentration-dependence experiments. In such a case, the DNA-bridging intermediate should be a stable species. Intersegment transfer should appear to be a second-order process (Scheme 3) when the formation of the bridging intermediate via collision of a nonspecific complex and free DNA is the rate-limiting step. In this case, the DNA-bridging intermediate is a transient, low-population species. Intersegment transfer observed in the current and previous26–34 studies are of this kind. Our previous studies using NMR spectroscopy and CGMD simulations suggested that local dissociation of one of the three zinc fingers could allow Egr-1 to transiently bridge two DNA duplexes during intersegment transfer.34,60 However, as Sidorova et al. recently suggested,32 the phenomenological second-order nature of intersegment transfer can be explained without assuming the presence of DNA-bridging intermediates. Regardless of whether the DNA-bridging intermediates are actually involved or not, the second-order nature of intersegment transfer is important because it allows the protein to counteract trapping by nonspecific sites at a high concentration of DNA.
Relevance to the target association process in vivo
Because the DNA density is extremely high in the nucleus (~100 mg/ml),61 the target search pathway involving intersegment transfer may also play a major role in the target association process in vivo, at least for Egr-1. The intersegment transfer between the two DNA ends of a nucleosome particle may occur efficiently because the two ends are separated by only ~60 Å in three-dimensional space.62 In fact, the CGMD simulations showed that Egr-1 could undergo rapid intersegment transfer between two DNA duplexes separated by this distance.34 Thus, extremely efficient intersegment transfer, which was observed in vitro in our current and previous studies, may allow Egr-1 to effectively bypass nucleosome particles and to rapidly locate the target sites in vivo.
Egr-1’s sliding on DNA: Comparison with other proteins
The one-dimensional diffusion coefficient D1 for sliding on DNA is known for some proteins. For example, D1 = 4.8 × 10⁶ bp2 s−1 (0.55 μm2 s−1) for OGG1;12 D1 = 2.6 × 10⁶ bp2 s−1 (0.30 μm2 s−1) for p53;63 D1 = 4.9 × 10⁵ bp2 s−1 (5.7×10⁻² μm2 s−1) for MutSα;14 D1 = 9.5 × 10⁴ bp2 s−1 (1.1×10⁻² μm2 s−1) for EcoRV;64 and D1 = 3.0 × 10⁴ bp2 s−1 (3.5×10⁻³ μm2 s−1) for EcoRI.22 In most of these studies, sliding on DNA was directly observed with single-molecule fluorescence techniques. As noted previously,5,63 the single-molecule techniques could overestimate D1 due to their limited spatial resolution, which makes it difficult to distinguish sliding and hopping. Thus, D1 measurements with completely different principles are of practical importance. Our current bulk-solution study shows that D1 = 2.1 × 10⁵ bp2 s−1 (2.4 × 10⁻² μm2 s−1) for the Egr-1 zinc-finger protein (Table I). This value is within the typical range for the D1 coefficients. Unlike three-dimensional diffusion coefficients in solvent, the one-dimensional diffusion coefficient D1 for proteins sliding on DNA appears to be virtually independent of the molecular size. The number of intermolecular hydrogen bonds and ion pairs between protein and DNA in nonspecific complexes could be more important determinants of D1.
Conclusions
We have studied the kinetics of Egr-1’s sliding and intersegment transfer in the target DNA search process. We have derived the analytical forms of kapp that facilitate kinetic investigations of distinct translocation mechanisms in the presence of a large excess of nonspecific competitor DNA. The stopped-flow fluorescence data along with the analytical forms of kapp permit the determination of the rate constants for sliding and intersegment transfer for proteins that form a stable complex with their target. The most important finding in this work is that intersegment transfer plays a major role in the target association process. Although this role has been speculated in previous studies on intersegment transfer in the absence of the target, those studies could not provide information on the extent to which intersegment transfer can actually contribute to the target association kinetics. Owing to the analytical expressions for kapp, our current methodology provides the relative contributions of distinct translocation pathways to target association. For the Egr-1 zinc-finger protein, the major pathway involves the intersegment transfer to a nonspecific site and the subsequent sliding to the target on the probe DNA. The relative contribution of this pathway was 92% for the system with 2.5 nM 113-bp probe DNA and 2,000 nM 28-bp nonspecific competitor DNA at 80 mM KCl. The corresponding contribution of the pathway involving the free protein’s association with a nonspecific site and the subsequent sliding to the target was as small as 8%. Despite its significant contribution, translocation via intersegment transfer cannot be distinguished from translocation via dissociation and association unless the DNA concentration dependence is studied. This nature is most likely responsible for a delay in the understanding of intersegment transfer in the current field. We hope that our present work will stimulate further investigations on the target search pathways involving intersegment transfer for other transcription factors as well as for DNA repair/modifying enzymes.
Materials and Methods
Egr-1 zinc-finger protein:
The DNA-binding domain of human Egr-1 comprising three zinc fingers (residues 335–432) was expressed in E. coli BL21(DE3) and purified as described in our previous papers.34,42 The Egr-1 solution was treated with 3 mM TCEP at 4 ˚C overnight to completely reduce the protein, and the buffer was extensively exchanged to 10 mM Tris•HCl (pH 7.5), 300 mM KCl, 1 mM 2-mercaptoethanol, and 200 nM ZnCl2. The protein was quantified using a BCA assay kit (Pierce) or using UV absorbance at 280 nm and an extinction coefficient of 1490 mM−1 cm−1 (the results from these two methods were consistent). The protein solution was kept under argon gas until use.
Fluorescence-labeled probe DNA for kinetics measurements:
To prepare the DNA duplexes shown in Figure 4A, 33-mer single-stranded DNA with a FAM attached to the 5’-terminus was purchased from Integrated DNA Technology (IDT). Of the 33 bases, the first 12 bases contain an Egr-1 target sequence (9 bp) and the last 21 bases can hybridize with positions 1160–1180 of the pUC-19 plasmid. The DNA duplexes of 63, 88, 113, and 143 bp were prepared via PCR using Vent DNA polymerase (New England), the FAM-labeled 33-mer primer, a reverse primer, and pUC-19 as the template. The 48-bp duplex was prepared via hybridizing the FAM-labeled 33-mer and a singled-stranded DNA, followed by base filling with DNA polymerase. The 33-bp duplex was prepared via annealing of equimolar amounts of individual complementary strands. The FAM-labeled 33-bp duplex was purified via polyacrylamide gel electrophoresis (PAGE) using 4–20% gradient polyacrylamide / TBE gels (Invitrogen). The other duplexes (i.e., 48-, 63-, 88-, 113- and 143-bp) were purified through the following three procedures. First, the reaction mixture was loaded onto a Resource-Q anion-exchange column (GE Healthcare), and the DNA was eluted with a gradient of 0 – 1.5 M NaCl in a buffer of 50 mM Tris•HCl (pH 7.5) and 1 mM EDTA. The fractions containing the desired reaction product were concentrated and subjected to PAGE with 4–20% gradient polyacrylamide / TBE gels. The band of the desired PCR product was excised, crushed, and shaken at room temperature in a buffer of 10 mM Tris•HCl (pH 7.5) and 40 mM KCl for 24 – 36 hours to extract the DNA from the gel. The extracted DNA duplexes were further purified via a PCR purification kit (Qiagen).
Competitor DNA:
The 28-bp nonspecific competitor DNA used for the kinetic experiments was the same as that used for the NMR studies of the Egr-1 - nonspecific DNA complex. This DNA was synthesized and purified as described previously.34
Stopped-flow fluorescence-based assay of target association kinetics:
The kinetics of target association was measured at 20 ˚C with an ISS PC-1 spectrofluorometer equipped with an Applied Photophysics Rx-2000 stopped-flow device. The following two solutions were mixed: Solution A: 50–200 nM protein in a buffer of 10 mM Tris•HCl (pH 7.5), 80 mM KCl, and 200 nM ZnCl2; and Solution B: 5 nM FAM-labeled DNA and 1000–8000 nM 28-bp competitor DNA in the same buffer. The mixing ratio was 1:1; thus, the final concentrations of the protein and DNA became halved. The spectrofluorometer has two emission channels in a T-format: one with and the other without an emission-light monochromator. In the stopped-flow kinetics experiments, we used the emission channel with no monochromator for better sensitivity. The FAM fluorophore was excited at 460 nm, and the emission light that passed through a long-pass filter with a cutoff at 515 nm (Edmund Optics) was recorded. Immediately after stopping the flow for mixing, the time-course data of the fluorescence intensity were collected for 4–10 s with a time interval of 20–50 ms. Each experiment was repeated 8 to 10 times. As expected from the ODE-based numerical simulations, the time-course data of the fluorescence intensity were found to be mono-exponential. The apparent pseudo-first-order rate constant kapp for target association was determined from the experimental data via nonlinear least-squares fitting with f(t) = f∞ + (f0 – f∞)exp(–kappt), where f0, f∞, and kapp are optimized, and f(t) represents the fluorescence intensity.
Fluorescence anisotropy-based affinity measurements:
The two 12-bp DNA duplexes with a 3’-terminal TAMRA were prepared for affinity measurements (Figure 4B). HPLC-purified DNA strands from 250-nmol scale syntheses were purchased from Integrated DNA Technology. The complementary strands were mixed and annealed at 85 ˚C, and the duplex was purified by PAGE using 4–20% gradient polyacrylamide / TBE gels. The protein-titration experiments were performed at various concentrations of KCl in a buffer of 10 mM Tris•HCl (pH 7.5). The fluorescence anisotropy of the TAMRA-labeled DNA was measured at an excitation wavelength of 533 nm and emission wavelength of 580 nm using an ISS PC-1 spectrofluorometer. Because the Kd for specific complexes at low ionic strength was lower than the detection limit of the fluorescence method, we measured the Kd at higher ionic strengths (150, 200, 250, 300, 350, and 400 mM KCl) and extrapolated to the Kd at 80 mM KCl under the assumption of a linear relationship between log[KCl] and logKd based on the counterion condensation theory.52,53
Determination of the rate constants for protein translocation:
Using the Levenberg-Marquardt algorithm of MATLAB, the rate constant ksl,N for sliding was determined from the length-dependent kapp data (Figure 7) via nonlinear least-squares fitting with Eqs. 7–13. The total numbers of binding sites, L for the probe DNA and M for the competitor DNA, were calculated as A – B + 1, where A is the total number of base pairs, and B is the number of base pairs covered by a protein molecule. Based on structural information,34,39 B = 9 was used. Based on the sequences of the probe DNA duplexes (Figure 4), m = 2 was used. The values of koff,N, and kit,N were determined from the Ctot-dependent kapp data (Figure 8) via nonlinear least-squares fitting with Eqs 7, 10, 11, 13, and 17–20. These calculations used ϕ = 2 and kon,N = koff,N / Kd,N. The MATLAB scripts for the ODE-based simulations of the target search kinetics and those for determination of the kinetic parameters via fitting to experimental data are available as the ‘TDSK’ (target DNA search kinetics) package upon request to the corresponding author.
Supplementary Material
Acknowledgments
We thank Dr. Wlodzimierz Bujalowski for helpful advice on the fluorescence experiments and Dr. Anatoly Kolomeisky for useful discussion and for providing us with the equations of the VK model (Eqs. 7–11) before publication. This study was supported by Grant 12BGIA8960032 from the American Heart Association (to J.I.) and in part by Grant CHE-1307344 from the National Science Foundation (to J.I.) as well as by a Pilot Project Grant from UTMB-NIEHS Center (which is supported by Grant P30 ES006676 from the National Institutes of Health).
Footnotes
Supplemental Information
Supplemental information can be found online at the website of the Journal of Molecular Biology.
References
- 1.Riggs AD, Bourgeois S & Cohn M (1970). The lac repressor-operator interaction. 3. Kinetic studies. J Mol Biol 53, 401–17. [DOI] [PubMed] [Google Scholar]
- 2.Bruinsma RF (2002). Physics of protein-DNA interaction. Physica a-Statistical Mechanics and Its Applications 313, 211–237. [Google Scholar]
- 3.Gorman J & Greene EC (2008). Visualizing one-dimensional diffusion of proteins along DNA. Nat Struct Mol Biol 15, 768–74. [DOI] [PubMed] [Google Scholar]
- 4.Halford SE (2009). An end to 40 years of mistakes in DNA-protein association kinetics? Biochem Soc Trans 37, 343–8. [DOI] [PubMed] [Google Scholar]
- 5.Halford SE & Marko JF (2004). How do site-specific DNA-binding proteins find their targets? Nucleic Acids Res 32, 3040–52. [DOI] [PMC free article] [PubMed] [Google Scholar]
- 6.Kolomeisky AB (2011). Physics of protein-DNA interactions: mechanisms of facilitated target search. Phys Chem Chem Phys 13, 2088–95. [DOI] [PubMed] [Google Scholar]
- 7.Mirny L, Slutsky M, Wunderlich Z, Tafvizi A, Leith J & Kosmrlj A (2009). How a protein searches for its site on DNA: the mechanism of facilitated diffusion. J Phys A: Math Theor 42, 401335. [Google Scholar]
- 8.Tafvizi A, Mirny LA & van Oijen AM (2011). Dancing on DNA: kinetic aspects of search processes on DNA. Chemphyschem 12, 1481–9. [DOI] [PMC free article] [PubMed] [Google Scholar]
- 9.von Hippel PH & Berg OG (1989). Facilitated target location in biological systems. J Biol Chem 264, 675–8. [PubMed] [Google Scholar]
- 10.Berg OG, Winter RB & von Hippel PH (1981). Diffusion-driven mechanisms of protein translocation on nucleic acids. 1. Models and theory. Biochemistry 20, 6929–48. [DOI] [PubMed] [Google Scholar]
- 11.Blainey PC, Luo G, Kou SC, Mangel WF, Verdine GL, Bagchi B & Xie XS (2009). Nonspecifically bound proteins spin while diffusing along DNA. Nat Struct Mol Biol 16, 1224–9. [DOI] [PMC free article] [PubMed] [Google Scholar]
- 12.Blainey PC, van Oijen AM, Banerjee A, Verdine GL & Xie XS (2006). A base-excision DNA-repair protein finds intrahelical lesion bases by fast sliding in contact with DNA. Proc Natl Acad Sci U S A 103, 5752–7. [DOI] [PMC free article] [PubMed] [Google Scholar]
- 13.Finkelstein IJ, Visnapuu ML & Greene EC (2010). Single-molecule imaging reveals mechanisms of protein disruption by a DNA translocase. Nature 468, 983–7. [DOI] [PMC free article] [PubMed] [Google Scholar]
- 14.Gorman J, Wang F, Redding S, Plys AJ, Fazio T, Wind S, Alani EE & Greene EC (2012). Single-molecule imaging reveals target-search mechanisms during DNA mismatch repair. Proc Natl Acad Sci U S A 109, E3074–83. [DOI] [PMC free article] [PubMed] [Google Scholar]
- 15.Hammar P, Leroy P, Mahmutovic A, Marklund EG, Berg OG & Elf J (2012). The lac repressor displays facilitated diffusion in living cells. Science 336, 1595–8. [DOI] [PubMed] [Google Scholar]
- 16.Leith JS, Tafvizi A, Huang F, Uspal WE, Doyle PS, Fersht AR, Mirny LA & van Oijen AM (2012). Sequence-dependent sliding kinetics of p53. Proc Natl Acad Sci U S A 109, 16552–7. [DOI] [PMC free article] [PubMed] [Google Scholar]
- 17.Tafvizi A, Huang F, Fersht AR, Mirny LA & van Oijen AM (2011). A single-molecule characterization of p53 search on DNA. Proc Natl Acad Sci U S A 108, 563–8. [DOI] [PMC free article] [PubMed] [Google Scholar]
- 18.Gowers DM, Wilson GG & Halford SE (2005). Measurement of the contributions of 1D and 3D pathways to the translocation of a protein along DNA. Proc Natl Acad Sci U S A 102, 15883–8. [DOI] [PMC free article] [PubMed] [Google Scholar]
- 19.Jack WE, Terry BJ & Modrich P (1982). Involvement of outside DNA sequences in the major kinetic path by which EcoRI endonuclease locates and leaves its recognition sequence. Proc Natl Acad Sci U S A 79, 4010–4. [DOI] [PMC free article] [PubMed] [Google Scholar]
- 20.Kim JG, Takeda Y, Matthews BW & Anderson WF (1987). Kinetic studies on Cro repressor-operator DNA interaction. J Mol Biol 196, 149–58. [DOI] [PubMed] [Google Scholar]
- 21.Porecha RH & Stivers JT (2008). Uracil DNA glycosylase uses DNA hopping and short-range sliding to trap extrahelical uracils. Proc Natl Acad Sci U S A 105, 10791–6. [DOI] [PMC free article] [PubMed] [Google Scholar]
- 22.Rau DC & Sidorova NY (2010). Diffusion of the restriction nuclease EcoRI along DNA. J Mol Biol 395, 408–16. [DOI] [PMC free article] [PubMed] [Google Scholar]
- 23.Schonhoft JD & Stivers JT (2012). Timing facilitated site transfer of an enzyme on DNA. Nat Chem Biol 8, 205–10. [DOI] [PMC free article] [PubMed] [Google Scholar]
- 24.Stanford NP, Szczelkun MD, Marko JF & Halford SE (2000). One- and three-dimensional pathways for proteins to reach specific DNA sites. EMBO J 19, 6546–57. [DOI] [PMC free article] [PubMed] [Google Scholar]
- 25.Winter RB, Berg OG & von Hippel PH (1981). Diffusion-driven mechanisms of protein translocation on nucleic acids. 3. The Escherichia coli lac repressor--operator interaction: kinetic measurements and conclusions. Biochemistry 20, 6961–77. [DOI] [PubMed] [Google Scholar]
- 26.Doucleff M & Clore GM (2008). Global jumping and domain-specific intersegment transfer between DNA cognate sites of the multidomain transcription factor Oct-1. Proc Natl Acad Sci U S A 105, 13871–6. [DOI] [PMC free article] [PubMed] [Google Scholar]
- 27.Fried MG & Crothers DM (1984). Kinetics and mechanism in the reaction of gene regulatory proteins with DNA. J Mol Biol 172, 263–82. [DOI] [PubMed] [Google Scholar]
- 28.Iwahara J & Clore GM (2006). Direct observation of enhanced translocation of a homeodomain between DNA cognate sites by NMR exchange spectroscopy. J Am Chem Soc 128, 404–5. [DOI] [PubMed] [Google Scholar]
- 29.Iwahara J, Zweckstetter M & Clore GM (2006). NMR structural and kinetic characterization of a homeodomain diffusing and hopping on nonspecific DNA. Proc Natl Acad Sci U S A 103, 15062–7. [DOI] [PMC free article] [PubMed] [Google Scholar]
- 30.Lieberman BA & Nordeen SK (1997). DNA intersegment transfer, how steroid receptors search for a target site. J Biol Chem 272, 1061–8. [DOI] [PubMed] [Google Scholar]
- 31.Sahu D, Clore GM & Iwahara J (2007). TROSY-based z-Exchange Spectroscopy: Application to the determination of the activation energy for intermolecular protein translocation between specific sites on different DNA molecules. J Am Chem Soc 129, 13232–13237. [DOI] [PubMed] [Google Scholar]
- 32.Sidorova NY, Scott T & Rau DC (2013). DNA concentration-dependent dissociation of EcoRI: direct transfer or reaction during hopping. Biophys J 104, 1296–303. [DOI] [PMC free article] [PubMed] [Google Scholar]
- 33.Takayama Y & Clore GM (2012). Interplay between minor and major groove-binding transcription factors Sox2 and Oct1 in translocation on DNA studied by paramagnetic and diamagnetic NMR. J Biol Chem 287, 14349–63. [DOI] [PMC free article] [PubMed] [Google Scholar]
- 34.Zandarashvili L, Vuzman D, Esadze A, Takayama Y, Sahu D, Levy Y & Iwahara J (2012). Asymmetrical roles of zinc fingers in dynamic DNA-scanning process by the inducible transcription factor Egr-1. Proc Natl Acad Sci U S A 109, E1724–32. [DOI] [PMC free article] [PubMed] [Google Scholar]
- 35.Bozon B, Davis S & Laroche S (2003). A requirement for the immediate early gene zif268 in reconsolidation of recognition memory after retrieval. Neuron 40, 695–701. [DOI] [PubMed] [Google Scholar]
- 36.Lee JL, Everitt BJ & Thomas KL (2004). Independent cellular processes for hippocampal memory consolidation and reconsolidation. Science 304, 839–43. [DOI] [PubMed] [Google Scholar]
- 37.Khachigian LM, Lindner V, Williams AJ & Collins T (1996). Egr-1-induced endothelial gene expression: a common theme in vascular injury. Science 271, 1427–31. [DOI] [PubMed] [Google Scholar]
- 38.Yan SF, Fujita T, Lu J, Okada K, Shan Zou Y, Mackman N, Pinsky DJ & Stern DM (2000). Egr-1, a master switch coordinating upregulation of divergent gene families underlying ischemic stress. Nat Med 6, 1355–61. [DOI] [PubMed] [Google Scholar]
- 39.Pavletich NP & Pabo CO (1991). Zinc finger-DNA recognition: crystal structure of a Zif268-DNA complex at 2.1 Å. Science 252, 809–17. [DOI] [PubMed] [Google Scholar]
- 40.Pollard TD & De La Cruz EM (2013). Take advantage of time in your experiments: a guide to simple, informative kinetics assays. Mol Biol Cell 24, 1103–10. [DOI] [PMC free article] [PubMed] [Google Scholar]
- 41.Bresloff JL & Crothers DM (1975). DNA-ethidium reaction kinetics: demonstration of direct ligand transfer between DNA binding sites. J Mol Biol 95, 103–23. [DOI] [PubMed] [Google Scholar]
- 42.Takayama Y, Sahu D & Iwahara J (2010). NMR studies of translocation of the Zif268 protein between its target DNA Sites. Biochemistry 49, 7998–8005. [DOI] [PubMed] [Google Scholar]
- 43.Veksler A & Kolomeisky AB (2013). Speed-Selectivity Paradox in the Protein Search for Targets on DNA: Is It Real or Not? J Phys Chem B. [DOI] [PubMed]
- 44.Iwahara J, Schwieters CD & Clore GM (2004). Characterization of nonspecific protein-DNA interactions by 1H paramagnetic relaxation enhancement. J Am Chem Soc 126, 12800–8. [DOI] [PubMed] [Google Scholar]
- 45.Kalodimos CG, Biris N, Bonvin AM, Levandoski MM, Guennuegues M, Boelens R & Kaptein R (2004). Structure and flexibility adaptation in nonspecific and specific protein-DNA complexes. Science 305, 386–9. [DOI] [PubMed] [Google Scholar]
- 46.Takayama Y & Clore GM (2011). Intra- and intermolecular translocation of the bi-domain transcription factor Oct1 characterized by liquid crystal and paramagnetic NMR. Proc Natl Acad Sci U S A 108, E169–76. [DOI] [PMC free article] [PubMed] [Google Scholar]
- 47.Hu T, Grosberg AY & Shklovskii BI (2006). How proteins search for their specific sites on DNA: the role of DNA conformation. Biophys J 90, 2731–44. [DOI] [PMC free article] [PubMed] [Google Scholar]
- 48.Berg OG & Ehrenberg M (1982). Association kinetics with coupled three- and one-dimensional diffusion. Chain-length dependence of the association rate of specific DNA sites. Biophys Chem 15, 41–51. [DOI] [PubMed] [Google Scholar]
- 49.Terry BJ, Jack WE & Modrich P (1985). Facilitated diffusion during catalysis by EcoRI endonuclease. Nonspecific interactions in EcoRI catalysis. J Biol Chem 260, 13130–7. [PubMed] [Google Scholar]
- 50.Zhou HX (2005). A model for the mediation of processivity of DNA-targeting proteins by nonspecific binding: dependence on DNA length and presence of obstacles. Biophys J 88, 1608–15. [DOI] [PMC free article] [PubMed] [Google Scholar]
- 51.Lin SY & Riggs AD (1972). Lac repressor binding to non-operator DNA: detailed studies and a comparison of eequilibrium and rate competition methods. J Mol Biol 72, 671–90. [DOI] [PubMed] [Google Scholar]
- 52.Manning GS (1978). Molecular Theory of Polyelectrolyte Solutions with Applications to Electrostatic Properties of Polynucleotides. Q Rev Biophys 11, 179–246. [DOI] [PubMed] [Google Scholar]
- 53.Record MT, Anderson CF & Lohman TM (1978). Thermodynamic Analysis of Ion Effects on Binding and Conformational Equilibria of Proteins and Nucleic-Acids - Roles of Ion Association or Release, Screening, and Ion Effects on Water Activity. Q Rev Biophys 11, 103–178. [DOI] [PubMed] [Google Scholar]
- 54.Anderson BJ, Larkin C, Guja K & Schildbach JF (2008). Using fluorophore-labeled oligonucleotides to measure affinities of protein-DNA interactions. Methods Enzymol 450, 253–72. [DOI] [PMC free article] [PubMed] [Google Scholar]
- 55.Lakowicz JR (2006). Principles of fluorescence spectroscopy. 3 edit, Springer, New York. [Google Scholar]
- 56.Iwahara J & Clore GM (2006). Detecting transient intermediates in macromolecular binding by paramagnetic NMR. Nature 440, 1227–30. [DOI] [PubMed] [Google Scholar]
- 57.Vuzman D, Azia A & Levy Y (2010). Searching DNA via a “Monkey Bar” mechanism: the significance of disordered tails. J Mol Biol 396, 674–84. [DOI] [PubMed] [Google Scholar]
- 58.Vuzman D & Levy Y (2010). DNA search efficiency is modulated by charge composition and distribution in the intrinsically disordered tail. Proc Natl Acad Sci U S A 107, 21004–9. [DOI] [PMC free article] [PubMed] [Google Scholar]
- 59.Vuzman D, Polonsky M & Levy Y (2010). Facilitated DNA search by multidomain transcription factors: cross talk via a flexible linker. Biophys J 99, 1202–11. [DOI] [PMC free article] [PubMed] [Google Scholar]
- 60.Iwahara J & Levy Y (2013). Speed-stability paradox in DNA-scanning by zinc-finger proteins. Transcription 4, 58–61. [DOI] [PMC free article] [PubMed] [Google Scholar]
- 61.Lewin B (2000). Genes VII, Oxford Univ Press, Oxford. [Google Scholar]
- 62.Luger K, Mader AW, Richmond RK, Sargent DF & Richmond TJ (1997). Crystal structure of the nucleosome core particle at 2.8 Å resolution. Nature 389, 251–60. [DOI] [PubMed] [Google Scholar]
- 63.Tafvizi A, Huang F, Leith JS, Fersht AR, Mirny LA & van Oijen AM (2008). Tumor suppressor p53 slides on DNA with low friction and high stability. Biophys J 95, L01–3. [DOI] [PMC free article] [PubMed] [Google Scholar]
- 64.Bonnet I, Biebricher A, Porte PL, Loverdo C, Benichou O, Voituriez R, Escude C, Wende W, Pingoud A & Desbiolles P (2008). Sliding and jumping of single EcoRV restriction enzymes on non-cognate DNA. Nucleic Acids Res 36, 4118–27. [DOI] [PMC free article] [PubMed] [Google Scholar]
Associated Data
This section collects any data citations, data availability statements, or supplementary materials included in this article.