

Abstract
Single-cell transcriptomics provide a systematic map of gene expression in different human cell types. The next challenge is to systematically understand cell-type specific gene function. The integration of CRISPR-based functional genomics and stem cell technology enables the scalable interrogation of gene function in differentiated human cells. Here, we present the first genome-wide CRISPR interference and CRISPR activation screens in human neurons.
We uncover pathways controlling neuronal response to chronic oxidative stress, which is implicated in neurodegenerative diseases. Unexpectedly, knockdown of the lysosomal protein prosaposin strongly sensitizes neurons, but not other cell types, to oxidative stress by triggering the formation of lipofuscin, a hallmark of aging, which traps iron, generating reactive oxygen species and triggering ferroptosis. We also determine transcriptomic changes in neurons following perturbation of genes linked to neurodegenerative diseases. To enable the systematic comparison of gene function across different human cell types, we establish a data commons named CRISPRbrain.
The human body comprises hundreds of different cell types. Even though their genomes are nearly identical, cell types are characterized by vastly different cell biologies, enabling them to fulfill diverse physiological functions. Transcriptomic profiling, fueled by recent advances in single-cell- and single-nucleus-RNA sequencing technologies, has enabled the establishment of a Human Cell Atlas of cell-type specific gene expression signatures1. In addition to gene expression, gene function can also be cell type-specific, as evidenced by the fact that mutations in broadly expressed or housekeeping genes can lead to cell-type specific defects and disease states. Striking examples are familial mutations causing neurodegenerative diseases, such as hereditary motor and sensory neuropathies (Charcot-Marie-Tooth disease), which can be caused by mutations in ubiquitously expressed trafficking factors (RAB7A, DNM2, DYNC1H1), or aminoacyl-tRNA synthetases (AARS, GARS, HARS, MARS)2.Moreover, neurodegenerative diseases are often characterized by the selective vulnerability of specific neuronal subtypes, even if the mutated gene is expressed throughout the brain or even throughout the whole body. Cell-type specific gene function is also supported by our recent finding that knockdown of certain genes can have remarkably different impacts on cell survival and gene expression in different isogenic human cell types, including stem cells and neurons3.
Therefore, understanding the function of human genes in different cell types is the next step toward elucidating tissue-specific cell biology and uncovering disease mechanisms. To this end, we recently developed a functional genomics platform, leveraging the strengths of CRISPR interference (CRISPRi) and induced pluripotent stem cell (iPSC) technology, that enables large-scale, multimodal loss-of-function genetic screens in differentiated human cell types, as demonstrated in neurons3.
Here, we present a gain-of-function screening platform in human iPSC-derived neurons based on CRISPR activation (CRISPRa), which can yield complementary biological insights to CRISPRi screens4. Together, CRISPRi and CRISPRa in iPSC-derived neurons have enormous potential to uncover mechanisms and therapeutic targets in neurological diseases5. We conduct the first genome-wide CRISPRi and CRISPRa screens in human neurons based on a panel of cellular phenotypes, and CROP-seq screens to uncover transcriptional fingerprints of genes associated with neurodegenerative diseases. We apply our functional genomics platforms to systematically identify genetic modifiers of levels of reactive oxygen species and peroxidized lipids, and neuronal survival under oxidative stress, one of the predominant stresses in aging6 and neurodegenerative diseases7. These screens uncovered an unexpected role for the lysosomal protein prosaposin (PSAP), knockdown of which caused the formation of lipofuscin, a hallmark of aging, which traps iron, generating reactive oxygen species and triggering ferroptosis. Intriguingly, PSAP deficiency caused these dramatic phenotypes only in neurons, but not in iPSCs or HEK293 cells.
These results demonstrate the power of our approach in uncovering novel, cell-type specific human cell biology. We establish a Data Commons, named CRISPRbrain, for systematic exploration, interactive visualization, and comparison of functional genomics screening results in differentiated human cell types.
Results
Genome-wide CRISPRi and CRISPRa screens reveal genes controlling survival of human neurons
We previously established a CRISPRi platform that enables robust knockdown of endogenous genes and large-scale loss-of-function genetic screens in human iPSC-derived neurons3. Here, we expand our toolbox by establishing a CRISPRa platform for overexpression of endogenous genes and genome-wide gain-of-function screens in human iPSC-derived neurons. We adapted a previously published inducible CRISPRa system, DHFR-dCas9-VPH, whose function had been validated in human iPSCs8. In this system, the CRISPRa machinery is tagged by a DHFR degron leading to proteasomal degradation of the entire fusion protein. Trimethoprim (TMP) stabilizes the DHFR degron and prevents turnover, thereby inducing CRISPRa activity. As for our CRISPRi platform, an expression cassette for the CRISPRa machinery, CAG promoter-driven DHFR-dCas9-VPH, was stably integrated into the CLYBL safe-harbor locus of an iPSC line with an inducible Neurogenin 2 (Ngn2) expression cassette in the AAVS1 safe-harbor locus, which can be efficiently differentiated into homogenous glutamatergic neurons in a highly scalable manner9 (i3N-iPSC, Fig. 1a). A monoclonal line of these CRISPRa-iPSCs was generated and a normal karyotype was confirmed (Extended Data Fig. 1a). We validated the functionality of CRISPRa-iPSCs by confirming robust induction of an endogenous gene, CXCR4, in iPSC-derived neurons in a tightly inducible manner (Fig. 1b). CRISPRi and CRISPRa efficacies were comparable between iPSCs and derived neurons (Extended Data Fig. 1b,c).
Fig. 1: Genome-wide CRISPRi and CRISPRa screens in human iPSC-derived neurons identify regulators of neuronal survival.
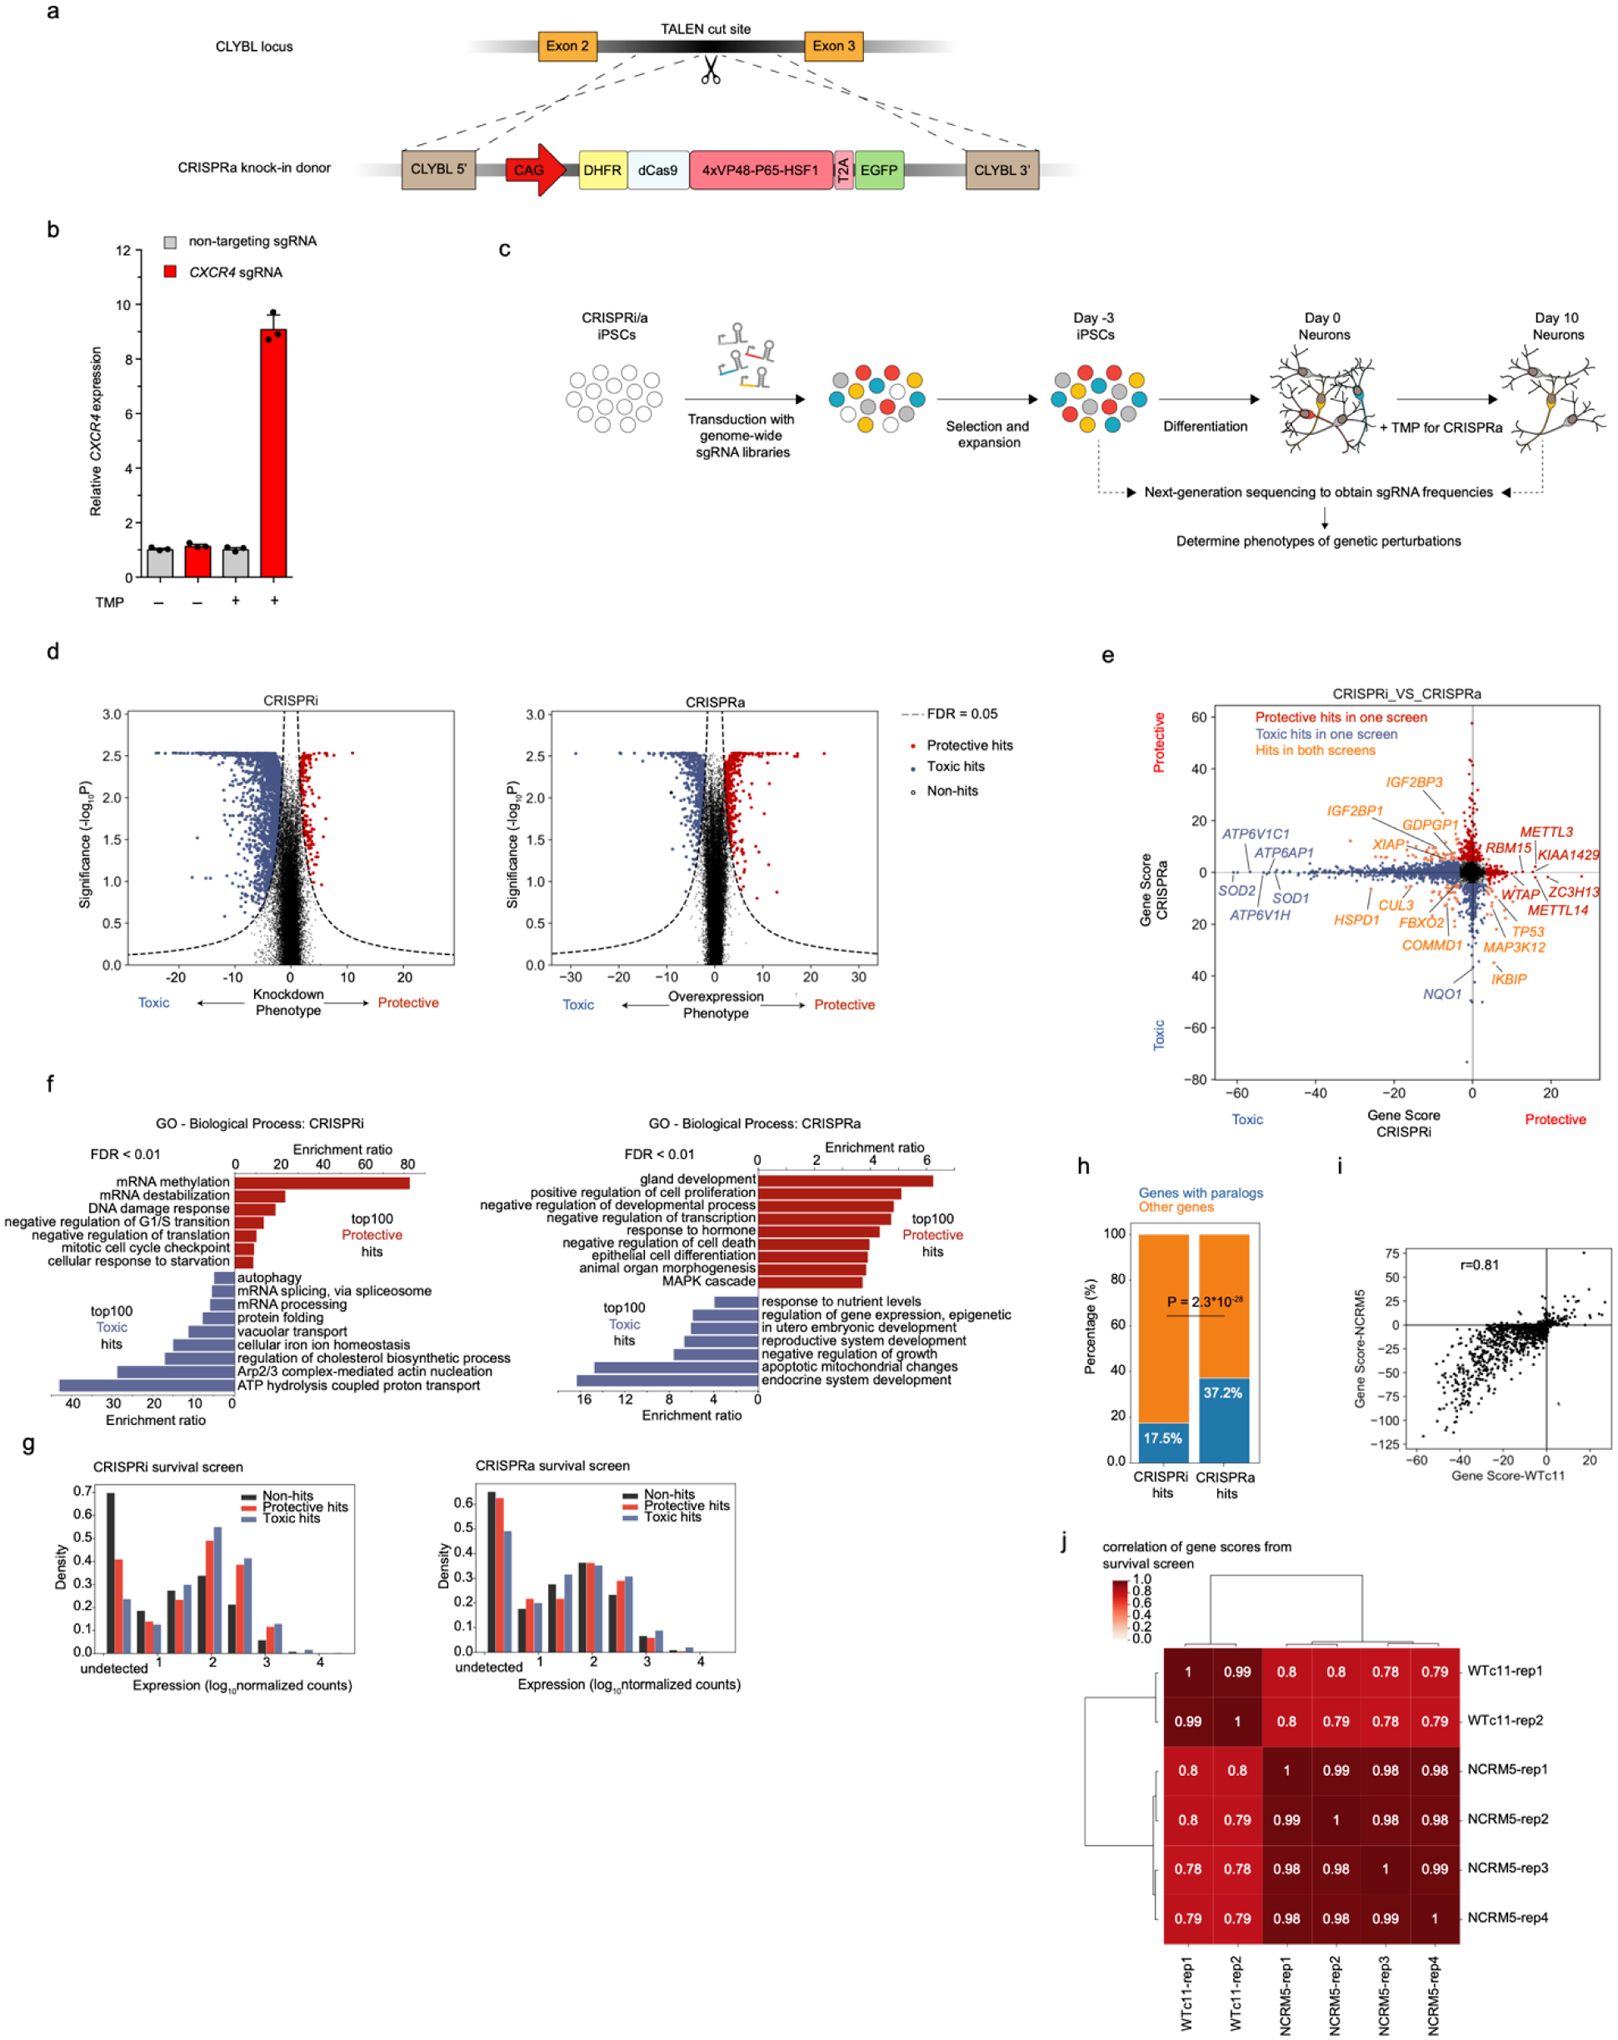
(a) Strategy for generating the CRISPRa iPSC line: an inducible CRISPRa construct, CAG promoter-driven DHFR-dCas9-VPH, was stably integrated into the CLYBL safe harbor locus through TALEN-mediated knock-in. dCas9, catalytically dead Cas9. VPH, activator domains containing 4X repeats of VP48, P65, and HSF1.
(b) Functional validation of CRISPRa activity. qPCR quantification of the relative fold change of CXCR4 mRNA levels in CRISPRa-neurons expressing a CXCR4 sgRNA as compared to a non-targeting control sgRNA in the presence or absence of trimethoprim (TMP), which stabilizes the DHFR degron (mean +/− sd, n = 3 technical replicates). CXCR4 levels were normalized to the housekeeping gene ACTB.
(c) Strategy for neuronal survival screens. CRISPRi/a iPSCs were transduced with genome-wide sgRNA libraries, containing ~100,000 sgRNAs targeting ~19,000 protein-coding genes and ~1,800 non-targeting control sgRNAs. TMP was added to CRISPRa neurons from Day 0 to induce CRISPRa activity. Frequencies of cells expressing a given sgRNA were determined by next-generation sequencing for Day 10 neurons and Day −3 iPSCs.
(d) Volcano plots summarizing knockdown or overexpression phenotypes and statistical significance (Mann-Whitney U test) for genes targeted in the CRISPRi (left) and CRISPRa (right) screens. Dashed lines: False-discovery rate (FDR) cutoff for hit genes (FDR = 0.05) based on the Gene Score, see main text and Methods)
(e) Comparing Gene Scores for hits from CRISPRi and CRISPRa screens. Hit genes with protective or toxic phenotypes in either screen are shown in red or blue, respectively. Genes that are hits in both screens are shown in orange.
(f) Gene Ontology (GO) term enrichment analysis for the top 100 hit genes with protective or toxic phenotypes in CRISPRi (left) and CRISPRa (right) survival screens. Significantly enriched Biological Process terms (FDR < 0.01) are shown.
(g) Expression levels of hit genes and non-hit genes from CRISPRi (left) or CRISPRa (right) screens are shown, binned by order of magnitude.
(h) Percentage of hits with paralogs in CRISPRi and CRISPRa survival screens. A list of human paralog genes was obtained from a previous study16. P value was calculated using Fisher’s exact test.
(i) Comparison of Gene Scores from survival screens in neurons derived from two different CRISPRi-iPSC lines, WTc11 (x-axis) and NCRM5 (y-axis), using a custom sgRNA library targeting 2,131 hit genes from the primary CRISPRi screen in WTc11. The Pearson correlation coefficient (r) is indicated.
(j) Pairwise Pearson correlation of Gene Scores between biological replicates of survival screens in neurons derived from WTc11 and NCRM5 lines.
We previously conducted a sub-genome scale CRISPRi screen to reveal genes controlling neuronal survival using an sgRNA library targeting 2,325 genes representing the “druggable genome”3. Here, we greatly expanded the screen to target all protein-coding human genes in both loss-of- and gain-of-function screens by CRISPRi and CRISPRa, respectively. To our knowledge, these are the first genome-wide CRISPR screens in human neurons. We lentivirally transduced our CRISPRi and CRISPRa iPSCs with the genome-wide hCRISPRi/a-v2 sgRNA libraries10 and differentiated them into neurons (Fig. 1c). For the CRISPRa screen, TMP was added to Day 0 neurons to induce CRISPRa activity. Based on the depletion or enrichment of sgRNAs targeting specific genes at Day 10 compared to Day –3, we identified hit genes for which knockdown or overexpression was toxic or protective for neuronal survival (Fig. 1d, Supplementary Table 1), using our previously published pipeline, MAGeCK-iNC3 . For each gene, a Gene Score was calculated to capture both the effect size of the phenotype and the statistical significance (see Methods). For most hit genes, only a subset of the 5 sgRNAs targeting the gene had a significant phenotype (Extended Data Fig. 1d, e), justifying the use of 5 sgRNAs per gene in the genome-wide library. The likelihood of detecting hit genes was not related to the length of the gene or its coding sequence (Extended Data Fig. 1f,g).
For CRISPRi, among the top 10 hits with toxic knockdown phenotypes were genes encoding superoxide dismutases SOD1 and SOD2, which protect cells from oxidative stress (Fig. 1e). Intriguingly, SOD1 and SOD2 are not broadly essential in other human cell types, including pluripotent stem cells11–13 and cancer cells14, suggesting a selective vulnerability to oxidative stress of neurons. Genes encoding subunits of the vacuolar ATPase (V-ATPase) complex, including ATP6V1H, ATP6V1C1, and ATP6AP1, were also among the top hits with toxic knockdown phenotypes. The V-ATPase complex mediates acidification of the endo-lysosomal compartment through ATP hydrolysis-coupled proton transport, and its dysfunction can cause neurodegenerative diseases15. Gene Ontology (GO) analysis revealed additional pathways that were enriched in the top 100 hits with toxic or protective phenotypes in the CRISPRi screen (Fig. 1f, left). For example, genes involved in cholesterol biosynthesis were strongly enriched in hits with toxic knockdown phenotypes, suggesting an important role of cholesterol in maintaining neuronal survival, consistent with our previous findings3. Other homeostatic pathways, including iron homeostasis, protein folding, mRNA processing, and autophagy, were also essential for neuronal survival.
For CRISPRa, GO analysis revealed that overexpression of pro- or anti-apoptotic genes showed expected toxic or protective survival phenotypes, respectively, validating our approach (Fig. 1f, right). Next, we compared hits from our CRISPRi and CRISPRa screens (Fig. 1e). Overall, there was little overlap between CRISPRi and CRISPRa hits, consistent with our previous study comparing parallel CRISPRi and CRISPRa screens in K562 cells4. The fact that CRISPRi and CRISPRa screens uncover distinct sets of hit genes can be explained by several factors. First, a gene that is not expressed in neurons will not have a CRISPRi knockdown phenotype, but may have a CRISPRa overexpression phenotype. Indeed, genes expressed at low or undetectable levels were strongly depleted from CRISPRi hits (Fig. 1g, left), whereas CRISPRa hits were not restricted by endogenous expression levels (Fig. 1g, right). Second, many genes encode proteins that form complexes (such as the V-ATPase complex), for which knockdown of a single component could abrogate the function of the entire complex and result in a phenotype, whereas overexpression of a single subunit by CRISPRa would generally be insufficient to induce an increased function of the complex. Last, knockdown of a single gene may not lead to a phenotype due to redundancy. For example, gene paralogs can compensate for each other’s loss-of-function. Paralogs tend to have less deleterious loss-of-function effect in CRISPR-Cas9 screens in different human cell lines16. Consistent with this idea, the percentage of hit genes with paralogs was much lower in our CRISPRi screen compared to that in CRISPRa screen (17.5% (355 / 2032) vs. 37.2% (314 / 845), P < 0.00001, Fig. 1h). Taken together, CRISPRi and CRISPRa screens can uncover complementary biological insights.
Nevertheless, we identified a number of overlapping hit genes in the two screens (Fig. 1e). Many of these genes showed opposing phenotypes on neuronal survival upon CRISPRa induction and CRISPRi repression. Among these genes, we identified known regulators of apoptosis, such as TP53, IKBIP, and factors specifically of neuronal survival, such as XIAP17–20, GDPGP121 and MAP3K123,22–24, as well as genes not previously implicated in neuronal survival, such as IGF2BP1 and IGF2BP3.
For some genes, including several involved in protein homeostasis (e.g. CUL3, FBXO2, COMMD1, and HSPD1), perturbations in both directions were detrimental to neuronal survival (i.e. genes in the left lower quadrant of Fig. 1e), suggesting their endogenous expression levels are narrowly balanced for optimal survival.
While some CRISPRi and CRISPRa hits were also survival-relevant in other cell types based on previously reported screens, a substantial fraction of hits was neuron-specific (Extended Data Fig. 1h–j). Some CRISPRa hits were related to development of other cell types (Extended Data Fig. 1i), suggesting that ectopic expression of developmental factors affected cell type identity and thereby cell survival/proliferation, as previously observed in K562 cells4.
We confirmed the robustness of our screening platform by conducting focused CRISPRi screens using an sgRNA library targeting the top hits from the genome-wide screen in neurons derived from two distinct iPSC lines: WTc11 (used in the primary screen), and NCRM5. Phenotypes were highly correlated for neurons derived from these two lines (Fig. 1i). However, reproducibility between replicate screens using the same cell line was slightly higher than between screens in different lines (Fig. 1j), suggesting that some neuronal phenotypes depend on the genetic background.
Genome-wide CRISPRi/a screens elucidate pathways controlling neuronal response to oxidative stress
Given the unique vulnerability of neurons to redox imbalance-induced oxidative stress, which is often found in the brain of patients with neurodegenerative diseases25–29, we sought to apply our functional genomics toolkit to systematically identify factors that are important for redox homeostasis and oxidative stress response in human neurons. We performed screens based on two strategies.
First, we conducted genome-wide CRISPRi and CRISPRa screens to identify modifiers of neuronal survival under oxidative stress conditions (Fig. 2a). Standard neuronal culture medium contains a combination of antioxidants, including vitamin E, vitamin E acetate, superoxide dismutase, catalase, and glutathione. To create an environment of chronic low-level oxidative stress, we cultured neurons in medium lacking the above antioxidants (–AO medium). We reasoned that compared to acute harsh treatments to induce reactive oxygen species (ROS), such as adding H2O2 or rotenone, –AO medium provided a more physiologically relevant approximation of chronic oxidative stress.
Fig. 2: Genome-wide CRISPRi and CRISPRa screens in human iPSC-derived neurons identify regulators of oxidative stress survival and redox homeostasis.
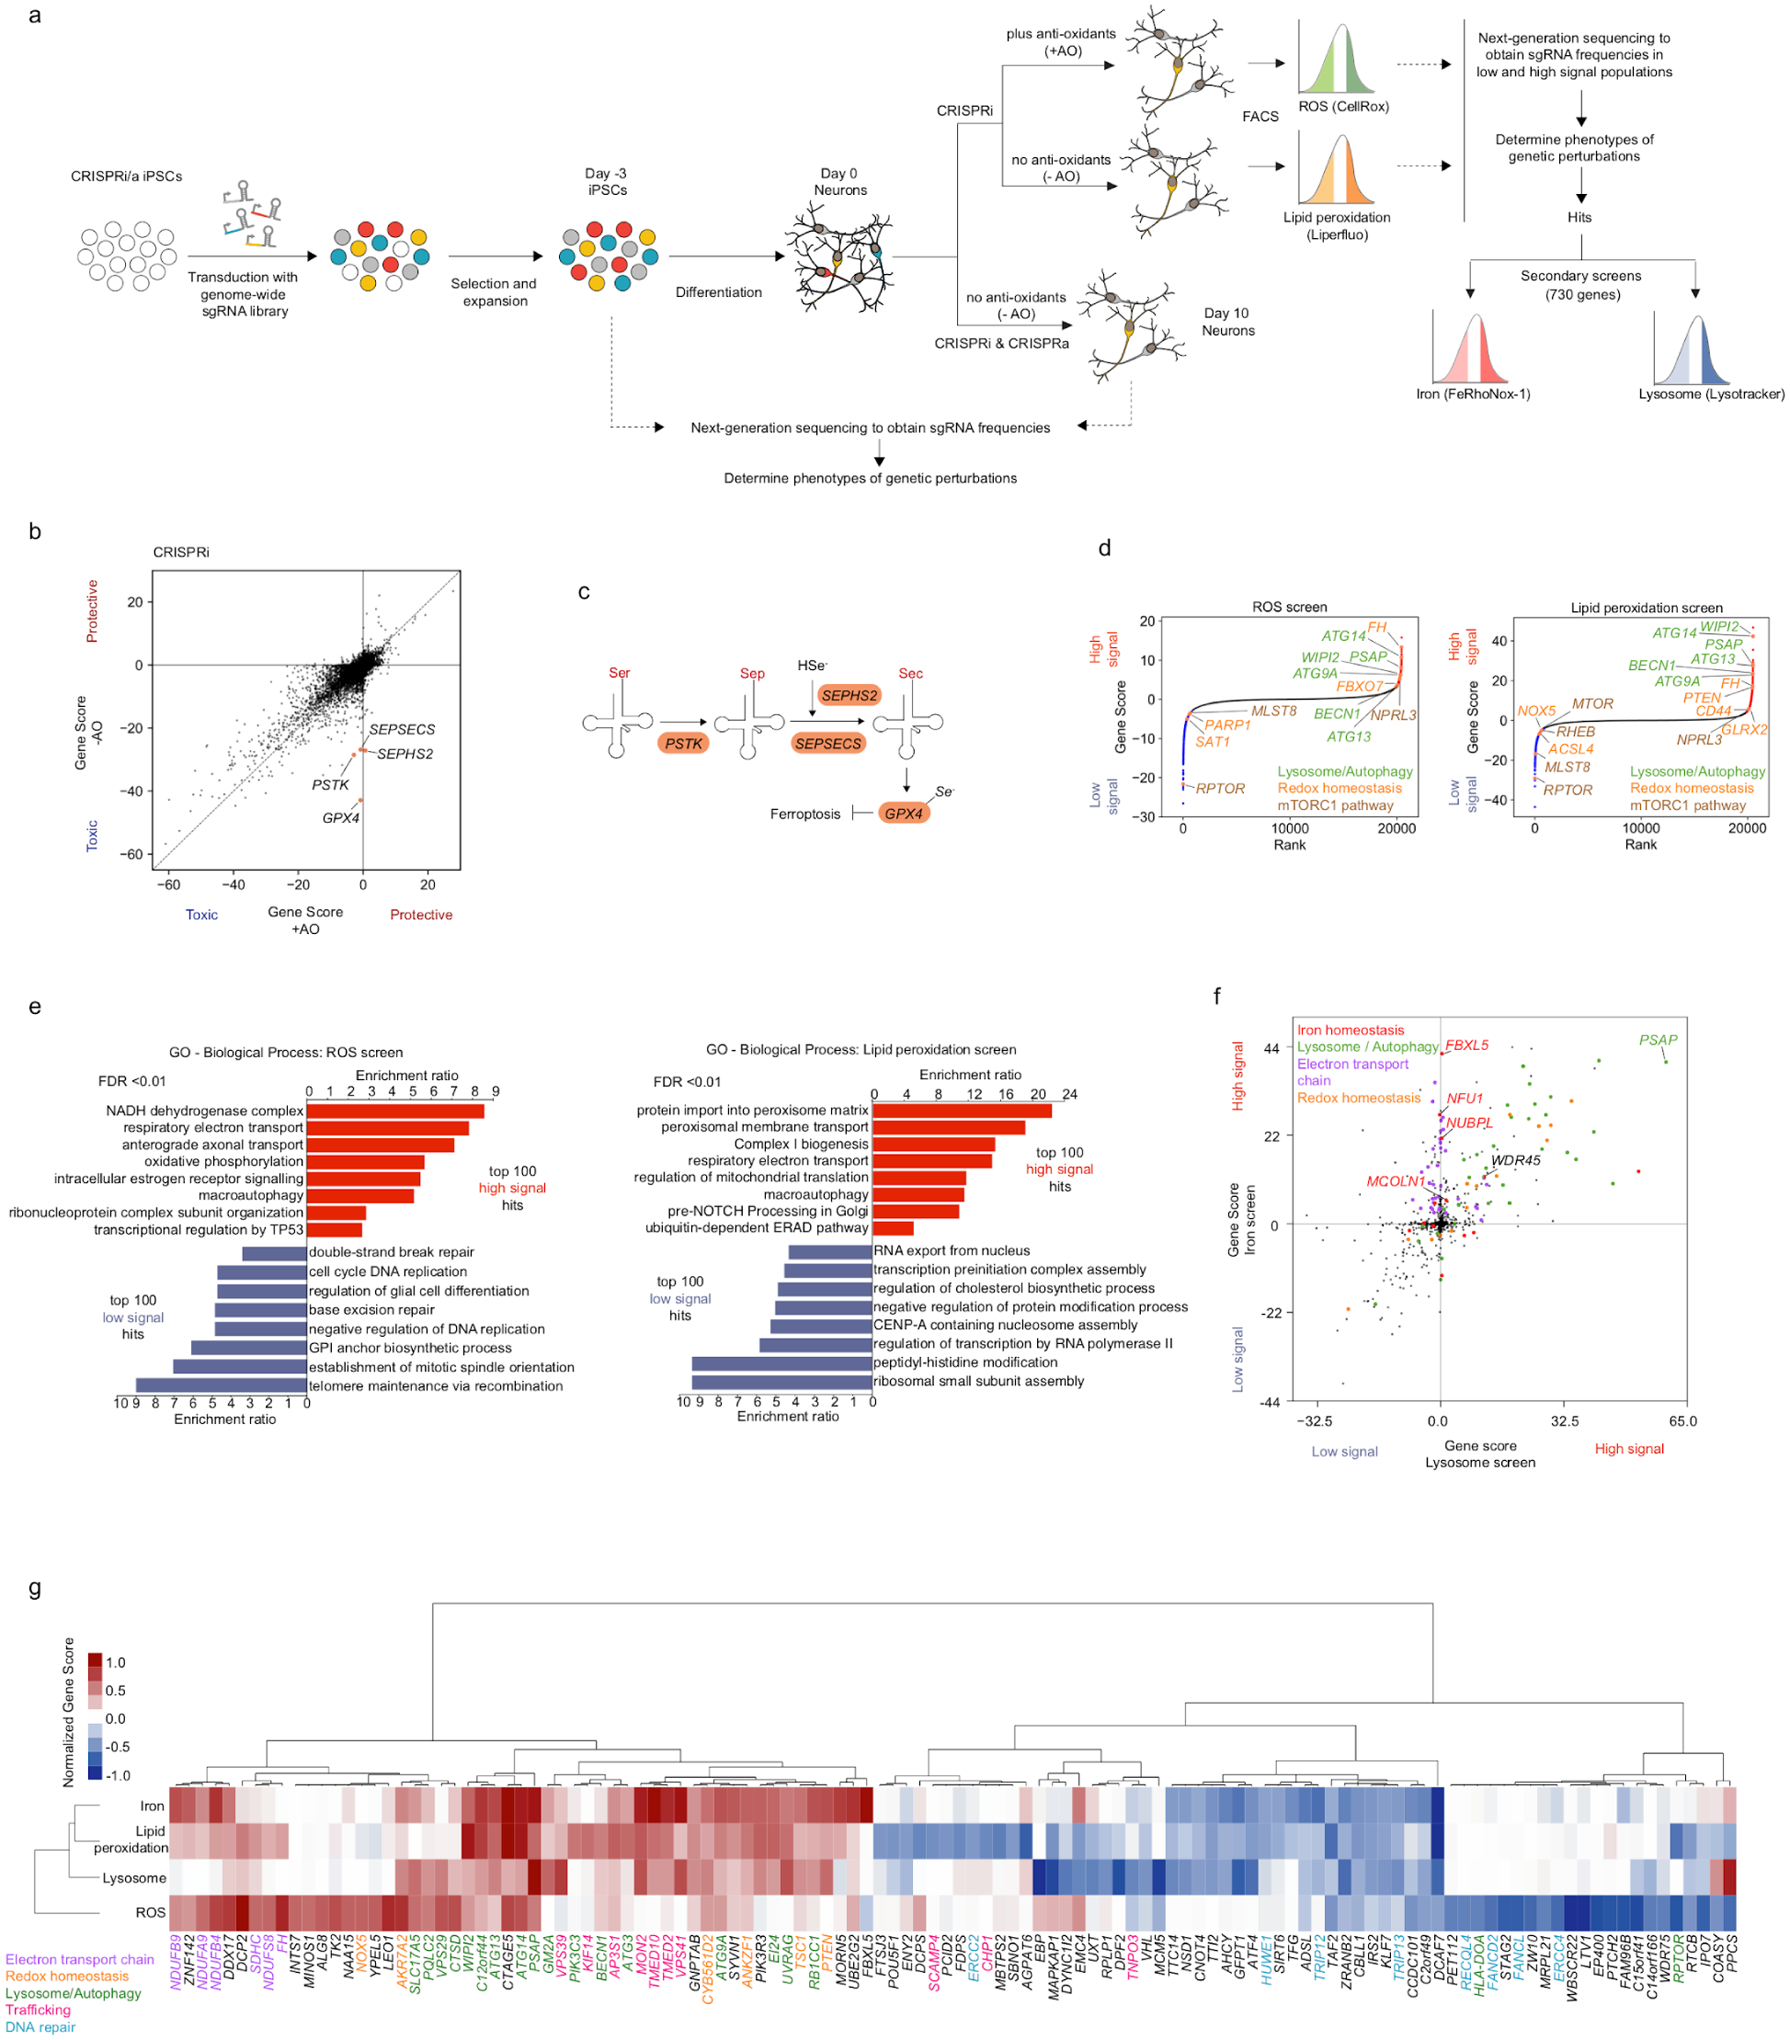
(a) Screening strategy. First, survival-based screens were conducted to identify modifiers of neuronal survival under mild oxidative stress induced by anti-oxidant (AO) removal from the neuronal medium (-AO). Second, FACS-based screens were conducted for modifiers of reactive oxygen species (ROS) and lipid peroxidation levels. Last, secondary screens for lysosomal status and labile iron levels were conducted to further characterize hit genes.
(b) Comparison of Gene Scores in +AO and -AO conditions for ~19,000 protein-coding genes targeted in genome-wide CRISPRi survival screens. See main text and Methods for the definition of the Gene score.
(c) Pathway for selenocysteine incorporation into GPX4. Hit genes are highlighted in orange.
(d) Ranked Gene Scores from the ROS screen and the lipid peroxidation screen. High-signal hits are shown in red and low signal hits in blue. Genes discussed in the paper are highlighted in orange.
(e) GO term enrichment analysis for the top 100 high-signal and low-signal hits in the ROS screen (left) and the lipid peroxidation screen (right). Significantly enriched Biological Process terms (false discovery rate (FDR) < 0.01) are shown.
(f) Gene Scores from the lysosome and iron secondary screens targeting 730 genes selected from the primary genome-wide screens. Genes are color-coded by pathways based on Gene Ontology (GO) annotation.
(g) Heatmap showing Gene Scores across screens (rows) for genes that are among the top 20 high-signal or low-signal hits in at least one screen (columns). Rows and columns are hierarchically clustered. Genes are color-coded by pathways based on GO annotation.
Next, we compared modifiers of neuronal survival in this oxidative stress condition to the modifiers of survival in the standard, unstressed condition (Fig. 2b, Supplementary Table 1). Interestingly, in the comparison of CRISPRi hits, we identified that GPX4 (encoding the selenoprotein Glutathione Peroxidase 4) and genes responsible for selenocysteine incorporation into proteins (including PSTK, SEPHS2, and SEPSECS) were particularly essential for neurons to survive under oxidative stress (Fig. 2b,c). GPX4 utilizes glutathione to reduce peroxidized lipids and thus prevents ferroptosis, which is a non-apoptotic type of cell death caused by iron-dependent lipid peroxidation30. This result suggested that neurons could be susceptible to ferroptosis under oxidative stress conditions. Hits from CRISPRa screens showed high correlation (R = 0.82) between oxidative stress and unstressed conditions, suggesting no strong stress-specific phenotypes for overexpressed genes (Extended Data Fig. 2).
Second, we conducted genome-wide CRISPRi screens for modifiers of levels of ROS and peroxidized lipids in neurons. Specifically, we stained CRISPRi neurons transduced with genome-wide sgRNA libraries with fluorescent indicators of ROS and lipid peroxidation (CellRox and Liperfluo, respectively) and sorted them into high and low fluorescence populations by FACS (Fig. 2a). The MAGeCK-iNC pipeline was used to identify hit genes knockdown of which led to an increase (‘high signal”) or decrease (‘low signal’) in ROS or peroxidized lipids (Supplementary Table 1). From these screens, we identified both known and unexpected genetic modifiers of ROS and peroxidized lipid levels. We found that knockdown of components of the electron transport chain increased both ROS and lipid peroxidation levels (Fig. 2d). This was expected because ROS are mainly generated by proton leak from the electron transport chain, and knockdown of electron transport chain components could increase proton leakage. Many autophagy-related genes were also common hits in the two screens (Fig. 2 d,e), such as WIPI2, ATG9A, ATG13, ATG14, and BECN1, suggesting an important role of autophagy in maintaining redox homeostasis in cells, as reported in previous studies31–33.
Disruption of genes involved in the mTORC1 pathway, including components of the mTORC1 complex (MTOR, RPTOR, and MLST8) or its activator RHEB reduced ROS and/or lipid peroxidation levels, whereas knockdown of NPRL3, a mTORC1 inhibitor, induced ROS and lipid peroxidation levels in neurons (Fig. 2d). This is consistent with previous observations that increasing mTORC1 signaling induced ROS production34, whereas inhibiting mTORC1 reduced ROS34–36. Moreover, GO term enrichment analysis of lipid peroxidation hits revealed a strong enrichment of peroxisomal genes, knockdown of which increased lipid peroxidation, consistent with the important roles of peroxisomes in redox regulation and degradation of (poly-)unsaturated fatty acids.
FBXO7, a gene associated with Parkinson’s disease, whose deficiency was found to cause complex I respiratory impairment and ROS production37, also increased ROS levels when knocked down in our screen (Fig. 2d). Knockdown of other previously characterized ROS regulators, including positive regulators such as PARP138, SAT139 and NOX540 and negative regulators such as PTEN41 and FH42,43 showed the expected effects on ROS and/or peroxidized lipid levels in our screens (Fig. 2d).
Interestingly, key regulators of ferroptosis were also hits in the lipid peroxidation screen. ACSL4, encoding Acyl-CoA Synthetase Long Chain Family Member 4, which enriches cellular membranes with long PUFAs is required for ferroptosis44,45. ACLS4 inhibition has been shown to prevent ferroptosis44, consistent with a reduction of peroxidized lipids upon knockdown in our screen (Fig. 2d). By contrast, knockdown of CD44, whose splicing variant CD44v stabilizes the cystine/glutamate antiporter xCT at the plasma membrane and increases cysteine uptake for GSH synthesis, thereby inhibiting ferroptosis46,47, increased lipid peroxidation in our screen as expected (Fig. 2d).
Surprisingly, we found several strong hit genes with lysosomal functions but not associated with autophagy (Fig. 1d). In particular, PSAP (encoding the lysosomal protein prosaposin) was one of the strongest hits in both ROS and lipid peroxidation screens (Fig. 2d).
To further investigate hit genes from the genome-wide ROS and lipid peroxidation screens in high-throughput, we conducted focused secondary screens with an sgRNA library targeting 730 hit genes (Fig. 2a). One secondary screen used lysotracker stain as a readout to uncover redox hits that may also alter lysosomal status. Lysotracker is a fluorescent acidotropic probe for labeling and tracking acidic organelles in live cells, which has been used to detect lysosome localization, quantify the number and sizes of lysosomes48,49 and to monitor autophagy50,51. The other secondary screen used the labile Fe2+-detecting probe FeRhoNox-1. Since intracellular labile ferrous iron (Fe2+) can contribute to ROS generation and lipid peroxidation via Fenton reactions52, we asked whether some of the redox hits act through changing iron homeostasis.
Our secondary screens uncovered that several of our original ROS/lipid peroxidation hit genes also strongly affected iron and/or lysosome status (Fig. 2f, Supplementary Tables 1, 2). We found that knockdown of many lysosome/autophagy-related genes affected both lysosomal status and iron levels, reflecting the key role of lysosomes in iron homeostasis53,54. Among these genes, we found WDR45, which is involved in autophagosome formation and lysosomal degradation and is also associated with Neurodegeneration with Brain Iron Accumulation (NBIA) in line with previous studies55,56. We also identified other known iron regulators for which knockdown increased iron levels, including FBXL5, a negative regulator of iron levels57, the Fe/S cluster biogenesis genes NFU1 and NUBPL, and MCOLN1, which encodes an endolysosomal iron release channel58 (Fig. 2f). Interestingly, knockdown of genes involved in the electron transport chain increased labile iron (Fig. 2f). Mitochondria are a major site of cellular iron storage and utilization in processes such as heme synthesis and iron-sulfur cluster biogenesis59. Disruption of the electron transport chain may lead to mitochondrial damage which can cause the subsequent release of labile iron and reduced iron utilization, thus increasing labile iron levels.
In summary, our screens for survival of oxidative stress and levels of ROS and peroxidized lipids uncovered many categories of known redox regulators, validating the sensitivity of our approach and supporting the notion that core mechanisms of redox regulation are conserved across different cell types. A substantial fraction of the hit genes were also modifiers of labile iron levels and/or lysosomal status (Fig. 2g).
Loss of prosaposin increases ROS and lipid peroxidation levels in neurons and causes neuronal ferroptosis under oxidative stress
Surprisingly, we identified that knockdown of PSAP altered lysosomal status and strongly induced ROS, lipid peroxidation, and iron levels when depleted (Fig. 2d,f,g). Given the screen phenotypes of PSAP, which were unexpected based on its known functions, and the association of PSAP variants not only with lysosomal storage disorders60–62 but also Parkinson’s Disease63, we decided to further investigate the underlying mechanisms of PSAP in neuronal redox regulation.
PSAP encodes prosaposin, which is a pro-protein that is proteolytically processed by cathepsin D (encoded by CTSD) in the lysosome to generate four cleavage products: saposins A, B, C, and D64. These four saposins, along with the lysosomal protein GM2A (GM2 Ganglioside Activator), function as activators for glycosphingolipid degradation by lysosomal hydrolases65 (Fig. 3a). Intriguingly, both CTSD and GM2A were also hits in at least one of the redox screens, showing similar knockdown phenotypes as PSAP (Fig. 3b). Together, these findings suggest an important and unexpected role for glycosphingolipid degradation in redox homeostasis.
Fig. 3: Loss of prosaposin induces ROS and lipid peroxidation in neurons and causes neuronal ferroptosis in the absence of antioxidants.
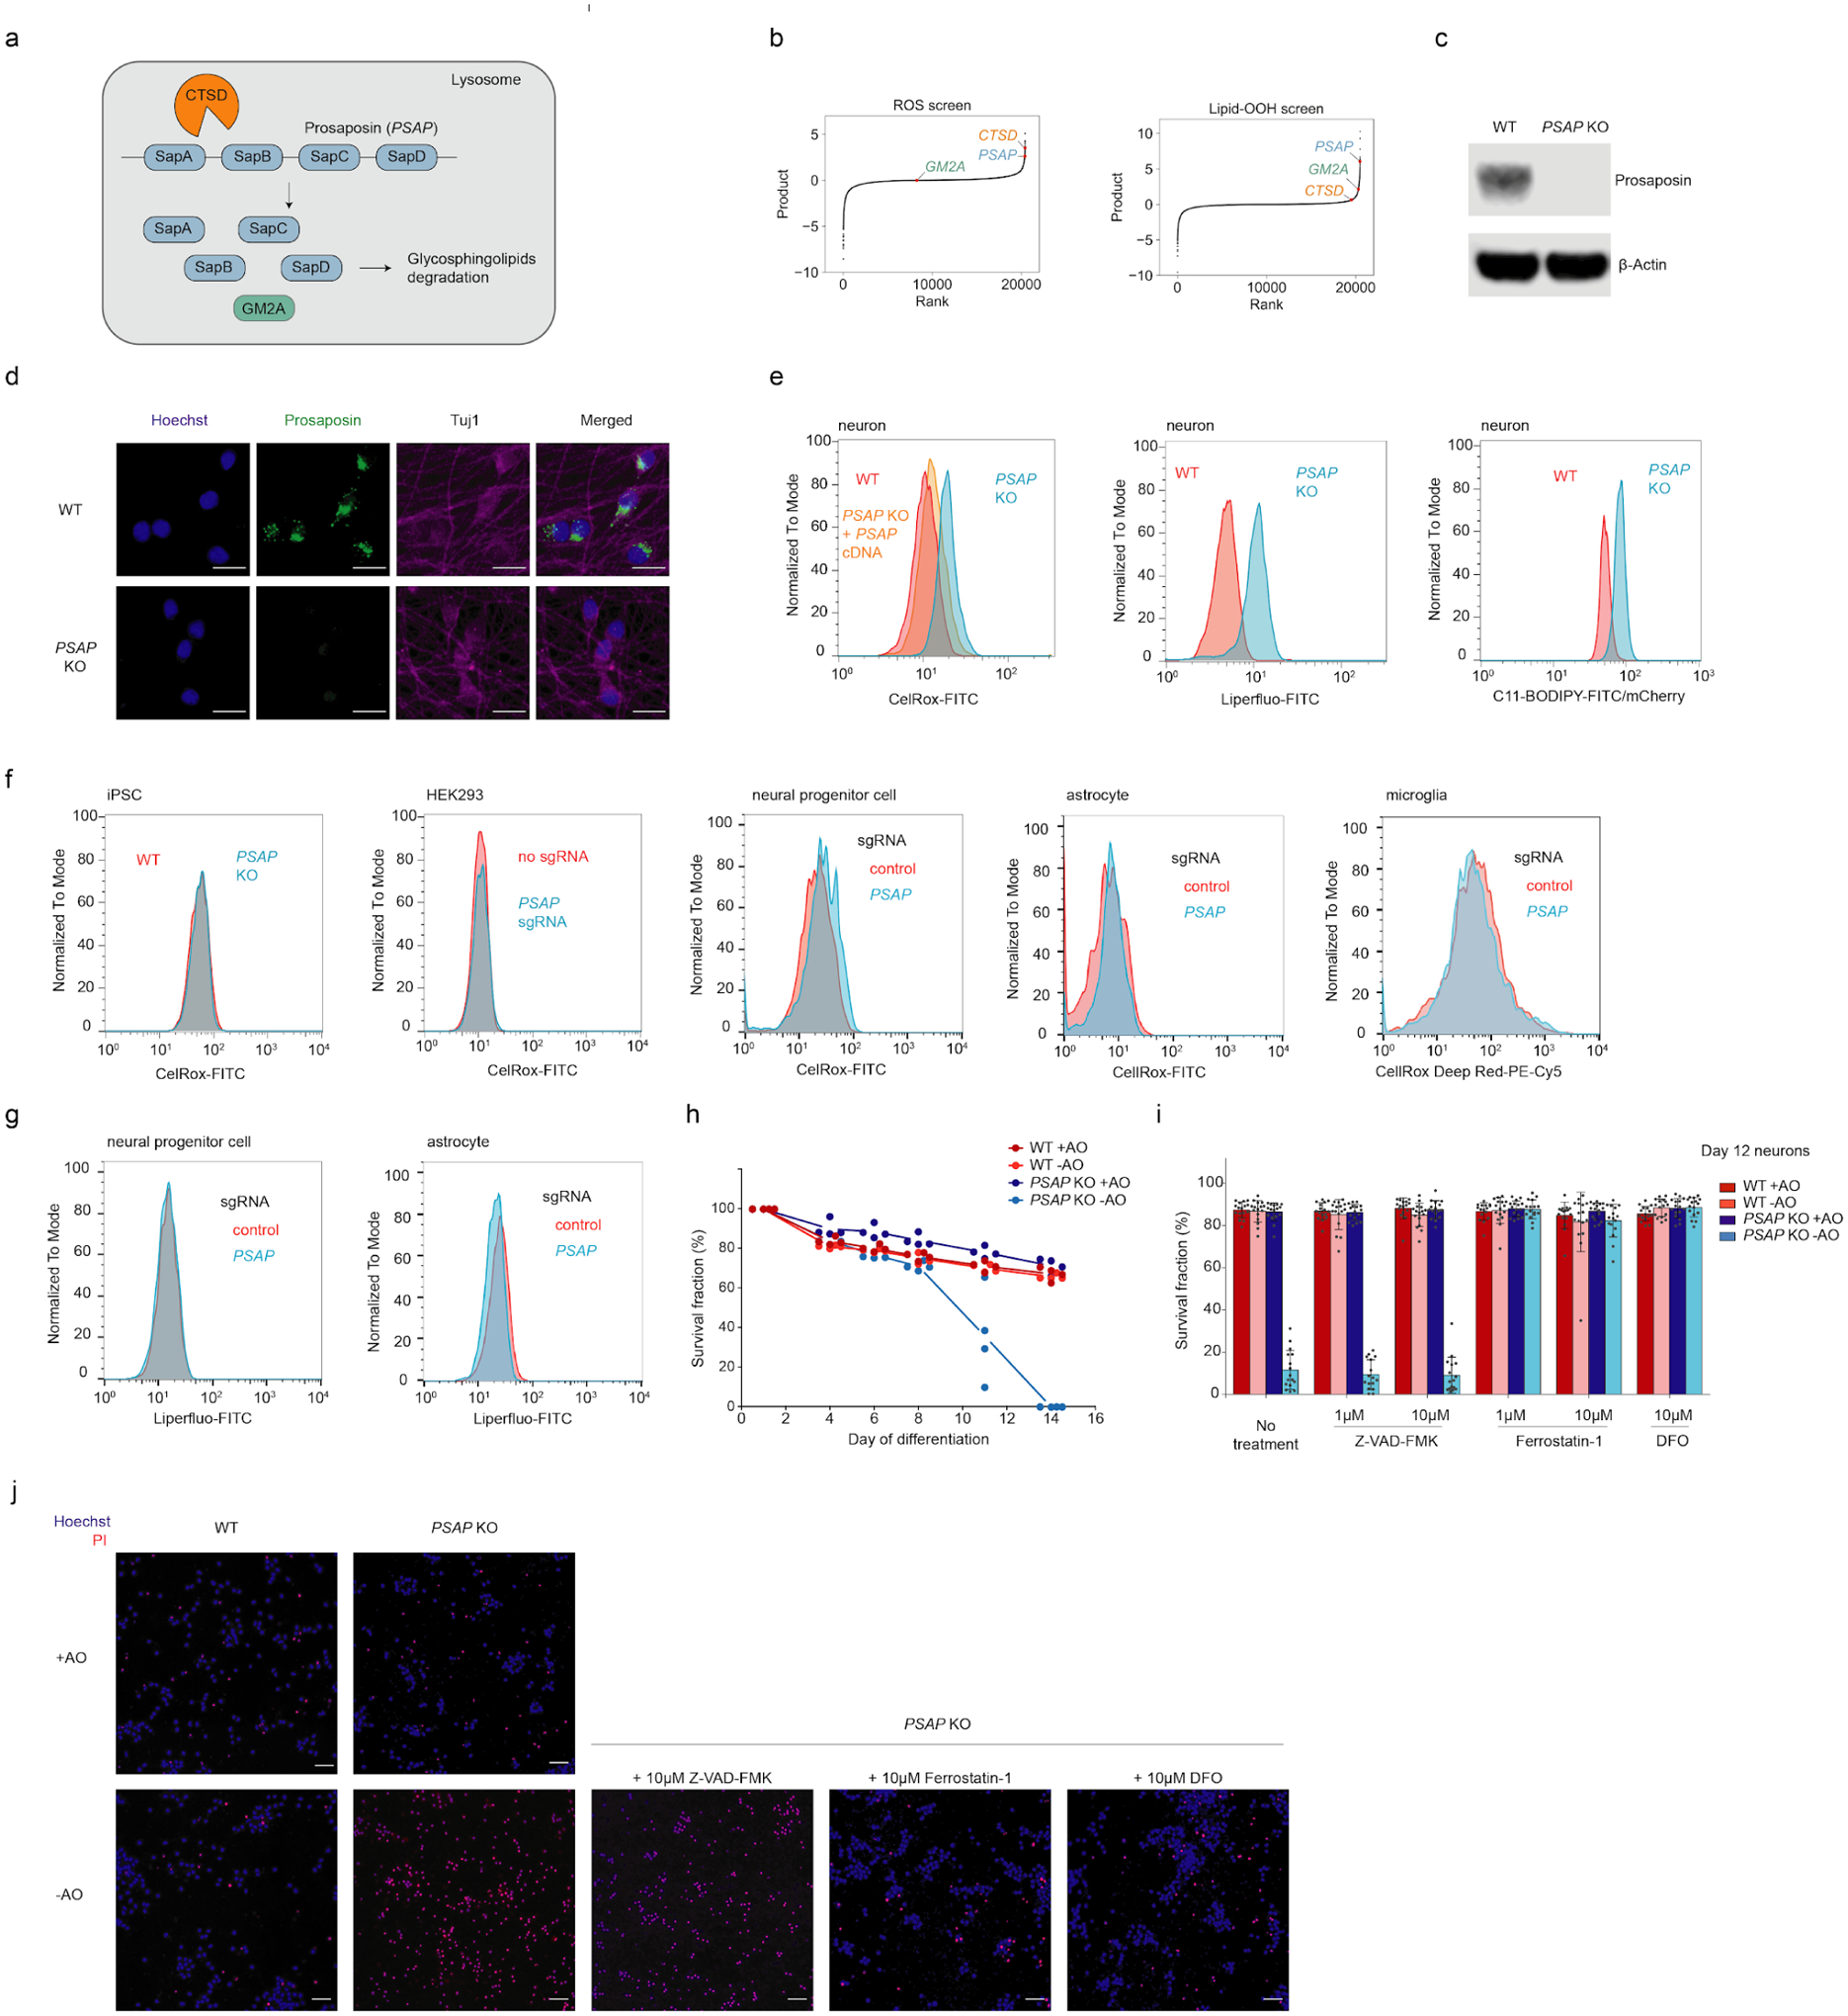
(a) Prosaposin is processed in the lysosome by cathepsin D (encoded by CTSD) into saposin subunits, which function together with GM2A as activators for glycosphingolipid degradation.
(b) Results from the reactive oxygen species (ROS) and lipid peroxidation screens (Fig. 2), highlighting PSAP and the related genes CTSD and GM2A.
(c) Western blot showing the depletion of prosaposin in the PSAP knockout (KO) iPSC line.
(d) Representative immunofluorescence microscopy images showing the loss of prosaposin in PSAP KO neurons. WT and PSAP KO neurons were fixed and stained by antibodies against prosaposin (shown in green) and the neuronal marker Tuj1 (shown in purple). Nuclei were counterstained by Hoechst, shown in blue. Scale bars, 20 μm.
(e) ROS levels (as indicated by CellRox) and lipid peroxidation levels (as indicated by Liperfluo and C11-BODIPY) in WT and PSAP KO neurons, measured by flow cytometry.
(f) ROS levels in iPSCs ,HEK293 cells, neural progenitor cells, astrocytes and microglia in WT and PSAP KO backgrounds (PSAP KO for iPSCs and PSAP knockdown by CRISPRi in the other cell types), measured by CellRox via flow cytometry.
(g) Lipid peroxidation levels (as indicated by Liperfluo) in WT and PSAP knockdown neural progenitor cells and astrocytes, measured by flow cytometry.
(h) Survival curves for WT and PSAP KO neurons cultured in normal neuronal medium (+AO) or medium lack of antioxidants (-AO), quantified by imaging using Hoechst stain (all cells) and propidium iodide (PI) (dead cells). Survival fraction is calculated as (total cell count - dead cell count) / total cell count. Data is shown as mean +/− sd, n = 4 culture wells per group. 16 imaging fields were averaged for each well.
(i) Survival fractions of WT and PSAP KO neurons treated with different cell death inhibitors under +AO or -AO conditions, quantified by imaging in the same way as for G. Data is shown as mean +/− sd, n = 16 imaging fields per group.
(j) Representative images for the Hoechst (shown in blue) and propidium iodide (PI, shown in red) staining in h. Scale bars, 50 μm.
To validate our screen results using an independent approach, we generated a clonal PSAP knockout (KO) iPSC line (Fig. 3c,d). Next, we measured ROS and lipid peroxidation levels in wild-type (WT) and PSAP knockout (KO) neurons. We included C11-BODIPY, another indicator for peroxidized lipid, as additional validation for lipid peroxidation levels. Indeed, we observed a substantial increase in ROS and peroxidized lipid levels in PSAP KO neurons, confirming our screen results (Fig. 3e). Moreover, ROS induction in PSAP KO neurons could be rescued by the overexpression of PSAP cDNA (Fig. 3e), confirming that phenotypes were not driven by off-target genome editing. Interestingly, PSAP KO or knockdown in five other cell types we tested (HEK293 cells, iPSCs, and iPSC-derived neuronal progenitor cells, astrocytes and microglia, Extended Data Fig. 3a) did not increase ROS levels (Fig. 3f), suggesting a neuron-specific role for PSAP in redox regulation. Similarly PSAP knockdown did not increase peroxidized lipid levels in two cell types we tested (Fig. 3g).
Next, we asked if increased ROS in PSAP KO neurons affects survival. We did not observe a survival defect of PSAP KO neurons over two weeks of culture in standard neuronal medium (Fig. 3h). Strikingly, however, when we cultured these neurons in medium lacking antioxidants (–AO), PSAP KO caused a dramatic decrease in survival around Day 11, resulting in complete death of all neurons by Day 14 (Fig. 3h).
To further investigate the underlying mechanism of cell death, we treated WT and PSAP KO neurons with compounds that inhibit different cell death pathways. Intriguingly, the viability of PSAP KO neurons under the -AO condition was not rescued by Z-VAD-FMK, a pan-caspase inhibitor that blocks apoptosis, but was fully rescued by ferroptosis inhibitors, including the iron chelator deferoxamine (DFO) and the lipid peroxidation inhibitor ferrostatin-1 (Fig. 3i,j), suggesting that mild oxidative stress triggers ferroptosis in PSAP KO neurons.
In summary, we validated the unexpected strong hit gene from our unbiased screens, PSAP, as a strong redox modifier in human neurons. Loss of PSAP increases ROS levels and leads to increased lipid peroxidation, resulting in neuronal ferroptosis in response to mild oxidative stress.
Loss of prosaposin leads to lipofuscin formation and iron accumulation
Given the surprising connection between PSAP and ferroptosis, we further investigated the underlying mechanism. Neurons in the following experiments were cultured in standard neuronal medium (+AO) unless otherwise specified. We first asked if the loss of PSAP blocked glycosphingolipid degradation, given the canonical function of saposins. Indeed, untargeted lipidomics revealed that almost all glycosphingolipid species accumulated significantly in PSAP KO neurons compared to WT neurons (Supplementary Table 3, FDR < 0.01, Fig. 4a,b). Ether lipids, which are peroxisome-derived glycerophospholipids, were also enriched in PSAP KO neurons. The mechanisms driving ether lipid accumulation and whether this accumulation is protective or maladaptive remain to be investigated. Interestingly, the accumulation of ether lipids was also recently characterized as a feature of hypoxia66.
Fig. 4: Loss of prosaposin disrupts glycosphingolipid degradation specifically in neurons but not other cell types, and leads to cholesterol accumulation.
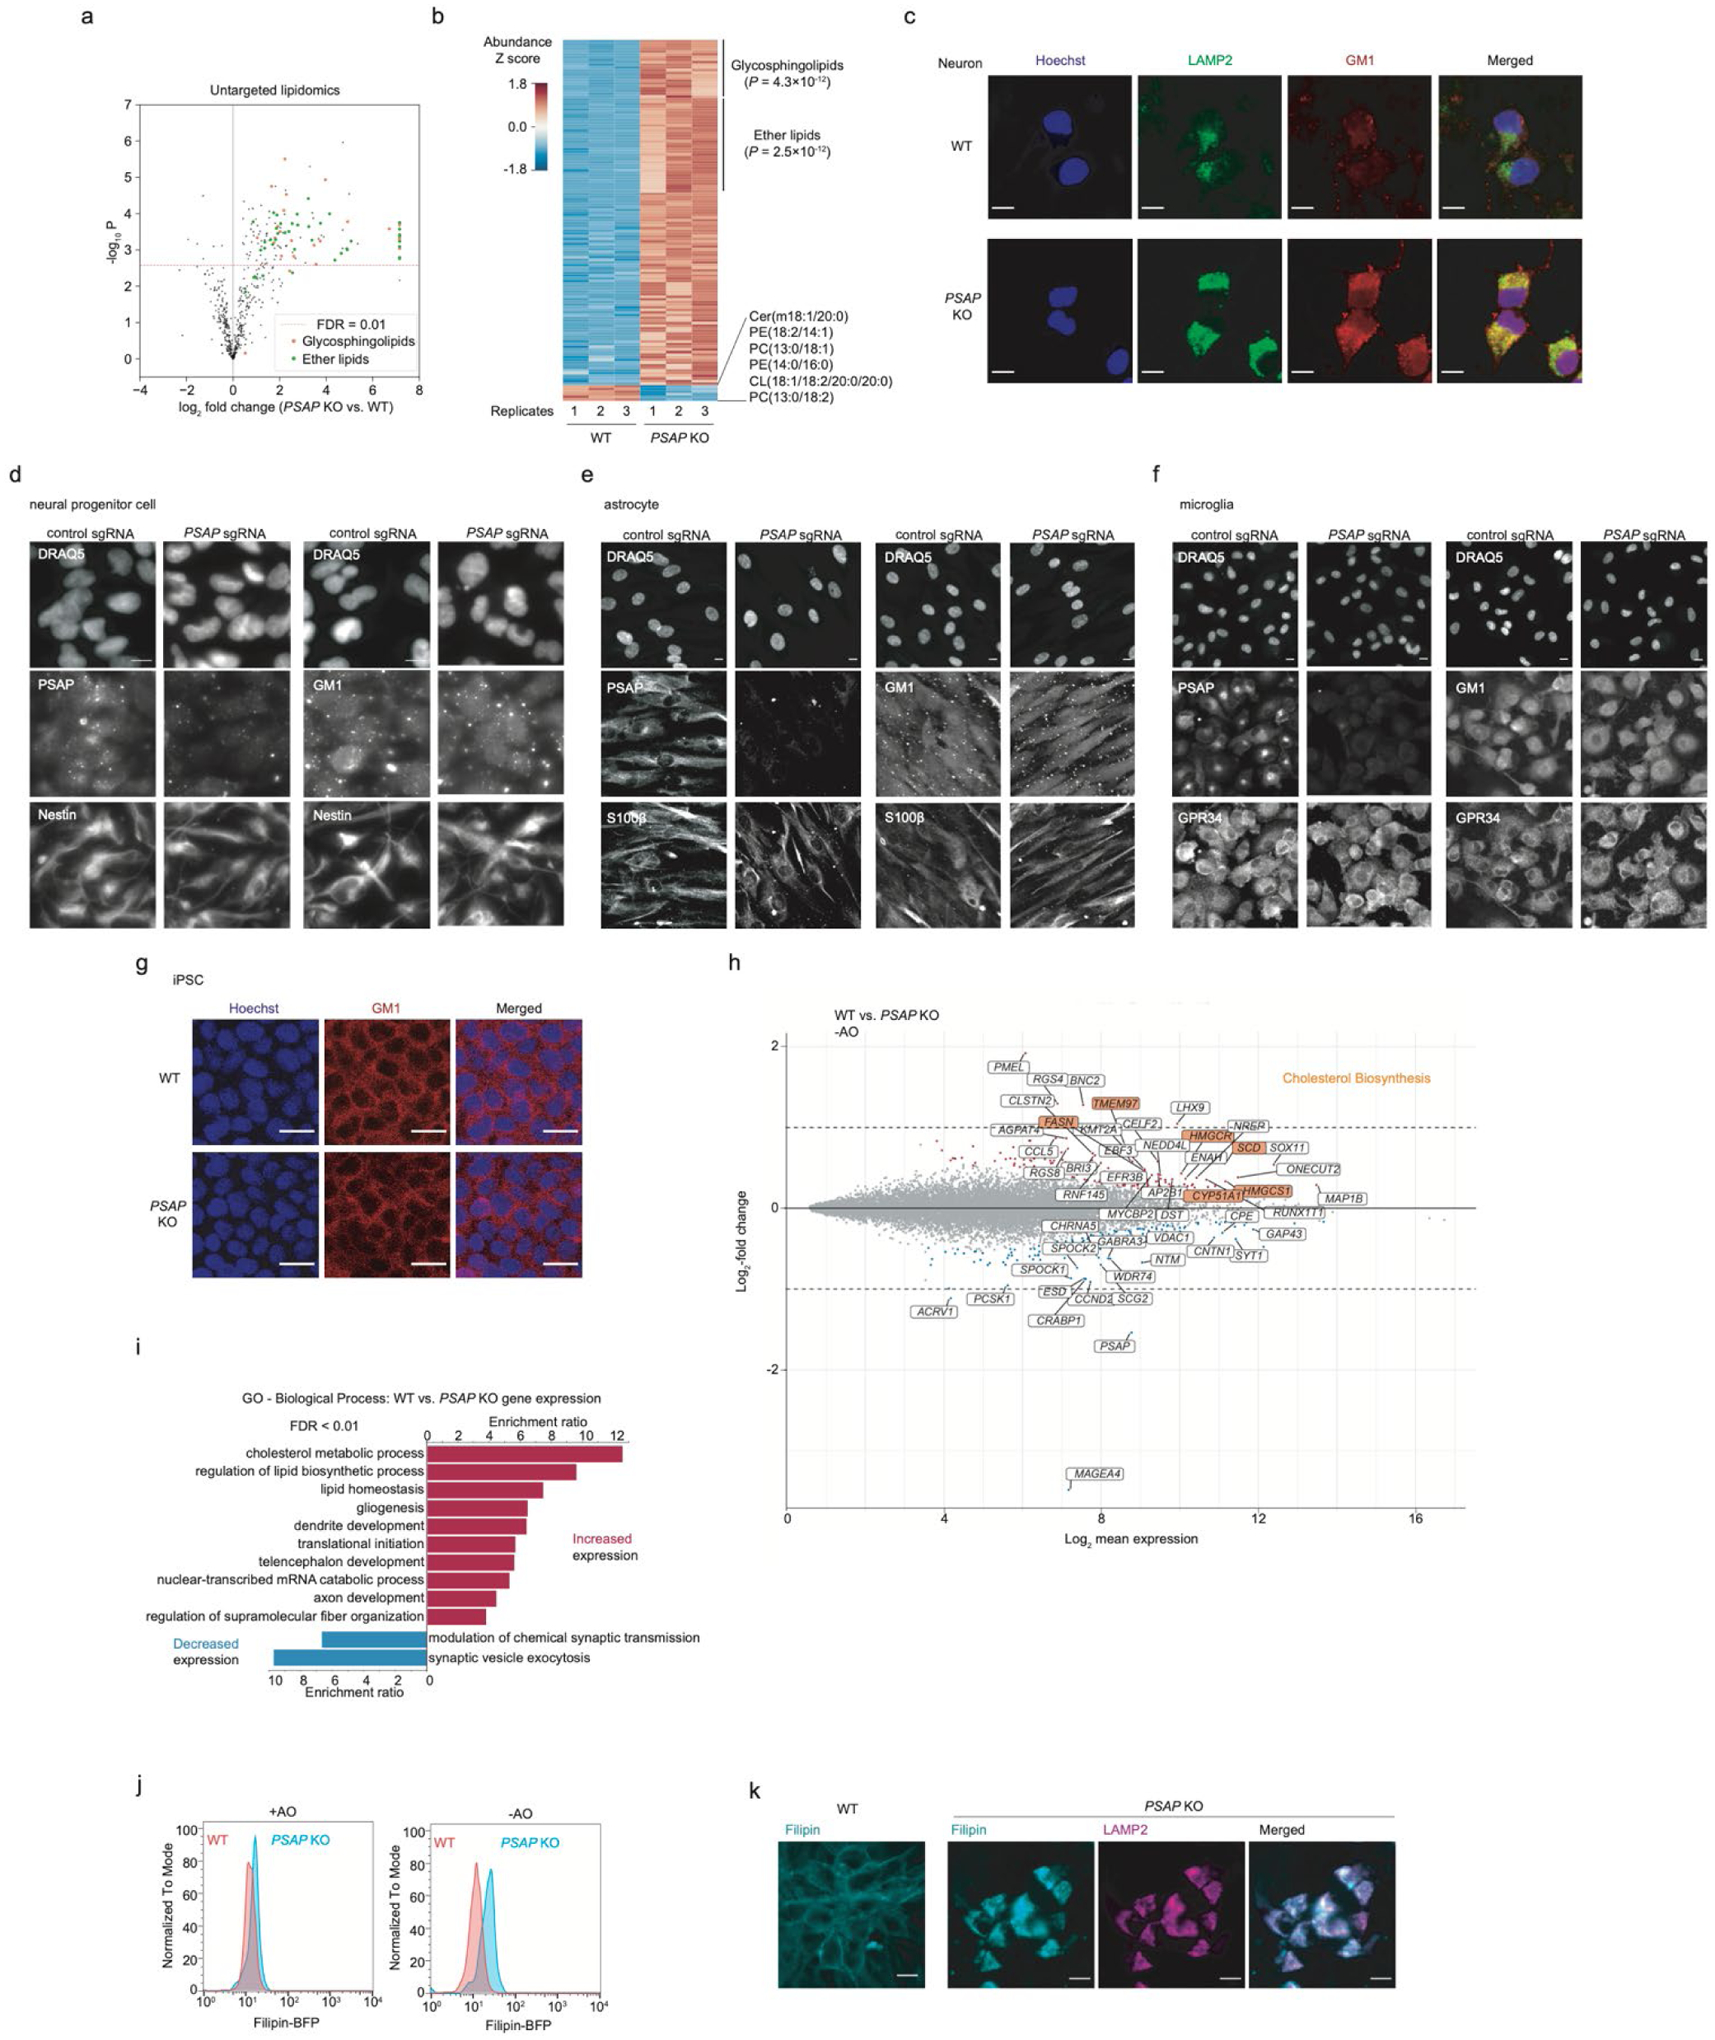
(a) Untargeted lipidomics comparing abundances of different lipid species in wild-type (WT) and PSAP knockout (KO) neurons. P values were calculated using two-sided Student’s t-test (n = 3 replicates per group). Dashed line, P value cutoff for false-discovery rate (FDR) < 0.01. Glycosphingolipids are shown in orange and ether lipids in green.
(b) Heatmap showing the abundances of significantly increased or decreased lipids in PSAP KO neurons as compared to WT (FDR < 0.01). Enrichment P values for glycosphingolipids and ether lipids were calculated using Fisher’s exact test. Lipid abundances were Z score-normalized across samples.
(c) Representative immunofluorescence microscopy images for WT and PSAP KO neurons stained with LAMP2 antibodies (shown in green) and GM1 antibodies (shown in red). Nuclei were counterstained by Hoechst, shown in blue. Scale bar, 10 μm.
(d-f) Representative fluorescence microscopy images for neural progenitor cells (d), astrocytes (e) and microglia (f) diffentiated from CRISPRi iPSCs expression a non-targeting sgRNA or a PSAP sgRNA, stained with PSAP (left) and GM1 (right) antibodies. DRAQ5 was used for nuclear staining. Nestin, S100β and GPR34 antibodies were used as markers for neural progenitor cells, astrocytes and microglia, respectively. Scale bar, 10 μm.
(g) Representative immunofluorescence microscopy images for WT and PSAP KO iPSCs stained with GM1 antibodies (shown in red). Nuclei were counterstained by Hoechst, shown in blue. Scale bar, 20 μm
(h) Gene expression changes in PSAP KO neurons as compared to WT. Genes that are significantly upregulated and downregulated in PSAP KO neurons are shown in red and blue, respectively (false-discovery rate (FDR) < 0.05). The top 50 up- and down-regulated genes are labeled, and within this set, genes involved in the cholesterol biosynthesis pathway are highlighted in orange.
(i) Gene ontology (GO) term enrichment analysis for significantly up- and down-regulated genes (FDR < 0.05) in PSAP KO neurons. Significantly enriched Biological Process terms are shown (FDR < 0.01).
(j) Cholesterol levels measured by flow cytometry in filipin-stained WT and PSAP KO neurons cultured in the presence or absence of antioxidants (in +AO and -AO conditions).
(k) Representative fluorescence microscopy images of WT and PSAP KO neurons stained with filipin (shown in cyan) and LAMP2 antibodies (shown for PSAP KO neurons, in red). Scale bar, 10 μm.
We also confirmed the accumulation of a specific glycosphingolipid species, GM1 ganglioside, in PSAP KO neurons by immunostaining (Fig. 4c). Interestingly, we did not observe GM1 accumulation in PSAP KO or knockdown iPSCs or iPSC-derived neuronal progenitor cells, astrocytes or microglia (Fig. 4d–g), suggesting a cell-type specific role of PSAP. Moreover, we performed RNA sequencing on WT and PSAP KO neurons. Interestingly, a number of genes involved in cholesterol biosynthesis were upregulated in PSAP KO neurons (Fig. 4h,i). Consistent with the induction of this pathway, we found increased cholesterol levels in lysosomes of PSAP KO neurons, as measured by Filipin staining (Fig. 4j,k). This finding mirrored the results of previous studies that PSAP is a strong genetic modifier of cholesterol levels67 and that accumulated glycosphingolipids can lead to the accumulation of cholesterol in lysosomes by inhibiting cholesterol efflux68,69.
Strikingly, we observed dramatically enlarged lysosomes in PSAP KO neurons (Fig. 4c), which were also reflected in an increased lysotracker signal by flow cytometry (Fig. 5a), as expected based on our screen results (Fig. 2f). Again, these lysosomal phenotype were not observed in HEK293 cells, iPSCs and derived astrocytes and microglia, and only to a small extent in iPSC-derived neuronal progenitor cells (Fig. 5b).
Fig. 5: Impaired lipid degradation in PSAP KO neurons leads to lipofuscin formation, iron accumulation and impaired autophagy.
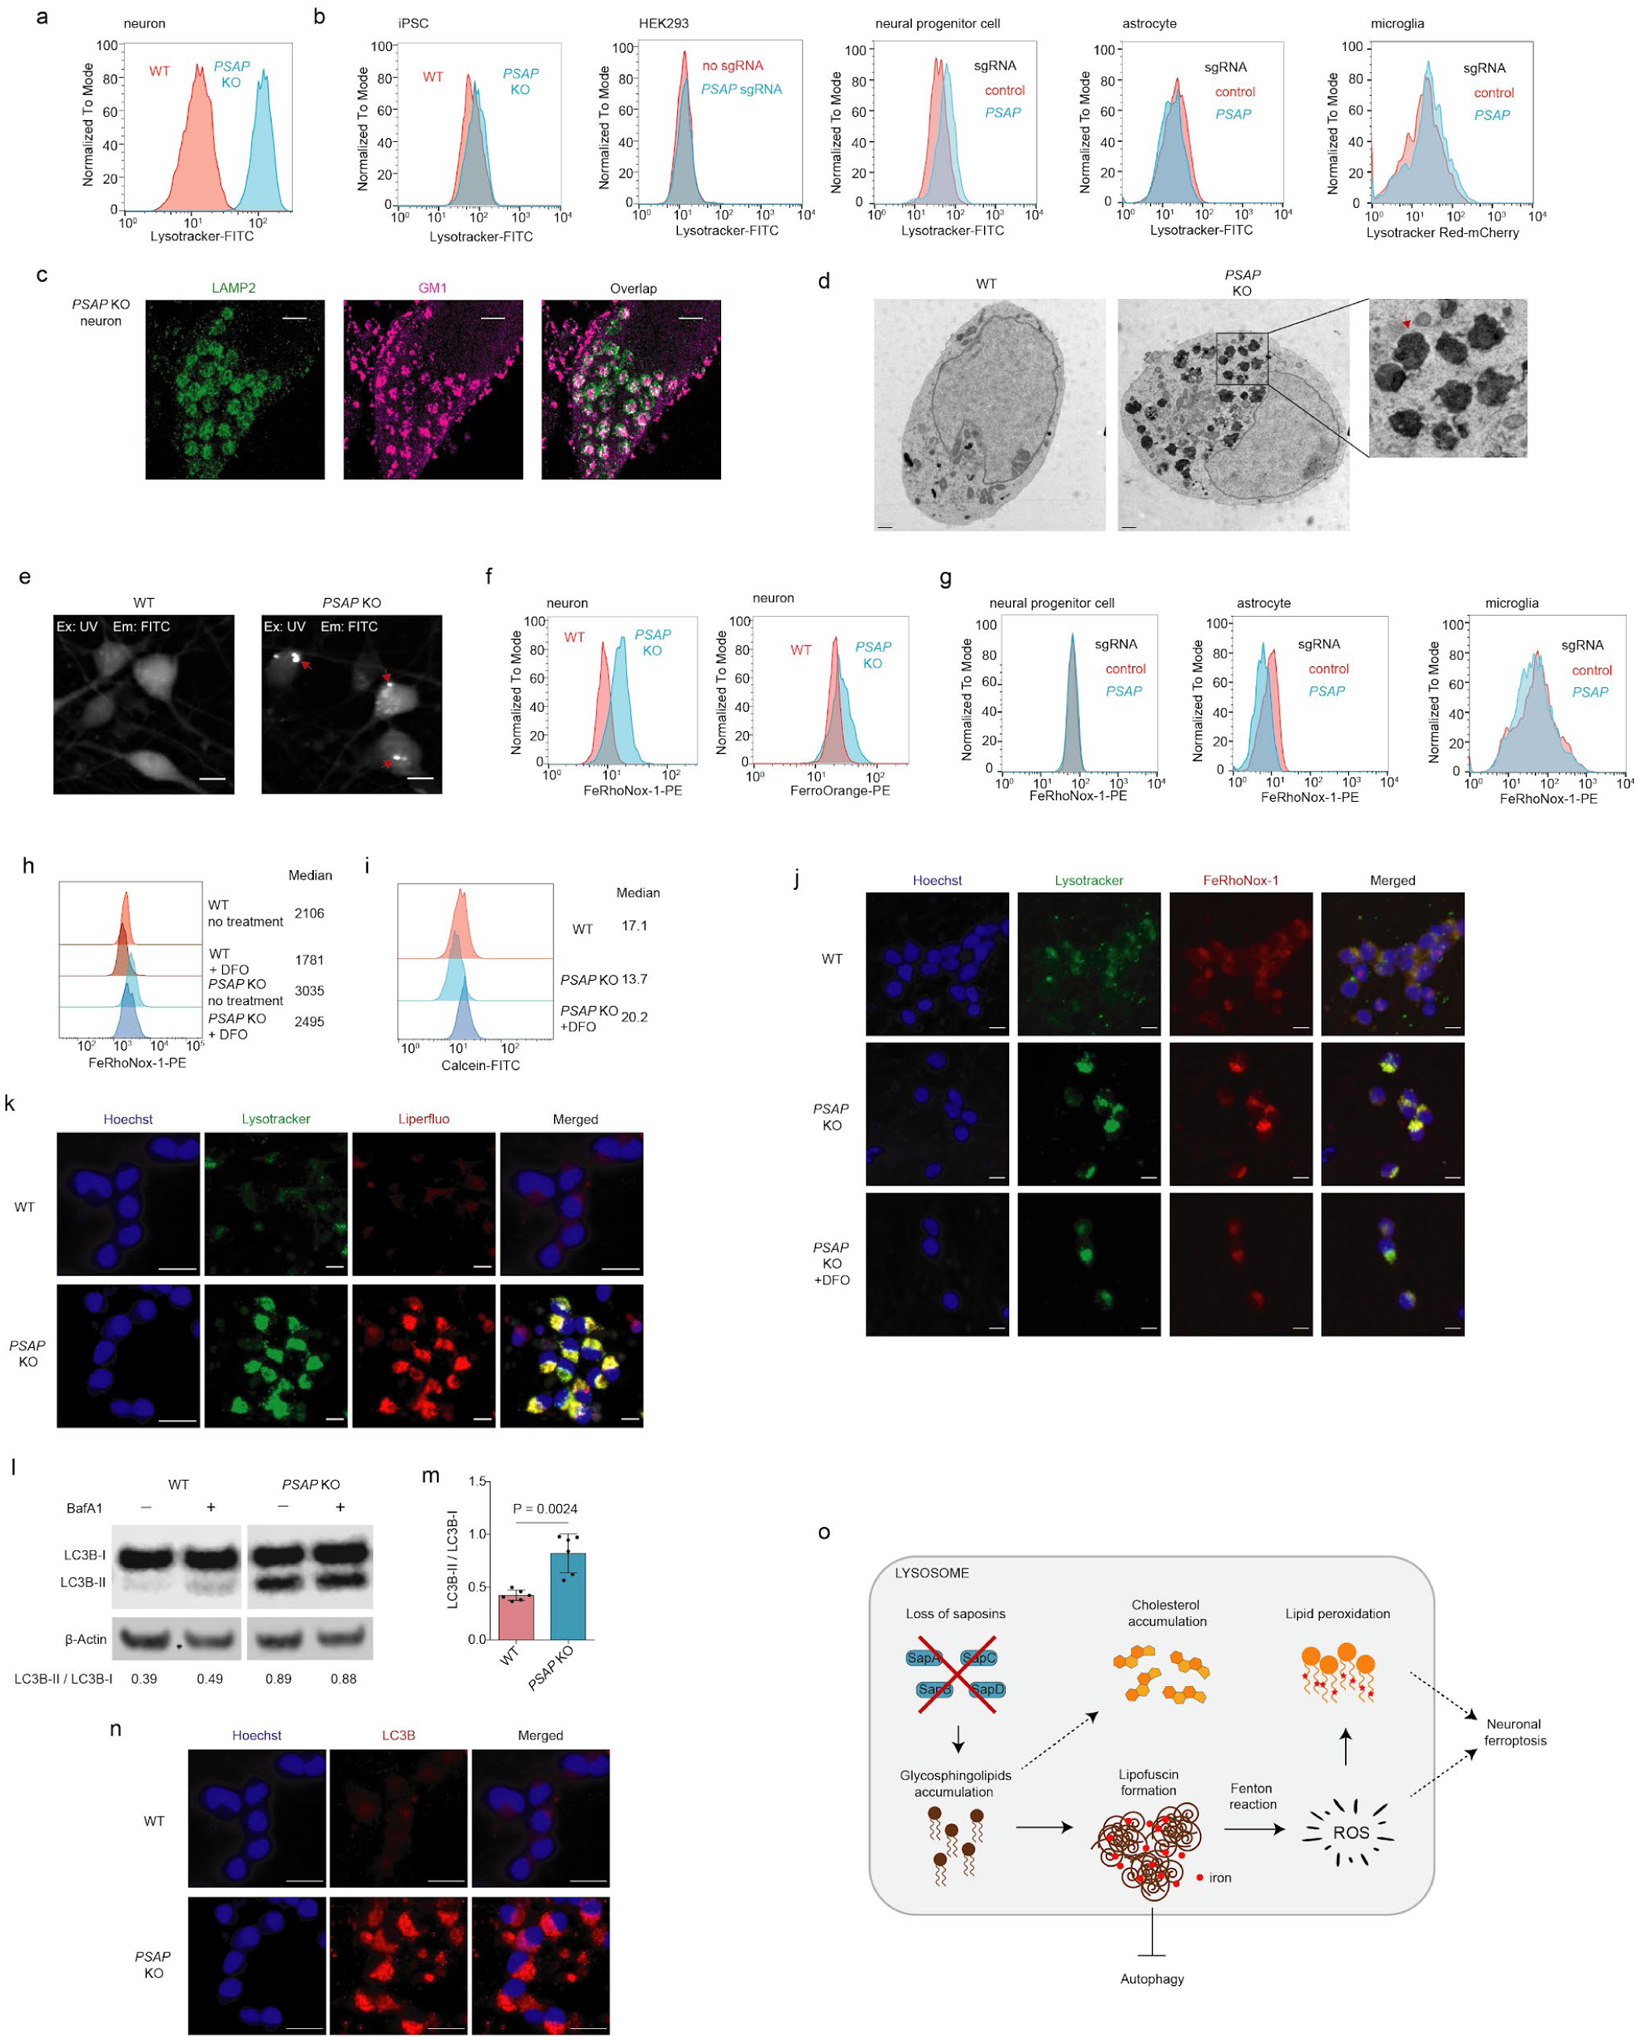
(a) Lysotracker signals measured by flow cytometry in WT and PSAP KO neurons
(b) Lysotracker signals measured by flow cytometry in iPSCs, HEK293 cells, neural progenitor cells, astrocytes and microglia (left to right) in WT and PSAP KO or knockdown backgrounds ( PSAP KO for iPSCs and PSAP knockdown by CRISPRi in the other cell types)
(c) Two-color STORM super-resolution images of PSAP KO neurons immunolabeled for LAMP2 (shown in green) and GM1 (shown in magenta). Scale bars, 2 μm.
(d) Electron microscopy images for WT and PSAP KO neurons. The red arrow points to a representative lipofuscin structure. Scale bar, 1 μm.
(e) Representative images for autofluorescence in WT and PSAP KO neurons. Excitation, UV (405 nm). Emission, FITC (525/20 nm). Scale bar, 10 μm.
(f) Labile iron levels in WT and PSAP KO neurons. Neurons were stained with the iron indicators FeRhoNox-1 (left) or FerroOrange (right) and fluorescence was measured by flow cytometry.
(g) Labile iron levels (as indicated by FeRhoNox-1) in WT and PSAP knockdown neural progenitor cells, astrocytes and microglia (left to right), measured by flow cytometry.
(h) Labile iron levels in WT and PSAP KO neurons with or without DFO treatment. Cells were stained by FeRhoNox-1 and fluorescence was quantified by flow cytometry. Median signal intensities are indicated.
(i) Labile iron levels in WT neurons, PSAP KO neurons, and PSAP KO neurons with DFO treatment. Cells were stained by Calcein and fluorescence was quantified by flow cytometry. Median signal intensities are indicated.
(j) Representative fluorescence microscopy images for WT neurons, PSAP KO neurons, and PSAP KO neurons treated with 10 μM DFO for 3 days, stained with Lysotracker (shown in green) and FeRhoNox-1 (shown in red). Nuclei were counterstained by Hoechst, shown in blue. Scale bar, 10 μm.
(k) Representative fluorescence microscopy images for WT and PSAP KO neurons under the -AO condition stained with Lysotracker (shown in green) and Liperfluo (shown in red). Nuclei were counterstained by Hoechst, shown in blue. Scale bar, 10 μm.
(l) Western blot showing protein levels of phosphatidylethanolamine (PE)-conjugated LC3B (LC3B-II) and unconjugated LC3B (LC3B-I) in WT and PSAP KO neurons in the absence or presence of Bafilomycin A1 (BafA1). β-Actin was used as a loading control. Ratios of LC3B-II to LC3B-I are indicated at the bottom.
(m) Quantification of LC3B-II / LC3B-I ratios for WT and PSAP KO neurons (mean +/− sd, n = 6 independent experiments). P value was calculated using Student’s t-test.
(n) Representative immunofluorescence microscopy images for WT and PSAP KO neurons, stained with LC3B antibodies (shown in red). Nuclei were counterstained by Hoechst, shown in blue. Scale bar, 20 μm.
(o) A model for the mechanism linking prosaposin loss to neuronal ferroptosis. Loss of saposins blocks glycosphingolipid degradation in the lysosome. The build-up of glycosphingolipids leads to lipofuscin formation, which accumulates iron and generates reactive oxygen species (ROS) through the Fenton reaction. ROS then peroxidize lipids and cause neuronal ferroptosis in the absence of antioxidants. Other consequences are cholesterol accumulation and impaired autophagy.
To further characterize the enlarged lysosome-like structures accumulating in PSAP KO neurons, we performed STORM super-resolution microscopy70 and electron microscopy (EM). Similarly to conventional confocal microscopy (Fig. 4c), super-resolution microscopy revealed colocalization of accumulated GM1 and lysosomes (Fig. 5c), consistent with the notion that the lysosome is the main site of glycosphingolipid degradation. By EM, we remarkably observed a large number of electron-dense granules (Fig. 5d) that resembled the structure of lipofuscin (also known as age pigment). Lipofuscin is an insoluble aggregate of peroxidized lipids, proteins and metals in lysosomes of postmitotic cells, such as neurons, which is a hallmark of aging and also associated with several neurodegenerative diseases71. There is currently no consensus on the molecular mechanisms driving lipofuscin formation71. Further supporting the formation of lipofuscin in PSAP KO neurons was the detection of strong autofluorescence (Fig. 5e), a hallmark of lipofuscin72. Lipofuscin is known to accumulate iron from lysosomal degradation of iron-rich proteins or organelles (e.g. mitochondria), and accumulated iron in lipofuscin has been proposed to generate ROS through the Fenton reaction73,74. Indeed, we observed that PSAP deficiency caused a substantial increase of iron levels in neurons (Fig. 5f), but not other cell types (Fig. 5g). This result was consistent with our finding of PSAP as a top hit in our iron level screen (Fig. 2f). Iron accumulation occurred in lysosomes and was partially reversed by the iron chelator DFO (Fig. 5h–j). Meanwhile, dramatically increased lipid peroxidation was detected in lysosomes of PSAP KO neurons under the -AO condition (Fig. 5k), likely due to the accumulated iron, consistent with the strong lipid peroxidation-inducing phenotype of PSAP knockdown in our screen (Fig. 2d).
Other lysosomal functions were also disrupted in PSAP KO neurons, likely due to the formation of lipofuscin. We observed a massive accumulation of autophagosomes in PSAP KO neurons as indicated by the increased ratio of PE-conjugated form of LC3B to its unconjugated form (LC3B-II / LC3B-I) by western blot (Fig. 5l,m), and increased LC3B puncta by immunostaining (Fig. 5n). This substantial induction of LC3B puncta was not observed in other cell types upon PSAP knockdown (Extended Data Fig. 3b). Treatment with Bafilomycin A1 (BafA1), an inhibitor for degradation of autophagosomes by lysosomes, increased the LC3B-II / LC3B-I ratio in WT, but not PSAP KO neurons (Fig. 5l), suggesting a blockade of autophagic flux in PSAP KO neurons.
In summary, we elucidated that loss of saposins in PSAP KO neurons blocks glycosphingolipid degradation in lysosomes, leading to the formation of lipofuscin, which in turn accumulates iron and generates ROS that peroxidized lipids. The accumulation of peroxidized lipids leads to neuronal ferroptosis in the absence of antioxidants (Fig. 5o).
Transcriptomic signatures of perturbations of disease-associated genes in human neurons
Over the past decade, genome-wide association studies (GWASs) have uncovered hundreds of genes that are associated with human neurodegenerative diseases75,76. However, functional characterizations of these risk genes are largely lacking77. Our CRISPRi and CRISPRa platforms provide a high-throughput approach to systematically interrogate gene function in human neurons. Beyond one-dimensional phenotypes such as survival or fluorescent reporter levels, CRISPR perturbation can be coupled to single-cell RNA sequencing, using CROP-seq or Perturb-Seq strategies78–80, to provide rich transcriptomic phenotypes.
The hit genes from our unbiased genome-wide CRISPRi and CRISPRa screens included hundreds of genes associated with neurodegenerative diseases (based on DisGeNet annotation81 and literature research). To better characterize these neurodegenerative disease risk genes, we performed CROP-seq experiments, targeting 184 genes for CRISPRi and 100 genes for CRISPRa with 2 sgRNAs per gene (Fig. 6a, see Method for details). Significant on-target gene knockdown or overexpression were detected for most of the targets in the CRISPRi or CRISPRa library, respectively (> 70% at P < 0.05, Fig. 6b). Within the population of cells expressing sgRNAs for a specific target gene, the levels of target knockdown or overexpression were heterogeneous in some cases (Fig. 6c,d), and we established a machine-learning based strategy to identify cells in which the targeted gene was effectively knocked down or overexpressed (Fig. 6c,d, Extended Data Fig 4a,b, see Methods for details).
Fig. 6: CROP-seq reveals transcriptomic responses to perturbations of neurodegenerative disease-associated genes in human iPSC-derived neurons.
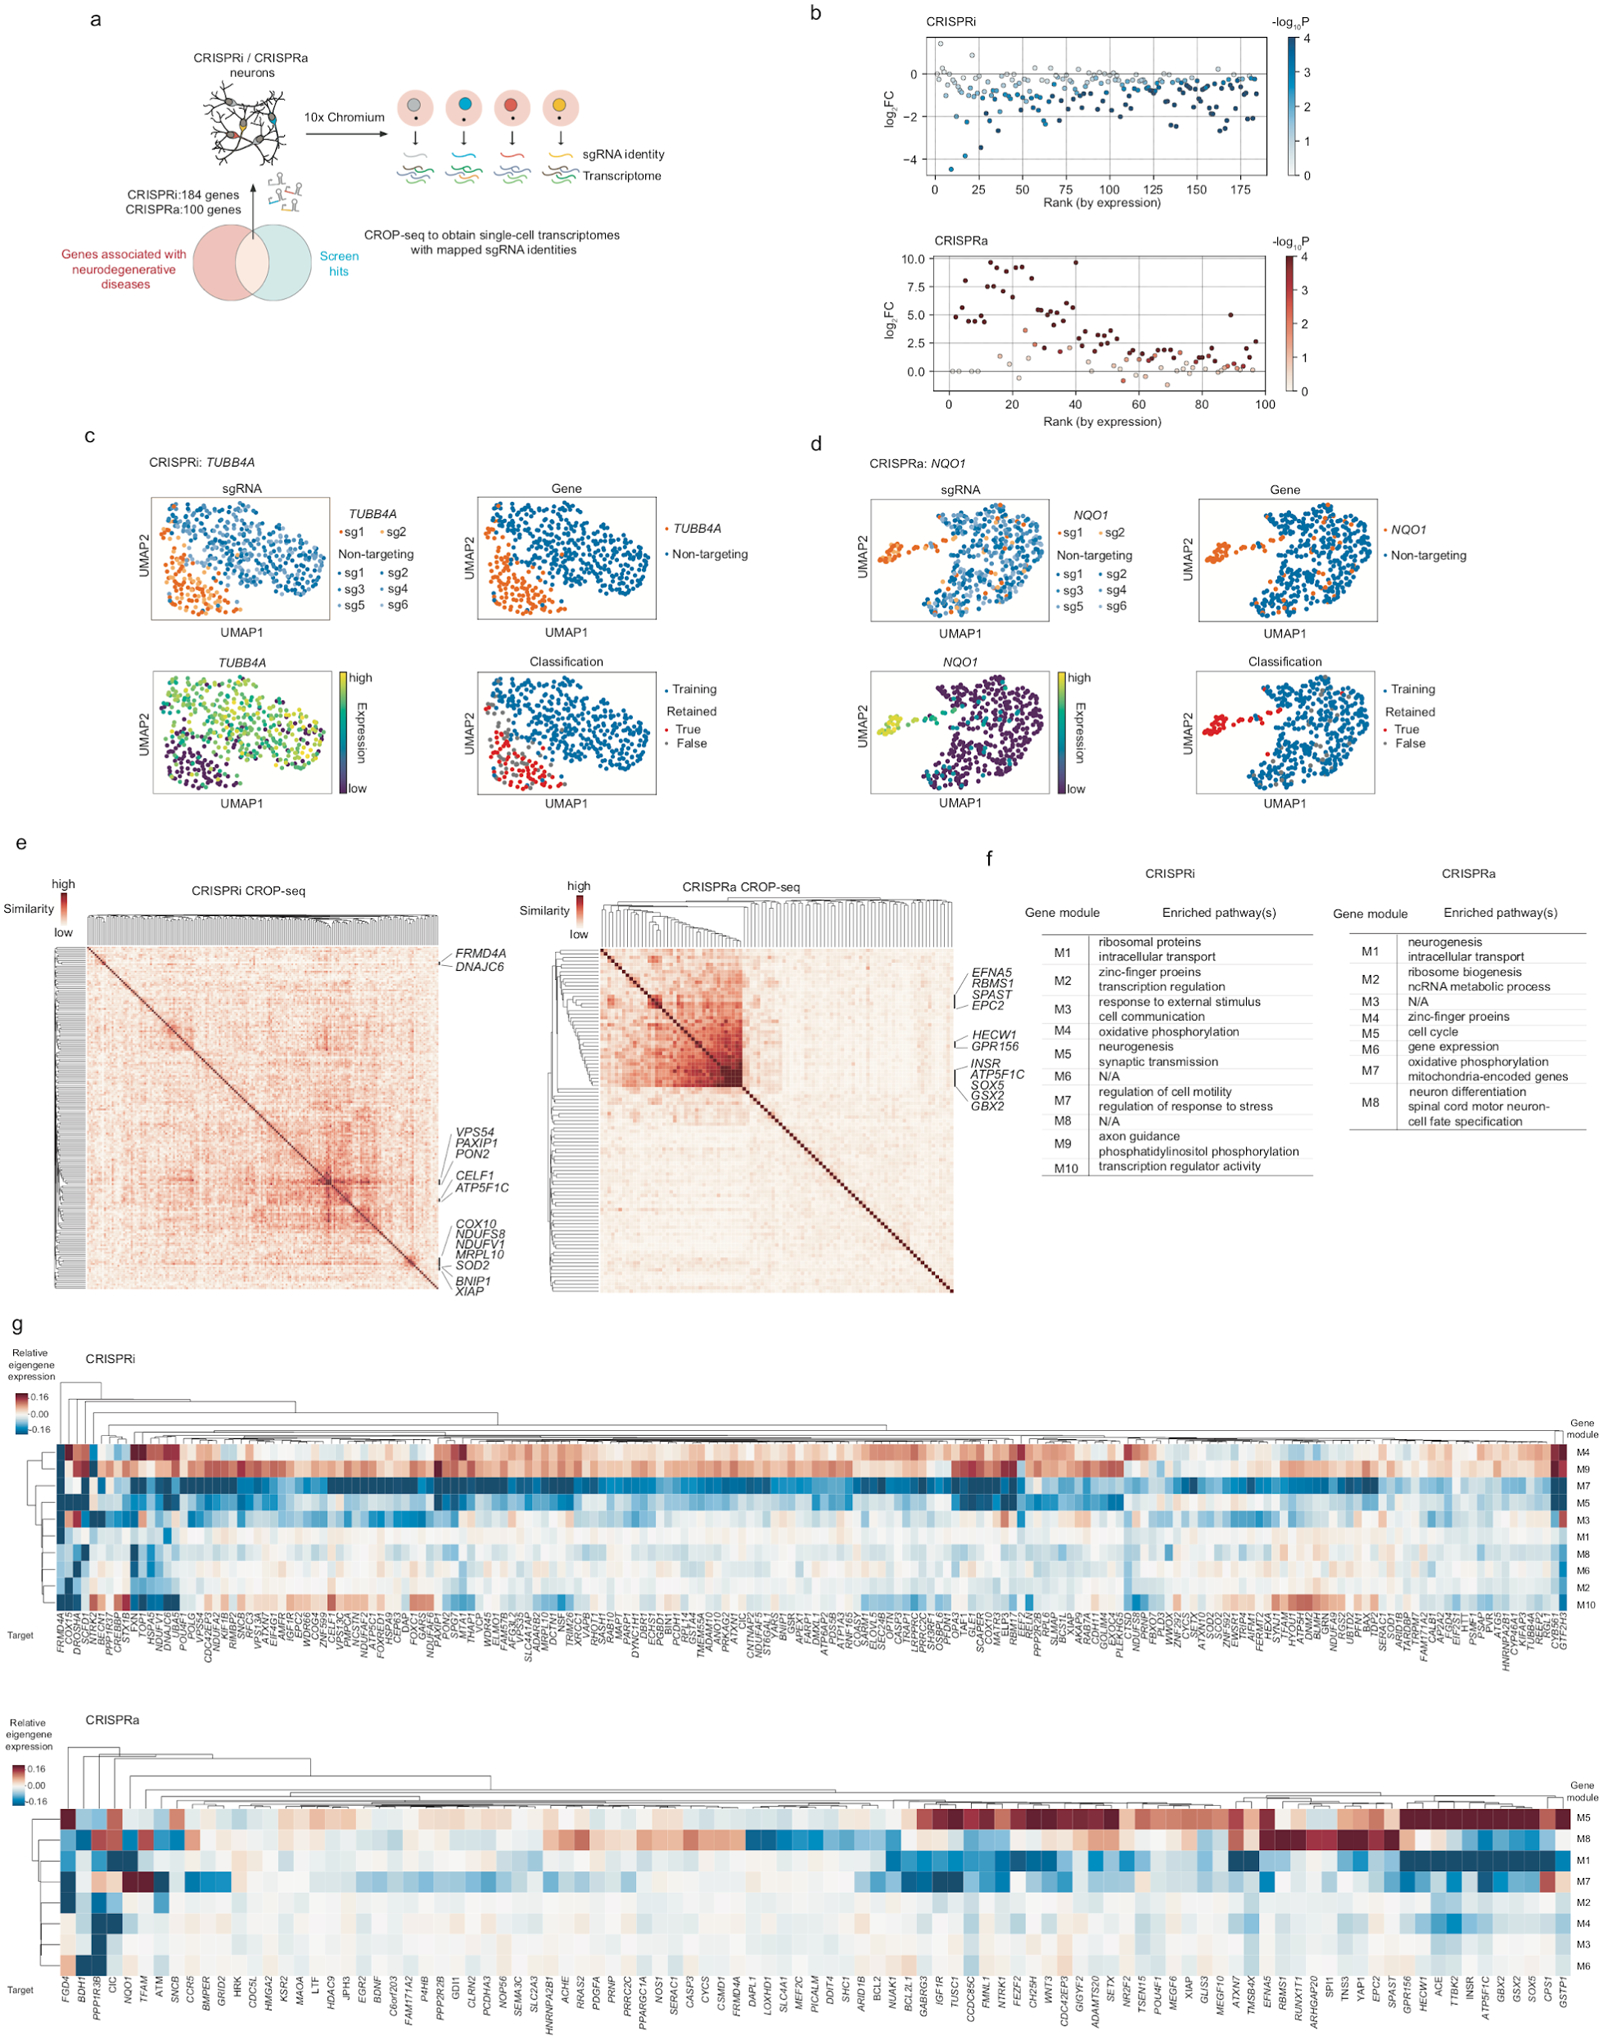
(a) Hit genes from our screens that are also associated with neurodegenerative diseases were targeted in a CROP-seq screen to detect their knockdown or overexpression effects on gene expression at single-cell resolution in human iPSC-derived neurons.
(b) Summary of on-target knockdown by CRISPRi (top) or overexpression by CRISPRa (bottom) for all target genes in the CROP-seq libraries. log2FC represents the log2-fold change of the mean expression of a target gene in perturbed cells (i.e. cells expressing sgRNAs targeting that gene) compared to unperturbed cells (i.e. cells expressing non-targeting control sgRNAs). P values were calculated by the two-sided Wilcoxon rank-sum test. Target genes are ranked by their expression in unperturbed cells.
(c,d) Examples of CROP-seq results showing on-target knockdown (TUBB4A in CRISPRi, c) or overexpression (NQO1 in CRISPRa, d) and the classification method, shown in a two-dimensional UMAP projection.
(e) Pairwise similarities of differentially expressed genes among perturbations. Similarity scores were determined by the OrderedList package in R (see Methods). Genes in clusters with high similarity are labeled.
(f,g) Eigengene expression of gene modules identified from Weighted correlation network analysis (WGCNA) in cells containing different perturbations relative to unperturbed cells (f). Enriched pathways in each module are shown in g.
We identified differentially expressed genes (DEGs) caused by each perturbation, and determined the similarity of DEGs among all perturbations (see Method for details). This analysis revealed clusters of genes that shared common DEG signatures (Fig. 6e). As expected, knockdown of functionally related genes had similar transcriptomic consequences. For example, knockdown several mitochondria-related genes, namely COX10, NDUFS8, NDUFV1, MRPL10, and SOD2, resulted in similar DEGs, as did knockdown of the anti-apoptotic genes BNIP1 and XIAP. However, we also identified unexpected gene clusters. For example, knockdown of VPS54, PAXIP1, and PON2 caused highly correlated transcriptomic changes (Fig. 6e, Extended Data Fig. 4c). VPS54 and PON2 have been implicated in Amyotrophic Lateral Sclerosis (ALS)82,83 whereas PAXIP1 is associated with Alzheimer’s disease (AD)84. Shared transcriptomic changes included: (i) increased expression of EBF3, an apoptosis inducer85 that is also upregulated in the hippocampus of AD model mice86, (ii) decreased expression of components of neurofilaments, namely NEFL, NEFM, and NEFH. Importantly, significantly decreased expression of NEFL and NEFM was also found in neurons of early-stage AD patients in a recent single-cell transcriptomic study87 and (iii) decreased expression of other genes important for neuronal function, including PCDH11X and PCDH11Y, encoding protocadherin proteins, and SYT2, encoding synaptotagmin 2.
To identify genes that were co-regulated under different genetic perturbations, we performed weighted gene co-expression network analysis (WGCNA88). This analysis identified 10 modules for CRISPRi and 8 modules for CRISPRa that were co-regulated across different perturbations (Fig. 6f,g). These modules contained genes enriched in various pathways (Fig. 6f). Interestingly, we found a cluster of genes including INSR, ATP5F1C, SOX5, GSX2 and GBX2 (Fig. 6e, CRISPRa) overexpression of which downregulated a gene module related to neurogenesis (M1) and upregulated a gene module related to the cell cycle (M5) (Fig. 6g, bottom), suggesting that overexpression of these genes interfered with neuronal differentiation thus kept cells in a proliferating state. This result was expected for SOX5, GSX2 and GBX2, which are transcription factors maintaining neural progenitor cell fate and/or their self-renewal89–91, but unexpected for INSR (encoding the insulin receptor) and ATP5F1C (encoding a subunit of mitochondrial ATPsynthase), suggesting these genes might have uncharacterized functions in neuronal fate regulation, which require further investigation.
The CROP-seq data also generated testable hypotheses for disease mechanisms. For example, NQO1, encoding the NAD(P)H:Quinone Oxidoreductase 1, is thought to be a cytoprotective factor through its antioxidant functions92. Elevated levels and activity of NQO1 have been found in the brains of patients with different neurodegenerative diseases93–98, as well as in patient iPSC-derived neurons98. The upregulation of NQO1 was proposed to be a neuroprotective mechanism against oxidative stress in neurodegenerative diseases. Paradoxically, however, NQO1 overexpression showed a strong negative impact on neuronal survival in our pooled CRISPRa screen (Fig. 1e). This finding suggests the intriguing hypothesis that elevated NQO1 in the context of neurodegenerative diseases could be neurotoxic, rather than neuroprotective.
Our CROP-Seq data revealed numerous transcriptomic changes induced by NQO1 overexpression (Fig. 6d, Fig. 7a–c), providing several potential hypotheses for the mechanisms underlying NQO1 toxicity.
Fig. 7: Overexpression of NQO1 induces unexpected transcriptome changes in human iPSC-derived neurons that provide hypotheses for its toxicity.
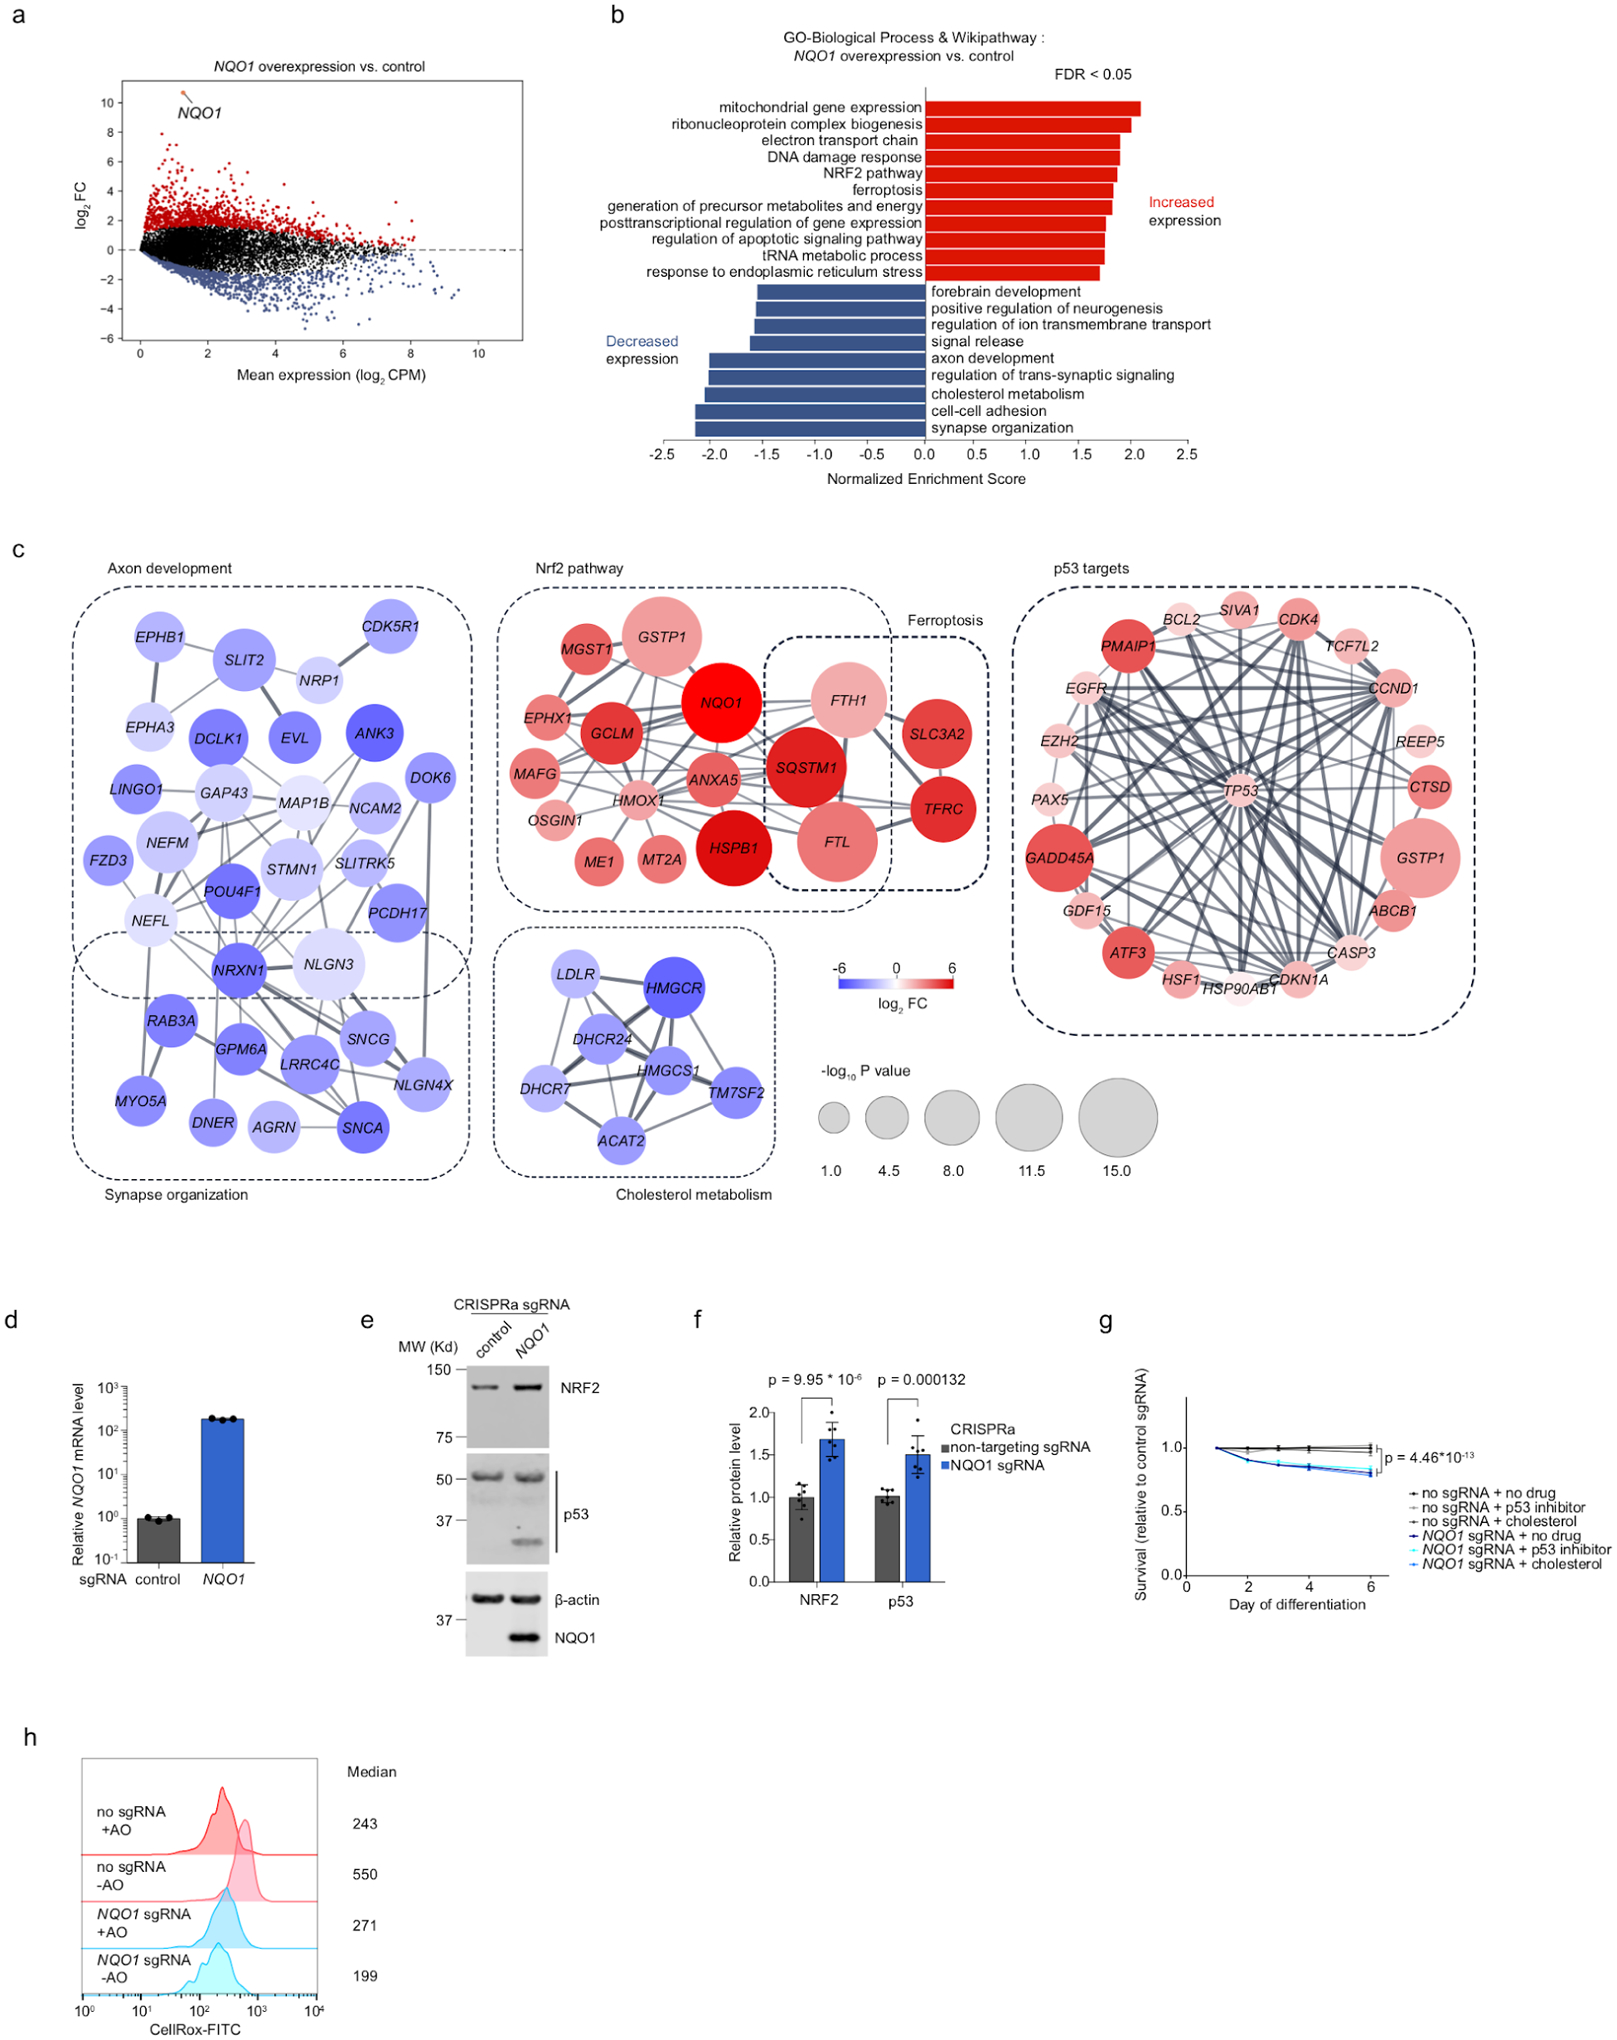
(a) Transcriptomic changes induced by NQO1 overexpression in neurons. Significantly upregulated or downregulated genes (FDR < 0.01) are shown in red or blue, respectively.
(b) Pathway analysis showing enriched pathways in upregulated and downregulated genes in NQO1-overexpressing neurons.
(c) String-db association networks of selected pathways enriched in upregulated and downregulated genes. Genes with stronger associations are connected by thicker lines. Colors and sizes of nodes reflect log2-fold changes (log2FCs) and significance (-log10P) of differentially expressed genes, respectively.
(d) NQO1 overexpression by CRISPRa. qPCR quantification of the relative fold change of NQO1 mRNA levels in CRISPRa-neurons expressing a NQO1 sgRNA as compared to a non-targeting control sgRNA in the presence TMP (mean +/− sd, n = 3 technical replicates). NQO1 levels were normalized to the housekeeping gene ACTB.
(e) Western blot showing protein levels of NRF2, p53 and NQO1 in CRISPRa-neurons expressing a NQO1 or non-targeting control sgRNA. β-actin was used as a loading control.
(f) Quantification of NRF2 and p53 levels for CRISPRa-neurons expressing a NQO1 or non-targeting control sgRNA (mean +/− sd, n = 7 independent experiments). P value was calculated using Student’s t-test.
(g) Survival of CRISPRa neurons expressing the NQO1 sgRNA relative to non-targeting control sgRNA, quantified by longitudinal imaging for number of BFP+ (sgRNA+) cells on Days 1,2,3,4 and 6 of differentiation. Cells were cultured in the presence of vehicle, 10 μM p53 inhibitor Pifithrin-α hydrobromide or 10 μg/ml cholesterol. Mean +/− sd of 10 replicate wells for each condition at each data point is shown. 4 imaging fields at 20X were taken for each well. P value was calculated using Student’s t-test.
(h) ROS levels in CRISPRa-neurons expressing a NQO1 or non-targeting control sgRNA in +AO and -AO conditions, measured by CellRox via flow cytometry. Median signal intensities are indicated.
First, we observed increased expression of many p53 target genes (including p53 itself). A previous study reported that overexpression of NQO1 stabilizes p5399. The induced p53 activity may contribute to the strong toxic survival phenotype of NQO1 overexpression in neurons. Indeed, we found that p53 protein levels were increased upon NQO1 overexpression (Fig. 7e,f). However, pharmacological inhibition of p53 did not rescue neurons from the toxicity of NQO1 overexpression (Fig. 7g), arguing against p53 as the effector of NQO1 toxicity.
Second, the toxicity of NQO1 overexpression may be caused by other mechanisms, such as downregulation of genes involved in axon development or cholesterol metabolism, which we observed in the CROP-seq data (Fig. 7b,c). Supplementation of culture media with cholesterol did not rescue the neurotoxicity of NQO1 overexpression (Fig. 7g), suggesting that cholesterol deficiency is not the main mechanism of toxicity.
Third, NQO1 overexpression strongly induced target genes of the transcription factor Nrf2 (Fig. 7b,c), and we confirmed that Nrf2 was upregulated at the protein level (Fig. 7e,f). This finding was surprising, because Nrf2 canonically functions upstream of NQO1 by inducing the expression of many antioxidant genes, including NQO1, in response to oxidative stress100. We ruled out the possibility that NQO1 overexpression triggered ROS to activate Nrf2 (Fig. 6h), suggesting that NQO1 induces Nrf2 through an unknown mechanism. Intriguingly, the Nrf2 pathway is also induced in some neurodegenerative diseases, both in patient brains101 and in patient iPSC-derived neurons98. While the concordant upregulation of Nrf2 and NQO1 would canonically be interpreted as a protective response to oxidative stress, with NQO1 as a downstream target of Nrf2, our results suggest that NQO1 overexpression could be upstream of Nrf2, and that the elevation of NQO1 levels in patients could actually contribute to disease, rather than being a protective mechanism.
Taken together, our CROP-seq results provide a rich resource for investigating the consequences of perturbations of neurodegenerative disease-associated genes in human neurons and for generating testable hypotheses for the neurodegenerative disease mechanisms and potential therapeutic strategies.
CRISPRbrain, an open-access data commons for functional genomics screens in differentiated human cell types
To make the large dataset generated in this study publicly accessible, and to facilitate visualization, interactive exploration, and direct comparison with functional genomics screening data in a broad range of differentiated human cell types generated by many research groups, we developed a data commons, named CRISPRbrain (https://crisprbrain.org) (Fig. 8a).
Fig. 8: CRISPRbrain, a Data Commons for functional genomics screens in differentiated human cell types.
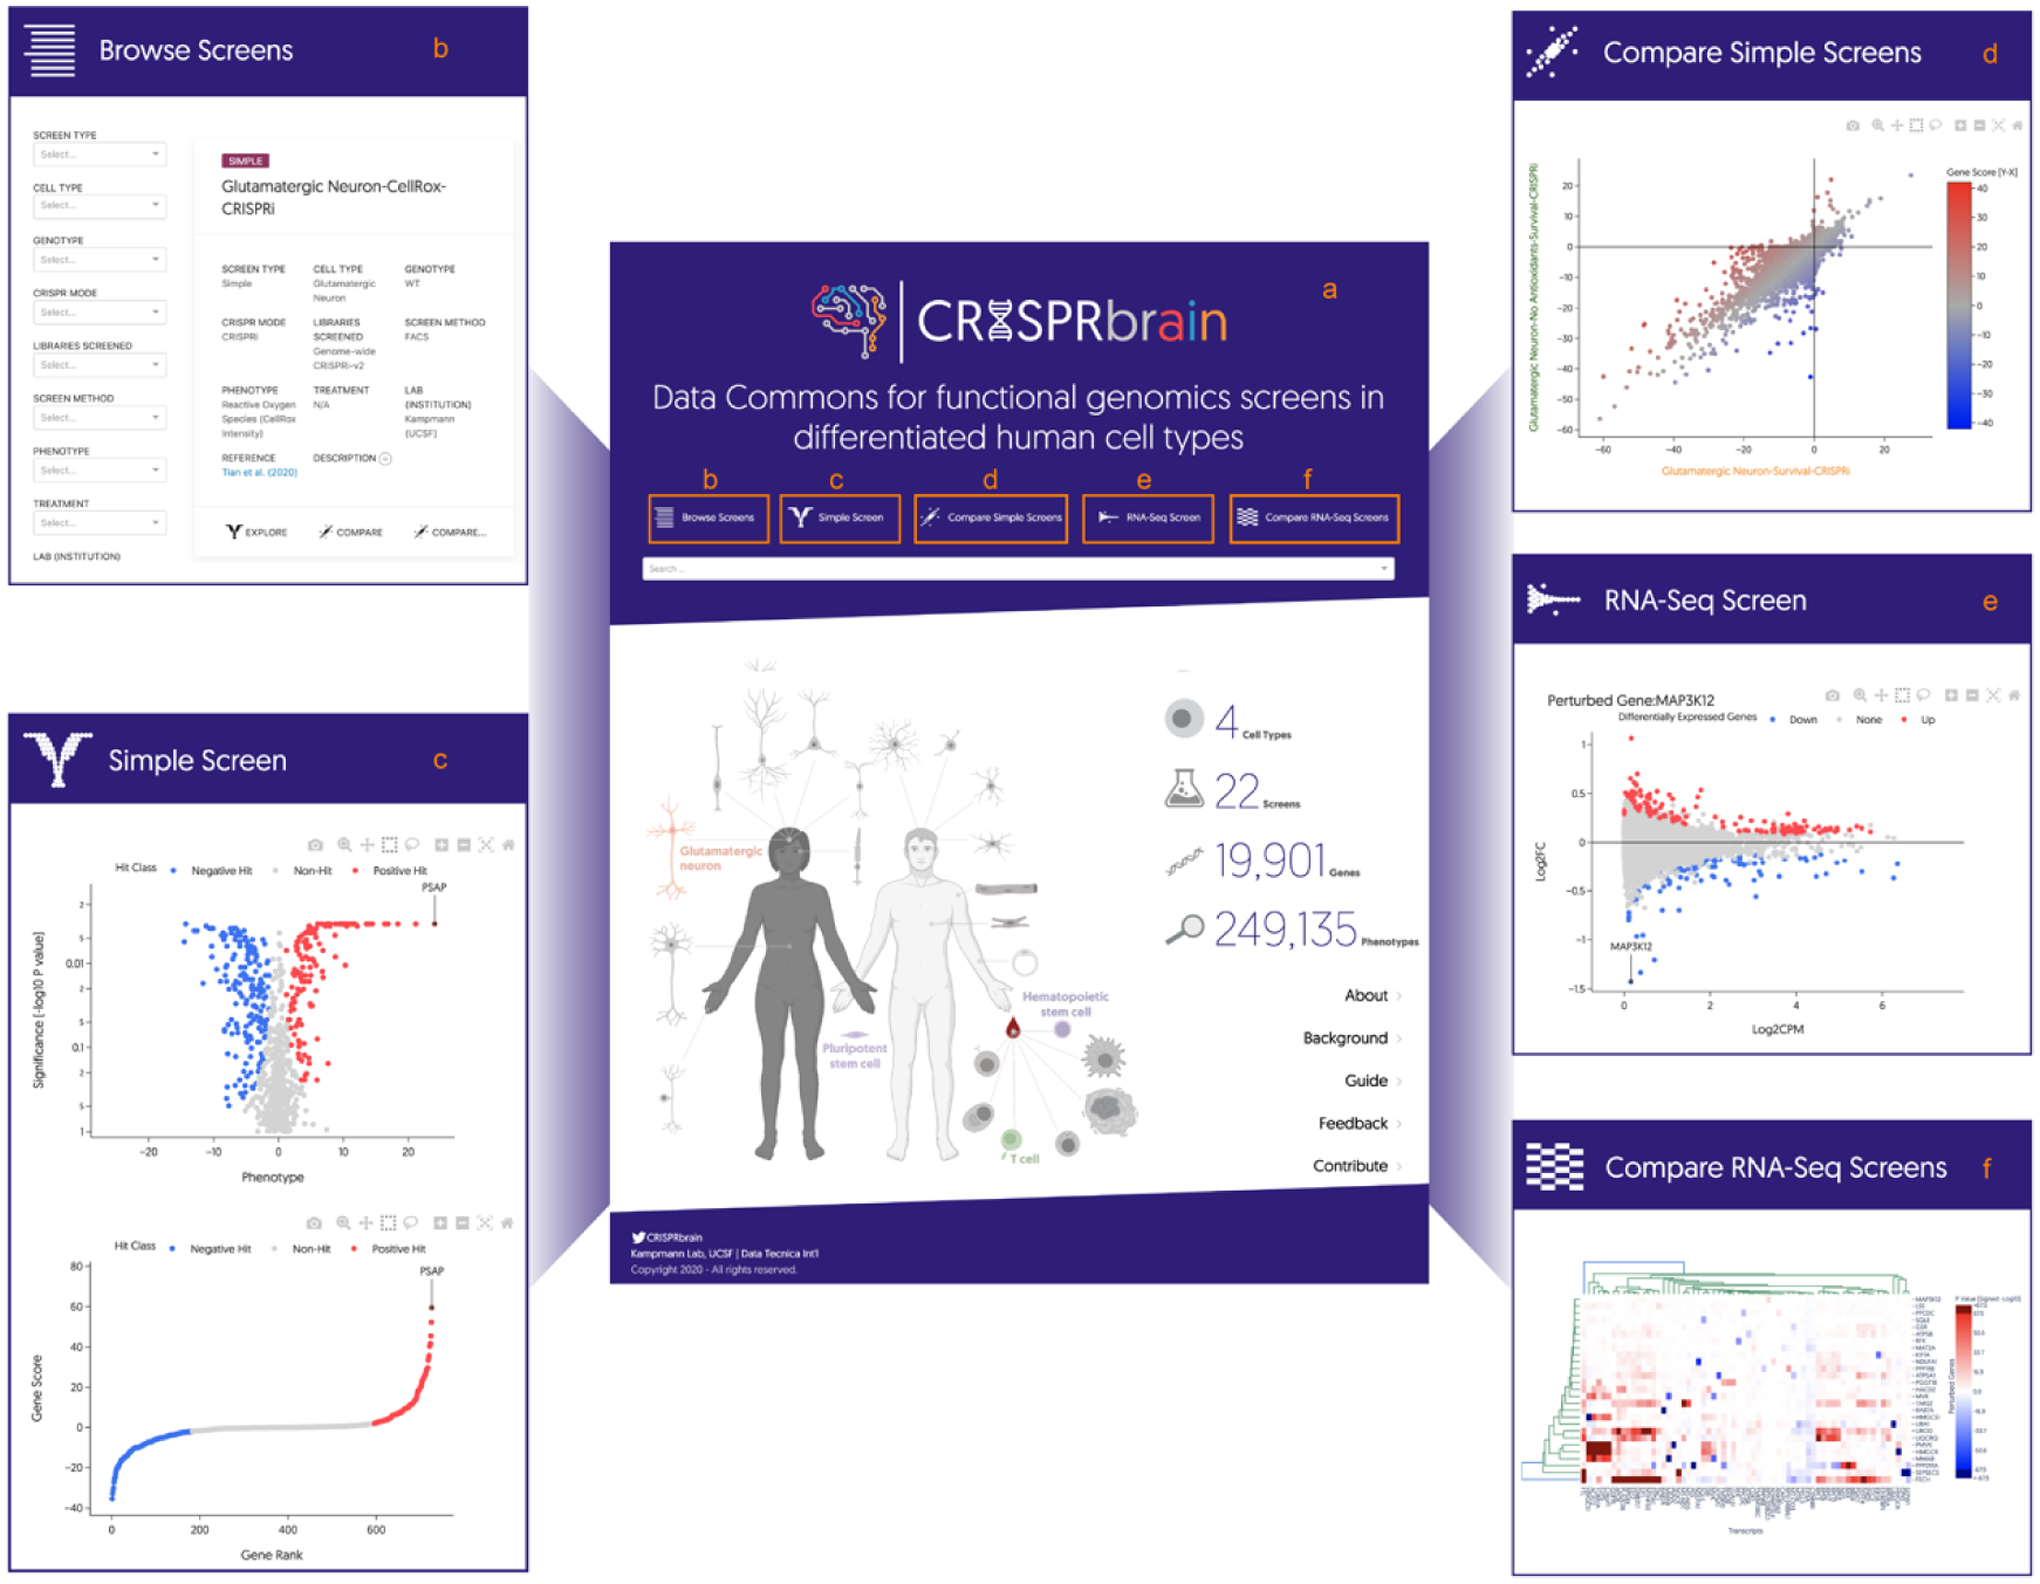
(a) CRISPRbrain (https://crisprbrain.org) is a Data Commons organizing results from genetic screens for different phenotypes in different human cell types, by different research groups.
(b) Screens can be browsed and searched based on a range of parameters, and full text search.
(c,d) Survival- and FACS-based screens (“simple screens”) can be visualized and explored interactively, and compared pairwise.
(e,f) RNA-Seq-based screens can be explored one perturbed gene at a time as MA plots (e), or globally in a hierarchically clustered heatmap (f).
CRISPRbrain currently features screens with “simple” readouts (such as survival and fluorescent reporter levels), as well as screens with complex readouts (such as transcriptomes) Screens can be browsed and searched based on parameters of interest, such as cell type, genotype, mode of CRISPR perturbation, screen method and phenotype, as well as full text search (Fig. 8b).
For simple screens, the phenotypes for the perturbed genes can be displayed as volcano plots and rank plots (Fig. 8c). Data points can be selected individually or in groups to display information about the perturbed gene(s). Gene names can be entered to label them in the graph. Data for the entire screen or for selected genes can be exported for offline analysis. Two screens of interest can be compared in a scatter plot (Fig. 8d).
For RNA-Seq-based screens, genes of interest can be selected to display the transcriptomic phenotype resulting from perturbation of the gene (Fig. 8e). Individual data points can be selected to display information about the transcript, and underlying data can be exported for offline analysis. Alternatively, the results from the entire screen can be explored in a hierarchically clustered heatmap of RNA-Seq phenotypes (Fig. 8f).
We invite all research groups to contribute their functional genomics datasets to CRISPRbrain, with the ultimate goal to build a comprehensive atlas of gene function in all human cell types.
Discussion
In this study, we developed a CRISPRa platform in human iPSC-derived neurons to enable robust gene overexpression screens, complementing our previously established CRISPRi platform3. We demonstrated the power of these complementary screening approaches in multiple large-scale screens in human iPSC-derived neurons.
We determine the first comprehensive inventories of genes that, when depleted or activated, modulate the survival of human neurons. Intriguingly, many of these genes only affect survival in neurons, but not stem cells or cancer cells, supporting the notion that neurons have cell-type specific vulnerabilities, which may explain why defects in some generally expressed genes specifically cause neurological diseases.
Neurons, as one of the longest-living cell types in the human body, are challenged by various stresses in aging and disease. Due to their post-mitotic nature, neurons do not have the ability to ‘self-renew’ by cell division. Therefore, robust stress response mechanisms are required for neurons to maintain long-term health. One of the predominant types of stress in aging and neurodegenerative diseases is oxidative stress6,7, which is induced by excessive accumulation of ROS in the cell. The brain is highly susceptible to ROS and ferroptosis, due to its high levels of oxygen consumption, abundant redox-active metals such as iron and copper, limited antioxidants and high levels of PUFAs102. A large body of evidence has implicated oxidative stress, iron accumulation and ferroptosis in neurodegenerative diseases103–105, yet a comprehensive understanding of how neurons regulate redox homeostasis and maintain survival under oxidative stress is lacking. To this end, we decided to investigate neuronal redox homeostasis and survival under oxidative stress conditions using our CRISPRi/a screening platform.
Compared to other recent genetic screens focusing on oxidative stress toxicity in human cells106,107, our screens are unique in the following aspects. First, we used post-mitotic neurons instead of cancer cell lines. Second, we induced milder oxidative stress in cells by prolonged culture of cells in an antioxidant-free medium, compared to severe oxidative stress induced by paraquat or H2O2 in other studies. Third, we screened not only based on cell survival, but also on direct ROS and lipid peroxidation levels, while other studies focused on survival only. Given these major differences, it is not surprising that our screens identified many unique hits not identified in previous screens.
Numerous novel biological insights have emerged from our rich datasets. GPX4 and genes related to GPX4 synthesis are indispensable for neurons to survive oxidative stress. Given the major role of GPX4 in reducing lipid peroxidation and suppressing ferroptosis, this result suggests that lipid peroxidation-induced ferroptosis, rather than other forms of cell death, may be the main cause of neuronal loss under oxidative stress conditions that are commonly found in the brains of patients with neurodegenerative diseases. This is supported by numerous studies reporting high levels of iron and lipid peroxidation in neurodegenerative disease patient brains108,109, and by the finding that ferroptosis inhibitors such as iron chelators and the lipid-peroxidation inhibitor Ferrostatin-1 are neuroprotective in animal and cellular models of neurodegenerative diseases110–113.
We also found that that disruption of lipid metabolism, in particular glycosphingolipid degradation in the lysosome, by loss of prosaposin (PSAP), drives the formation of lipofuscin in neurons, which leads to iron accumulation and strongly induces ROS production, oxidizing lipids and leading to neuronal ferroptosis under oxidative stress. While lipofuscin has traditionally been considered a byproduct of aging and as a consequence of defective cellular homeostasis, its physiological and pathological functions have not been well characterized. This is largely due to the lack of robust systems to model lipofuscin given the fact that lipofuscin is normally only formed in aged post-mitotic cells. Our PSAP KO neurons provide a reliable genetic system to model and study the biology of lipofuscin in young, live human neurons. Our result suggests a direct pathogenic role of lipofuscin in inducing neuronal ferroptosis. The accumulation of lipofuscin is a pathological hallmark of many degenerative diseases, such as neuronal ceroid lipofuscinosis (NCL)114 and inherited age-related macular degenerations115,116. It has also been characterized in Alzheimer’s disease117,118, Parkinson’s disease119, Hungtinton’s disease120,121 and GRN-associated frontotemporal dementia (FTD)122. Our findings suggest that inhibiting lipofuscin formation or subsequent ferroptosis may serve as new therapeutic strategies for these diseases.
Our results highlight the importance of lipid homeostasis, in particular balanced levels of glycosphingolipids, for neuronal health. Among all tissues in the human body, the brain is one of the richest in lipid content and lipid diversity. Lipids are not only an essential structural component of membranes, but also important signaling molecules in the brain123. Therefore, maintaining lipid homeostasis is of vital importance for brain cells, especially neurons with long neurites and dynamic synaptic vesicles release and recycling. Abnormal lipid metabolism has been observed in neurodegenerative diseases124–126. Accumulation of some glycosphingolipids, especially simple gangliosides, caused by inhibition of lysosome membrane recycling, contributes to neurodegeneration both in cultured neurons and in animal models127.
Many important questions around neuronal lipid and redox homeostasis and ferroptosis remain to be investigated. For example, since neurons have very long neurites, how do neurons sense and respond to a local lipid peroxidation event on the cell membrane? Are GPX4 or other enzymes recruited to sites of lipid peroxidation, or are peroxidized lipids internalized and delivered to GPX4 or other enzymes for detoxification? What are the sensors and mediators in these processes? How do peroxidized lipids cause death? Is it a passive physical process or a regulated biological program, and are there neuron-specific aspects of ferroptosis? If the latter is true, what are the players mediating cell death downstream of lipid peroxidation? Many of these questions can be readily investigated using our functional genomics platform.
There are several areas for future technology development. First, a robust inducible CRISPRi system that allows temporal control of gene knockdown in mature neurons will help avoiding false-positive screening phenotypes due to interference with the differentiation process. For example, in the CRISPRi survival screen, we unexpectedly identified genes in the N6-methyltransferase writer complex, including ZC3H13, METTL3, and METTL4, as strong protective hits when knocked down (Fig. 1e). The N6-methyltransferase writer complex is responsible for m6A RNA modification, which regulates a variety of biological processes including neuronal differentiation128,129. The inducible CRISPRi system will help to determine whether the strong protective phenotypes of these genes are false positive due to defects in neuronal differentiation. Second, we have previously used our platform for arrayed high-content imaging screens for complex neuronal phenotypes, such as neurite outgrowth3. Such imaging-based screens could be applied to study other neuronal phenotypes, such as electrophysiological signals (by voltage imaging or calcium imaging), synaptic vesicle dynamics and axonal transport, and cell non-autonomous phenotypes such as glia-neuron interaction. Imaging phenotyping can also be coupled with simultaneous transcriptomic profiling, thus allowing the association of gene expression with imaging phenotypes for a given genetic perturbation. Lastly, by combining our platform with base editor or prime editing technology130, we will be able to directly assess the effect of disease-associated mutations in human neurons on various cellular phenotypes in a scalable, massively parallel format. While base editor screens to assess human variants have been recently conducted in cancer cell lines131, it is of great interest to investigate how variants associated with different human diseases could affect various cell types differently given the fact that a lot of human diseases are tissue-specific.
In the past decade, tremendous efforts have advanced the molecular characterization of various human cell types. For example, through global collaboration in the Human Cell Atlas project, gene expression profiles for >30 human organs in > 4.5M cells have been obtained so far (https://data.humancellatlas.org/). Beyond gene expression, characterizing gene function in different cell types will be the next step towards building complete reference maps for the human body at the cellular level. We anticipate that our iPSC-based functional genomics platforms can be broadly applied to a variety of human differentiated cell types. Our CRISPRbrain Data Commons is complementary to the Human Cell Atlas and serves as an open-access platform for sharing and exploring functional genomics screening data in differentiated human cell types across labs. In contrast to the Cancer Dependency Map132, BioGRID ORCS133 and CRISP-view134, CRISPRbrain is the first database focused on screens in non-cancerous human cell types for a broad range of phenotypes, including high-dimensional transcriptomic phenotypes. Future versions of CRISPRbrain will support other high-dimensional phenotypes, such as imaging and electrophysiological data, and enable cloud computing and machine learning, thus providing researchers with a suite of tools to process, visualize, analyze and contribute functional genomics screening data in different human cell types. Parallel genetic screens across the full gamut of isogenic human cell types will uncover context-specific roles of human genes, leading to a deeper mechanistic understanding of how they control human biology and disease.
Methods
HEK293 culture
HEK293 cells were cultured in DMEM (GIBCO; Cat. No. 10313–039) supplemented with 10% FBS and 1% penicillin/streptomycin. For CRISPRi knockdown, sgRNAs were introduced into HEK293 cells with CRISPRi machinery135 via lentiviral delivery. Cells were selected by 2ug/ml puromycin for 2 days and recovered for 2 days. Phenotypes were evaluated 5 days after infection.
Human iPSCs culture and neuronal differentiation
Human iPSCs from WTC11 and NCRM5 backgrounds3 were cultured in StemFlex Medium (GIBCO/Thermo Fisher Scientific; Cat. No. A3349401) in plates or dishes coated with Growth Factor Reduced, Phenol Red-Free, LDEV-Free Matrigel Basement Membrane Matrix (Corning; Cat. No. 356231) diluted 1:100 in Knockout DMEM (GIBCO/ v; Cat. No. 10829–018). StemFlex Medium was replaced every other day or every day once cells reached 50% confluence. When 80%–90% confluent, cells were dissociated using StemPro Accutase Cell Dissociation Reagent (GIBCO/Thermo Fisher Scientific; Cat. No. A11105–01) at 37°C for 5 min, centrifuged at 200 g for 5 min, resuspended in StemFlex Medium supplemented with 10 nM Y-27632 dihydrochloride ROCK inhibitor (Tocris; Cat. No. 125410) and plated onto Matrigel-coated plates or dishes at desired number. Studies with human iPSCs at UCSF were approved by the Human Gamete, Embryo, and Stem Cell Research (GESCR) Committee.
For individual gene knockdown or overexpression in CRISPRi- or CRISPRa-iPSCs, sgRNAs were introduced into iPSCs via lentiviral delivery. Cells were selected by 2 μg/ml puromycin for 2–4 days and recovered for 2 days. Phenotypes were evaluated 5–7 days after infection.
The CRISPRi- and CRISPRa-iPSC lines used in this study were engineered to express mNGN2 under a doxycycline-inducible system in the AAVS1 safe harbor locus. For their neuronal differentiation, we followed our previously described protocol3. Briefly, iPSCs were pre-differentiated in matrigel-coated plates or dishes in N2 Pre-Differentiation Medium containing the following: Knockout DMEM/F12 (GIBCO/Thermo Fisher Scientific; Cat. No. 12660–012) as the base, 1X MEM Non-Essential Amino Acids (GIBCO/Thermo Fisher Scientific; Cat. No. 11140–050), 1X N2 Supplement (GIBCO/ Thermo Fisher Scientific; Cat. No. 17502–048), 10 ng/mL NT-3 (PeproTech; Cat. No. 450–03), 10ng/mL BDNF (PeproTech; Cat. No. 450–02), 1 μg/mL Mouse Laminin (Thermo Fisher Scientific; Cat. No. 23017–015), 10nM ROCK inhibitor, and 2 μg/mL doxycycline to induce expression of mNGN2. After three days, on the day referred to hereafter as Day 0, pre-differentiated cells were re-plated into BioCoat Poly-D-Lysine-coated plates or dishes (Corning; assorted Cat. No.) in regular Neuronal Medium, which we will refer to as +AO Neuronal Medium, containing the following: half DMEM/F12 (GIBCO/Thermo Fisher Scientific; Cat. No. 11320–033) and half Neurobasal-A (GIBCO/Thermo Fisher Scientific; Cat. No. 10888–022) as the base, 1X MEM Non-Essential Amino Acids, 0.5X GlutaMAX Supplement (GIBCO/Thermo Fisher Scientific; Cat. No. 35050–061), 0.5X N2 Supplement, 0.5X B27 Supplement (GIBCO/Thermo Fisher Scientific; Cat. No. 17504–044), 10ng/mL NT-3, 10ng/mL BDNF and 1 μg/mL Mouse Laminin. For -AO experiments, we used a medium we refer to as -AO Neuronal Medium, in which B-27 Supplement minus antioxidants (GIBCO/Thermo Fisher Scientific; Cat. No. 10889–038) was used instead of regular B27 in the +AO Neuronal Medium. Neuronal Medium was half-replaced every week.
Generation of iPSC-derived neural progenitor cells and astrocytes
WTc11 iPSCs with CRISPRi machinery stably integrated into CLYBL locus were differentiated into NPCs using an embryoid body-based dual SMAD inhibition neural induction protocol as described in Topol et al.137. The NPCs were then sorted for CD133+/CD271- cells as described in Cheng et al.138 to remove contaminating neural crest cells. The sorted NPCs were then expanded and differentiated to astrocytes using the protocol described in TCW et al.139.
For CRISPRi knockdown, sgRNAs were introduced into NPCs and astrocytes via lentiviral delivery. Cells were selected by 2ug/ml puromycin for 2–5 days and recovered for >2 days. Phenotypes were evaluated 5–10 days after infection.
Microglia differentiation
iPSC-Microglia were differentiated from CRISPRi iPSCs using published protocols140 with minor modifications. Briefly, iPSCs cultured in StemFlex media with colonies at 60–80% confluency were dissociated to single cells with Accutase, collected and plated at 10,000 per well in 96-well ultra-low attachment plates in 100 mL embryoid body medium (10 mM ROCK inhibitor, 50 ng/mL BMP-4 (Peprotech; Cat. No. 120–05), 20 ng/mL SCF (Peprotech; Cat. No. 300–07), and 50 ng/mL VEGF (Peprotech; Cat. No. 100–20) in E8 (Gibco; A1517001)), before centrifugation at 300g for 3 min. Embryoid bodies were cultured for 4 days, with a half medium change after 2 days. At day 4, embryoid bodies were carefully collected and transferred into a 15 ml Eppendorf tube, and left to settle. The embryoid medium was aspirated and 15 to 20 embryoid bodies were plated per well in 6-well plates and cultured in 3 mL hematopoetic medium (2 mM GlutaMax, 1x Antibiotic-Antimycotic (Thermo Fisher Scientific; Cat. No. 15240062), 55 mM 2-mercaptoethanol (BioRad; Cat. No. 1610710), 100 ng/mL M-CSF (Peprotech; Cat. No. 300–25), and 25 ng/mL IL-3 (Peprotech; Cat. No. 200–03) in X-VIVO 15 (Lonza; Cat. No. BE02–060F). Two thirds of media were exchanged every 3–4 days. Microglia progenitors were harvested from suspension after 14–21 days and plated onto PDL-coated plates in microglia maturation media (2 mM GlutaMax, 1x Antibiotic-Antimycotic, 100 ng/mL IL-34 (Peprotech; Cat. No. 200–34), and 10 ng/mL GM-CSF (Peprotech; Cat. No. 300–03) in Advanced RPMI (Gibco, Cat. No. 12633012)). Microglia progenitors were further differentiated for 8 days with full medium change every 2–3 days before using them for experiments.
For CRISPRi knockdown, sgRNAs were introduced into iPSCs via lentiviral delivery. After 2–4 days of puromycin selection and 2 days of recovery, these iPSCs were differentiated into microglia following the protocol as described above. Phenotypes were evaluated after 10 days of microglia differentiation.
Molecular cloning
The CLYBL-targeting inducible CRISPRa vector pRT43 containing CAG-driven DHFR-dCas9-VPH-T2A-EGFP was generated by sub-cloning DHFR-dCas9-VPH-T2A-EGFP from plasmid PB-CAG-DDdCas9VPH-T2A-GFP-IRES-Neo to the downstream of a CAG promoter in CLYBL-targeting plasmid pUCM-CLYBL-hNIL digested by SalI and EcoRV. (PB-CAG-DDdCas9VPH-T2A-GFP-IRES-Neo was a gift from Timo Otonkoski (Addgene plasmid # 102886 ; http://n2t.net/addgene:102886 ; RRID:Addgene_102886) and pUCM-CLYBL-hNIL was a gift from Michael Ward (Addgene plasmid # 105841 ; http://n2t.net/addgene:105841 ; RRID:Addgene_105841))
CRISPRa-iPSC cell line generation
WTC11 iPSCs harboring a single-copy of doxycycline-inducible mouse NGN2 at the AAVS1 locus (Ngn2-iPSCs,9) were used as the parental iPSC line for further genetic engineering. iPSCs were transfected with pRT43 containing DHFR-dCas9-VPH and TALENS targeting the human CLYBL intragenic safe harbor locus (between exons 2 and 3) (pZT-C13-R1 and pZT- C13-L1, gifts from Jizhong Zou (Addgene plasmid # 62196 ; http://n2t.net/addgene:62196 ; RRID:Addgene_62196, and Addgene plasmid # 62197 ; http://n2t.net/addgene:62197 ; RRID:Addgene_62197) using Lipofectamine Stem (Invitrogen/Thermo Fisher Scientific; Cat. No. STEM00003). Monoclonal lines were isolated by limiting dilution and CLYBL integration was confirmed by PCR genotyping. Karyotype testing (Cell Line Genetics) was normal for the clonal line used for further experiments in this study, which we termed CRISPRa iPSCs.
Genome-wide survival-based and FACS-based screens
The genome-wide CRISPRi and CRISPRa libraries hCRISPRi-v2 and hCRISPRa-v210, consisting of 7 sublibraries each (H1-H7), were packaged into lentivirus as previously described3. CRISPRi- and CRISPRa-iPSCs were infected by the sgRNA libraries at MOIs of 0.4–0.6 (as measured by the BFP fluorescence from the lentiviral vector) with approximately 1000x coverage per library element. Two days after infection, the cells were selected for lentiviral integration using puromycin (1 μg/mL) for 3 days as the cultures were expanded for the screens. After selection and expansion, a fraction of the cells (Day −3 iPSCs) were harvested and subjected to sample preparation for next-generation sequencing. Another fraction of Day −3 iPSCs, with a cell count corresponding to 1000x coverage per library element, were differentiated into neurons as described in the Human iPSCs Culture and Neuronal Differentiation subsection.
Neurons were cultured in either the +AO or -AO Neuronal Medium (see Human iPSCs Culture and Neuronal Differentiation subsection) for ten days. For the survival screens, Day 10 neurons were harvested and subjected to sample preparation for next-generation sequencing. For the FACS screens, Day 10 CRISPRi neurons cultured in the +AO medium and -AO medium were dissociated using Papain (Worthington; Code: PAP2; Cat. No.LK003178) and stained by CellRox Green (Invitrogen/Thermo Fisher Scientific; Cat. No. C10444) and Liperfluo (Dojindo Molecular Technologies, Inc.; Cat. No. L248–10) respectively (see Cell Staining by Fluorescent Probes) and sorted into high and low signal populations in each screen corresponding to the top 40% and the bottom 40% of the staining signal distribution, followed by sample preparation for next-generation sequencing.
For each screen sample, genomic DNA was isolated using a Macherey-Nagel Blood L kit (Macherey-Nagel; Cat. No. 740954.20). sgRNA-encoding regions were amplified and sequenced on an Illumina HiSeq- 4000 as previously described4.
Focused secondary screens
The focused secondary screen library contained 2,190 sgRNAs targeting 730 genes that were hits in at least one of the ROS and lipid peroxidation screens with 3 sgRNAs per gene selected based on their phenotypes in the primary screens, and 100 non-targeting control sgRNAs (Supplementary Table 4). A pool of sgRNA-containing oligonucleotides were synthesized by Agilent Technologies and cloned into our optimized sgRNA expression vector as previously described4. CRISPRi-iPSCs were transduced with the batch characterization library, puromycin selected, and differentiated into neurons as for the primary screens. Day10 neurons were stained with FeRhoNox-1 (Goryo Chemical; Cat. No. GC901) or Lysotracker-green (Cell Signaling Technology; Cat. No. 8783S) and sorted into high and low signal populations corresponding to the top 40% and bottom 40% of the staining signal distribution. Screen samples were processed and sequenced by next-generation sequencing as described above.
CROP-seq
For the CROP-seq experiments, we included 184 genes for CRISPRi and 100 genes for CRISPRa, which were hits in at least one of our genome-wide pooled screens and were also associated with human neurodegenerative diseases. We curated a list of genes associated with neurodegenerative diseases based on the literature and the DisGeNET database (https://www.disgenet.org/). The CROP-seq libraries included 2 sgRNAs per gene plus 6 non-targeting control sgRNAs, for a total of 374 sgRNAs for CRISPRi and 206 sgRNAs for CRISPRa (Supplementary Table 4). Top and bottom strands of sgRNA oligos were synthesized (Integrated DNA Technologies) and annealed in an arrayed format. The annealed sgRNAs were then pooled in equal amounts and ligated into our optimized CROP-seq vector3.
The CROP-seq experiments were carried out similarly as previously described3. Briefly, Day 0 CRISPRi and CRISPRa neurons were infected by the corresponding CROP-seq sgRNA library at a MOI of 0.1–0.2, followed by puromycin selection at 4 μg/ml for 3 days and recovery. On Day 10, neurons were dissociated with Papain and approximately 98,000 CRISPRi neurons and 50,000 CRISPRa neurons were loaded into 10X chips with about 25,000 input cells per lane. Sample preparations were performed using the ChromiumNext GEM Single Cell 3ʹ Reagent Kits v3.1 (10X Genomics; Cat. No.PN-1000121) according to the manufacturer’s protocol. To facilitate sgRNA assignment, sgRNA-containing transcripts were additionally amplified by hemi-nested PCR reactions as described3. The sgRNA-enrichment libraries were separately indexed and sequenced as spike-ins alongside the whole- transcriptome scRNA-seq libraries using a NovaSeq 6000 using the following configuration: Read 1: 28, i7 index: 8, i5 index: 0, Read 2: 91.
Cell Staining by Fluorescent Probes
All stains were performed according to manufacturing protocols. For Filipin staining, cells were washed with PBS three times and fixed with 3% paraformaldehyde for 1 hr at room temperature. Cells were then washed 3 times with PBS and incubated with 0.05 mg/ml Filipin III from Streptomyces filipinensis (Sigma; Cat. No. F4767–1MG) in PBS for 2 h at room temperature. Cells were washed with PBS 3 times before analysis. For staining using other live cell probes, cells were washed with PBS and incubated in DMEM containing appropriate concentrations of the probes at 37 °C as detailed below. Cells were washed with PBS before analysis. Concentrations and staining conditions for different probes were as follows: CellRox Green, 2.5 μM for 30 minutes; Lysotracker Green, 50 nM for 5 minutes; FeRhoNox-1, 5 μM for 60 minutes; Liperfluo, 5 μM for 30 minutes; C11-BODIPY, 2.5 μM for 30 minutes; FerroOrange (Dojindo Molecular Technologies, Inc.; Cat. No. F374–10), 1 μM for 30 minutes; Hoechst 33342 (Thermo Fisher Scientific; Cat. No. H3570), 1 μg/ml for 10 minutes; Propidium Iodide (PI)(Thermo Fisher Scientific; Cat. No. P1304MP ), 1 μg/ml for 10 minutes.
Immunofluorescence
Cells were washed with PBS and fixed with 4% paraformaldehyde for 15 min at room temperature. After washing with PBS for 3 times, cells were permeabilized with 0.1% Triton X-100 for 10 min and blocked with 5% normal goat serum with 0.01% Triton X-100 in PBS for 1 hr at room temperature. Cells were then incubated with primary antibodies diluted in blocking buffer at 4 °C overnight. After that, cells were washed with PBS for 3 times and incubated with secondary antibodies diluted in blocking buffer for 1 hr at room temperature. Cells were then washed with PBS for 3 times and stained with 10 μg/ml Hoechst 33342 (Thermo Fisher Scientific; Cat. No. H3570) for 10 min. Cells were imaged using a confocal microscope (Leica SP8) or an IN Cell Analyzer 6000 (GE; Cat. No. 28–9938-51). Primary antibodies used for immunofluorescence in this study were as follows: rabbit anti-PSAP antibody (1:50 dilution; Proteintech; Cat. No. 10801–1-AP), mouse anti-LAMP2 antibody (1:100 dilution; abcam; Cat. No. ab25631), rabbit anti-GM1 antibody (1:20 dilution; abcam; Cat. No. ab23943), rabbit anti-LC3B antibody (1:200 dilution; Cell Signaling Technology; Cat. No. 2775S), chicken anti-TUJ1 antibody (1:500; AVES; Cat. No. TUJ), mouse anti-S100β antibody (1:500; Sigma; Cat. No. S2532), mouse anti-Nestin antibody (1:500; Sigma; Cat. No. MAB5326) and mouse anti-GPR34 antibody (1:50; R&D Systems; Cat. No. MAB4617). Secondary antibodies used in this study were as follows: goat anti-rabbit IgG Alexa Fluor 555 (1:500 dilution; abcam; Cat. No. ab150078), goat anti-mouse IgG Alexa Fluor 488 (1:500 dilution; abcam; Cat. No. ab150113) and goat anti-chicken IgG Alexa Fluor 647 (1:500 dilution; abcam; Cat. No. ab150171).
Drug treatments
Drugs (Z-VAD-FMK (Sigma-Aldrich; Cat. No. V116), Ferrostatin-1 (Sigma-Aldrich; Cat. SML0583), DFO (Sigma-Aldrich; Cat. No. D9533), Pifithrin-α hydrobromide (Tocris; Cat. No. 1267) and cholesterol (complexed with MβCD; Sigma-Aldrich; Cat. No. C4951)) were dissolved in DMSO or water as per manufacturer’s instructions. Drug concentrations were determined according to previous reports. Specifically, 1μM and 10 μM of Z-VAD-FMK141, 1μM and 10 μM of Ferrostatin-1141, 10 μM DFO141, 10 μM Pifithrin-α hydrobromide142 and 10 μg/ml cholesterol143 were used.
Western blots
Cells were lysed in RIPA buffer and 20–30 μg of total proteins were loaded into NuPAGE 4%–12% Bis-Tris Gels (Invitrogen, Cat# NP0336BOX). Subsequently, the gels were transferred onto nitrocellulose membranes and the membranes were blocked by Odyssey Blocking Buffer (PBS) (LI-COR, Cat#927–50000), followed by overnight incubation with primary antibodies at 4°C. After incubation, the membranes were washed three times with TBST and then incubated with secondary antibodies at room temperature for 1 hr. The membranes were then washed 3 times with TBST and once with TBS and imaged on the Odyssey Fc Imaging system (LI-COR Cat# 2800). Digital images were processed and analyzed using ImageJ.
Primary antibodies used were mouse anti-β-Actin antibody (1:2000 dilution; Cell Signaling Technology; Cat. No. 3700), rabbit anti-PSAP antibody (1:1000 dilution; Proteintech; Cat. No. 10801–1-AP) and rabbit anti-LC3B antibody (1:1000 dilution; Cell Signaling Technology; Cat. No. 2775S). Secondary antibodies were IRDye 680RD goat anti-mouse IgG (1:20,000 dilution; LI-COR; Cat. No. 926–68070) and IRDye 800CW goat anti-rabbit IgG(1:20,000 dilution; LI-COR; Cat. No. 926–32211).
Generating the PSAP KO iPSC line
An sgRNA targeting PSAP exon 2 (sgRNA sequence: GGACTGAAAGAATGCACCA) was cloned into plasmid px330-mcherry (px330-mcherry was a gift from Jinsong Li (Addgene plasmid # 98750 ; http://n2t.net/addgene:98750 ; RRID:Addgene_98750)). The plasmid was transfected into WT Ngn2-iPSCs using Lipofectamine Stem (Invitrogen/Thermo Fisher Scientific; Cat. No. STEM00003). Monoclonal lines were isolated in 96-well plates by limiting dilution. One clonal line was selected and frameshift indels were confirmed by Sanger sequencing. Protein level KO was confirmed by western blot and immunofluorescence (Fig. 5c,d). A normal karyotype was confirmed (Cell Line Genetics).
Bulk RNA sequencing
RNA was extracted from cells using the Quick-RNA Miniprep Kit (Zymo; Cat. No. R1054), and 3′-tag RNA-seq was performed by the DNA Technologies and Expression Analysis Core at the UC Davis Genome Center.
Electron Microscopy
Neurons grown on a poly-D-lysine coated 35-mm ibidi μ-Dish (ibidi; Cat. No. 81156) were fixed with 2.5% glutaraldehyde in 0.1 M sodium cacodylate buffer (EMS) for at least an hour at room temperature. Samples were further post-fixed with 1% osmium tetroxide and 1.6% potassium ferrocyanide, later dehydrated in graded series of ethanols, and embedded in epon araldite resin. Samples were then trimmed, 70nm sections were cut using Ultra cut E (Leica) and stained with 2% uranyl acetate and Reynold’s lead citrate. Images were acquired on a FEI Tecnai 12 120KV TEM (FEI) and data was recorded using UltraScan 1000 Digital Micrograph 3 software (Gatan Inc.)
STORM super-resolution microscopy
Sample preparation and STORM imaging were performed as described previously144. Samples were fixed in 3% paraformaldehyde and 0.1% glutaraldehyde (Electron Microscopy Sciences) in PBS (Corning) for 30 minutes at room temperature, followed by reduction with 0.1% NaBH4 in PBS for 10 minutes and three times of washing with PBS. Prior to immunostaining, samples were treated by a blocking buffer (BB) of 3% bovine serum albumin (Sigma) and 0.1% Triton-X100 (Sigma) in PBS for 1 hour at room temperature. Primary antibodies were diluted in BB and labeled at 4C overnight. Unbound antibodies were rinsed three times, 10 minutes each time with a washing buffer (WB) prepared by 10X dilution of BB in PBS. Secondary antibodies Dye-labeled secondary antibodies from Invitrogen or Jackson ImmunoResearch Laboratories were diluted in BB and labeled at room temperature for 1 hour, followed by three times of washing with WB.
Before STORM imaging, the sample was mounted in a standard STORM imaging buffer of 5% [w/v] glucose (Sigma), 0.1 M cysteamine (Sigma), 0.8 mg/mL glucose oxidase (Sigma), and 40 mg/mL catalase (Sigma) in 0.1 M Tris-HCl pH 7.5 (Corning). Two-color STORM was carried out on a custom setup modified from a Nikon Eclipse Ti-E inverted fluorescence microscope145 by sequentially imaging the Alexa Fluor 647-labeled GM1 and the CF568-labeled LAMP2 using 647 nm and 560 nm excitations, respectively. A strong (~2 kW/cm2) excitation laser (647 nm or 560 nm) was applied to photoswitch most of the AF647 or CF568 dye molecules into the dark state while also exciting the remaining dye molecules at a low density for single-molecule localization. A weak (0–1 W/cm2) 405-nm laser was used simultaneously with the 647-nm or 560-nm laser to reactivate dye molecules in the dark state into the emitting state to acquire adequate sampling of the labeled molecules. Images were collected at 110 frames per second with an electron multiplying charge-coupled device camera (Andor iXon Ultra 897) for ~50,000 frames per image.
Untargeted Lipidomics
The untargeted lipidomics experiment and primary analysis were performed by Cayman Chemical. Briefly, lipids were extracted using a methyl‐tert‐butyl ether (MTBE)‐based liquid‐liquid method. Cell pellets (approximately 100 μL in volume) were thawed on ice and transferred into 8-mL screw-cap tubes before adding 600 μL MeOH, the 600 μL MeOH containing 200 ng each of the internal standards TG(15:0/18:1‐d7/15:0), PC(15:0/18:1‐d7), PE(15:0/18:1‐d7), PG(15:0/18:1‐d7), and PI(15:0/18:1‐d7) (EquiSPLASH, Avanti Polar Lipids), and finally 4 mL MTBE. After vigorous vortexing, the samples were incubated at room temperature on a shaker for 1 h. For phase separation, 1 mL water was added, and samples were vortexed and centrifuged for 10 min at 1000 x g. The upper organic phase of each sample was carefully removed using a Pasteur pipette and transferred into a pre‐weighed empty glass tube. The remaining aqueous phase was re-extracted with 2 mL of clean MTBE/methanol/water 10:3:2.5 (v/v/v). The two upper organic phases were combined and dried under vacuum in a SpeedVac concentrator. The dried lipid extracts were weighed and resuspended in 100 μL isopropanol/acetonitrile 1:1 (v/v) for untargeted lipidomic analysis by LC‐MS/MS. Triplicates of samples for WT and PSAP KO neurons were analyzed.
Data analysis
Pooled CRISPR screens
Pooled CRISPR screens were analyzed using the MAGeCK-iNC pipeline as described3. Briefly, raw sequencing reads from next-generation sequencing were cropped and aligned to the reference using Bowtie146 to determine sgRNA counts in each sample. Counts files for samples subject to comparison were entered into the MAGeCK-iNC software3 (kampmannlab.ucsf.edu/mageck-inc). Raw Phenotype scores and significance P values were calculated using MAGeCK-iNC for target genes, as well as for ‘negative-control-quasi-genes’ that were generated by random sampling of 5 with replacement from non-targeting control sgRNAs.
The final Phenotype score for each gene was calculated by subtracting the raw Phenotype score by the median of ‘negative-control-quasi-genes’ and then dividing it by the standard deviation of ‘negative-control-quasi-genes’.
A ‘Gene score’ was defined as the product of Phenotype score and –log10(Pvalue). Hit genes were determined based on Gene score cutoff corresponding to an empirical false discovery rate (FDR) of 5%.
CROP-seq
CROP-seq analysis was performed similarly to previously described3. Cellranger (version 3.1.0,10X Genomics) with default parameters was used to align reads and generate digital expression matrices from single-cell sequencing data.
Approximately 58,000 CRISPRi neurons and 38,000 CRISPRa neurons were detected. The mean reads per cell was around 48,000 for CRISPRi and 36,000 for CRISPRa. The median number of genes detected per cell was around 4,341 for CRISPRi and 3,100 for CRISPRa.
sgRNA-enrichment libraries were analyzed using methods previously described147 to obtain sgRNA UMI counts for each cell barcode. For a given cell, sgRNA(s) whose UMI counts were greater than 4 standard deviations of the mean UMI counts of all sgRNAs were assigned to that cell as its identity. Single sgRNAs could be assigned to about 35,000 CRISPRi cells and about 21,000 CRISPRa cells, which were retained for further analysis (Supplementary Table 5)
The Scanpy package148 (version 1.4.6) implemented in Python was used for downstream analysis of the digital expression matrices with mapped sgRNA identities. To ensure data quality, a stringent criterion was applied to filter cells based on the number of genes detected (> 2000 for CRISPRi and > 1500 for CRISPRa) and percentage of mitochondrial transcript counts (< 0.15%). Genes that had less than 0.5 UMIs on average in all perturbation groups were filtered out.
Within the population of cells expressing sgRNAs for a specific target gene, the levels of target knockdown or overexpression were heterogeneous in some cases. This could be due to different efficiencies of the two sgRNAs targeting that gene (see Extended Data Fig. 4a for an example), misassignment of sgRNA identities for some cells or stochastic silencing of the CRISPR machinery in some cells. To select cells in which functional perturbations happened, we leveraged an unsupervised outlier detection method based on the local outlier factor (LOF) using the LocalOutlierFactor function in the Python package scikit-learn (version 0.23.0). A similar strategy was described previously79. Specifically, for every target gene, we selected two populations of cells, including one population of cells that were mapped with sgRNAs targeting that gene (i.e. perturbed group) and another population of cells that were mapped with non-targeting control sgRNAs (i.e. control group). We then identified differentially expressed genes (DEGs) between the two populations by t-tests at p < 0.05. A gene-expression matrix containing only expression of DEGs in cells from the two populations was generated and principal component analysis (PCA) was performed to reduce the matrix to 4 dimensions. Cells in the control group in the 4-dimensional space were used as the training set to fit a LocalOutlierFactor model. Then, the model was used to determine whether a cell in the perturbed group was an ‘outlier’ based on the extent it deviated from the controls. The ‘outliers’ were considered as cells in which functional perturbations occurred and were retained for downstream analysis. This classification method was particularly useful for CRISPRi when the basal expression level of the target gene was too low to be detected by single-cell RNA-seq thus did not allow selecting cells based on knockdown level of target gene (see Extended Data Fig. 4b for an example).
DEGs for each perturbation group compared to the control group were then determined by t-tests using the diffxpy package in Python.
A mean gene-expression matrix was generated for different perturbation groups (including the control group) by averaging the normalized expression profile of all cells within that group. This matrix was used for weighted correlation network analysis (WGCNA) using the WGCNA package88 (version 1.69) implemented in R. The blockwiseModules function was used to detect gene modules that were co-regulated in different perturbation groups and to determine eigengene expression of each module in each perturbation group. Relative eigengene expression values were calculated by subtracting the eigengene expression value of each module in the control group from that in each perturbation group.
RNA-seq
Raw sequencing reads from 3′-tag RNA-seq were mapped to the human reference transcriptome (GRCh38, Ensembl Release 97) using Salmon149 (v.0.14.139) with the ‘–noLengthCorrection’ option to obtain transcript abundance counts. Gene-level count estimates were obtained using tximport150 (v.1.8.040) with default settings. Subsequently, genes with more than 10 counts were retained for differential gene-expression analysis, and adjusted P values (Padj) were calculated using DESeq2151 (v.1.20.041).
Pathway enrichment analysis
Gene Ontology (GO) term and Wikipathways enrichment analysis was performed using WebGestalt (WEB-based Gene SeT AnaLysis Toolkit) using the over-representation analysis (ORA) method152.
Lipidomics
Lipostar software (Molecular Discovery) was used for feature detection, noise and artifact reduction, alignment, normalization, and lipid identification. For each lipid, the log2-fold change and a significance P value by t-test were determined by comparing the abundances of that lipid in WT and PSAP KO neurons (samples in triplicates). The Benjamini-Hochberg (BH) method was used to correct for multiple hypothesis testing.
Data commons development
CRISPRbrain (https://crisprbrain.org) was developed as an open-access and cloud-based platform striving to make data and code easily accessible to the scientific community. To enable scientific transparency and replication, each dataset in CRISPRbrain is licensed under a Creative Commons Attribution 4.0 International License (CC BY 4.0). To handle a large volume of storage and computation demand, CRISPRbrain is deployed on the cloud with elastic resource allocation. We have prioritized a low-latency interactive user experience by pre-computing and caching complex queries. CRISPRbrain is implemented in a manner that is “future-proof”, supporting scalability and addition of more complex features.
Extended Data
Extended Data Fig. 1: Karyotyping of the monoclonal CRISPRa-iPSC line, and analysis of CRISPRi and CRISPRa hits.
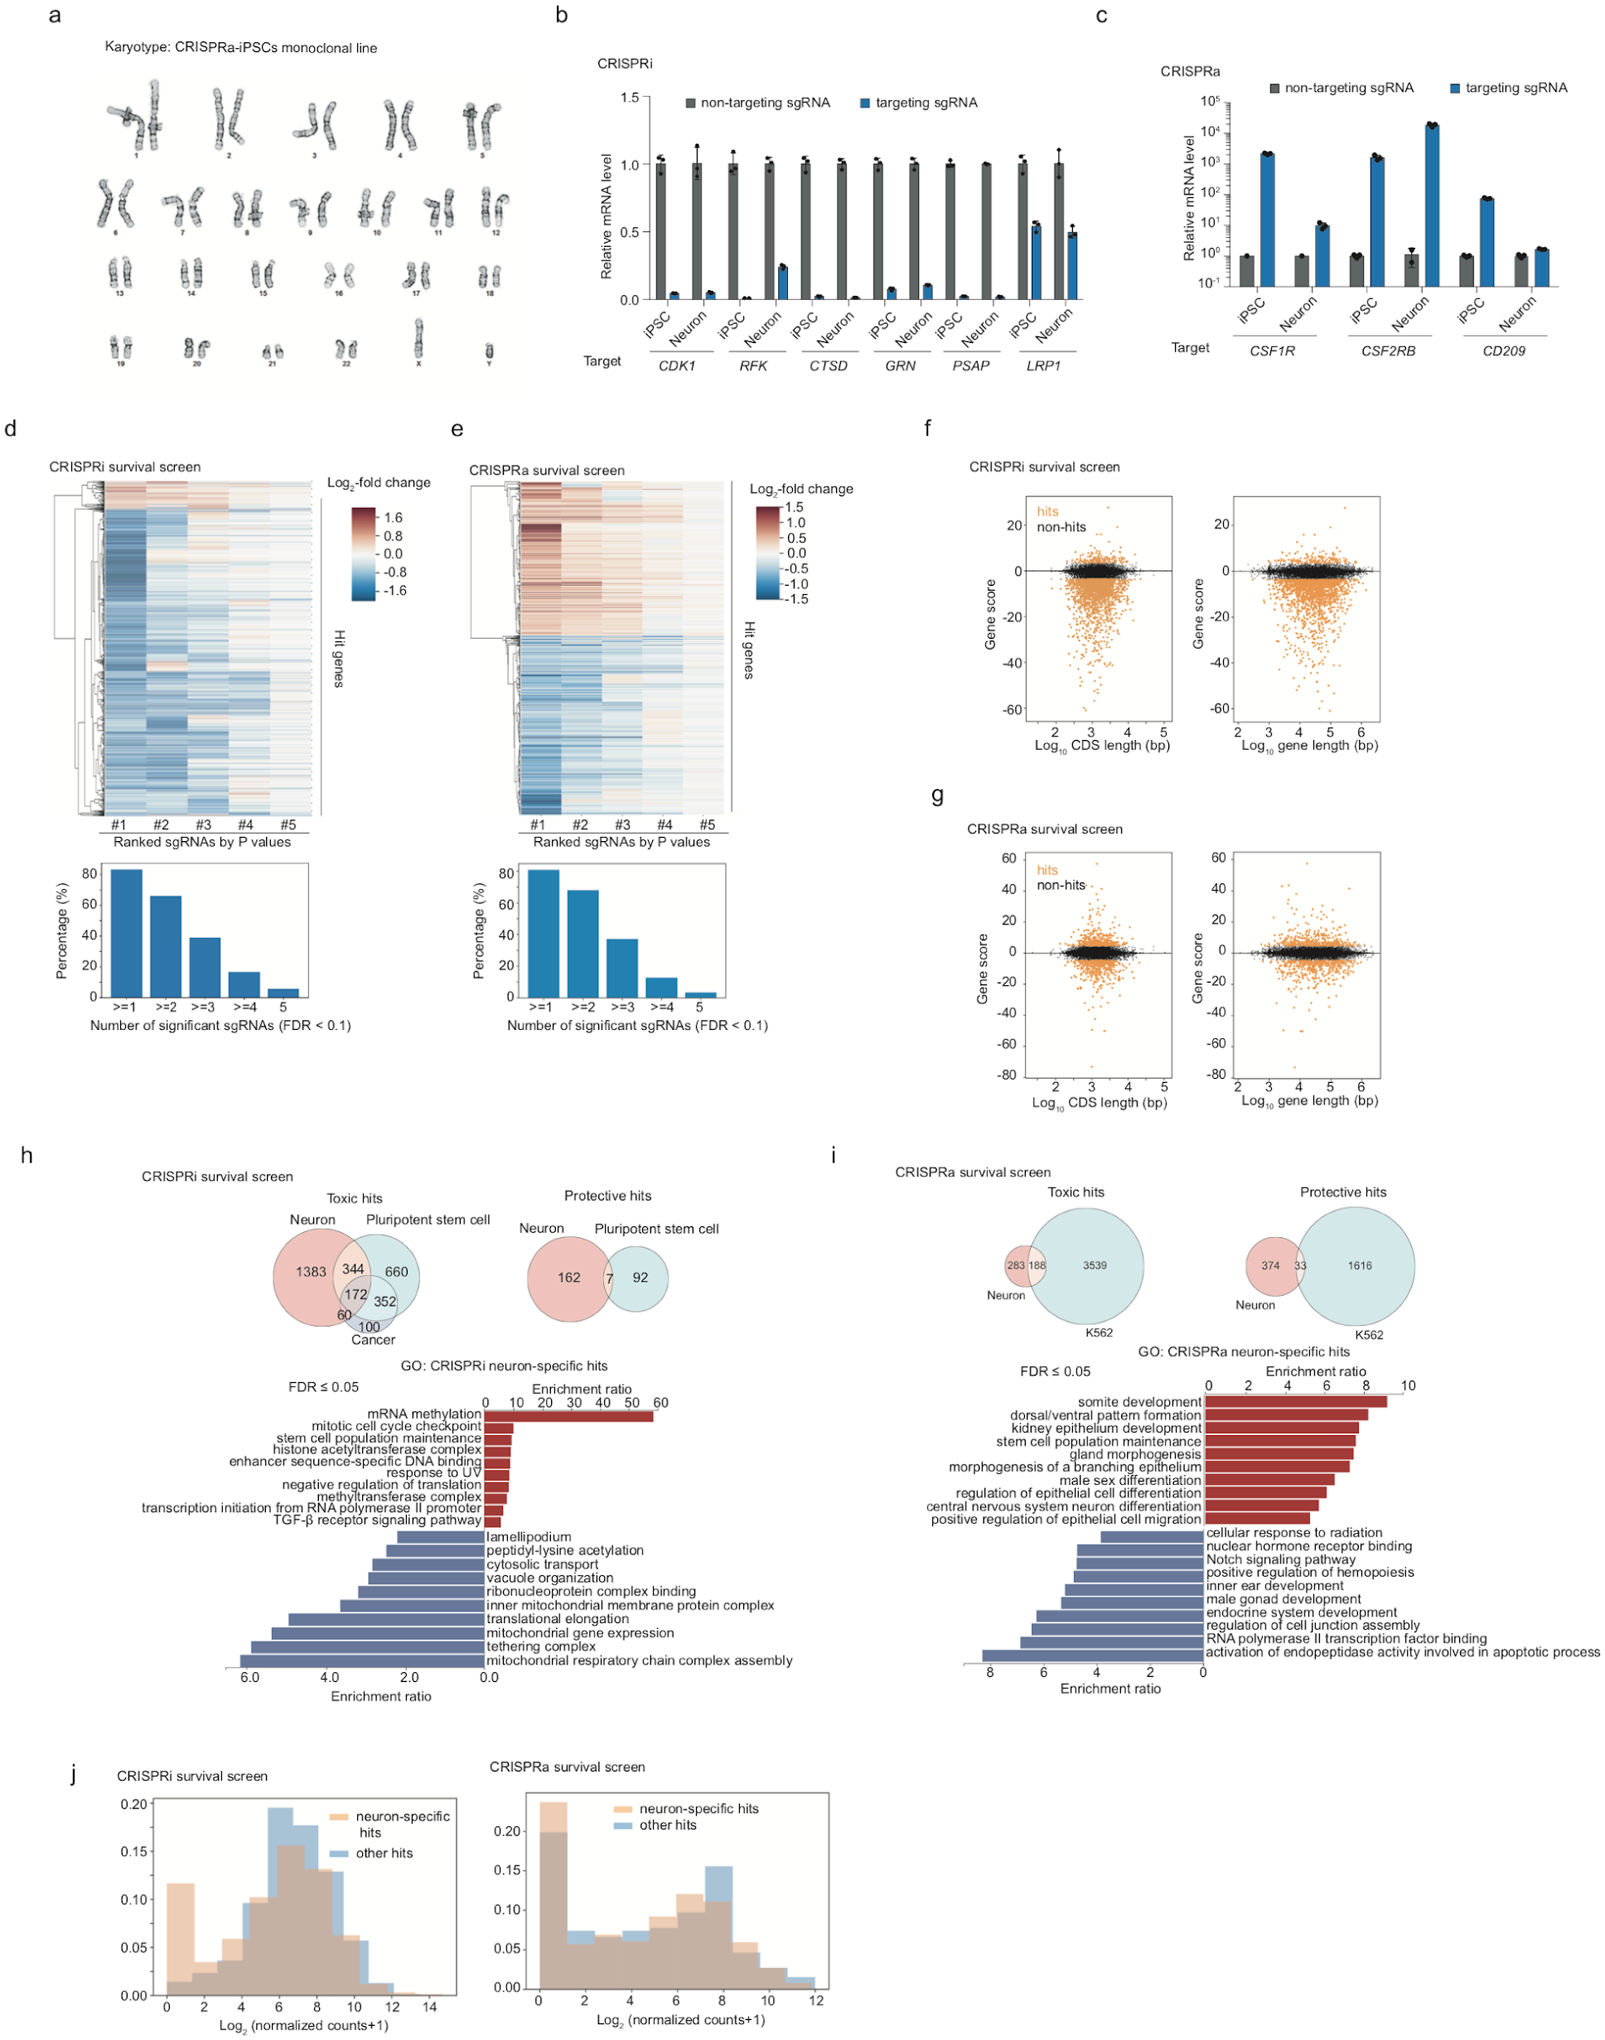
(a) A normal karyotype was confirmed for the monoclonal CRISPRa-iPSC line.
(b,c) Comparison of CRISPRi (b) and CRISPRa (c) efficacy in iPSCs and iPSC-derived neurons. The relative mRNA level of each targeted gene was calculated as the ratio of its expression in cells expressing a targeting sgRNA as compared to a non-targeting control sgRNA measured by qPCR (mean +/s sd, n = 3 technical replicates). The housekeeping gene ACTB was used for normalization.
(d,e) Top, heatmaps showing phenotype scores (Log2-fold change) of all 5 sgRNAs (x-axis) targeting each hit gene (y-axis) from the primary CRISPRi (left) and CRISPRa (right) survival screens. The five sgRNAs targeting a given gene are ranked by the significance of their P values and are shown from left to right. Bottom, bar graphs summarizing the percentage of hit genes that have a certain number of sgRNAs (x-axis) showing a significant phenotype (false discovery rate (FDR) < 0.1) in CRISPRi (left) and CRISPRa (right) survival screens.
(f,g) Scatter plots showing the relationship between Gene Score and gene coding sequence (CDS) length (left) or gene length (right) for genome-wide CRISPRi (f) and CRISPRa (g) survival screens.
(h, i) Top: Venn diagrams comparing CRISPRi (h) and CRISPRa (i) screen results for neuronal survival from this paper with other published survival screens for different human cell types. For CRISPRi, hit genes with toxic phenotypes for the survival of neurons were compared with those for cancer cells (‘gold-standard’ essential genes14 ) and pluripotent stem cells11–13 (genes that were identified as essential in more than one studies were retained for comparison). Protective hits for the survival of neurons were compared with those for human pluripotent stem cells11,12 (genes that were identified as essential in both studies were retained for comparison). For CRISPRa, hits were compared with our published survival screen in K562 cells10 reanalyzed using our MAGeCK-iNC pipeline. Bottom: Gene Ontology (GO) term enrichment analysis was conducted for hits resulting in increased survival (red) or decreased survival (blue); terms are shown up to an FDR of 0.05.
(j) Neuronal expression levels of neuron-specific hit genes and other hit genes from CRISPRi (top) and CRISPRa (bottom) screens are shown, binned by order of magnitude.
Extended Data Fig. 2: Comparing CRISPRa survival screens in +AO and -AO conditions.
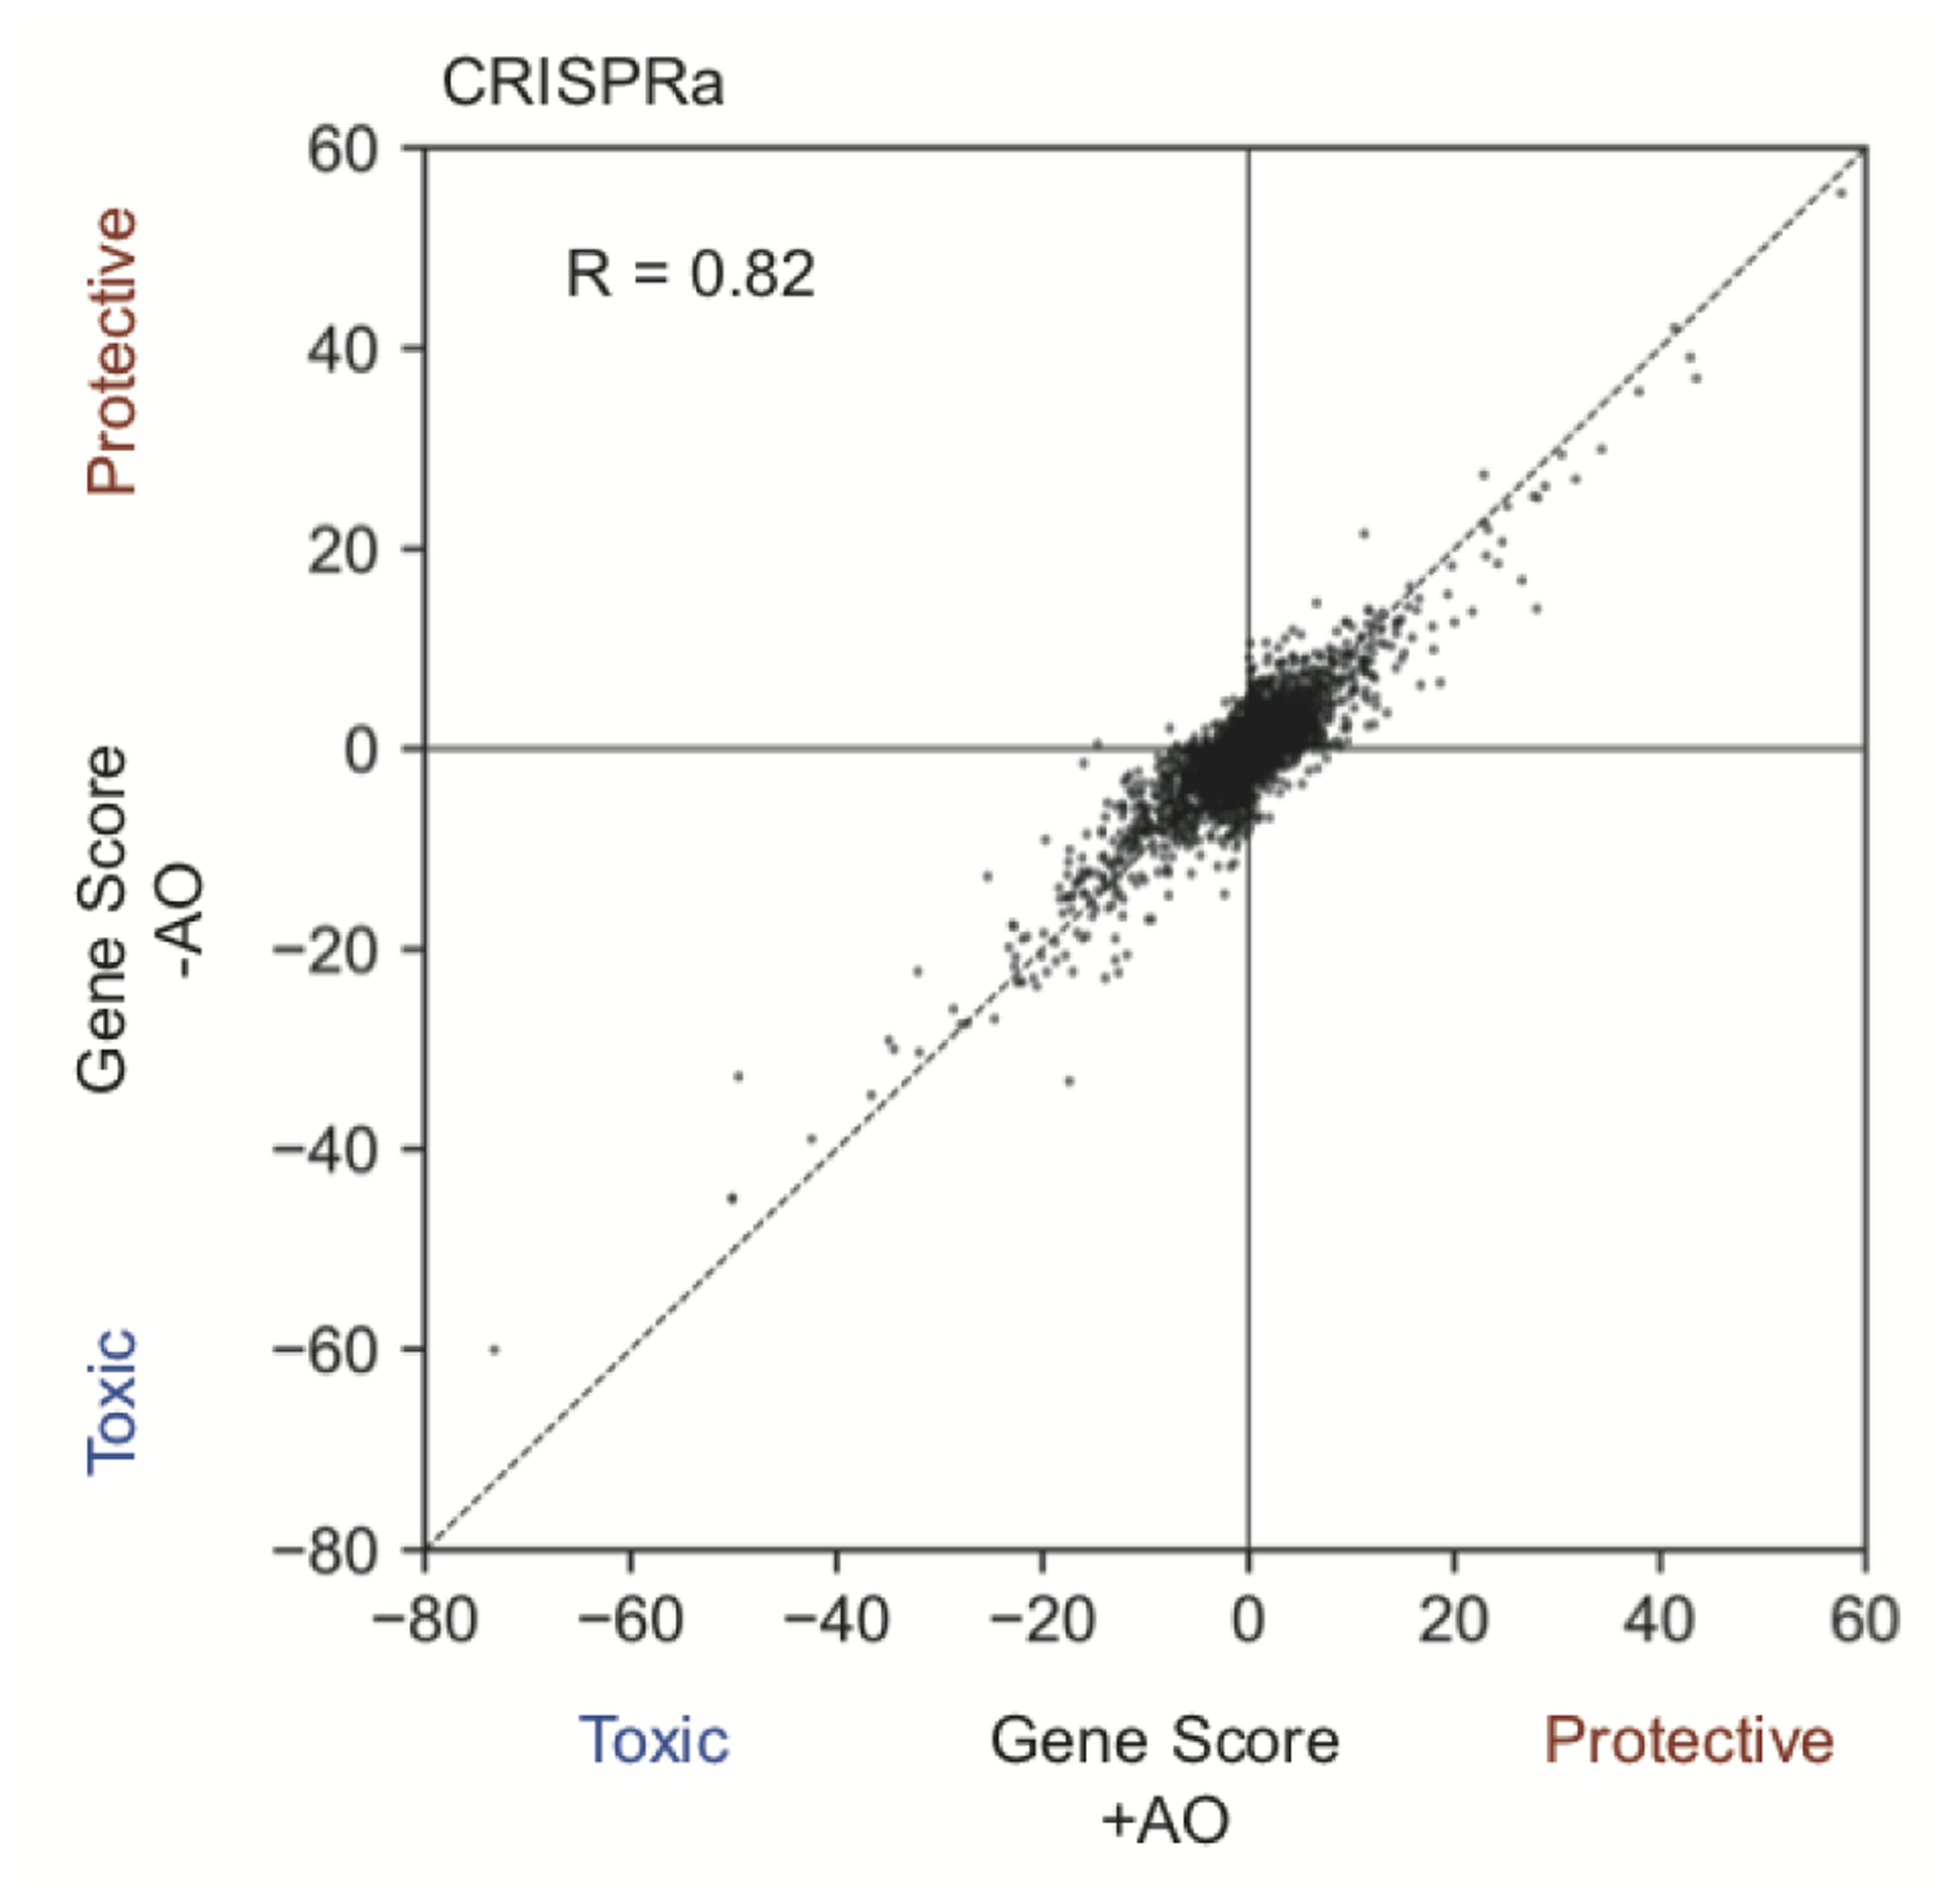
Each dot represents one gene, and its Gene Score in the +AO screen was plotted on the x-axis and Gene Score in the -AO screen on the y-axis. The Pearson correlation coefficient is shown.
Extended Data Fig. 3: Characterization of PSAP KO in other cell types.
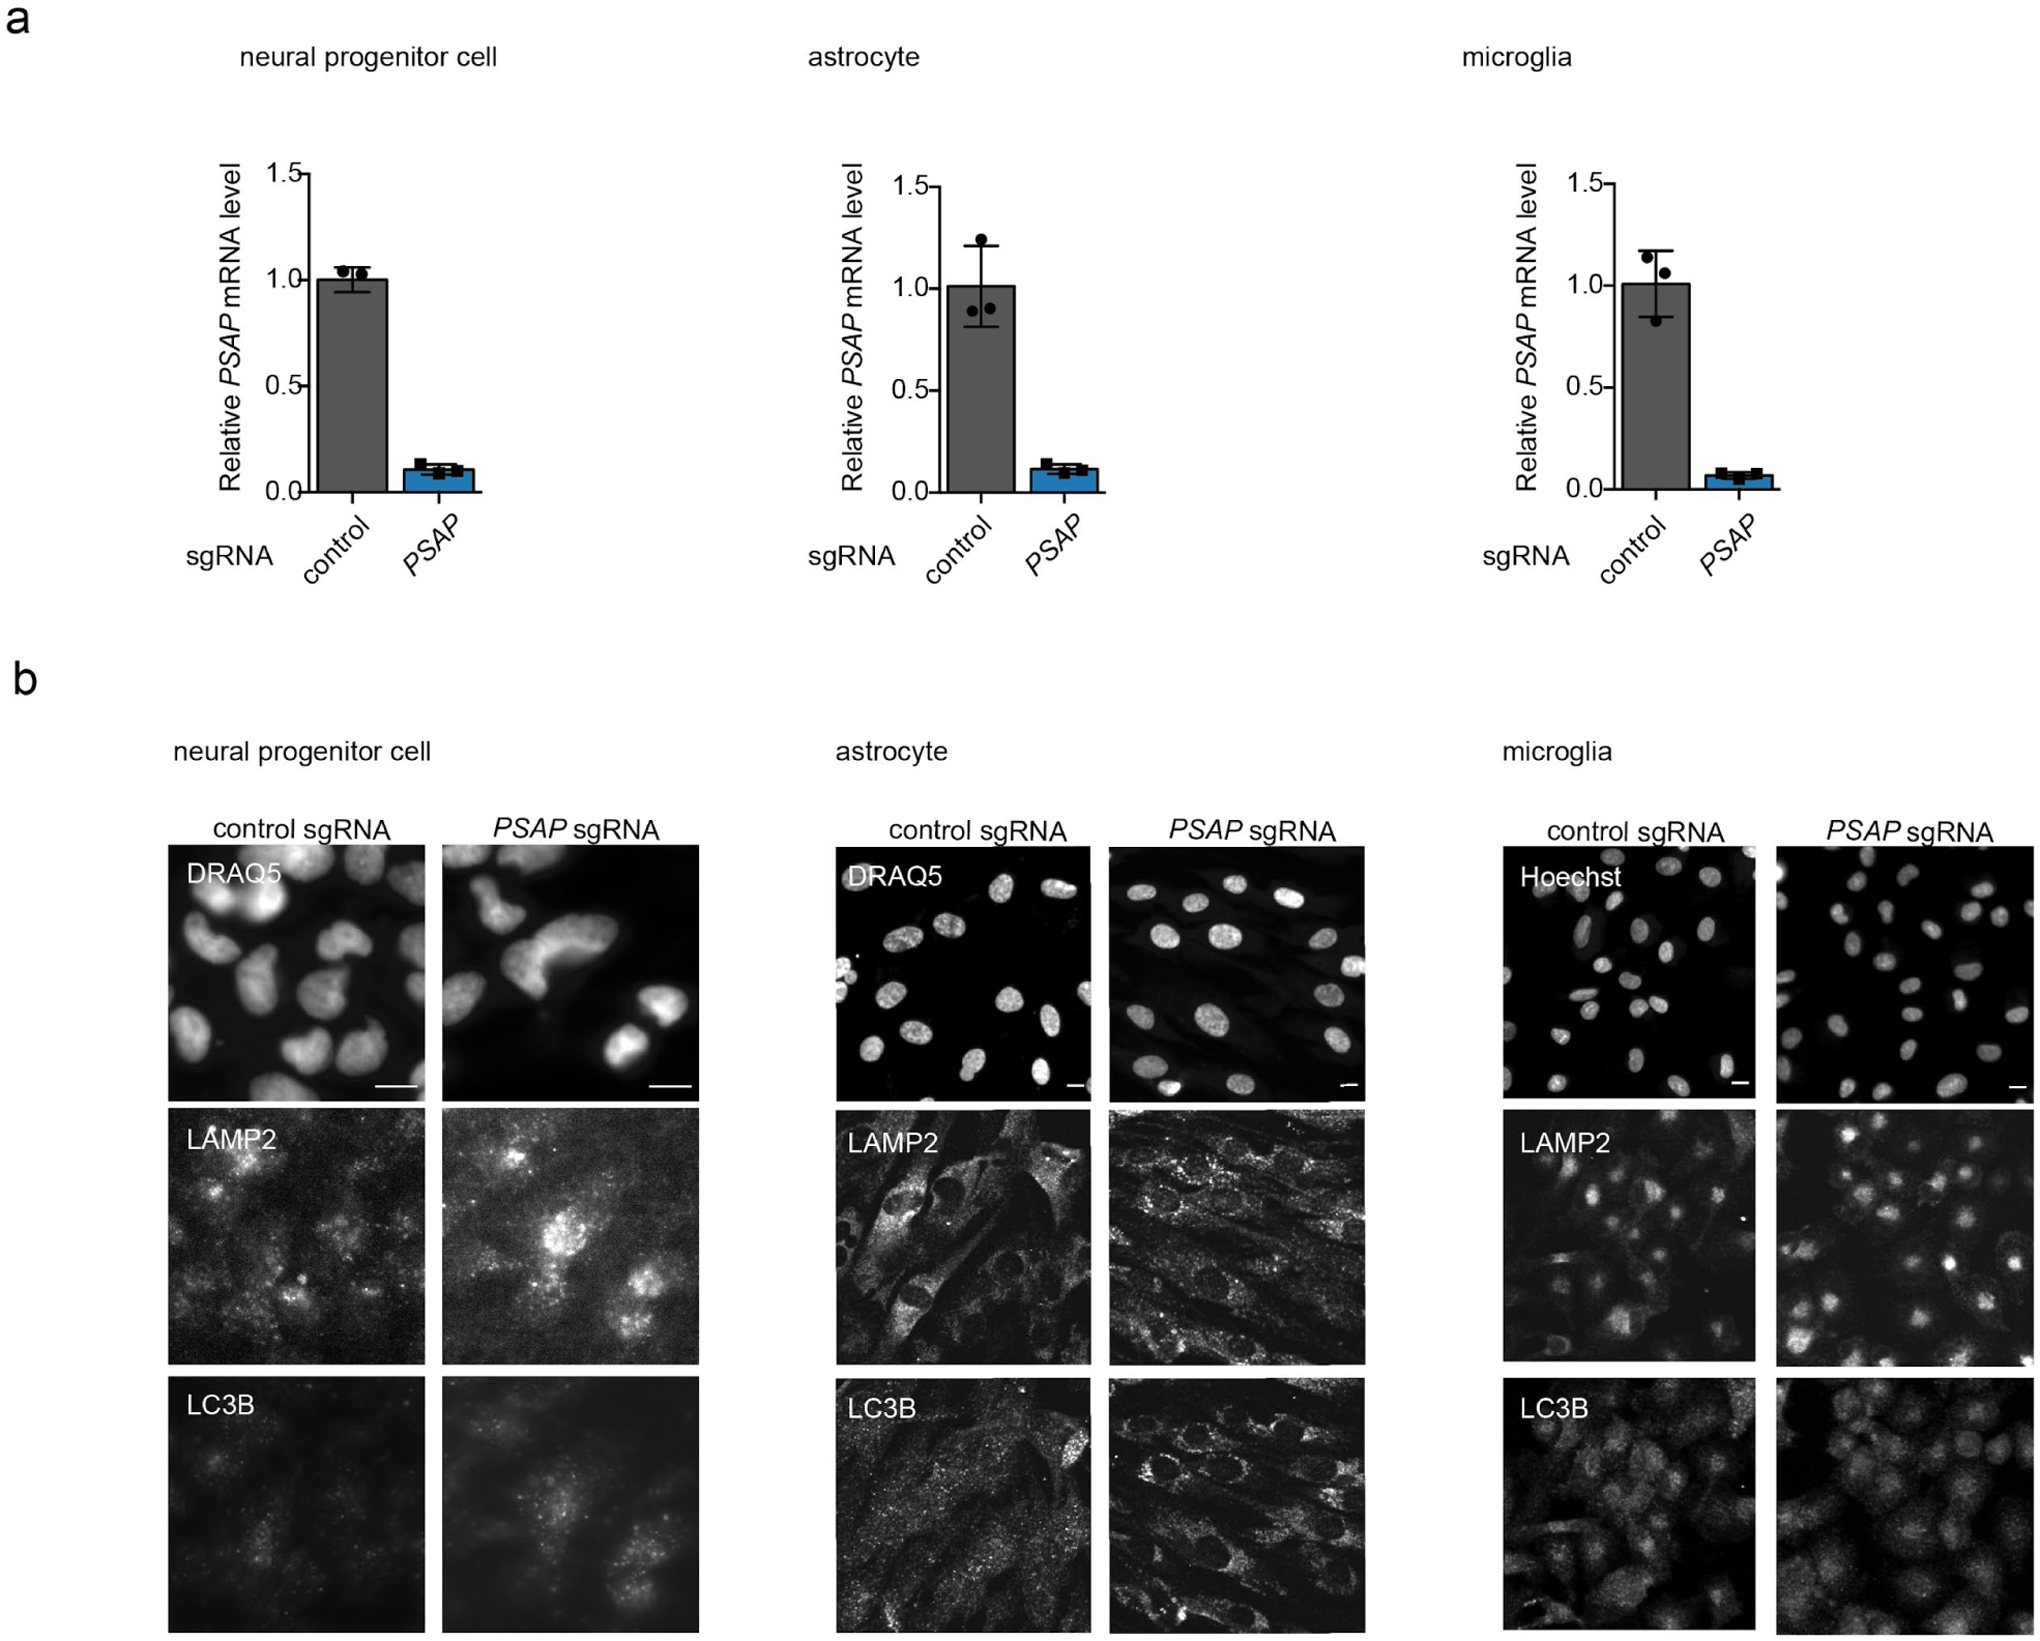
(a) qPCR validation of PSAP knockdown in neural progenitor cells (left), astrocytes (middle) and microglia (right) diffentiated from CRISPRi iPSCs expression a PSAP sgRNA as compared to a non-targeting control sgRNA (mean +/s sd, n = 3 technical replicates). The housekeeping gene ACTB was used for normalization.
(b) Representative fluorescence microscopy images for neural progenitor cells (left), astrocytes (middle) and microglia (right) diffentiated from CRISPRi iPSCs expression a non-targeting sgRNA or a PSAP sgRNA, stained with LAMP2 and LC3B antibodies. DRAQ5 was used for nuclear staining. Scale bar, 10 μm.
Extended Data Fig. 4. Examples of the CROP-seq classification method, and shared transcriptomic signatures of VPS54, PAXIP1, and PON2 knockdown in human iPSC-derived neurons.
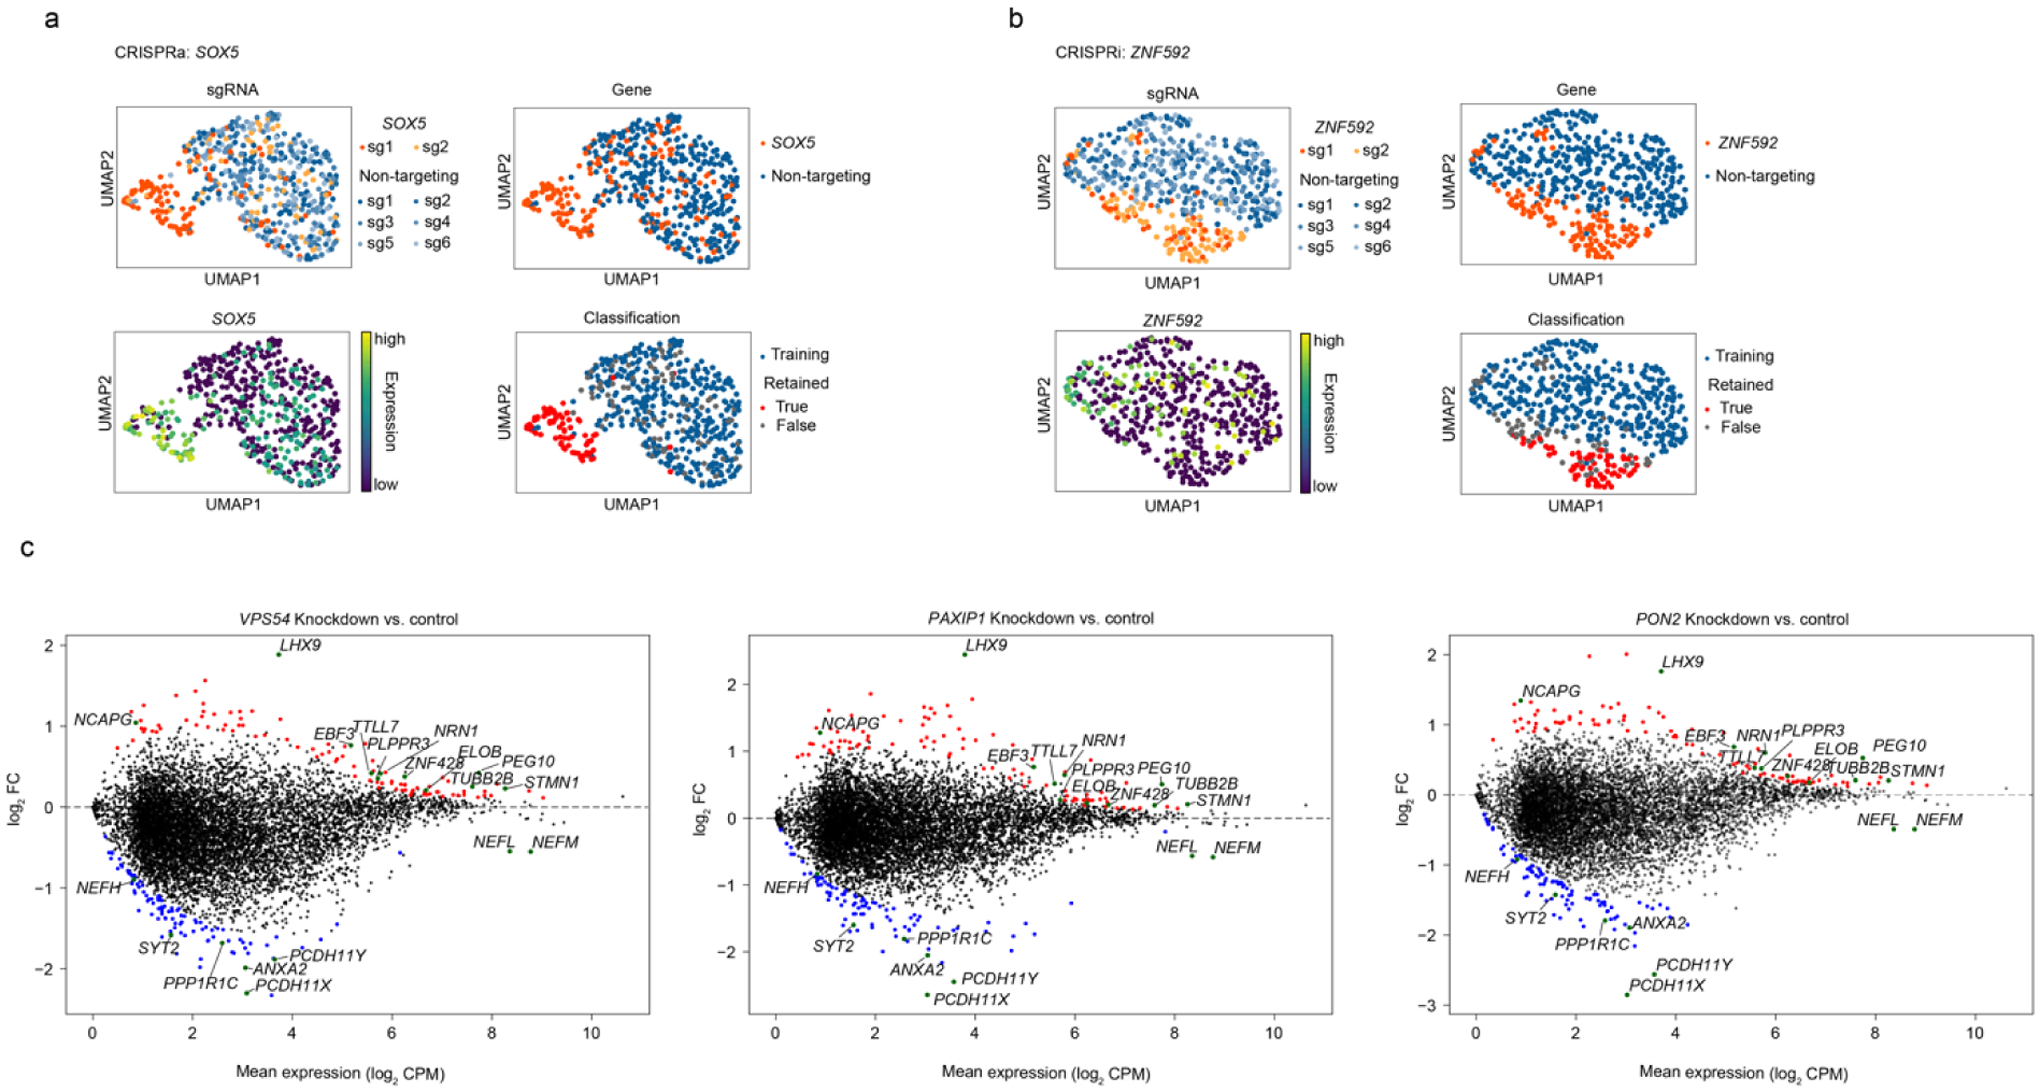
(a,b) CROP-seq examples showing the application of the outlier detection-based classification method in cases where two sgRNAs targeting the same gene had heterogeneous efficacy (a, SOX5 in CRISPRa) or the expression level of the target gene was too low to quantify knockdown level (b, ZNF592 in CRISPRi).
(c) Transcriptomic changes induced by knockdown of VPS54 (left), PAXIP1 (middle), and PON2 (right) in neurons. For each perturbation, the top 200 upregulated and downregulated genes compared to control (i.e. unperturbed cells) are shown in red and blue, respectively. Within this set, shared genes among all three perturbations are highlighted in green.
Supplementary Material
Supplementary Table 1: Screen results for primary and pooled validation screens
Screens were analyzed using the MAGeCK-iNC pipeline (see Methods for details). Hit class values of 1, −1 or 0 were assigned to hit genes with positive Phenotype scores, hit genes with negative Phenotype scores or non-hits, respectively. Each screen is provided in a separate tab.
Supplementary Table 2: Hit class info for Fig2g
This table shows the hit class info for genes in each screen in Fig2g. Hit class values of 1, −1 or 0 were assigned to hit genes with positive Phenotype scores, hit genes with negative Phenotype scores or non-hits, respectively.
Supplementary Table 3: Untargeted lipidomics data for WT and PSAP KO neurons
Untargeted lipidomics data for WT and PSAP KO neurons. P values were calculated using Student’s t-test and were corrected for multiple testing using the Benjamini-Hochberg method.
Supplementary Table 4: sgRNA sequences for pooled validation and CROP-seq libraries
These tables show the protospacer sequences for sgRNAs in the pooled validation and CROP-seq libraries. Each library is provided in a separate tab. sgRNA information for the genome-wide libraries was previously published10.
Supplementary Table 5: sgRNA cell counts for CROP-seq screens
These tables summarize the number of cells for sgRNAs in the CRISPRi and CRISPRa CROP-seq screens. First tab: CRISPRi, second tab: CRISPRa.
Acknowledgements
We thank Li Gan, Bruce Conklin for support and advice; Paul Kennedy and Anna Nummy at Cayman Chemical for untargeted lipidomics; Eric Chow (UCSF), Derek Bogdanoff (UCSF), Angela Detweiler (CZI Biohub), Norma Neff (CZI Biohub) and Michelle Tan (CZI Biohub) for next-generation sequencing; Avi Samelson and Xiaoyan Guo for comments on this manuscript; and Kun Leng, Emmy Li and James Olzmann for discussions. We thank the staff at the University of California Berkeley Electron Microscope Laboratory for advice and assistance in electron microscopy sample preparation and data collection. This research was supported by the Intramural Research Program of the NIH/NINDS, an NIH Director’s New Innovator Award (NIH/ NIGMS DP2 GM119139 to M.K.), NIH/NIA grants (R01 AG062359 and R56 AG057528 to M.K., F30 AG066418 to K.L.), the NINDS Tau Center Without Walls (NIH/NINDS U54 NS100717 to M.K.), an Allen Distinguished Investigator Award to M.K. (Paul G. Allen Family Foundation, to M.K.), a Chan-Zuckerberg Biohub Investigator Award (to M.K.), and a Tau Consortium Investigator Award (Rainwater Charitable Foundation, to M.K.). K.X. is a Chan Zuckerberg Biohub investigator and acknowledges support from the National Institute of General Medical Sciences of the National Institutes of Health (DP2GM132681). A. B. S.’s participation was supported in part by the Intramural Research Program of the National Institute on Aging, National Institutes of Health, part of the Department of Health and Human Services (project number ZIA AG000957-16). CRISPRbrain development was supported in part by a collaboration between the Kampmann Lab, UCSF and Data Tecnica International, LLC.
Footnotes
Declaration of interests
M.K. has filed a patent application related to CRISPRi and CRISPRa screening (PCT/US15/40449) and serves on the Scientific Advisory Board of Engine Biosciences, Casma Therapeutics, and Cajal Neuroscience.
Data availability
All screen datasets are publicly available on the CRISPRbrain website (http://crisprbrain.org/).
The accession number for the RNA sequencing datasets reported in this paper is GEO: GSE152988 (https://www.ncbi.nlm.nih.gov/geo/query/acc.cgi?acc=GSE152988).
Code availability
All data analyses were performed using published computational pipelines and standard python/R packages as described in the Methods section. Original codes are available upon request.
References
- 1.Regev A et al. The human cell atlas. elife 6, (2017). [DOI] [PMC free article] [PubMed] [Google Scholar]
- 2.Tazir M, Hamadouche T, Nouioua S, Mathis S & Vallat J-M Hereditary motor and sensory neuropathies or Charcot-Marie-Tooth diseases: an update. J. Neurol. Sci 347, 14–22 (2014). [DOI] [PubMed] [Google Scholar]
- 3.Tian R et al. CRISPR Interference-Based Platform for Multimodal Genetic Screens in Human iPSC-Derived Neurons. Neuron 104, 239–255.e12 (2019). [DOI] [PMC free article] [PubMed] [Google Scholar]
- 4.Gilbert LA et al. Genome-scale CRISPR-mediated control of gene repression and activation. Cell 159, 647–661 (2014). [DOI] [PMC free article] [PubMed] [Google Scholar]
- 5.Kampmann M CRISPR-based functional genomics for neurological disease. Nat. Rev. Neurol 16, 465–480 (2020). [DOI] [PMC free article] [PubMed] [Google Scholar]
- 6.Finkel T & Holbrook NJ Oxidants, oxidative stress and the biology of ageing. Nature 408, 239–247 (2000). [DOI] [PubMed] [Google Scholar]
- 7.Barnham KJ, Masters CL & Bush AI Neurodegenerative diseases and oxidative stress. Nat. Rev. Drug Discov 3, 205–214 (2004). [DOI] [PubMed] [Google Scholar]
- 8.Weltner J et al. Human pluripotent reprogramming with CRISPR activators. Nat. Commun 9, 2643 (2018). [DOI] [PMC free article] [PubMed] [Google Scholar]
- 9.Wang C et al. Scalable Production of iPSC-Derived Human Neurons to Identify Tau-Lowering Compounds by High-Content Screening. Stem Cell Reports 9, 1221–1233 (2017). [DOI] [PMC free article] [PubMed] [Google Scholar]
- 10.Horlbeck MA et al. Compact and highly active next-generation libraries for CRISPR-mediated gene repression and activation. elife 5, (2016). [DOI] [PMC free article] [PubMed] [Google Scholar]
- 11.Yilmaz A, Peretz M, Aharony A, Sagi I & Benvenisty N Defining essential genes for human pluripotent stem cells by CRISPR-Cas9 screening in haploid cells. Nat. Cell Biol 20, 610–619 (2018). [DOI] [PubMed] [Google Scholar]
- 12.Ihry RJ et al. Genome-Scale CRISPR Screens Identify Human Pluripotency-Specific Genes. Cell Rep 27, 616–630.e6 (2019). [DOI] [PubMed] [Google Scholar]
- 13.Mair B et al. Essential gene profiles for human pluripotent stem cells identify uncharacterized genes and substrate dependencies. Cell Rep 27, 599–615.e12 (2019). [DOI] [PubMed] [Google Scholar]
- 14.Hart T et al. Evaluation and Design of Genome-Wide CRISPR/SpCas9 Knockout Screens. G3 (Bethesda) 7, 2719–2727 (2017). [DOI] [PMC free article] [PubMed] [Google Scholar]
- 15.Colacurcio DJ & Nixon RA Disorders of lysosomal acidification-The emerging role of v-ATPase in aging and neurodegenerative disease. Ageing Res. Rev 32, 75–88 (2016). [DOI] [PMC free article] [PubMed] [Google Scholar]
- 16.Dandage R & Landry CR Paralog dependency indirectly affects the robustness of human cells. Mol. Syst. Biol 15, e8871 (2019). [DOI] [PMC free article] [PubMed] [Google Scholar]
- 17.Unsain N, Higgins JM, Parker KN, Johnstone AD & Barker PA XIAP regulates caspase activity in degenerating axons. Cell Rep 4, 751–763 (2013). [DOI] [PubMed] [Google Scholar]
- 18.Tsang AHK et al. S-nitrosylation of XIAP compromises neuronal survival in Parkinson’s disease. Proc Natl Acad Sci USA 106, 4900–4905 (2009). [DOI] [PMC free article] [PubMed] [Google Scholar]
- 19.Kügler S et al. The X-linked inhibitor of apoptosis (XIAP) prevents cell death in axotomized CNS neurons in vivo. Cell Death Differ 7, 815–824 (2000). [DOI] [PubMed] [Google Scholar]
- 20.Xu D et al. Attenuation of ischemia-induced cellular and behavioral deficits by X chromosome-linked inhibitor of apoptosis protein overexpression in the rat hippocampus. J. Neurosci 19, 5026–5033 (1999). [DOI] [PMC free article] [PubMed] [Google Scholar]
- 21.Schulz A et al. The stress-responsive gene GDPGP1/mcp-1 regulates neuronal glycogen metabolism and survival. J. Cell Biol 219, (2020). [DOI] [PMC free article] [PubMed] [Google Scholar]
- 22.Le Pichon CE et al. Loss of dual leucine zipper kinase signaling is protective in animal models of neurodegenerative disease. Sci. Transl. Med 9, (2017). [DOI] [PubMed] [Google Scholar]
- 23.Chen X et al. Antiapoptotic and trophic effects of dominant-negative forms of dual leucine zipper kinase in dopamine neurons of the substantia nigra in vivo. J. Neurosci 28, 672–680 (2008). [DOI] [PMC free article] [PubMed] [Google Scholar]
- 24.Welsbie DS et al. Functional genomic screening identifies dual leucine zipper kinase as a key mediator of retinal ganglion cell death. Proc Natl Acad Sci USA 110, 4045–4050 (2013). [DOI] [PMC free article] [PubMed] [Google Scholar]
- 25.Smith CD et al. Excess brain protein oxidation and enzyme dysfunction in normal aging and in Alzheimer disease. Proc Natl Acad Sci USA 88, 10540–10543 (1991). [DOI] [PMC free article] [PubMed] [Google Scholar]
- 26.Hensley K et al. Brain regional correspondence between Alzheimer’s disease histopathology and biomarkers of protein oxidation. J. Neurochem 65, 2146–2156 (1995). [DOI] [PubMed] [Google Scholar]
- 27.Yao Y et al. Enhanced brain levels of 8,12-iso-iPF2alpha-VI differentiate AD from frontotemporal dementia. Neurology 61, 475–478 (2003). [DOI] [PubMed] [Google Scholar]
- 28.Dalfó E et al. Evidence of oxidative stress in the neocortex in incidental Lewy body disease. J. Neuropathol. Exp. Neurol 64, 816–830 (2005). [DOI] [PubMed] [Google Scholar]
- 29.Subbarao KV, Richardson JS & Ang LC Autopsy samples of Alzheimer’s cortex show increased peroxidation in vitro. J. Neurochem 55, 342–345 (1990). [DOI] [PubMed] [Google Scholar]
- 30.Yang WS et al. Regulation of ferroptotic cancer cell death by GPX4. Cell 156, 317–331 (2014). [DOI] [PMC free article] [PubMed] [Google Scholar]
- 31.Wang C et al. Elevated p62/SQSTM1 determines the fate of autophagy-deficient neural stem cells by increasing superoxide. J. Cell Biol 212, 545–560 (2016). [DOI] [PMC free article] [PubMed] [Google Scholar]
- 32.Taguchi K et al. Keap1 degradation by autophagy for the maintenance of redox homeostasis. Proc Natl Acad Sci USA 109, 13561–13566 (2012). [DOI] [PMC free article] [PubMed] [Google Scholar]
- 33.Bensaad K, Cheung EC & Vousden KH Modulation of intracellular ROS levels by TIGAR controls autophagy. EMBO J 28, 3015–3026 (2009). [DOI] [PMC free article] [PubMed] [Google Scholar]
- 34.Reho JJ, Guo D-F & Rahmouni K Mechanistic target of rapamycin complex 1 signaling modulates vascular endothelial function through reactive oxygen species. J. Am. Heart Assoc 8, e010662 (2019). [DOI] [PMC free article] [PubMed] [Google Scholar]
- 35.Shin YJ et al. Rapamycin reduces reactive oxygen species in cultured human corneal endothelial cells. Curr. Eye Res 36, 1116–1122 (2011). [DOI] [PubMed] [Google Scholar]
- 36.Nacarelli T, Azar A & Sell C Inhibition of mTOR Prevents ROS Production Initiated by Ethidium Bromide-Induced Mitochondrial DNA Depletion. Front Endocrinol (Lausanne) 5, 122 (2014). [DOI] [PMC free article] [PubMed] [Google Scholar]
- 37.Delgado-Camprubi M, Esteras N, Soutar MP, Plun-Favreau H & Abramov AY Deficiency of Parkinson’s disease-related gene Fbxo7 is associated with impaired mitochondrial metabolism by PARP activation. Cell Death Differ 24, 120–131 (2017). [DOI] [PMC free article] [PubMed] [Google Scholar]
- 38.Hocsak E et al. PARP inhibition protects mitochondria and reduces ROS production via PARP-1-ATF4-MKP-1-MAPK retrograde pathway. Free Radic. Biol. Med 108, 770–784 (2017). [DOI] [PubMed] [Google Scholar]
- 39.Ou Y, Wang S-J, Li D, Chu B & Gu W Activation of SAT1 engages polyamine metabolism with p53-mediated ferroptotic responses. Proc Natl Acad Sci USA 113, E6806–E6812 (2016). [DOI] [PMC free article] [PubMed] [Google Scholar]
- 40.Bánfi B et al. A Ca(2+)-activated NADPH oxidase in testis, spleen, and lymph nodes. J. Biol. Chem 276, 37594–37601 (2001). [DOI] [PubMed] [Google Scholar]
- 41.Bankoglu EE et al. Role of PTEN in Oxidative Stress and DNA Damage in the Liver of Whole-Body Pten Haplodeficient Mice. PLoS ONE 11, e0166956 (2016). [DOI] [PMC free article] [PubMed] [Google Scholar]
- 42.Sudarshan S et al. Fumarate hydratase deficiency in renal cancer induces glycolytic addiction and hypoxia-inducible transcription factor 1alpha stabilization by glucose-dependent generation of reactive oxygen species. Mol. Cell. Biol 29, 4080–4090 (2009). [DOI] [PMC free article] [PubMed] [Google Scholar]
- 43.Bardella C et al. Cells lacking the fumarase tumor suppressor are protected from apoptosis through a hypoxia-inducible factor-independent, AMPK-dependent mechanism. Mol. Cell. Biol 32, 3081–3094 (2012). [DOI] [PMC free article] [PubMed] [Google Scholar]
- 44.Doll S et al. ACSL4 dictates ferroptosis sensitivity by shaping cellular lipid composition. Nat. Chem. Biol 13, 91–98 (2017). [DOI] [PMC free article] [PubMed] [Google Scholar]
- 45.Yuan H, Li X, Zhang X, Kang R & Tang D Identification of ACSL4 as a biomarker and contributor of ferroptosis. Biochem. Biophys. Res. Commun 478, 1338–1343 (2016). [DOI] [PubMed] [Google Scholar]
- 46.Hasegawa M et al. Functional interactions of the cystine/glutamate antiporter, CD44v and MUC1-C oncoprotein in triple-negative breast cancer cells. Oncotarget 7, 11756–11769 (2016). [DOI] [PMC free article] [PubMed] [Google Scholar]
- 47.Ishimoto T et al. CD44 variant regulates redox status in cancer cells by stabilizing the xCT subunit of system xc(−) and thereby promotes tumor growth. Cancer Cell 19, 387–400 (2011). [DOI] [PubMed] [Google Scholar]
- 48.Zhitomirsky B & Assaraf YG Lysosomal sequestration of hydrophobic weak base chemotherapeutics triggers lysosomal biogenesis and lysosome-dependent cancer multidrug resistance. Oncotarget 6, 1143–1156 (2015). [DOI] [PMC free article] [PubMed] [Google Scholar]
- 49.Xu M et al. A phenotypic compound screening assay for lysosomal storage diseases. J. Biomol. Screen 19, 168–175 (2014). [DOI] [PMC free article] [PubMed] [Google Scholar]
- 50.Chikte S, Panchal N & Warnes G Use of LysoTracker dyes: a flow cytometric study of autophagy. Cytometry A 85, 169–178 (2014). [DOI] [PubMed] [Google Scholar]
- 51.DeVorkin L & Gorski SM LysoTracker staining to aid in monitoring autophagy in Drosophila. Cold Spring Harb. Protoc 2014, 951–958 (2014). [DOI] [PubMed] [Google Scholar]
- 52.Dixon SJ & Stockwell BR The role of iron and reactive oxygen species in cell death. Nat. Chem. Biol 10, 9–17 (2014). [DOI] [PubMed] [Google Scholar]
- 53.Weber RA et al. Maintaining iron homeostasis is the key role of lysosomal acidity for cell proliferation. Mol. Cell 77, 645–655.e7 (2020). [DOI] [PMC free article] [PubMed] [Google Scholar]
- 54.Bogdan AR, Miyazawa M, Hashimoto K & Tsuji Y Regulators of iron homeostasis: new players in metabolism, cell death, and disease. Trends Biochem. Sci 41, 274–286 (2016). [DOI] [PMC free article] [PubMed] [Google Scholar]
- 55.Seibler P et al. Iron overload is accompanied by mitochondrial and lysosomal dysfunction in WDR45 mutant cells. Brain 141, 3052–3064 (2018). [DOI] [PMC free article] [PubMed] [Google Scholar]
- 56.Haack TB et al. Exome sequencing reveals de novo WDR45 mutations causing a phenotypically distinct, X-linked dominant form of NBIA. Am. J. Hum. Genet 91, 1144–1149 (2012). [DOI] [PMC free article] [PubMed] [Google Scholar]
- 57.Muto Y, Nishiyama M, Nita A, Moroishi T & Nakayama KI Essential role of FBXL5-mediated cellular iron homeostasis in maintenance of hematopoietic stem cells. Nat. Commun 8, 16114 (2017). [DOI] [PMC free article] [PubMed] [Google Scholar]
- 58.Dong X-P et al. The type IV mucolipidosis-associated protein TRPML1 is an endolysosomal iron release channel. Nature 455, 992–996 (2008). [DOI] [PMC free article] [PubMed] [Google Scholar]
- 59.Ward DM & Cloonan SM Mitochondrial iron in human health and disease. Annu. Rev. Physiol 81, 453–482 (2019). [DOI] [PMC free article] [PubMed] [Google Scholar]
- 60.Diaz-Font A et al. A mutation within the saposin D domain in a Gaucher disease patient with normal glucocerebrosidase activity. Hum. Genet 117, 275–277 (2005). [DOI] [PubMed] [Google Scholar]
- 61.Radha Rama Devi A et al. Acute Gaucher Disease-Like Condition in an Indian Infant with a Novel Biallelic Mutation in the Prosaposin Gene. J. Pediatr. Genet 8, 81–85 (2019). [DOI] [PMC free article] [PubMed] [Google Scholar]
- 62.Spiegel R et al. A mutation in the saposin A coding region of the prosaposin gene in an infant presenting as Krabbe disease: first report of saposin A deficiency in humans. Mol. Genet. Metab 84, 160–166 (2005). [DOI] [PubMed] [Google Scholar]
- 63.Oji Y et al. Variants in saposin D domain of prosaposin gene linked to Parkinson’s disease. Brain 143, 1190–1205 (2020). [DOI] [PubMed] [Google Scholar]
- 64.Hiraiwa M et al. Lysosomal proteolysis of prosaposin, the precursor of saposins (sphingolipid activator proteins): its mechanism and inhibition by ganglioside. Arch. Biochem. Biophys 341, 17–24 (1997). [DOI] [PubMed] [Google Scholar]
- 65.Sandhoff K & Harzer K Gangliosides and gangliosidoses: principles of molecular and metabolic pathogenesis. J. Neurosci 33, 10195–10208 (2013). [DOI] [PMC free article] [PubMed] [Google Scholar]
- 66.Jain IH et al. Genetic screen for cell fitness in high or low oxygen highlights mitochondrial and lipid metabolism. Cell 181, 716–727.e11 (2020). [DOI] [PMC free article] [PubMed] [Google Scholar]
- 67.Bartz F et al. Identification of cholesterol-regulating genes by targeted RNAi screening. Cell Metab 10, 63–75 (2009). [DOI] [PubMed] [Google Scholar]
- 68.Puri V et al. Sphingolipid storage induces accumulation of intracellular cholesterol by stimulating SREBP-1 cleavage. J. Biol. Chem 278, 20961–20970 (2003). [DOI] [PubMed] [Google Scholar]
- 69.Glaros EN et al. Glycosphingolipid accumulation inhibits cholesterol efflux via the ABCA1/apolipoprotein A-I pathway: 1-phenyl-2-decanoylamino-3-morpholino-1-propanol is a novel cholesterol efflux accelerator. J. Biol. Chem 280, 24515–24523 (2005). [DOI] [PubMed] [Google Scholar]
- 70.Rust MJ, Bates M & Zhuang X Sub-diffraction-limit imaging by stochastic optical reconstruction microscopy (STORM). Nat. Methods 3, 793–795 (2006). [DOI] [PMC free article] [PubMed] [Google Scholar]
- 71.Moreno-García A, Kun A, Calero O, Medina M & Calero M An Overview of the Role of Lipofuscin in Age-Related Neurodegeneration. Front. Neurosci 12, 464 (2018). [DOI] [PMC free article] [PubMed] [Google Scholar]
- 72.Mochizuki Y, Park MK, Mori T & Kawashima S The difference in autofluorescence features of lipofuscin between brain and adrenal. Zool. Sci 12, 283–288 (1995). [DOI] [PubMed] [Google Scholar]
- 73.Höhn A, Jung T, Grimm S & Grune T Lipofuscin-bound iron is a major intracellular source of oxidants: role in senescent cells. Free Radic. Biol. Med 48, 1100–1108 (2010). [DOI] [PubMed] [Google Scholar]
- 74.Brunk UT, Jones CB & Sohal RS A novel hypothesis of lipofuscinogenesis and cellular aging based on interactions between oxidative stress and autophagocytosis. Mutat. Res 275, 395–403 (1992). [DOI] [PubMed] [Google Scholar]
- 75.Kunkle BW et al. Genetic meta-analysis of diagnosed Alzheimer’s disease identifies new risk loci and implicates Aβ, tau, immunity and lipid processing. Nat. Genet 51, 414–430 (2019). [DOI] [PMC free article] [PubMed] [Google Scholar]
- 76.Chang D et al. A meta-analysis of genome-wide association studies identifies 17 new Parkinson’s disease risk loci. Nat. Genet 49, 1511–1516 (2017). [DOI] [PMC free article] [PubMed] [Google Scholar]
- 77.Gallagher MD & Chen-Plotkin AS The Post-GWAS Era: From Association to Function. Am. J. Hum. Genet 102, 717–730 (2018). [DOI] [PMC free article] [PubMed] [Google Scholar]
- 78.Datlinger P et al. Pooled CRISPR screening with single-cell transcriptome readout. Nat. Methods 14, 297–301 (2017). [DOI] [PMC free article] [PubMed] [Google Scholar]
- 79.Adamson B et al. A Multiplexed Single-Cell CRISPR Screening Platform Enables Systematic Dissection of the Unfolded Protein Response. Cell 167, 1867–1882.e21 (2016). [DOI] [PMC free article] [PubMed] [Google Scholar]
- 80.Dixit A et al. Perturb-Seq: Dissecting Molecular Circuits with Scalable Single-Cell RNA Profiling of Pooled Genetic Screens. Cell 167, 1853–1866.e17 (2016). [DOI] [PMC free article] [PubMed] [Google Scholar]
- 81.Piñero J et al. DisGeNET: a discovery platform for the dynamical exploration of human diseases and their genes. Database (Oxford) 2015, bav028 (2015). [DOI] [PMC free article] [PubMed] [Google Scholar]
- 82.Slowik A et al. Paraoxonase gene polymorphisms and sporadic ALS. Neurology 67, 766–770 (2006). [DOI] [PubMed] [Google Scholar]
- 83.Schmitt-John T et al. Mutation of Vps54 causes motor neuron disease and defective spermiogenesis in the wobbler mouse. Nat. Genet 37, 1213–1215 (2005). [DOI] [PubMed] [Google Scholar]
- 84.Chen JA et al. A multiancestral genome-wide exome array study of Alzheimer disease, frontotemporal dementia, and progressive supranuclear palsy. JAMA Neurol 72, 414–422 (2015). [DOI] [PMC free article] [PubMed] [Google Scholar]
- 85.Zhao LY et al. An EBF3-mediated transcriptional program that induces cell cycle arrest and apoptosis. Cancer Res 66, 9445–9452 (2006). [DOI] [PubMed] [Google Scholar]
- 86.Gu C et al. Long Noncoding RNA EBF3-AS Promotes Neuron Apoptosis in Alzheimer’s Disease. DNA Cell Biol 37, 220–226 (2018). [DOI] [PubMed] [Google Scholar]
- 87.Mathys H et al. Single-cell transcriptomic analysis of Alzheimer’s disease. Nature 570, 332–337 (2019). [DOI] [PMC free article] [PubMed] [Google Scholar]
- 88.Langfelder P & Horvath S WGCNA: an R package for weighted correlation network analysis. BMC Bioinformatics 9, 559 (2008). [DOI] [PMC free article] [PubMed] [Google Scholar]
- 89.Martinez-Morales PL, Quiroga AC, Barbas JA & Morales AV SOX5 controls cell cycle progression in neural progenitors by interfering with the WNT-beta-catenin pathway. EMBO Rep 11, 466–472 (2010). [DOI] [PMC free article] [PubMed] [Google Scholar]
- 90.Méndez-Gómez HR & Vicario-Abejón C The homeobox gene Gsx2 regulates the self-renewal and differentiation of neural stem cells and the cell fate of postnatal progenitors. PLoS ONE 7, e29799 (2012). [DOI] [PMC free article] [PubMed] [Google Scholar]
- 91.Luu B, Ellisor D & Zervas M The lineage contribution and role of Gbx2 in spinal cord development. PLoS ONE 6, e20940 (2011). [DOI] [PMC free article] [PubMed] [Google Scholar]
- 92.Ross D & Siegel D Functions of NQO1 in cellular protection and coq10 metabolism and its potential role as a redox sensitive molecular switch. Front. Physiol 8, 595 (2017). [DOI] [PMC free article] [PubMed] [Google Scholar]
- 93.SantaCruz KS, Yazlovitskaya E, Collins J, Johnson J & DeCarli C Regional NAD(P)H:quinone oxidoreductase activity in Alzheimer’s disease. Neurobiol. Aging 25, 63–69 (2004). [DOI] [PubMed] [Google Scholar]
- 94.Wang Y, Santa-Cruz K, DeCarli C & Johnson JA NAD(P)H:quinone oxidoreductase activity is increased in hippocampal pyramidal neurons of patients with Aalzheimer’s disease. Neurobiol. Aging 21, 525–531 (2000). [DOI] [PubMed] [Google Scholar]
- 95.Bian J-T, Zhao H-L, Zhang Z-X, Bi X-H & Zhang J-W Association of NAD(P)H:quinone oxidoreductase 1 polymorphism and Alzheimer’s disease in Chinese. J. Mol. Neurosci 34, 235–240 (2008). [DOI] [PubMed] [Google Scholar]
- 96.van Muiswinkel FL et al. Expression of NAD(P)H:quinone oxidoreductase in the normal and Parkinsonian substantia nigra. Neurobiol. Aging 25, 1253–1262 (2004). [DOI] [PubMed] [Google Scholar]
- 97.Raina AK, Templeton DJ, Deak JC, Perry G & Smith MA Quinone reductase (NQO1), a sensitive redox indicator, is increased in Alzheimer’s disease. Redox Rep 4, 23–27 (1999). [DOI] [PubMed] [Google Scholar]
- 98.Imaizumi Y et al. Mitochondrial dysfunction associated with increased oxidative stress and α-synuclein accumulation in PARK2 iPSC-derived neurons and postmortem brain tissue. Mol. Brain 5, 35 (2012). [DOI] [PMC free article] [PubMed] [Google Scholar]
- 99.Asher G, Lotem J, Kama R, Sachs L & Shaul Y NQO1 stabilizes p53 through a distinct pathway. Proc Natl Acad Sci USA 99, 3099–3104 (2002). [DOI] [PMC free article] [PubMed] [Google Scholar]
- 100.Ma Q Role of nrf2 in oxidative stress and toxicity. Annu. Rev. Pharmacol. Toxicol 53, 401–426 (2013). [DOI] [PMC free article] [PubMed] [Google Scholar]
- 101.Ramsey CP et al. Expression of Nrf2 in neurodegenerative diseases. J. Neuropathol. Exp. Neurol 66, 75–85 (2007). [DOI] [PMC free article] [PubMed] [Google Scholar]
- 102.Patel M Targeting oxidative stress in central nervous system disorders. Trends Pharmacol. Sci 37, 768–778 (2016). [DOI] [PMC free article] [PubMed] [Google Scholar]
- 103.Lin MT & Beal MF Mitochondrial dysfunction and oxidative stress in neurodegenerative diseases. Nature 443, 787–795 (2006). [DOI] [PubMed] [Google Scholar]
- 104.Rouault TA Iron metabolism in the CNS: implications for neurodegenerative diseases. Nat. Rev. Neurosci 14, 551–564 (2013). [DOI] [PubMed] [Google Scholar]
- 105.Stockwell BR et al. Ferroptosis: A regulated cell death nexus linking metabolism, redox biology, and disease. Cell 171, 273–285 (2017). [DOI] [PMC free article] [PubMed] [Google Scholar]
- 106.Dubreuil MM et al. Systematic Identification of Regulators of Oxidative Stress Reveals Non-canonical Roles for Peroxisomal Import and the Pentose Phosphate Pathway. Cell Rep 30, 1417–1433.e7 (2020). [DOI] [PMC free article] [PubMed] [Google Scholar]
- 107.Reczek CR et al. A CRISPR screen identifies a pathway required for paraquat-induced cell death. Nat. Chem. Biol 13, 1274–1279 (2017). [DOI] [PMC free article] [PubMed] [Google Scholar]
- 108.Ndayisaba A, Kaindlstorfer C & Wenning GK Iron in Neurodegeneration - Cause or Consequence? Front. Neurosci 13, 180 (2019). [DOI] [PMC free article] [PubMed] [Google Scholar]
- 109.Han C et al. Ferroptosis and its potential role in human diseases. Front. Pharmacol 11, 239 (2020). [DOI] [PMC free article] [PubMed] [Google Scholar]
- 110.Kupershmidt L, Amit T, Bar-Am O, Weinreb O & Youdim MBH Multi-target, neuroprotective and neurorestorative M30 improves cognitive impairment and reduces Alzheimer’s-like neuropathology and age-related alterations in mice. Mol. Neurobiol 46, 217–220 (2012). [DOI] [PubMed] [Google Scholar]
- 111.Kaur D et al. Genetic or pharmacological iron chelation prevents MPTP-induced neurotoxicity in vivo: a novel therapy for Parkinson’s disease. Neuron 37, 899–909 (2003). [DOI] [PubMed] [Google Scholar]
- 112.Chen J et al. Iron accumulates in Huntington’s disease neurons: protection by deferoxamine. PLoS ONE 8, e77023 (2013). [DOI] [PMC free article] [PubMed] [Google Scholar]
- 113.Skouta R et al. Ferrostatins inhibit oxidative lipid damage and cell death in diverse disease models. J. Am. Chem. Soc 136, 4551–4556 (2014). [DOI] [PMC free article] [PubMed] [Google Scholar]
- 114.Anderson GW, Goebel HH & Simonati A Human pathology in NCL. Biochim. Biophys. Acta 1832, 1807–1826 (2013). [DOI] [PubMed] [Google Scholar]
- 115.Delori FC et al. In vivo measurement of lipofuscin in Stargardt’s disease--Fundus flavimaculatus. Invest. Ophthalmol. Vis. Sci 36, 2327–2331 (1995). [PubMed] [Google Scholar]
- 116.Dorey CK, Wu G, Ebenstein D, Garsd A & Weiter JJ Cell loss in the aging retina. Relationship to lipofuscin accumulation and macular degeneration. Invest. Ophthalmol. Vis. Sci 30, 1691–1699 (1989). [PubMed] [Google Scholar]
- 117.Dowson JH, Mountjoy CQ, Cairns MR & Wilton-Cox H Changes in intraneuronal lipopigment in Alzheimer’s disease. Neurobiol. Aging 13, 493–500 (1992). [DOI] [PubMed] [Google Scholar]
- 118.Dowson JH, Mountjoy CQ, Cairns MR & Wilton-Cox H Alzheimer’s disease: distribution of changes in intraneuronal lipopigment in the frontal cortex. Dementia 6, 334–342 (1995). [DOI] [PubMed] [Google Scholar]
- 119.Braak E et al. alpha-synuclein immunopositive Parkinson’s disease-related inclusion bodies in lower brain stem nuclei. Acta Neuropathol 101, 195–201 (2001). [DOI] [PubMed] [Google Scholar]
- 120.Braak H & Braak E Allocortical involvement in Huntington’s disease. Neuropathol. Appl. Neurobiol 18, 539–547 (1992). [DOI] [PubMed] [Google Scholar]
- 121.Goebel HH, Heipertz R, Scholz W, Iqbal K & Tellez-Nagel I Juvenile Huntington chorea: clinical, ultrastructural, and biochemical studies. Neurology 28, 23–31 (1978). [DOI] [PubMed] [Google Scholar]
- 122.Ward ME et al. Individuals with progranulin haploinsufficiency exhibit features of neuronal ceroid lipofuscinosis. Sci. Transl. Med 9, (2017). [DOI] [PMC free article] [PubMed] [Google Scholar]
- 123.Bazan NG Lipid signaling in neural plasticity, brain repair, and neuroprotection. Mol. Neurobiol 32, 89–103 (2005). [DOI] [PubMed] [Google Scholar]
- 124.Isacson O, Brekk OR & Hallett PJ Novel results and concepts emerging from lipid cell biology relevant to degenerative brain aging and disease. Front. Neurol 10, 1053 (2019). [DOI] [PMC free article] [PubMed] [Google Scholar]
- 125.Hallett PJ, Engelender S & Isacson O Lipid and immune abnormalities causing age-dependent neurodegeneration and Parkinson’s disease. J. Neuroinflammation 16, 153 (2019). [DOI] [PMC free article] [PubMed] [Google Scholar]
- 126.Yadav RS & Tiwari NK Lipid integration in neurodegeneration: an overview of Alzheimer’s disease. Mol. Neurobiol 50, 168–176 (2014). [DOI] [PubMed] [Google Scholar]
- 127.Boutry M et al. Inhibition of Lysosome Membrane Recycling Causes Accumulation of Gangliosides that Contribute to Neurodegeneration. Cell Rep 23, 3813–3826 (2018). [DOI] [PMC free article] [PubMed] [Google Scholar]
- 128.Edens BM et al. FMRP Modulates Neural Differentiation through m6A-Dependent mRNA Nuclear Export. Cell Rep 28, 845–854.e5 (2019). [DOI] [PMC free article] [PubMed] [Google Scholar]
- 129.Li M et al. Ythdf2-mediated m6A mRNA clearance modulates neural development in mice. Genome Biol 19, 69 (2018). [DOI] [PMC free article] [PubMed] [Google Scholar]
- 130.Anzalone AV et al. Search-and-replace genome editing without double-strand breaks or donor DNA. Nature 576, 149–157 (2019). [DOI] [PMC free article] [PubMed] [Google Scholar]
- 131.Hanna RE et al. Massively parallel assessment of human variants with base editor screens. BioRxiv (2020). doi: 10.1101/2020.05.17.100818 [DOI] [PubMed] [Google Scholar]
- 132.Tsherniak A et al. Defining a cancer dependency map. Cell 170, 564–576.e16 (2017). [DOI] [PMC free article] [PubMed] [Google Scholar]
- 133.Oughtred R et al. The BioGRID database: A comprehensive biomedical resource of curated protein, genetic, and chemical interactions. Protein Sci 30, 187–200 [DOI] [PMC free article] [PubMed] [Google Scholar]
- 134.Cui Y et al. CRISP-view: a database of functional genetic screens spanning multiple phenotypes. Nucleic Acids Res 49, D848–D854 (2021). [DOI] [PMC free article] [PubMed] [Google Scholar]
- 135.Guo X et al. Mitochondrial stress is relayed to the cytosol by an OMA1-DELE1-HRI pathway. Nature 579, 427–432 (2020). [DOI] [PMC free article] [PubMed] [Google Scholar]
- 136.Miyaoka Y et al. Isolation of single-base genome-edited human iPS cells without antibiotic selection. Nat. Methods 11, 291–293 (2014). [DOI] [PMC free article] [PubMed] [Google Scholar]
- 137.Topol A, Tran NN & Brennand KJ A guide to generating and using hiPSC derived NPCs for the study of neurological diseases. J. Vis. Exp e52495 (2015). doi: 10.3791/52495 [DOI] [PMC free article] [PubMed] [Google Scholar]
- 138.Cheng C, Fass DM, Folz-Donahue K, MacDonald ME & Haggarty SJ Highly Expandable Human iPS Cell-Derived Neural Progenitor Cells (NPC) and Neurons for Central Nervous System Disease Modeling and High-Throughput Screening. Curr. Protoc. Hum. Genet 92, 21.8.1–21.8.21 (2017). [DOI] [PMC free article] [PubMed] [Google Scholar]
- 139.Tcw J et al. An Efficient Platform for Astrocyte Differentiation from Human Induced Pluripotent Stem Cells. Stem Cell Reports 9, 600–614 (2017). [DOI] [PMC free article] [PubMed] [Google Scholar]
- 140.Brownjohn PW et al. Functional Studies of Missense TREM2 Mutations in Human Stem Cell-Derived Microglia. Stem Cell Reports 10, 1294–1307 (2018). [DOI] [PMC free article] [PubMed] [Google Scholar]
- 141.Bersuker K et al. The CoQ oxidoreductase FSP1 acts parallel to GPX4 to inhibit ferroptosis. Nature 575, 688–692 (2019). [DOI] [PMC free article] [PubMed] [Google Scholar]
- 142.Komarov PG et al. A chemical inhibitor of p53 that protects mice from the side effects of cancer therapy. Science 285, 1733–1737 (1999). [DOI] [PubMed] [Google Scholar]
- 143.Zhao C et al. Dual regulatory switch through interactions of Tcf7l2/Tcf4 with stage-specific partners propels oligodendroglial maturation. Nat. Commun 7, 10883 (2016). [DOI] [PMC free article] [PubMed] [Google Scholar]
- 144.Hauser M et al. The Spectrin-Actin-Based Periodic Cytoskeleton as a Conserved Nanoscale Scaffold and Ruler of the Neural Stem Cell Lineage. Cell Rep 24, 1512–1522 (2018). [DOI] [PMC free article] [PubMed] [Google Scholar]
- 145.Wojcik M, Hauser M, Li W, Moon S & Xu K Graphene-enabled electron microscopy and correlated super-resolution microscopy of wet cells. Nat. Commun 6, 7384 (2015). [DOI] [PMC free article] [PubMed] [Google Scholar]
- 146.Langmead B, Trapnell C, Pop M & Salzberg SL Ultrafast and memory-efficient alignment of short DNA sequences to the human genome. Genome Biol 10, R25 (2009). [DOI] [PMC free article] [PubMed] [Google Scholar]
- 147.Hill AJ et al. On the design of CRISPR-based single-cell molecular screens. Nat. Methods 15, 271–274 (2018). [DOI] [PMC free article] [PubMed] [Google Scholar]
- 148.Wolf FA, Angerer P & Theis FJ SCANPY: large-scale single-cell gene expression data analysis. Genome Biol 19, 15 (2018). [DOI] [PMC free article] [PubMed] [Google Scholar]
- 149.Patro R, Duggal G, Love MI, Irizarry RA & Kingsford C Salmon provides fast and bias-aware quantification of transcript expression. Nat. Methods 14, 417–419 (2017). [DOI] [PMC free article] [PubMed] [Google Scholar]
- 150.Soneson C, Love MI & Robinson MD Differential analyses for RNA-seq: transcript-level estimates improve gene-level inferences. [version 2; peer review: 2 approved]. F1000Res 4, 1521 (2015). [DOI] [PMC free article] [PubMed] [Google Scholar]
- 151.Pang XP, Hershman JM, Chung M & Pekary AE Characterization of tumor necrosis factor-alpha receptors in human and rat thyroid cells and regulation of the receptors by thyrotropin. Endocrinology 125, 1783–1788 (1989). [DOI] [PubMed] [Google Scholar]
- 152.Liao Y, Wang J, Jaehnig EJ, Shi Z & Zhang B WebGestalt 2019: gene set analysis toolkit with revamped UIs and APIs. Nucleic Acids Res 47, W199–W205 (2019). [DOI] [PMC free article] [PubMed] [Google Scholar]
Associated Data
This section collects any data citations, data availability statements, or supplementary materials included in this article.
Supplementary Materials
Supplementary Table 1: Screen results for primary and pooled validation screens
Screens were analyzed using the MAGeCK-iNC pipeline (see Methods for details). Hit class values of 1, −1 or 0 were assigned to hit genes with positive Phenotype scores, hit genes with negative Phenotype scores or non-hits, respectively. Each screen is provided in a separate tab.
Supplementary Table 2: Hit class info for Fig2g
This table shows the hit class info for genes in each screen in Fig2g. Hit class values of 1, −1 or 0 were assigned to hit genes with positive Phenotype scores, hit genes with negative Phenotype scores or non-hits, respectively.
Supplementary Table 3: Untargeted lipidomics data for WT and PSAP KO neurons
Untargeted lipidomics data for WT and PSAP KO neurons. P values were calculated using Student’s t-test and were corrected for multiple testing using the Benjamini-Hochberg method.
Supplementary Table 4: sgRNA sequences for pooled validation and CROP-seq libraries
These tables show the protospacer sequences for sgRNAs in the pooled validation and CROP-seq libraries. Each library is provided in a separate tab. sgRNA information for the genome-wide libraries was previously published10.
Supplementary Table 5: sgRNA cell counts for CROP-seq screens
These tables summarize the number of cells for sgRNAs in the CRISPRi and CRISPRa CROP-seq screens. First tab: CRISPRi, second tab: CRISPRa.