Abstract
Background
Weight gain is one of the most important hypothyroidism-related concerns in patients with hypothyroidism. However, unexpectedly, levothyroxine replacement does not necessarily result in body weight (BWT) reduction among those patients. The study aimed to assess the patterns of BWT changes through time in patients with hypothyroidism.
Method
In a retrospective database study from Faiha Specialized Diabetes, Endocrine, and Metabolism Center, a total of 346 adult patients with hypothyroidism (192 newly diagnosed and 154 known hypothyroidism patients) who had one visit every three months, five visits in one year were included. Of these, 116 new and 69 known hypothyroidism patients had completed nine visits in two years. Each visit involved thyroid-stimulating hormone (TSH) and BWT measurements. Patients with chronic liver or renal disease, diabetes mellitus, thyroid cancer, or other malignancies, pregnancy, and steroid or hormonal therapies were excluded. The patients were further subdivided based on average TSH levels into controlled (TSH ≤ 4.2 μIU/ml) and uncontrolled (TSH > 4.2 μIU/ml). Repeated measures analysis of variance (ANOVA) with a Greenhouse-Geisser correction and post hoc tests using the Bonferroni correction were used to evaluate TSH and BWT changes through the study.
Results
Both in newly diagnosed and known hypothyroidism patients with an average TSH > 4.2 μIU/mL, BWT increased significantly through visits over one and two years. For newly diagnosed patients assessed over one year (F(2.41, 321.60) = 3.28, p = 0.03), the mean BWT increase was 1.4 ± 0.38 kg from 3rd to 12th month visits (p = 0.004). For newly diagnosed patients assessed over two years (F(3.10, 263.89) = 9.08, P < 0.0005), the mean BWT increase was 3.02 ± 0.77 kg from 3rd to 24th month visits (p = 0.007). For patients with known hypothyroidism assessed over one year (F(2.56, 187.47) = 7.11, p = 0.0003), the mean BWT increase was 1.97 ± 0.64 kg at 12th month visit, and over two years (F(2.35, 77.56) = 4.67, P = 0.009), the mean BWT increase was 3.78 ± 1.26 kg at 24th month visit. While in all other patients with an average TSH ≤ 4.2 μIU/mL, the BWT changed non-significantly through the visits for newly diagnosed patients over one year and two years (p = 0.10, 0.34, respectively), and known patients over one year and two years (p = 0.47, 0.34, respectively).
Conclusion
Contrary to what is believed, adequate treatment with levothyroxine does not associate with weight reduction. Instead, either the patient kept on the same weight or continued to gain more weight.
Keywords: hypothyroidism, bodyweight, weight gain, levothyroxine, thyroid-stimulating hormone
Introduction
The relationships between body weight (BWT) and thyroid status are complex. Thyroid hormones play an important role in BWT regulation, mainly through regulating energy expenditure [1,2]. It is well established that thyroid dysfunction, including hyperthyroidism and hypothyroidism, leads to significant changes in BWT and resting metabolic rate (RMR) [1,3].
Patients with overt hypothyroidism often present with an obvious BWT gain and those with some BWT loss after starting levothyroxine (LT4) therapy. The degree of BWT change with thyroid dysfunction and the effect of treatment on BWT are surprisingly poorly understood. It is challenging to evaluate thyroid hormones in relation to BWT change in observational studies because the causes of BWT change are heterogeneous and often not well clear. In addition, few studies have examined RMR, a factor associated with both thyroid function and energy expenditure [1,4], in relation to thyroid hormones during BWT change. However, following LT4 treatment for overt hypothyroidism, BWT loss appears to be modest and mediated primarily by loss of water rather than fat [5].
This study aimed to evaluate the pattern of BWT changes in patients with hypothyroidism following the initiation of LT4 therapy in Basrah. This article was previously presented as a meeting abstract at ENDO 2021, the annual meeting of the Endocrine Society, held virtually on March 20-23, 2021.
Materials and methods
In a retrospective database study at Faiha Specialized Diabetes, Endocrine, and Metabolism Center (FDEMC) in Basrah, Southern Iraq, we assessed patients with primary hypothyroidism, aged 18 years or older, regularly attending the center for follow-up from 2008 to 2019. Using the inclusion criteria, we selected patients who had completed at least five visits over one year (one visit every three months) and, from them, those who had completed at least nine visits over two years (one visit every three months). Each visit should have included measurements of thyroid-stimulating hormone (TSH) and BWT.
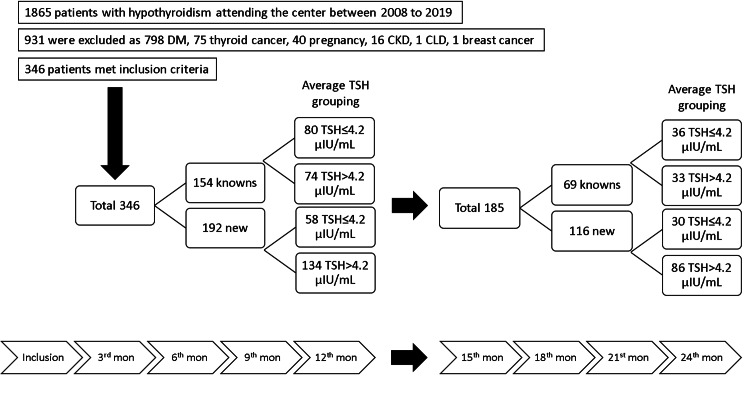
To compare the effects of recent and LT4 treatment, the patients were classified as “new” and “known” hypothyroidism. The “new” were patients diagnosed and started LT4 treatment in the center, while “known” were patients already been diagnosed and on LT4 treatment for more than a year but referred to the center for LT4 treatment adjustments, as shown in Figure 1. As the result of the expected possibility of their effects on BWTs, chronic liver disease (CLD) or chronic kidney disease (CKD), diabetes mellitus (DM), thyroid cancer or any other malignancies, pregnancy, and concurrent steroid therapy, or use of oral contraceptive pills were considered as exclusion criteria for patients having either of them during their regular follow-up.
Figure 1. Flowchart of the evaluation of the patients with hypothyroidism included in the study.
DM, diabetes mellitus; CKD, chronic kidney disease; CLD, chronic liver disease; TSH, thyroid-stimulating hormone
Biochemical data
From each patient, 10 ml of blood was taken and put in a clot activator tube, centrifuged immediately, serum was separated and then frozen at -20 °C to be stored for analysis. TSH and anti-thyroid peroxidase antibody (TPO Ab) were analyzed by electrochemiluminescence (ECL) assay (Cobas e411 analyzer - Roche, Germany). The normal value for TSH is 0.27-4.2 μIU/ml and our measuring range was 0.005-100.0 μIU/ml. The normal value for TPO Ab is <34 IU/ml and our measuring range was 5-600 IU/ml. The patients were diagnosed with hypothyroidism based on a TSH level > 10 μIU/ml.
A total of 2667 TSH measurements (for new 1529, and known 1138 measurements) were made. A TSH of ≤ 4.2 μIU/ml was considered as controlled. As a result of the observed variable TSH levels in every patient over one and two years follow-up, we calculated the average TSH level for every patient for one and two years. The first TSH levels before initiation or adjustments of LT4 treatment were not included in the equation.
One year average TSH = (3rd month TSH + 6th month TSH + 9th month TSH + 12th month TSH) /4
Two years average TSH = (3rd month TSH + 6th month TSH + 9th month TSH + 12th month TSH + 15th month TSH + 18th month TSH + 21st month TSH + 24th month TSH) /8
An average TSH of ≤ 4.2 μIU/mL was considered as controlled.
Bodyweight measurement
For every patient in each visit, the BWT in kilogram (kg) and height in meter (m) were measured with bare feet and light clothes. Body mass index (BMI) was calculated by the formula of (BWT in kg/height m2). According to the World Health Organization, a value of a BMI of 30 or more defines obesity.
Statistical analysis
The data were analyzed by the Statistical Package for the Social Sciences (SPSS), version 26.0 (IBM SPSS Statistics, Armonk, NY). Categorical variables were summarized as numbers (N) and percentages (%). Continuous variables were summarized as mean ± standard deviations (M ± SD). The comparison of the controlled TSH frequencies through the visits over one and two years was made using Cochran’s Q test. A repeated-measures analysis of variance (ANOVA) with a Greenhouse-Geisser correction was used to compare the mean changes in the TSH levels and BWTs within visits over one year and two years. For in-between visits, TSH and BWTs comparisons, a post hoc test with Bonferroni correction was used. For all of the above comparisons, a P-value of < 0.05 defined statistical significance.
Results
Table 1 summarizes the general characteristics of the 346 patients with hypothyroidism included in the study.
Table 1. General characteristics of the patients with hypothyroidism included in the study.
BWT, bodyweight; BMI, body mass index; SD, standard deviation; TSH, thyroid-stimulating hormone; TPO Ab, anti-thyroid peroxidase antibodies.
| Mean ± SD or count/total (%) | P-value | ||
| Known hypothyroidism (154) | New hypothyroidism (192) | ||
| Women | 143/154 (92.9) | 158/192 (82.3) | 0.004 |
| Age (years) | 47.1 ± 13.5 | 47.0 ± 12.6 | 0.92 |
| BWT (kg) | 79.9 ± 16.5 | 80.8 ± 17.5 | 0.60 |
| BMI (kg/m2) | 32.1 ± 6.4 | 31.6 ± 6.6 | 0.44 |
| Obesity | 97/154 (63.0) | 113/192 (58.9) | 0.43 |
| TSH (μIU/mL) at enrollment | 4.1 ± 3.1 | 43.07 ± 29.8 | <0.0001 |
| TSH ≤ 4.2 μIU/mL at enrollment | 82/154 (53.2) | 0/192 (0) | <0.0001 |
| All TSH ≤ 4.2 μIU/mL after 3 months and through the study | 662/984 (67.2) | 739/1337 (55.2) | |
| TPO Ab (IU/mL) | 381.8 ± 687.5 | 521.2 ± 924.7 | 0.19 |
| TPO Ab ≥34 IU/mL | 76/105 (72.4) | 115/134 (85.8) | 0.01 |
| Goiter | 30/154 (19.5) | 38/192 (19.8) | 0.94 |
| Thyroidectomy | 16/154 (10.4) | 26/192 (13.5) | 0.37 |
Over one and two years, there were significant differences in the frequencies of controlled TSH across visits for both patients with new and known hypothyroidism (Cochran’s Q test p < 0.0001 for new and known hypothyroidism over one and two years). There is an impression of an increasing degree of control over one year, as shown in Figures 2A-2B.
Figure 2. The frequencies of controlled TSH in patients with hypothyroidism, (A) over one-year follow-up, and (B) over two-year follow-up.
One year
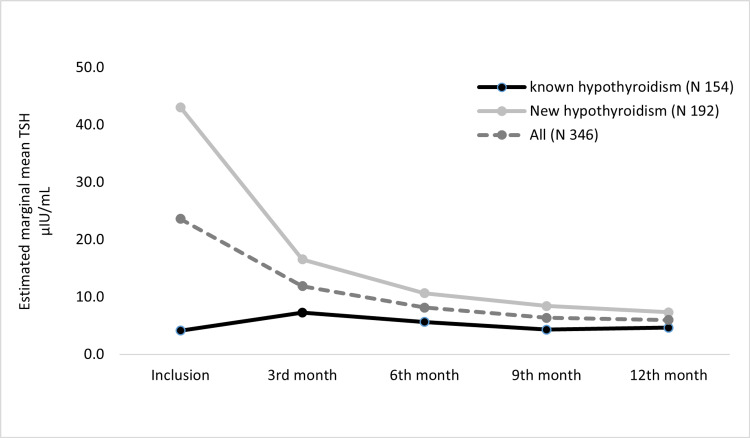
We evaluated 346 patients with hypothyroidism (known 154 and new 192) for changes in TSH levels and BWTs over one year. For all, new, and known hypothyroidism patients, the mean TSH level reduced significantly through the visits, (F(3.18, 1097.09) = 86.53, P < 0.0005), (F(2.98, 569.33) = 125.81, P < 0.0005), and (F(2.76, 423.37) = 4.90, P = 0.003, respectively). For all patients, post hoc test revealed that the TSH reductions were statistically significant between inclusion vs. all follow-up visits (P < 0.0005), 3rd month visit vs. all follow-up visits (P < 0.0005), and no significant TSH changes through 6th, 9th, and 12th month visits. For patients with new hypothyroidism, the post hoc test revealed a similar finding with significant TSH reductions in inclusion vs. all follow-up visits (P < 0.0005), 3rd month visit vs. all follow-up visits (P < 0.0005), and no significant TSH changes through 6th, 9th, and 12th months visits. However, for patients with known hypothyroidism, post hoc test revealed a significant increase in TSH level at 3rd month visit from inclusion (P = 0.02), followed by a reduction in TSH level through the following visits, which were significant only in 3rd vs. 9th month visit (P = 0.008) and 3rd vs. 12th month visits (P = 0.04) (Figure 3).
Figure 3. Estimated marginal mean of TSH over a one-year follow-up.
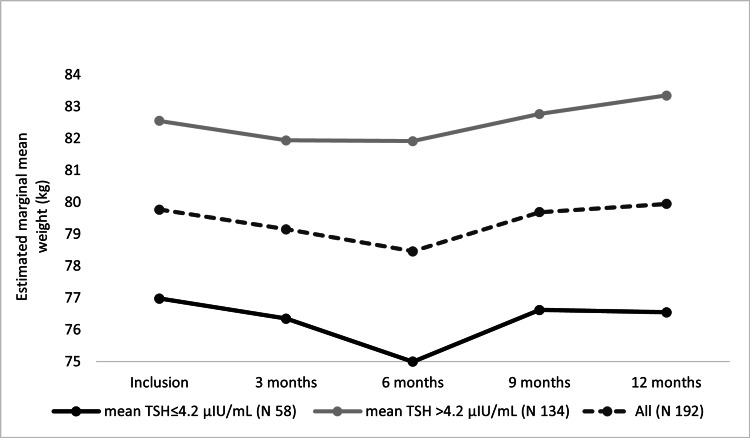
A corresponding analysis was done for BWT changes through one year. As shown in Figure 4, for patients with new hypothyroidism, mean BWT changed statistically significantly through visits (F(2.29, 435.22) = 4.029, P = 0.01), with progressive BWT reduction from inclusion to 3rd month to 6th months visits (mean BWT reduction = 1.3 ± 0.5 kg at 6th month visit). This reduction was followed by a progressive increase in the mean BWT from 6th month to 9th month to 12th month visits, but with no significant changes on post hoc test (mean BWT increase = 0.18 ± 0.35 kg at 12th month visit). On subgroups analysis, patients with an average TSH > 4.2 μIU/ml showed a similar statistically significant finding (F(2.41, 321.60) = 3.28, P = 0.03), and a statistically significant increase in the BWT on post hoc test between 3rd month and 12th month visits with P = 0.004 (mean BWT increase = 1.4 ± 0.38 kg from 3rd to 12th month visit, and mean BWT increase = 0.79 ± 0.41 kg at 12th month visit). Analysis of the patients with average TSH ≤ 4.2 μIU/ml showed that the BWT changed non significantly but similarly (F(1.98, 112.85) = 2.27, P = 0.10), and no significant changes were noticed on post hoc test (mean BWT change = -0.43 ± 0.5 kg at 12th month visit).
Figure 4. Estimated marginal mean BWTs of new hypothyroidism patients over one year.
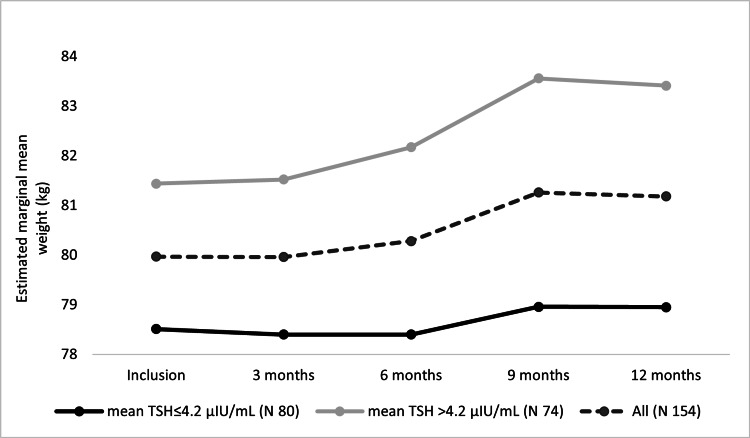
For patients with known hypothyroidism, as shown in Figure 5, mean BWT changed statistically significantly through the visits (F(2.63, 400.35) = 7.00, P = 0.0002), with progressive BWT increase. On post hoc test, the BWT increased significantly at 9th month visit in comparison to inclusion, 3rd, and 6th month visits, (P = 0.01, 0.005, and 0.02, respectively), and also at 12th month visit in comparison to 3rd month visit (P = 0.03) (mean BWT increase = 1.20 ± 0.43 kg at 12th month visit). On subgroups analysis, those patients with average TSH > 4.2 μIU/ml, a similar statistically significant finding was seen (F(2.56, 187.47) = 7.11, P = 0.0003), and a statistically significant increase in the BWT on post hoc test between 9th month visit in comparison to inclusion and 3rd month visit (P = 0.01, 0.01) and also at 12th month visit in comparison to inclusion and 3rd month visits, (P = 0.03, 0.01) (mean BWT increase = 1.97 ± 0.64 kg at 12th month visit). Analysis of the patients with average TSH ≤ 4.2 μIU/ml showed that the BWT increased but non significantly (F(2.26, 178.52) = 0.87, P = 0.47), and no significant changes were detected on post hoc test (mean BWT increase = 0.44 ± 0.59 kg at 12th month visit).
Figure 5. Estimated marginal mean BWTs of known hypothyroidism patients over one year.
Two years
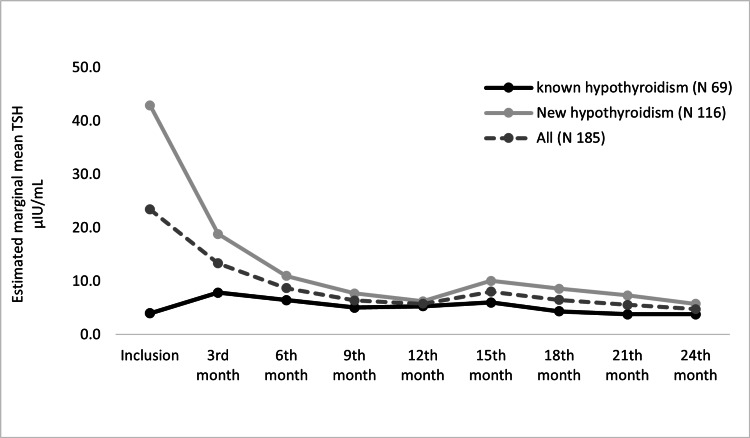
We evaluated 185 patients with hypothyroidism (known 69 and new 116) for changes in TSH levels and BWT over two years. As shown in Figure 6, for all patients and new hypothyroidism patients, the mean TSH level also reduced statistically significantly through visits over two years (F(5.26, 963.94) = 32.40, P < 0.0005 and F(4.96, 571.02) = 61.77, respectively; P < 0.0005). Post hoc test revealed that the significant changes were seen only through the first year, and no significant differences were seen through the second year visits (all: P > 0.05). For patients with known hypothyroidism, there was no significant change in the TSH level (F(3.71, 252.78) = 2.14, P = 0.08).
Figure 6. Estimated marginal mean of TSH over two years follow-up.
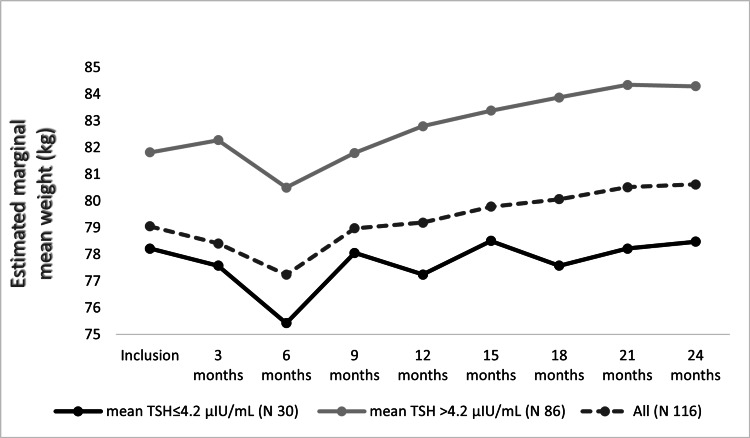
For the patients with new hypothyroidism, a corresponding analysis for BWT changes over two years follow-up was done (Figure 7). The BWT increased significantly through visits (F(2.97, 339.09) = 5.09, P = 0.002) (mean BWT increase = 1.57 ± 0.80 kg at 24th month visit). But on the post hoc test, no significant BWT changes were detected between visits. On subgroups analysis, patients with an average TSH > 4.2 μIU/ml witnessed a similar statistically significant increase in the BWT (F(3.10, 263.89) = 9.08, P < 0.0005). On post hos test, the BWT was significantly increased at 24th month visit in comparison to 3rd (mean BWT increase = 3.02 ± 0.77 kg), 6th (mean BWT increase = 3.80 ± 1.03 kg), and 9th (mean BWT increase = 2.50 ± 0.70 kg) months visits, (P = 0.007, 0.015, 0.023, respectively). Analysis of the patients with average TSH ≤ 4.2 μIU/ml showed that the BWT changed non significantly (F(2.57, 77.20) = 1.10, P = 0.34). Post hoc test also revealed no significant BWT changes between visits (mean BWT increase = 0.25 ± 1.35 kg at 24th month visit).
Figure 7. Estimated marginal mean BWTs of new hypothyroidism patients over two years.
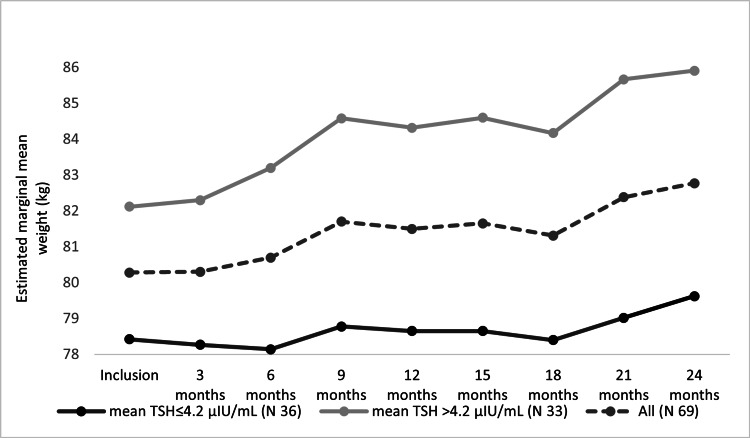
For patients with known hypothyroidism, the BWT increased significantly through the visits over two years (F(2.81, 188.63) = 5.27, P = 0.002), as shown in Figure 8. Post hoc test revealed no significant BWT changes between visits except between 24th and 3rd months visits (mean BWT increase = 2.4 ± 0.71 kg; P = 0.03). On subgroups analysis, patients with an average TSH > 4.2 μIU/ml showed a similar statistically significant increase in the BWT (F(2.35, 77.56) = 4.67, P = 0.009) (mean BWT increase = 3.78 ± 1.26 kg at 24th month visit). For patients with average TSH ≤ 4.2 μIU/ml, the analysis showed that the BWT changed non significantly (F(3.94, 134.22) = 1.14, P = 0.34) (mean BWT increase = 1.20 ± 0.77 kg at 24th month visit). For each group, the post hoc test revealed no significant BWT changes between visits (mean BWT increase = 0.25 ± 1.35 kg at 24th month visit).
Figure 8. Estimated marginal mean BWTs of known hypothyroidism patients over two years.
Discussion
During the two years of follow-up in this study, the BWT changes had different significance levels with the TSH, and the TSH could not predict the BWT changes during the study or vice versa. A significant association between the BWT changes and the TSH level was reported in the first six months of the POUNDS LOST trial, but not for the overall 24 month period [6]. In comparison, Knudsen et al. demonstrated a significant positive association between serum TSH and BWT gain during a more extended period (five years) but not six months [7]. Similar findings of no significance during the different periods during the same study were observed by Fox et al. [8], Svare et al. [9], and Bjergved et al. [10].
It is difficult to ascertain the exact direction and etiology of association between BMI and TSH, whether this association is negative [11,12], positive [7-10,13-15], or not present at all [6,16-21].
The low metabolic rate expanded water and fat mass; excess accumulation of water-binding glycosaminoglycans in patients with longstanding and severe hypothyroidism might contribute to the BWT changes towards more overweight, with different degrees of association [6,7,12,22,23]. Loss of BWT and increase in resting energy expenditure (REE) in individuals with hypothyroidism after reestablishing euthyroidism with LT4 therapy might be explained by excretion of excess water and reduced lean body mass rather than a reduction in the fat mass [12,23].
The discrepant findings of the association between thyroid function and BMI might be attributed to the difference in participants' characteristics, like age, gender, the bidirectional changes between BMI and TSH, and the different durations for the follow-up.
Even within its normal reference ranges, small changes in TSH levels may significantly affect BWT, especially with LT4 therapy [7]. This is attributable to the minor alterations in the regulation of REE and physical activity, resulting in a mismatch between energy intake and energy expenditure, with uncertain effect on final BMI at different severities of hypothyroidism, for variable durations and different responses [1,2,7,17,19,20,23,24].
BWT reduction, whether intentional or in the course of a catabolic state, may reduce TSH, although with uncertain significance [7,25,26], with a relevant role of changes in leptin levels during different stages of BWT changes [6]. Obese individuals often present with transient hyperthyrotropinemia as a consequence, rather than the cause, of BWT excess [27,28]. However, the changes in thyroid hormones are controversial or bidirectional in obesity in a complicated way [2,5], regarding which one is the primary or the secondary event, the alterations in thyroid function, or the increase in BMI [20].
The study's retrospective, and so it can not show causality between BWT changes and the TSH during the study period. The associations between BMI and TSH found in various studies did not necessarily imply a causal relationship. TSH and BMI could be affected by many factors other than each other.
Three large community-based studies on 19371 individuals demonstrated that the TSH changes were significantly associated with the subsequent BWT changes and not vice versa [8-10].
We studied the BWT changes on different TSH concentrations and showed mixed results of different levels of significance. In Díez et al., the association between serum TSH and obesity was only significant in patients with serum TSH > 3.6 μIU/mL. Individuals with serum TSH levels in the highest tertile had the highest BMI values [14]. Boeving et al. showed a lack of correlation between the degree of TSH suppression by LT4 therapy and BMI regardless of the LT4 therapy and at any level of TSH between 0.4 and 4 μIU/mL [16]. Karmisholt et al. showed that individuals with TSH levels in the upper ranges have higher BMI, and those with TSH in lower ranges had a lower BMI [23].
There was a trend for the BWT changes in the enrolled patients with hypothyroidism toward modest initial reduction after initiation of LT4 therapy, then gradual step-up of BWT during the next 24 months of follow-up. Our findings were similar to Hoogwerf et al. and Weinreb et al., which demonstrated an initial reduction in BWT followed by a return to baseline BWT after one year, with a step-up pattern [3,21]. However, the exact mechanism behind the degree of BWT change with thyroid dysfunction and the LT4 effect was poorly understood [5]. The significant step-up BWT gain suggests that mild iatrogenic hyperthyroidism does not promote BWT loss or prevent aging-related BWT gain [29].
The early BWT loss following LT4 therapy to the pre-hypothyroidism level reflected the loss of myxedematous tissue [3,23], while the total body energy equilibrium is maintained. Karmisholt et al. attributed this reduction further to the reduced capacity of renal free-water excretion, increased antidiuretic hormone level, and increased amount in tissues of glycosaminoglycans, which have a large water-binding capacity [23].
There was an overall BWT gain of 3.02 ± 0.77 kg and 3.78 ± 1.26 kg for patients with new and known hypothyroidism, respectively, after achieving euthyroidism within the two years of the follow-up. The Tromsø study revealed a mean BWT gain of 2.8 kg within the seven years of the study [15]. We did not explain the difference between the studies and why the patients in our study had more BWT gain within two years more than what was achieved in seven years in Tromsø's.
In this study, most of the patients had obesity from the start. Finally, they either maintained or gained more BWT, indicating that obesity will continue as an important complaint in those patients. This finding had been observed in many previous studies [11,30].
We could not include the measurements of free thyroxine and triiodothyronine in our analysis, which could add more information about the thyroid status of the patients because over the years, we have different platforms of different reference ranges and because these measurements were not available for all patients during their follow-up. The inaccessibility to the dual x-ray absorptiometry made us unable to verify the exact nature of loss in lean body mass. We could not evaluate the concurrent nonthyroidal illnesses during the follow-up, which affected both the ultimate BWT and TSH of patients with hypothyroidism on LT4 therapy. We have no data about energy balance through dietary factors and physical activity, which are essential covariates for thyroid function and ultimate BWT changes.
Conclusions
In contrast to what is believed, adequate treatment with LT4 does not associate with BWT reduction. Instead, either the patient maintained the same BWT or continued to gain more BWT. The exact association between TSH and BMI could not be confirmed through the study.
Acknowledgments
The authors express their sincere thanks to all of the medical staff in Faiha Specialized Diabetes, Endocrine and Metabolism Center (FDEMC).
The content published in Cureus is the result of clinical experience and/or research by independent individuals or organizations. Cureus is not responsible for the scientific accuracy or reliability of data or conclusions published herein. All content published within Cureus is intended only for educational, research and reference purposes. Additionally, articles published within Cureus should not be deemed a suitable substitute for the advice of a qualified health care professional. Do not disregard or avoid professional medical advice due to content published within Cureus.
The authors have declared that no competing interests exist.
Human Ethics
Consent was obtained or waived by all participants in this study
Animal Ethics
Animal subjects: All authors have confirmed that this study did not involve animal subjects or tissue.
References
- 1.Thyroid hormone regulation of metabolism. Mullur R, Liu YY, Brent GA. Physiol Rev. 2014;94:355–382. doi: 10.1152/physrev.00030.2013. [DOI] [PMC free article] [PubMed] [Google Scholar]
- 2.Obesity and thyroid function. Reinehr T. Mol Cell Endocrinol. 2010;316:165–171. doi: 10.1016/j.mce.2009.06.005. [DOI] [PubMed] [Google Scholar]
- 3.Long-term weight regulation in treated hyperthyroid and hypothyroid subjects. Hoogwerf BJ, Nuttall FQ. Am J Med. 1984;76:963–970. doi: 10.1016/0002-9343(84)90842-8. [DOI] [PubMed] [Google Scholar]
- 4.Reduced rate of energy expenditure as a risk factor for body-weight gain. Ravussin E, Lillioja S, Knowler WC, et al. N Engl J Med. 1988;318:467–472. doi: 10.1056/NEJM198802253180802. [DOI] [PubMed] [Google Scholar]
- 5.Thyroid hormone and obesity. Pearce EN. Curr Opin Endocrinol Diabetes Obes. 2012;19:408–413. doi: 10.1097/MED.0b013e328355cd6c. [DOI] [PubMed] [Google Scholar]
- 6.Thyroid hormones and changes in body weight and metabolic parameters in response to weight loss diets: the POUNDS LOST trial. Liu G, Liang L, Bray GA, et al. Int J Obes (Lond) 2017;41:878–886. doi: 10.1038/ijo.2017.28. [DOI] [PMC free article] [PubMed] [Google Scholar]
- 7.Small differences in thyroid function may be important for body mass index and the occurrence of obesity in the population. Knudsen N, Laurberg P, Rasmussen LB, Bülow I, Perrild H, Ovesen L, Jørgensen T. J Clin Endocrinol Metab. 2005;90:4019–4024. doi: 10.1210/jc.2004-2225. [DOI] [PubMed] [Google Scholar]
- 8.Relations of thyroid function to body weight: cross-sectional and longitudinal observations in a community-based sample. Fox CS, Pencina MJ, D'Agostino RB, Murabito JM, Seely EW, Pearce EN, Vasan RS. Arch Intern Med. 2008;168:587–592. doi: 10.1001/archinte.168.6.587. [DOI] [PubMed] [Google Scholar]
- 9.Serum TSH related to measures of body mass: longitudinal data from the HUNT Study, Norway. Svare A, Nilsen TI, Bjøro T, Asvold BO, Langhammer A. Clin Endocrinol (Oxf) 2011;74:769–775. doi: 10.1111/j.1365-2265.2011.04009.x. [DOI] [PubMed] [Google Scholar]
- 10.Thyroid function and body weight: a community-based longitudinal study. Bjergved L, Jørgensen T, Perrild H, et al. PLoS One. 2014;9:0. doi: 10.1371/journal.pone.0093515. [DOI] [PMC free article] [PubMed] [Google Scholar]
- 11.Clinical and social concerns in treated patients with primary hypothyroidism in Basrah: a cross sectional study. Alidrisi HA, Musa AK, Mansour AA. Am J Intern Med. 2015;3:256–263. [Google Scholar]
- 12.Thyroid function and obesity. Laurberg P, Knudsen N, Andersen S, Carlé A, Pedersen IB, Karmisholt J. Eur Thyroid J. 2012;1:159–167. doi: 10.1159/000342994. [DOI] [PMC free article] [PubMed] [Google Scholar]
- 13.Association of serum TSH with high body mass differs between smokers and never-smokers. Asvold BO, Bjøro T, Vatten LJ. J Clin Endocrinol Metab. 2009;94:5023–5027. doi: 10.1210/jc.2009-1180. [DOI] [PubMed] [Google Scholar]
- 14.Relationship between thyrotropin and body mass index in euthyroid subjects. Díez JJ, Iglesias P. Exp Clin Endocrinol Diabetes. 2011;119:144–150. doi: 10.1055/s-0030-1265133. [DOI] [PubMed] [Google Scholar]
- 15.Serum TSH is positively associated with BMI. Nyrnes A, Jorde R, Sundsfjord J. Int J Obes (Lond) 2006;30:100–105. doi: 10.1038/sj.ijo.0803112. [DOI] [PubMed] [Google Scholar]
- 16.Low-normal or high-normal thyrotropin target levels during treatment of hypothyroidism: a prospective, comparative study. Boeving A, Paz-Filho G, Radominski RB, Graf H, Amaral de Carvalho G. Thyroid. 2011;21:355–360. doi: 10.1089/thy.2010.0315. [DOI] [PubMed] [Google Scholar]
- 17.Lipoprotein profile in subclinical hypothyroidism: response to levothyroxine replacement, a randomized placebo-controlled study. Caraccio N, Ferrannini E, Monzani F. J Clin Endocrinol Metab. 2002;87:1533–1538. doi: 10.1210/jcem.87.4.8378. [DOI] [PubMed] [Google Scholar]
- 18.Significant inverse relationship between serum free T4 concentration and body mass index in euthyroid subjects: differences between smokers and nonsmokers. Makepeace AE, Bremner AP, O'Leary P, Leedman PJ, Feddema P, Michelangeli V, Walsh JP. Clin Endocrinol (Oxf) 2008;69:648–652. doi: 10.1111/j.1365-2265.2008.03239.x. [DOI] [PubMed] [Google Scholar]
- 19.Lack of association between serum TSH or free T4 and body mass index in euthyroid subjects. Manji N, Boelaert K, Sheppard MC, Holder RL, Gough SC, Franklyn JA. Clin Endocrinol (Oxf) 2006;64:125–128. doi: 10.1111/j.1365-2265.2006.02433.x. [DOI] [PubMed] [Google Scholar]
- 20.Emerging cardiovascular risk factors in subclinical hypothyroidism: lack of change after restoration of euthyroidism. Pérez A, Cubero JM, Sucunza N, et al. Metabolism. 2004;53:1512–1515. doi: 10.1016/j.metabol.2004.05.016. [DOI] [PubMed] [Google Scholar]
- 21.Do patients gain weight after thyroidectomy for thyroid cancer? Weinreb JT, Yang Y, Braunstein GD. Thyroid. 2011;21:1339–1342. doi: 10.1089/thy.2010.0393. [DOI] [PubMed] [Google Scholar]
- 22.Smoking cessation is followed by a sharp but transient rise in the incidence of overt autoimmune hypothyroidism - a population-based, case-control study. Carlé A, Bülow Pedersen I, Knudsen N, et al. Clin Endocrinol (Oxf) 2012;77:764–772. doi: 10.1111/j.1365-2265.2012.04455.x. [DOI] [PubMed] [Google Scholar]
- 23.Weight loss after therapy of hypothyroidism is mainly caused by excretion of excess body water associated with myxoedema. Karmisholt J, Andersen S, Laurberg P. J Clin Endocrinol Metab. 2011;96:0–103. doi: 10.1210/jc.2010-1521. [DOI] [PubMed] [Google Scholar]
- 24.Resting energy expenditure is sensitive to small dose changes in patients on chronic thyroid hormone replacement. Al-Adsani H, Hoffer LJ, Silva JE. J Clin Endocrinol Metab. 1997;82:1118–1125. doi: 10.1210/jcem.82.4.3873. [DOI] [PubMed] [Google Scholar]
- 25.Associations of leptin, insulin resistance and thyroid function with long-term weight loss in dieting obese men. Näslund E, Andersson I, Degerblad M, Kogner P, Kral JG, Rössner S, Hellström PM. J Intern Med. 2000;248:299–308. doi: 10.1046/j.1365-2796.2000.00737.x. [DOI] [PubMed] [Google Scholar]
- 26.The effect of body weight and weight loss on thyroid volume and function in obese women. Sari R, Balci MK, Altunbas H, Karayalcin U. Clin Endocrinol (Oxf) 2003;59:258–262. doi: 10.1046/j.1365-2265.2003.01836.x. [DOI] [PubMed] [Google Scholar]
- 27.Thyroid and obesity: not a one-way interaction. Rotondi M, Magri F, Chiovato L. J Clin Endocrinol Metab. 2011;96:344–346. doi: 10.1210/jc.2010-2515. [DOI] [PubMed] [Google Scholar]
- 28.Thyroid hormone levels predict the change in body weight: a prospective study. Soriguer F, Valdes S, Morcillo S, et al. Eur J Clin Invest. 2011;41:1202–1209. doi: 10.1111/j.1365-2362.2011.02526.x. [DOI] [PubMed] [Google Scholar]
- 29.Iatrogenic hyperthyroidism does not promote weight loss or prevent ageing-related increases in body mass in thyroid cancer survivors. Polotsky HN, Brokhin M, Omry G, Polotsky AJ, Tuttle RM. Clin Endocrinol (Oxf) 2012;76:582–585. doi: 10.1111/j.1365-2265.2011.04264.x. [DOI] [PubMed] [Google Scholar]
- 30.Psychological well-being in patients on 'adequate' doses of l-thyroxine: results of a large, controlled community-based questionnaire study. Saravanan P, Chau WF, Roberts N, Vedhara K, Greenwood R, Dayan CM. Clin Endocrinol (Oxf) 2002;57:577–585. doi: 10.1046/j.1365-2265.2002.01654.x. [DOI] [PubMed] [Google Scholar]


