

Abstract
Most proteins associate into multimeric complexes with specific architectures1,2, which often have functional properties like cooperative ligand binding or allosteric regulation3. No detailed knowledge is available about how any multimer and its functions arose during historical evolution. Here we use ancestral protein reconstruction and biophysical assays to dissect the origins of vertebrate hemoglobin (Hb), a heterotetramer of paralogous α and β subunits, which mediates respiratory oxygen transport and exchange by cooperatively binding oxygen with moderate affinity. We show that modern Hb evolved from an ancient monomer and characterize the historical “missing-link” through which the modern tetramer evolved–a noncooperative homodimer with high oxygen affinity, which existed before the gene duplication that generated distinct α and β subunits. Reintroducing just two post-duplication historical substitutions into the ancestral protein is sufficient to cause strong tetramerization by creating favorable contacts with more ancient residues on the opposing subunit. These surface substitutions dramatically reduce oxygen affinity and even confer weak cooperativity, because of an ancient structural linkage between the oxygen binding site and the multimerization interface. Our findings establish that evolution can produce new complex molecular structures and functions via simple genetic mechanisms, which recruit existing biophysical features into higher-level architectures.
The interfaces that hold molecular complexes together typically involve sterically tight, electrostatically complementary interactions among many amino acids4. Similarly, allostery and cooperativity usually depend on numerous residues that connect surfaces to active sites5. Acquiring such complicated machinery would seem to require elaborate evolutionary pathways. The classical explanation, by analogy to the evolution of morphological complexity, is that multimerization conferred or enhanced beneficial functions, allowing selection to drive the many substitutions required to build and optimize new interfaces4,6.
Whether this model accurately describes the evolution of any natural molecular complex requires a detailed reconstruction of the historical steps by which it evolved. The structural mechanisms that mediate Hb’s multimeric assembly, cooperative oxygen binding, and allosteric regulation are well established7,8. Despite considerable speculation9–11, however, virtually nothing is known about the evolutionary origin of Hb’s heterotetrameric architecture and the functions that depend on it.
From monomer to homodimer.
We inferred the phylogeny of Hb and closely related globins (Fig. 1A, Ext. Fig. 1a,b,e). Hbα and Hbβ subunits are sister paralogs produced by a gene duplication that occurred before the last common ancestor of jawed vertebrates (Fig. 1a). The closest outgroups – myoglobin (Mb)12, globin E13, and globin Y (Extended Fig. 1d) – are monomers. A more distant clade of agnathan “hemoglobin” and vertebrate cytoglobin includes monomers and dimers14,15, but the dimers assemble through interfaces that differ from each other and from those used in Hb, indicating parallel acquisition16,17. These observations suggest that the Hb α2β2 heterotetramer evolved from an ancestral monomer via an unknown intermediate form.
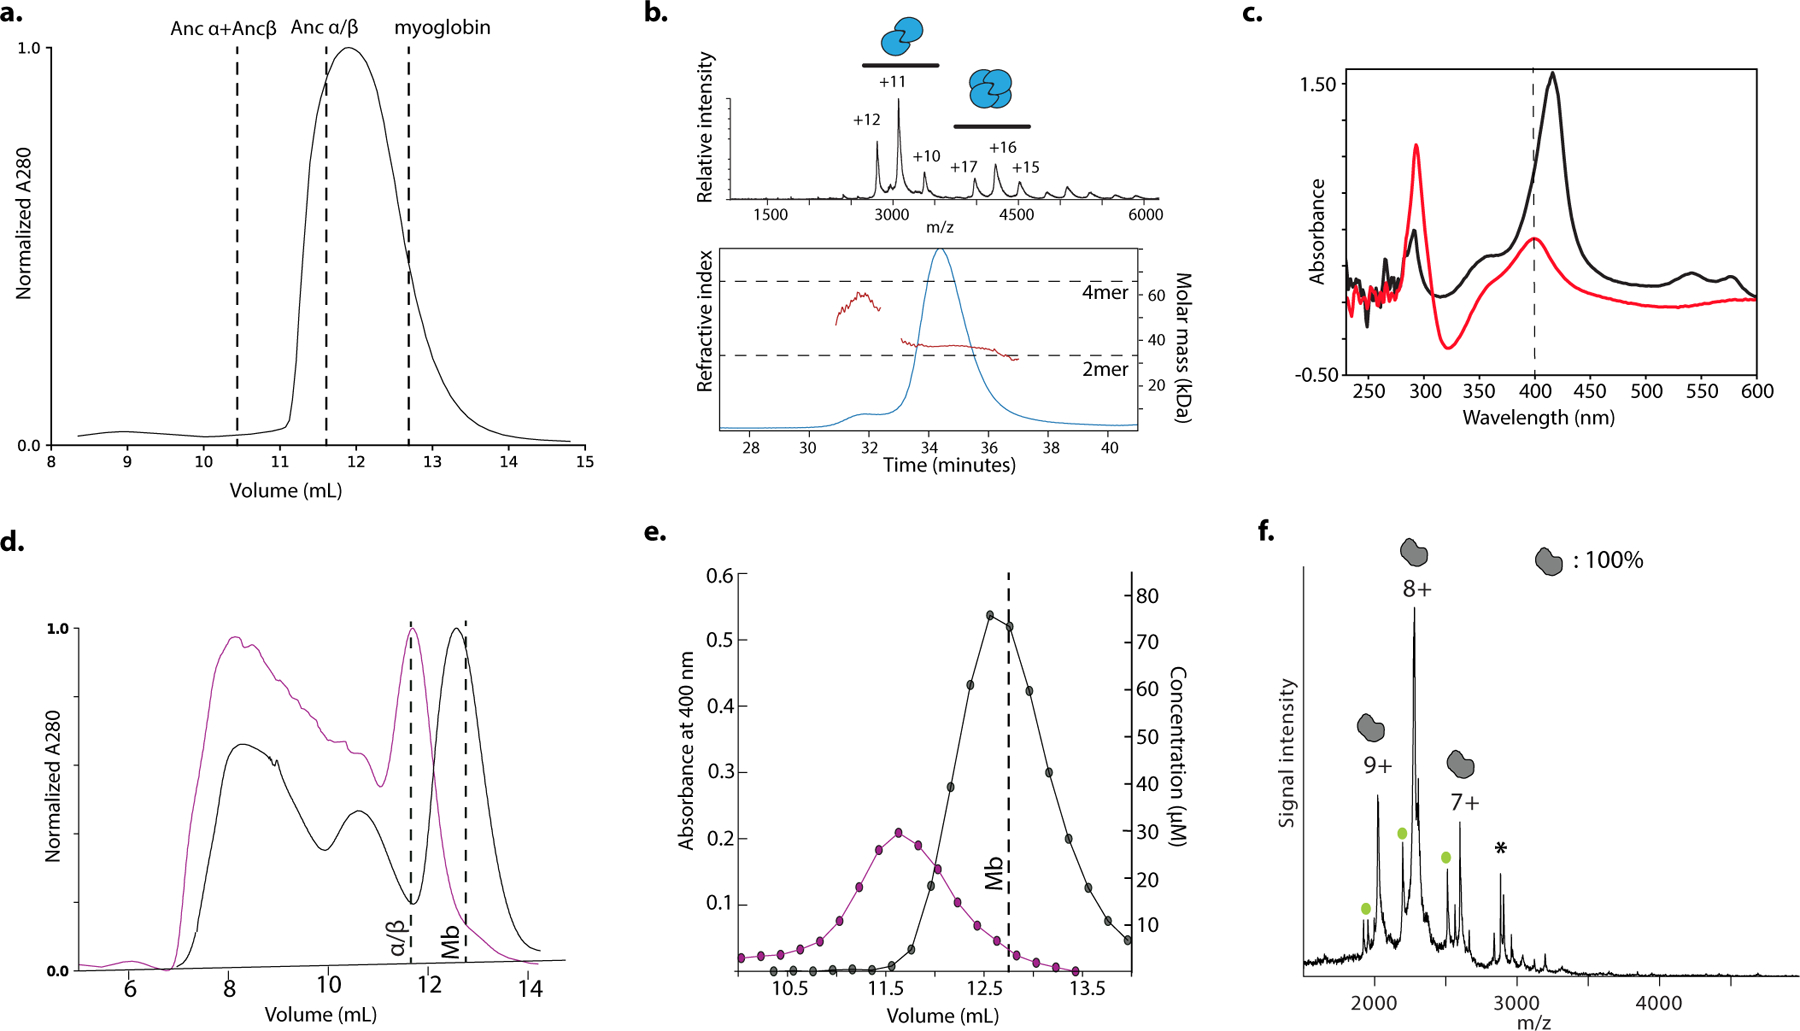
Figure 1. Structure and function of ancestral globins.
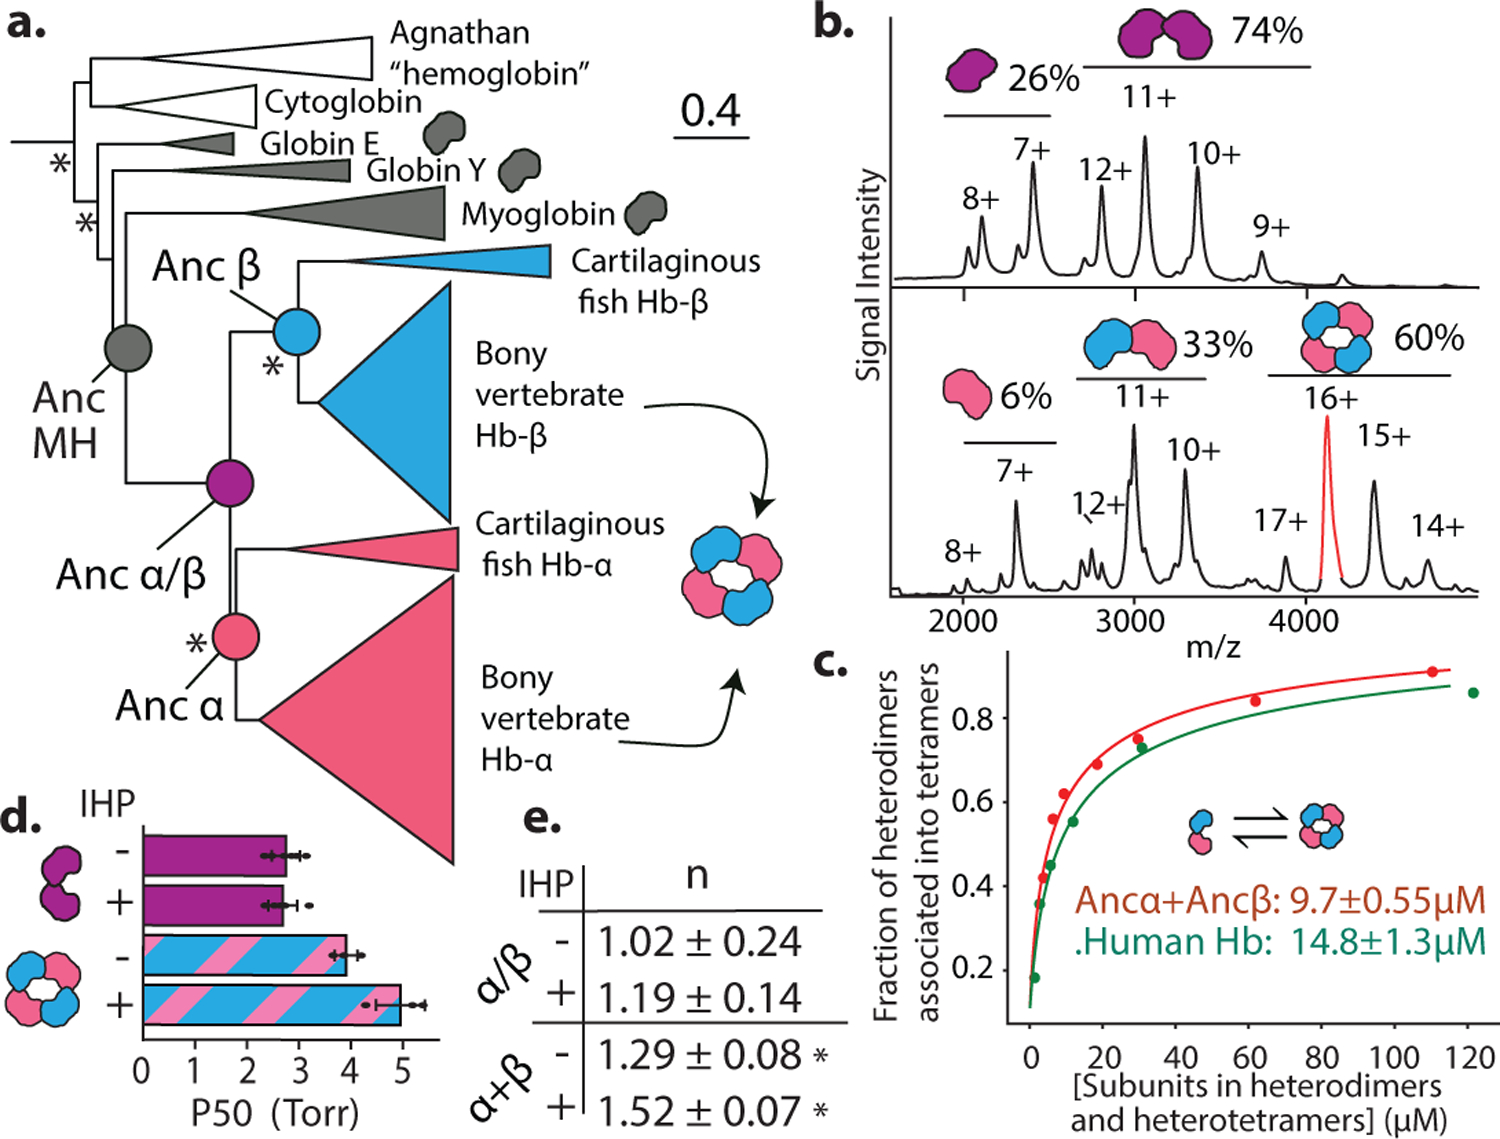
a) Simplified phylogeny of vertebrate globins. Icons, oligomeric states. *, approximate likelihood ratio statistic >10. Complete phylogeny in Extended Figure 1a. Circles, reconstructed ancestral proteins. b) nMS spectra of Ancα/β (upper, purple) and Ancα+Ancβ (lower, pink+blue) at 20 μM. Charge states, stoichiometries, and occupancy (fraction of moles of subunits) shown. Red, analyzed by MSMS in Extended Fig. 2e. c) Dimer-to-tetramer affinity of Ancα+Ancβ (red) and Human Hb (green). Circles, fraction of α+β heterodimers incorporated into α2β2 tetramers, measured once by nMS. Kd (dissociation constant, with SE, in moles of subunits in heterodimers or heterotetramers) estimated by nonlinear regression. d,e) Oxygen affinity (P50) and cooperativity (Hill coefficient, n) of Ancα/β and Ancα+Ancβ. +IHP, 2x molar excess inositol hexaphosphate. Mean and 95% c.i. from 3–5 replicates (dots) shown. *, significant cooperativity (n≠1, P<0.05, F-test; Extended Fig. 1f).
To characterize when and how the tetramer evolved, we first reconstructed Hb of the ancestral jawed vertebrate by phylogenetically inferring the sequences of the ancestral α and β subunits (Fig. 1a, Extended Fig 1b–c). We coexpressed and purified Ancα and Ancβ and characterized their assembly using native mass spectrometry (nMS), size-exclusion chromatography (SEC) and multi-angle light scattering. Like extant Hb, Ancα+Ancβ associate into α2β2 heterotetramers, with a tetramer-dimer dissociation constant (Kd) of 10 μM, comparable to human Hb (15 μM, Fig. 1b–c, Extended Fig. 2a–c,f,i). Expressed in isolation, Ancα forms homodimers (Ext. Fig. 4a), and Ancβ forms homotetramers (Ext. Fig. 4b), just as extant Hb subunits do18,19. Hb’s heterotetrameric structure therefore evolved before the jawed vertebrate ancestor.
In contrast, Ancα/β, the pre-duplication ancestral protein, homodimerizes with a Kd of 9 μM measured by nMS, but the tetrameric state is unoccupied (Fig 1b, Extended Fig. 2d,f–g). Even at 1.4 mM, no tetramers are detectable using SEC (Extended Fig. 2h). Ancα/β was therefore a homodimer, with virtually no propensity to tetramerize. This result is robust to incorporating statistical uncertainty about the ancestral sequence in an alternative construct (Ext. Fig. 3). This is also the most parsimonious history, because extant Hbα dimerizes and Hbβ tetramerizes when expressed in isolation18,19: a monomeric Ancα/β would imply independent gains of dimerization, and a tetramer would require early gain of tetramerization followed by loss in Hbα (Extended Fig. 3).
AncMH, the common ancestor of Hb and myoglobin, is monomeric. No higher-order stoichiometries were detected using nMS of His-tagged AncMH at 70 μM (Extended Fig. 4f). Even at 600 μM, only monomers are apparent using SEC (Extended Fig. 2j). The untagged protein also does not dimerize at concentrations at which Ancα/β is predominantly dimeric, as shown using SEC and a globin-specific concentration assay on lysate from transformed cells (Ext. Fig. 4d–e). A monomeric AncMH is also the most parsimonious scenario, because its closest outgroups are all monomers (Extended Fig. 3b–e).
The Ancα/β homodimer is therefore the evolutionary missing link between an ancient monomer and the Hb heterotetramer. After duplication, a novel interaction evolved, enabling these dimers to associate into tetramers.
Evolution of Hb functions.
We characterized the evolution of Hb’s functional properties by assaying the ancestral proteins’ oxygen binding characteristics. Modern Hb’s physiological role – loading oxygen in the lungs/gills and unloading it in the periphery – is possible because Hb binds and releases oxygen cooperatively and has affinity lower than myoglobin; its affinity is further reduced by allosteric effectors8. Like human Hb, Ancα+Ancβ displays measurable cooperativity, and its oxygen affinity is similar to that of stripped, recombinant human Hb20 (Fig. 1d–e). Ancα+Ancβ’s affinity is reduced in the presence of the allosteric effector inositol hexaphosphate (IHP), although less so than that of human Hb20. The functional characteristics of extant Hb were therefore in place by the jawed vertebrate ancestor.
In contrast, Ancα/β has oxygen affinity significantly higher than Ancα+Ancβ, and it does not display detectable cooperativity or allosteric regulation by IHP (Fig. 1d–e, Supplementary Discussion). The major functional characteristics of modern Hb therefore evolved between Ancα/β and Ancα+Ancβ, the same interval during which tetramerization evolved. This also represents the most parsimonious history: Hb tetramers are cooperative, but Hbα homodimers and Hbβ homotetramers are not18,21, suggesting that this property did not yet exist in their common ancestor (Extended Fig. 3).
If Ancα/β lacked cooperativity, allostery, or reduced affinity, it could not have performed the physiological role that Hb now plays in oxygen exchange. Further, the first step in the evolution of Hb’s tetrameric architecture – acquisition of homodimerization from a monomeric ancestor – could not have been driven by selection for Hb’s major functional properties, because the homodimer did not possess any of them.
Ancestral and derived interfaces.
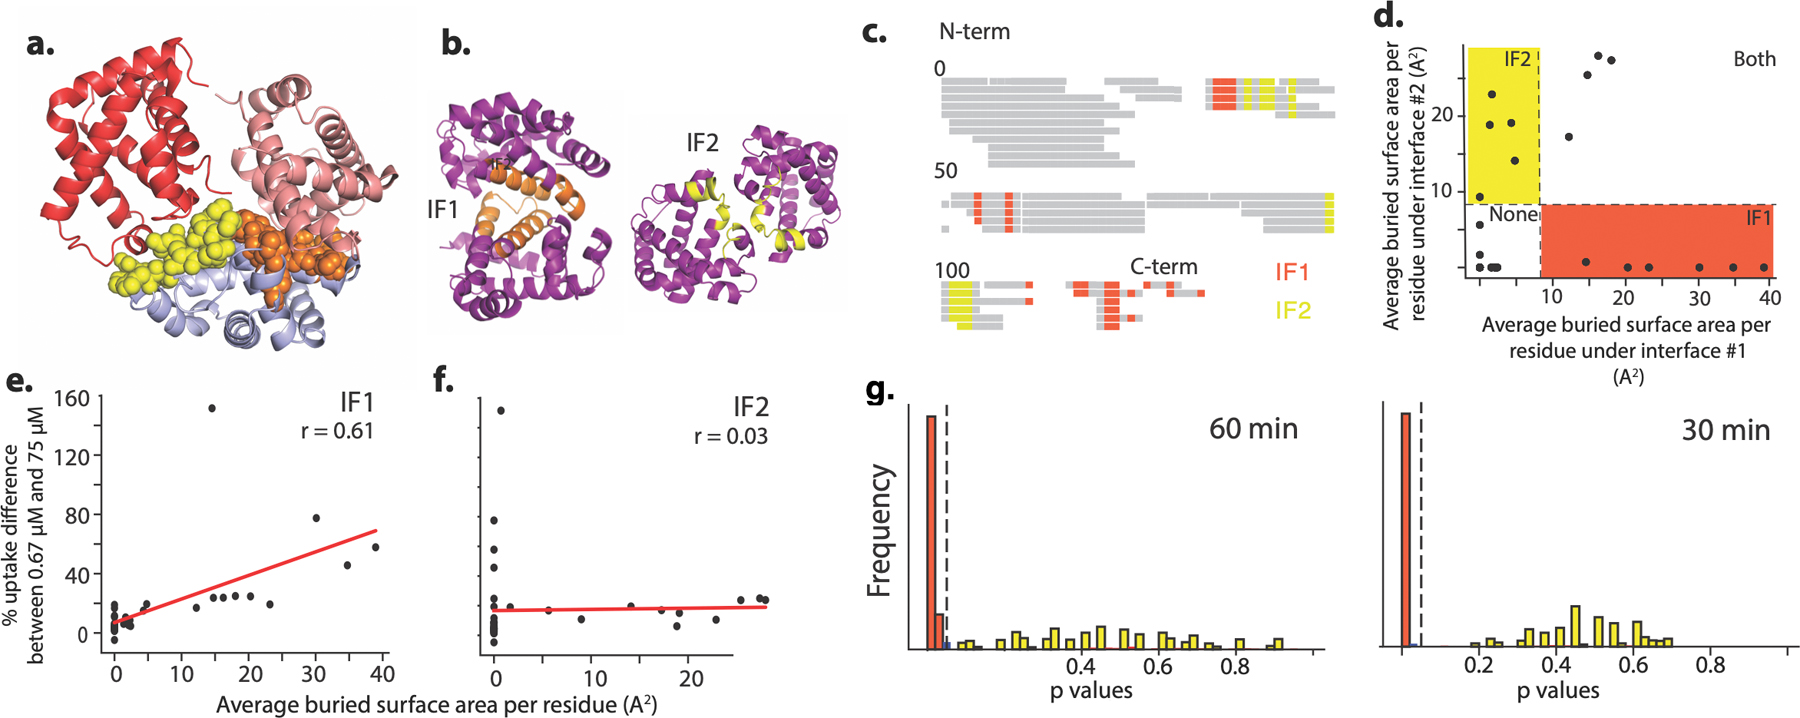
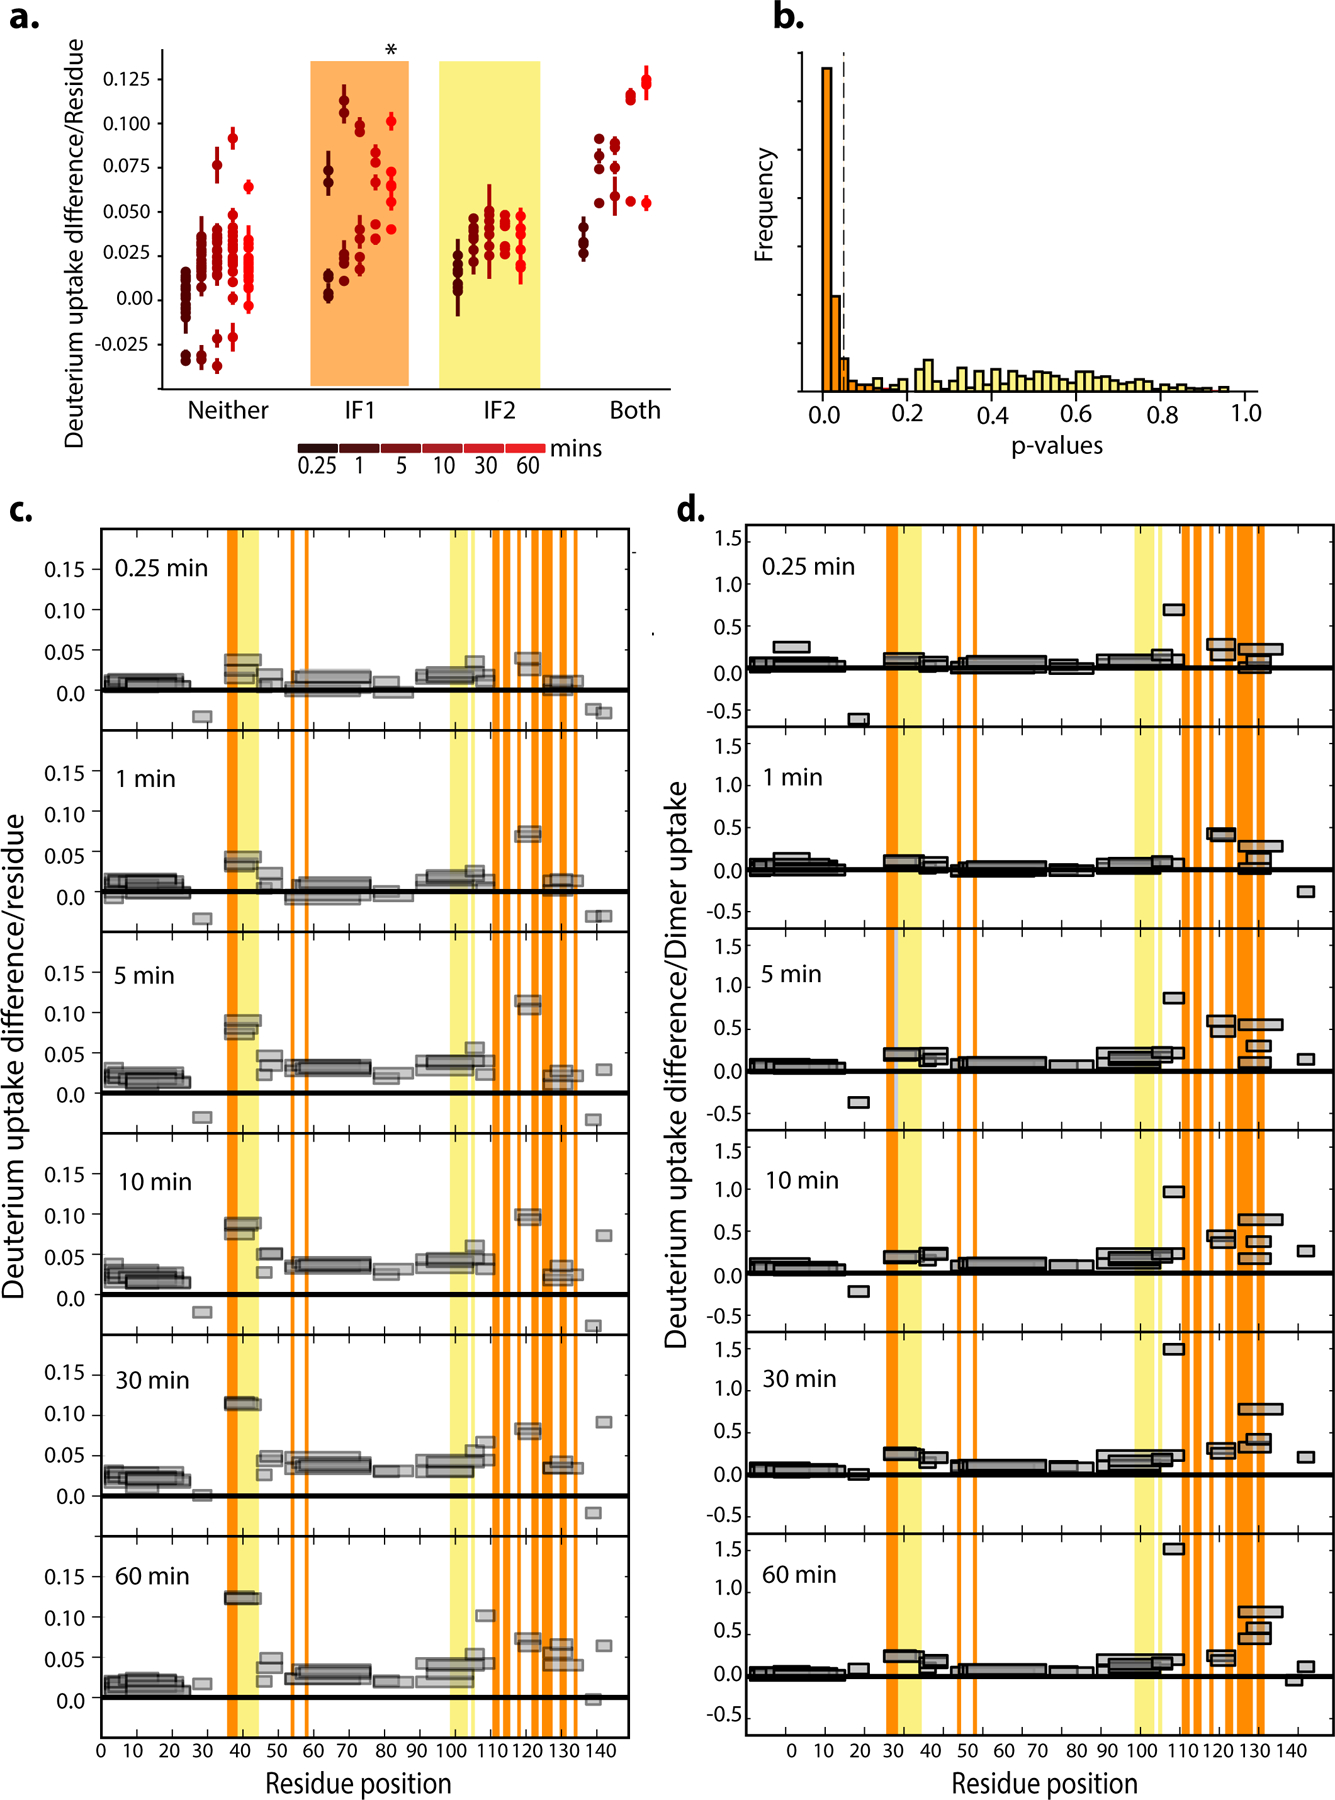
Hb assembly involves two distinct interfaces on each subunit: IF1 mediates α1-β1 and α2-β2 contacts, while IF2 mediates α1-β2 and α2-β1 contacts (Fig. 2a)7. To identify which interface evolved before Ancα/β, we applied hydrogen-deuterium exchange mass spectrometry (HDX-MS) to Ancα/β. We compared patterns of deuterium uptake at high versus low protein concentrations (at which dimers or monomers predominate, respectively, Extended Fig. 2d,f–g). Solvent-exposed residues incorporate deuterium faster than buried residues, so peptides that contribute to the dimer interface should exhibit higher deuterium uptake when the monomeric state predominates. We found that Ancα/β peptides with residues in IF1 incorporate significantly more deuterium under monomer-favoring than dimer-favoring conditions; no difference was observed for IF2 (Fig. 2b–c, Ext. Fig. 5–7). Moreover, mutating residues in IF1 substantially impairs Ancα/β dimerization, but a mutation that disrupts IF2 in human Hb22 had no effect (Fig. 2d, Ext. Fig. 7c, Ext. Fig. 9). Reverting all IF1 residues in Ancα/β to the amino acid state from AncMH yielded predominantly monomers, but reverting those at IF2 had no effect (Fig. 2d, Ext. Fig. 7d).
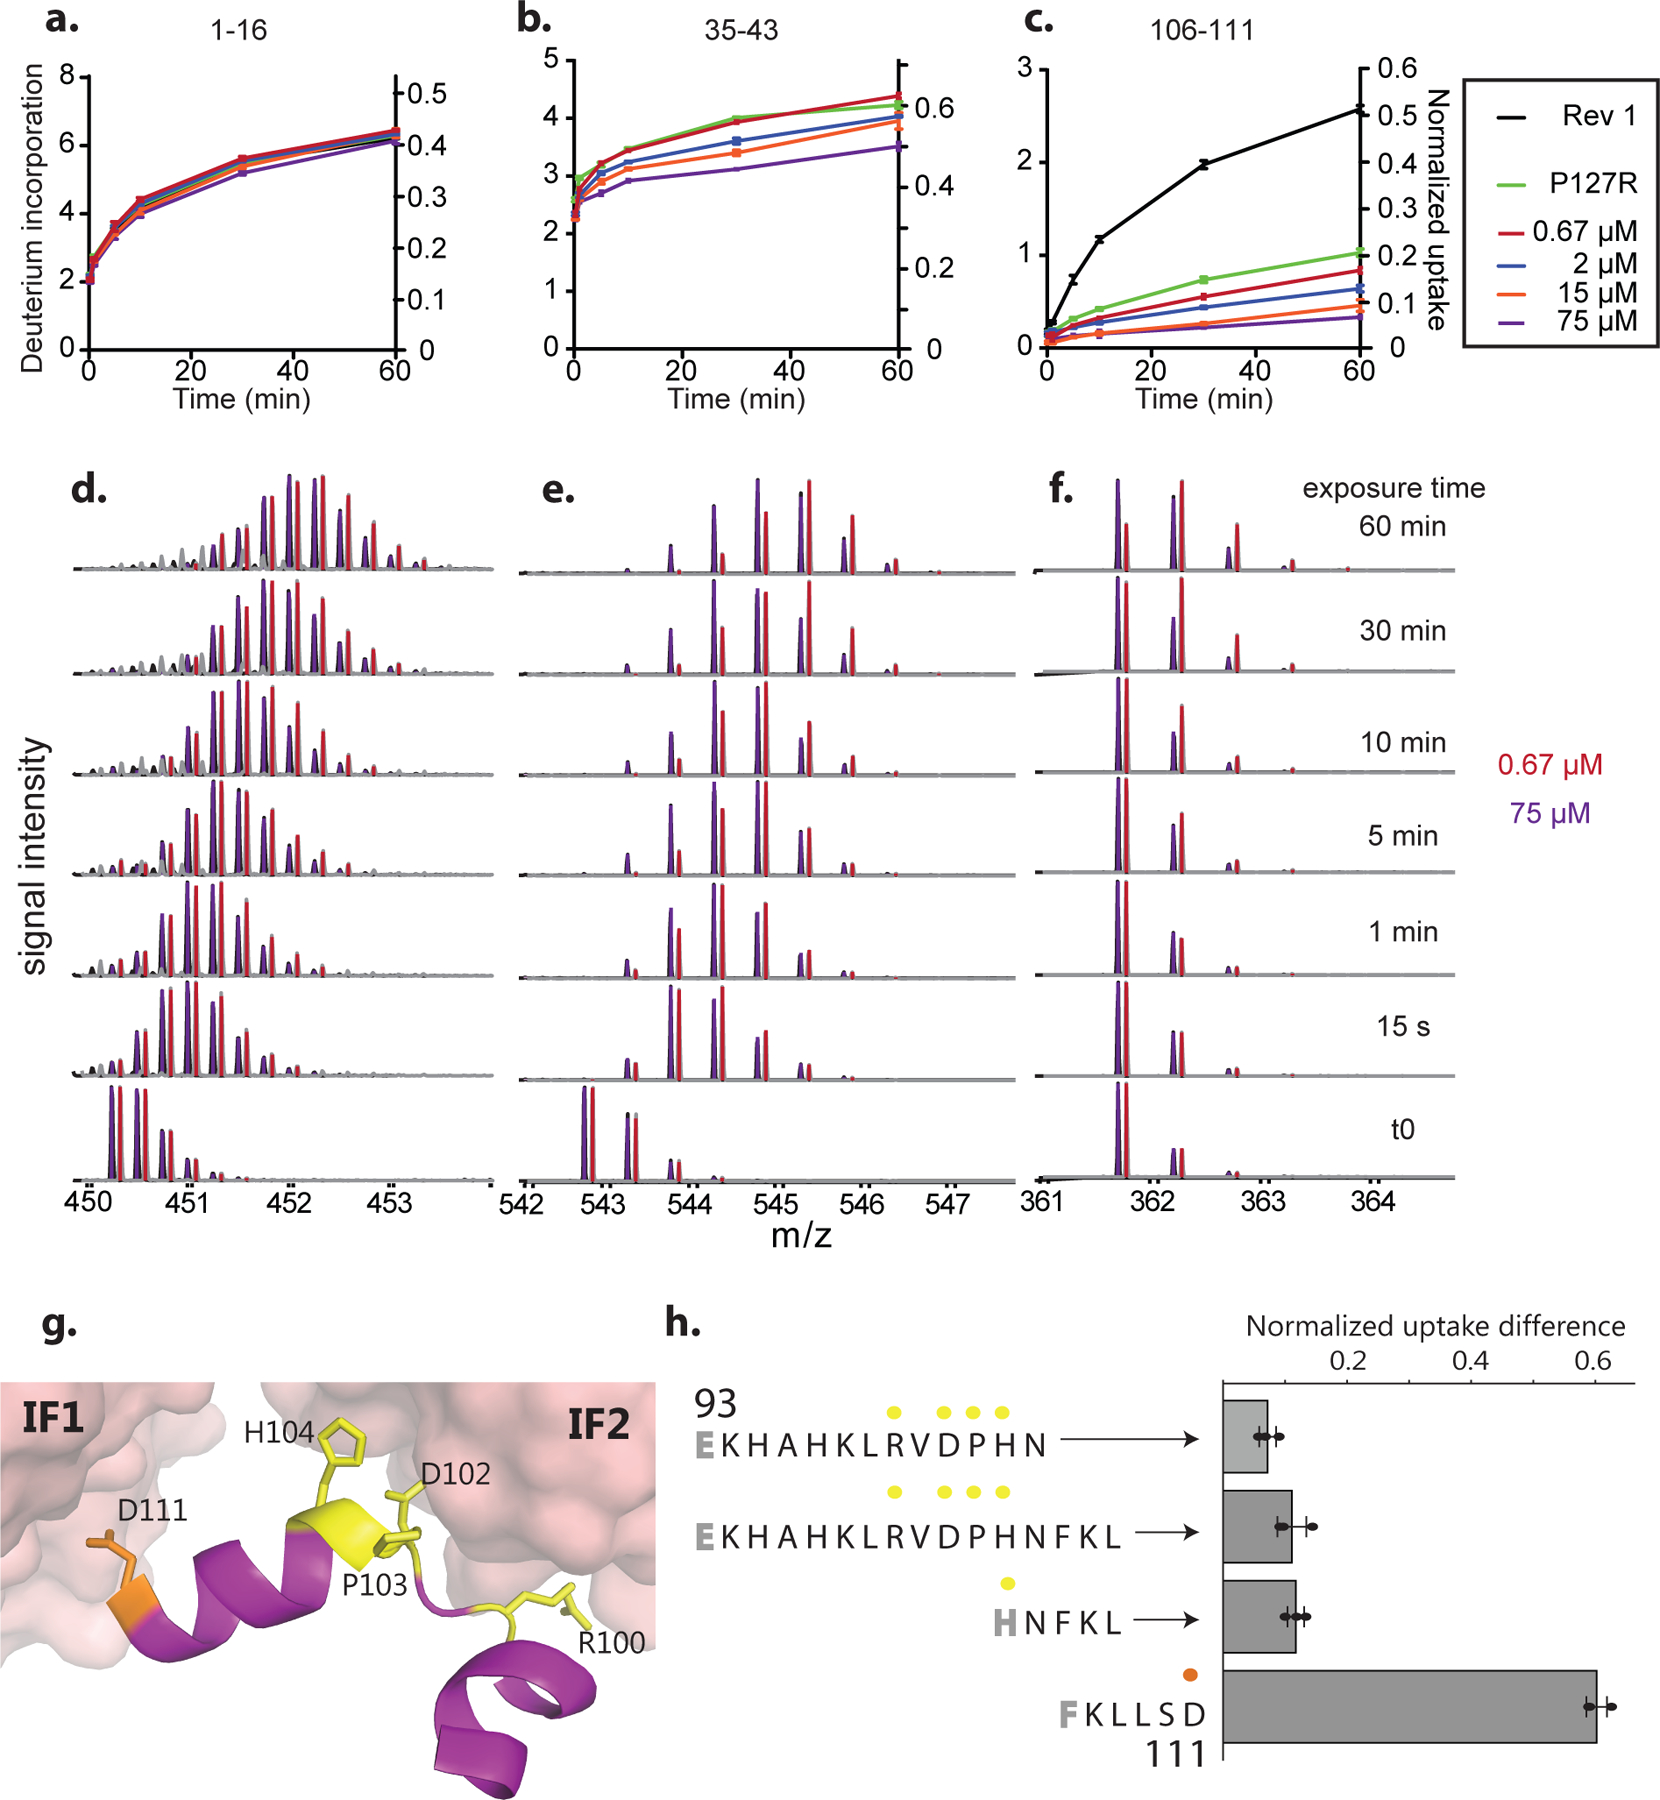
Figure 2. Identification of homodimerization interface in Ancα/β.
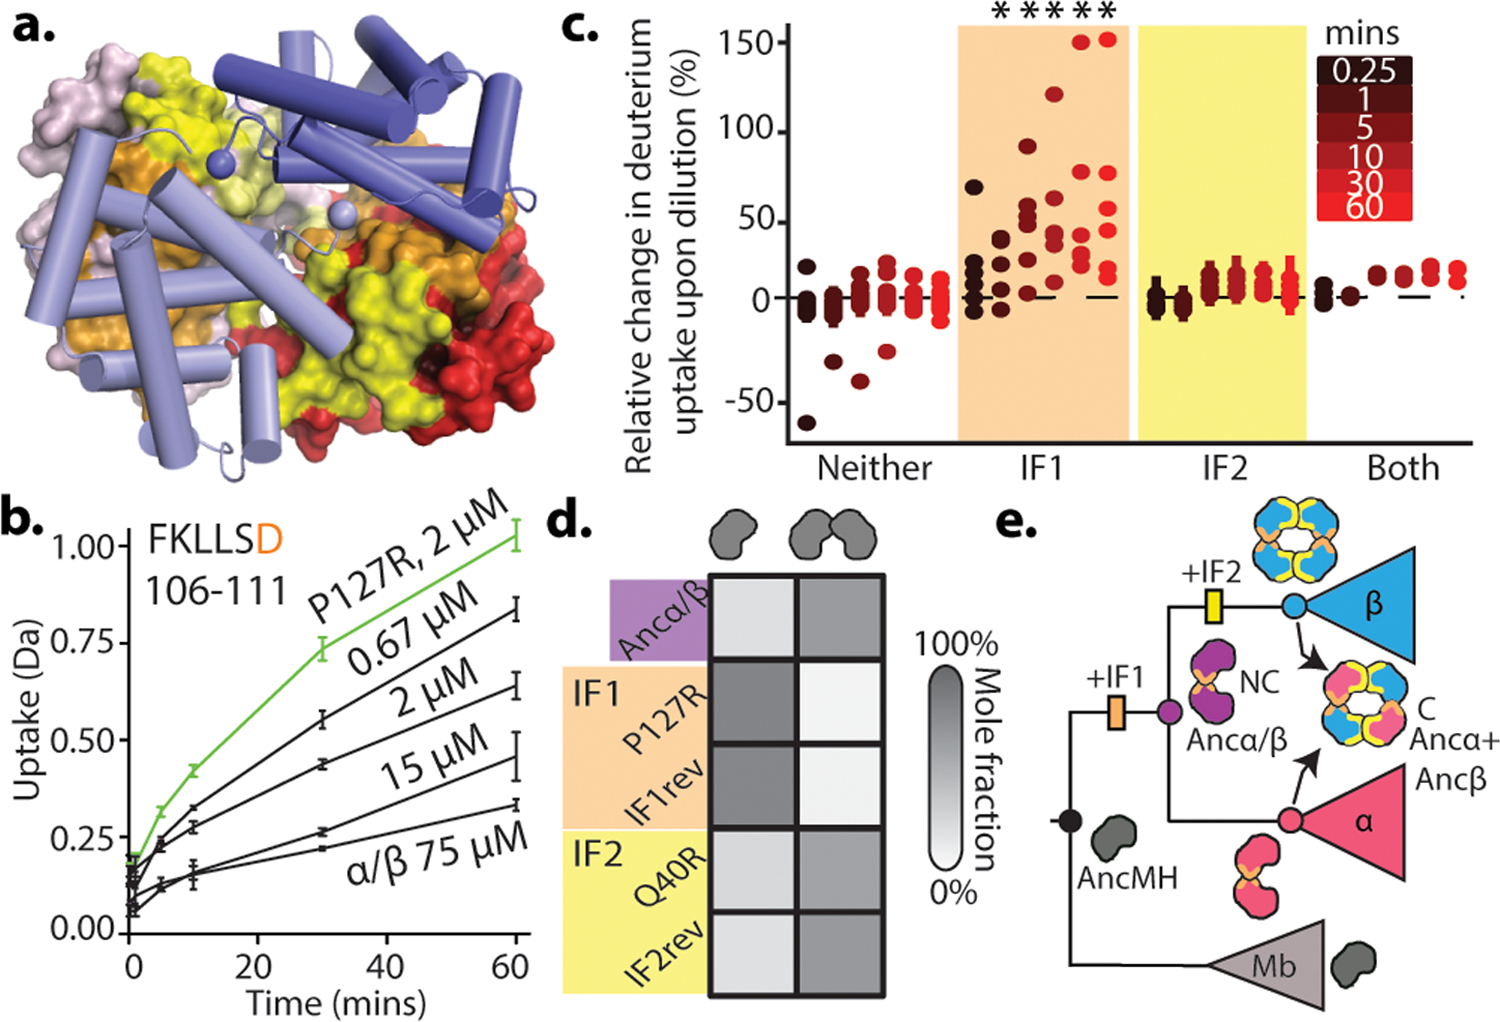
a) Hb heterotetramers assemble via two interfaces (IF1, orange; IF2, yellow) on each subunit. Red and pink surfaces, α subunits; blue cartoon, β subunits. Ancα+Ancβ homology model is shown. b) Deuterium incorporation by an Ancα/β peptide that contributes to IF1 (Extended Fig. 5g,h). Uptake (mean and SE from 3 replicates per incubation time) is shown for Ancα/β (black) and monomeric IF1 mutant P127R (green). c)Each circle, mean difference in deuterium uptake by one Ancα/β peptide when expressed at monomer-favoring vs. dimer-favoring concentrations (0.67 and 75 μM, 3 replicates each, with SE). Peptides are classified by the interface to which they contribute and colored by incubation time. *, mean uptake in interface category significantly different from other categories (P<0.05, permutation test, Extended Figs. 6g,7). d) Dimer and monomer occupancy by Ancα/β and mutants, assessed using nMS at 20 μM. P127R and Q40R disrupt IF1 and IF2, respectively. IF1rev and IF2rev revert historical substitutions to state in AncMH (spectra in Extended Fig. 7c–d). e) Evolution of Hb tetramer. Rectangles, acquisition of IF1 and IF2. C, cooperative; NC, noncooperative. Mb, myoglobin.
Ancα/β homodimers therefore assembled via IF1. After duplication, IF2 evolved, enabling assembly of dimers into tetramers (Fig. 2e). Corroborating this inference, extant Hbα homodimers assemble via IF1, whereas Hbβ tetramers use both IF1 and IF2, indicating inheritance of IF1 from their ancestor Ancα/β. This finding explains why Ancα/β is neither cooperative nor allosterically regulated, because both functions require IF2-mediated assembly into tetramers.23
Genetic mechanisms for the new interface.
The causal substitutions for the evolution of heterotetramers from the homodimer must have occurred on one or both of the post-duplication branches leading from Ancα/β to Ancα and to Ancβ. On the Ancα branch, there were only 3 changes, of which none were at IF2. On the Ancβ branch, there were 42 changes, including 5 at IF2 and 4 others at IF1 (Fig. 3a).
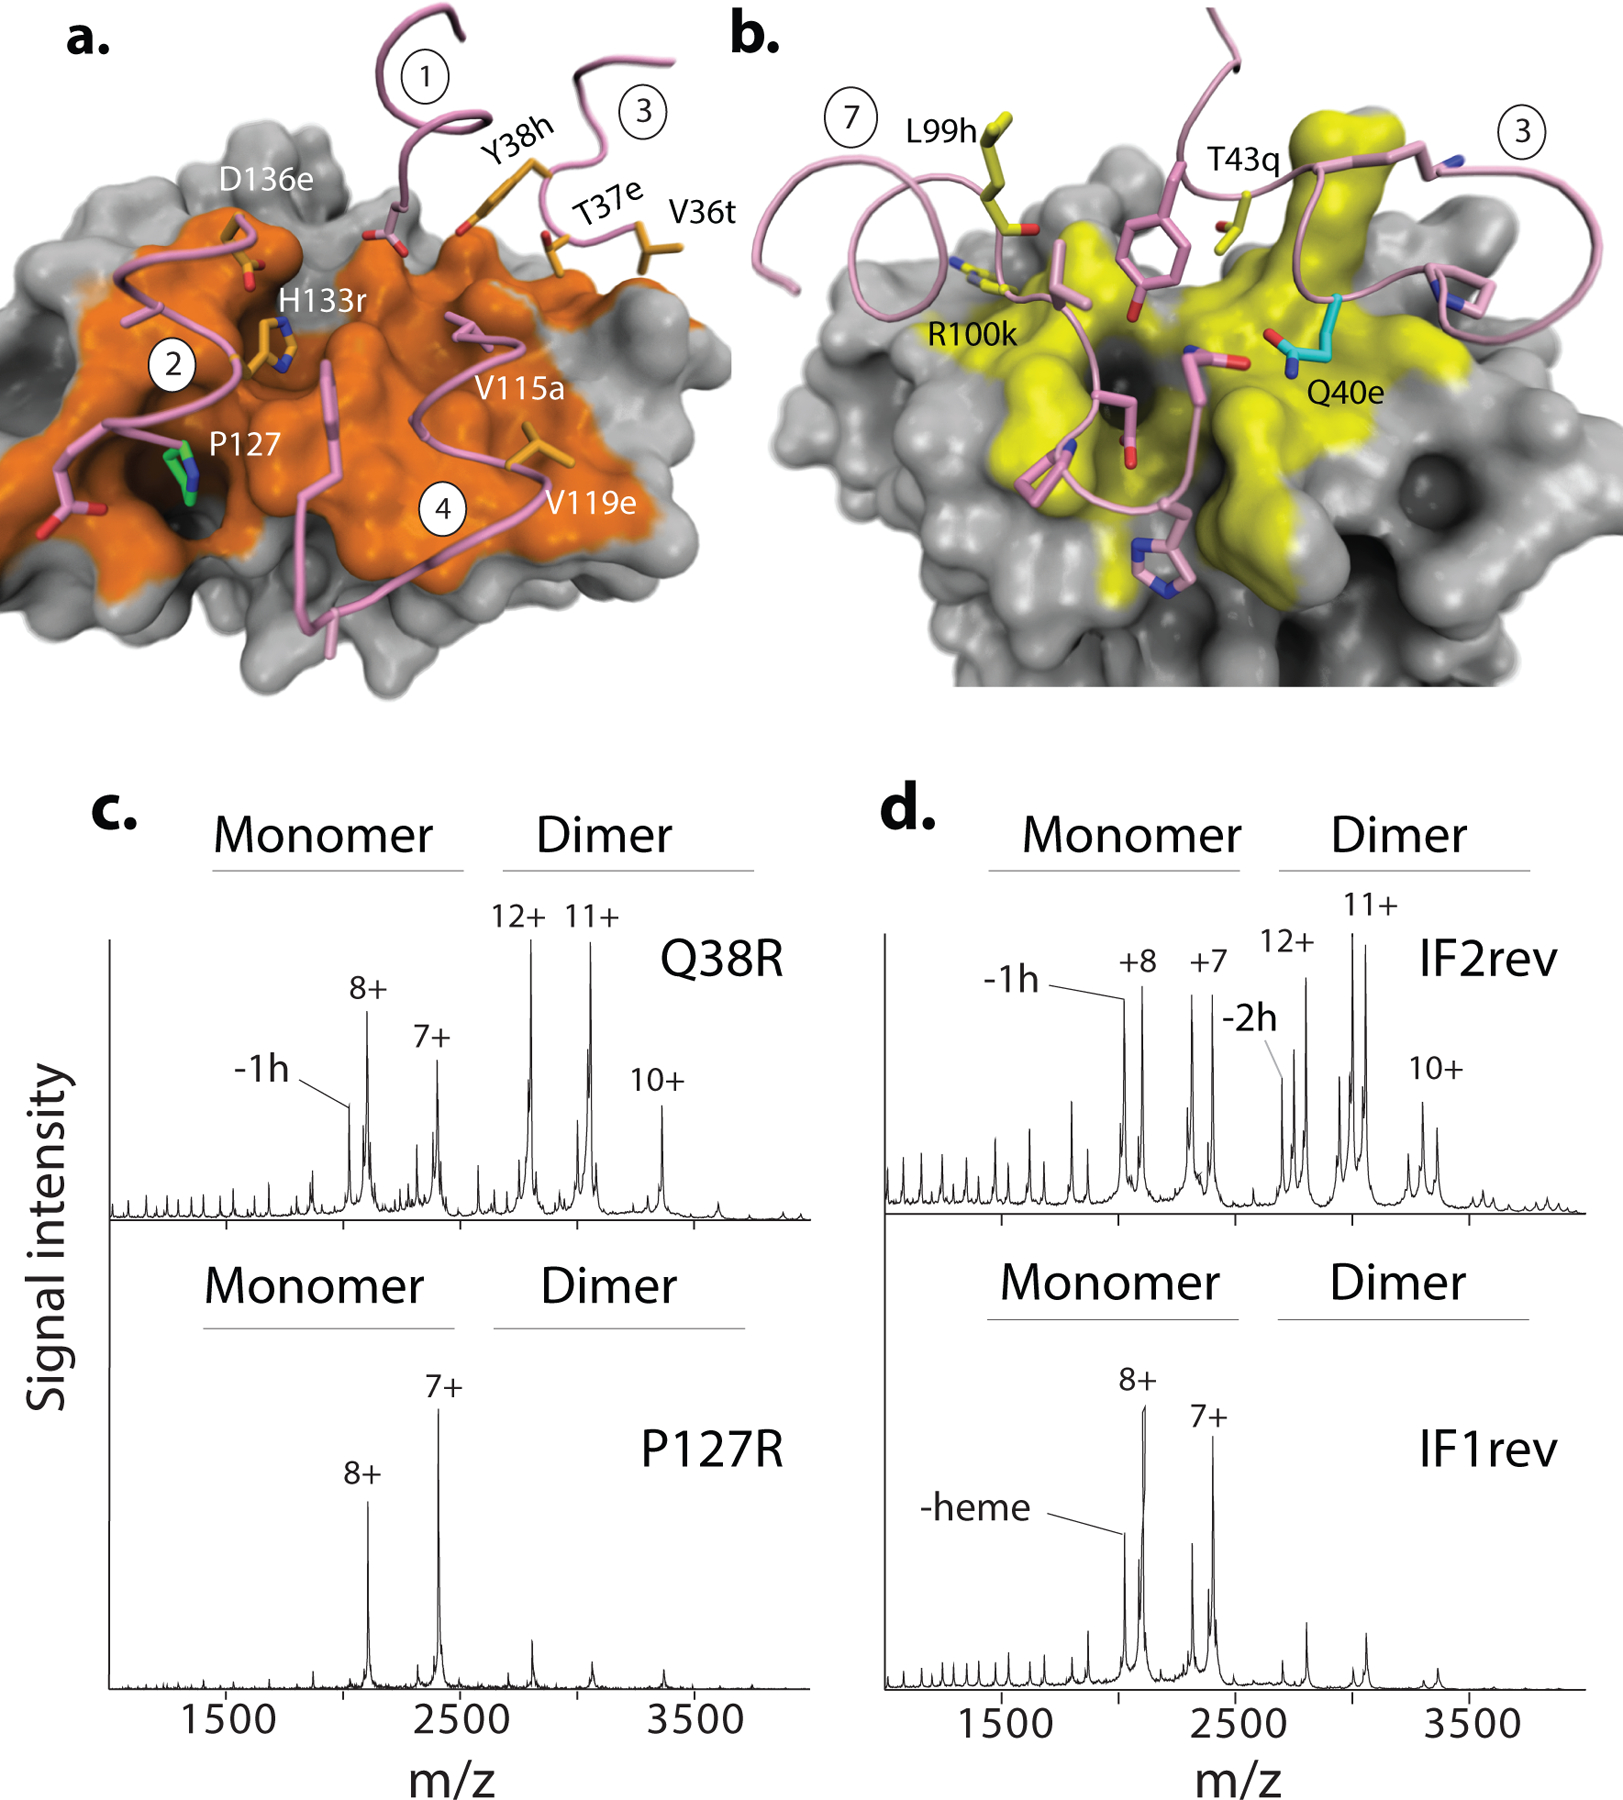
Figure 3. Genetic mechanisms of tetramer evolution.
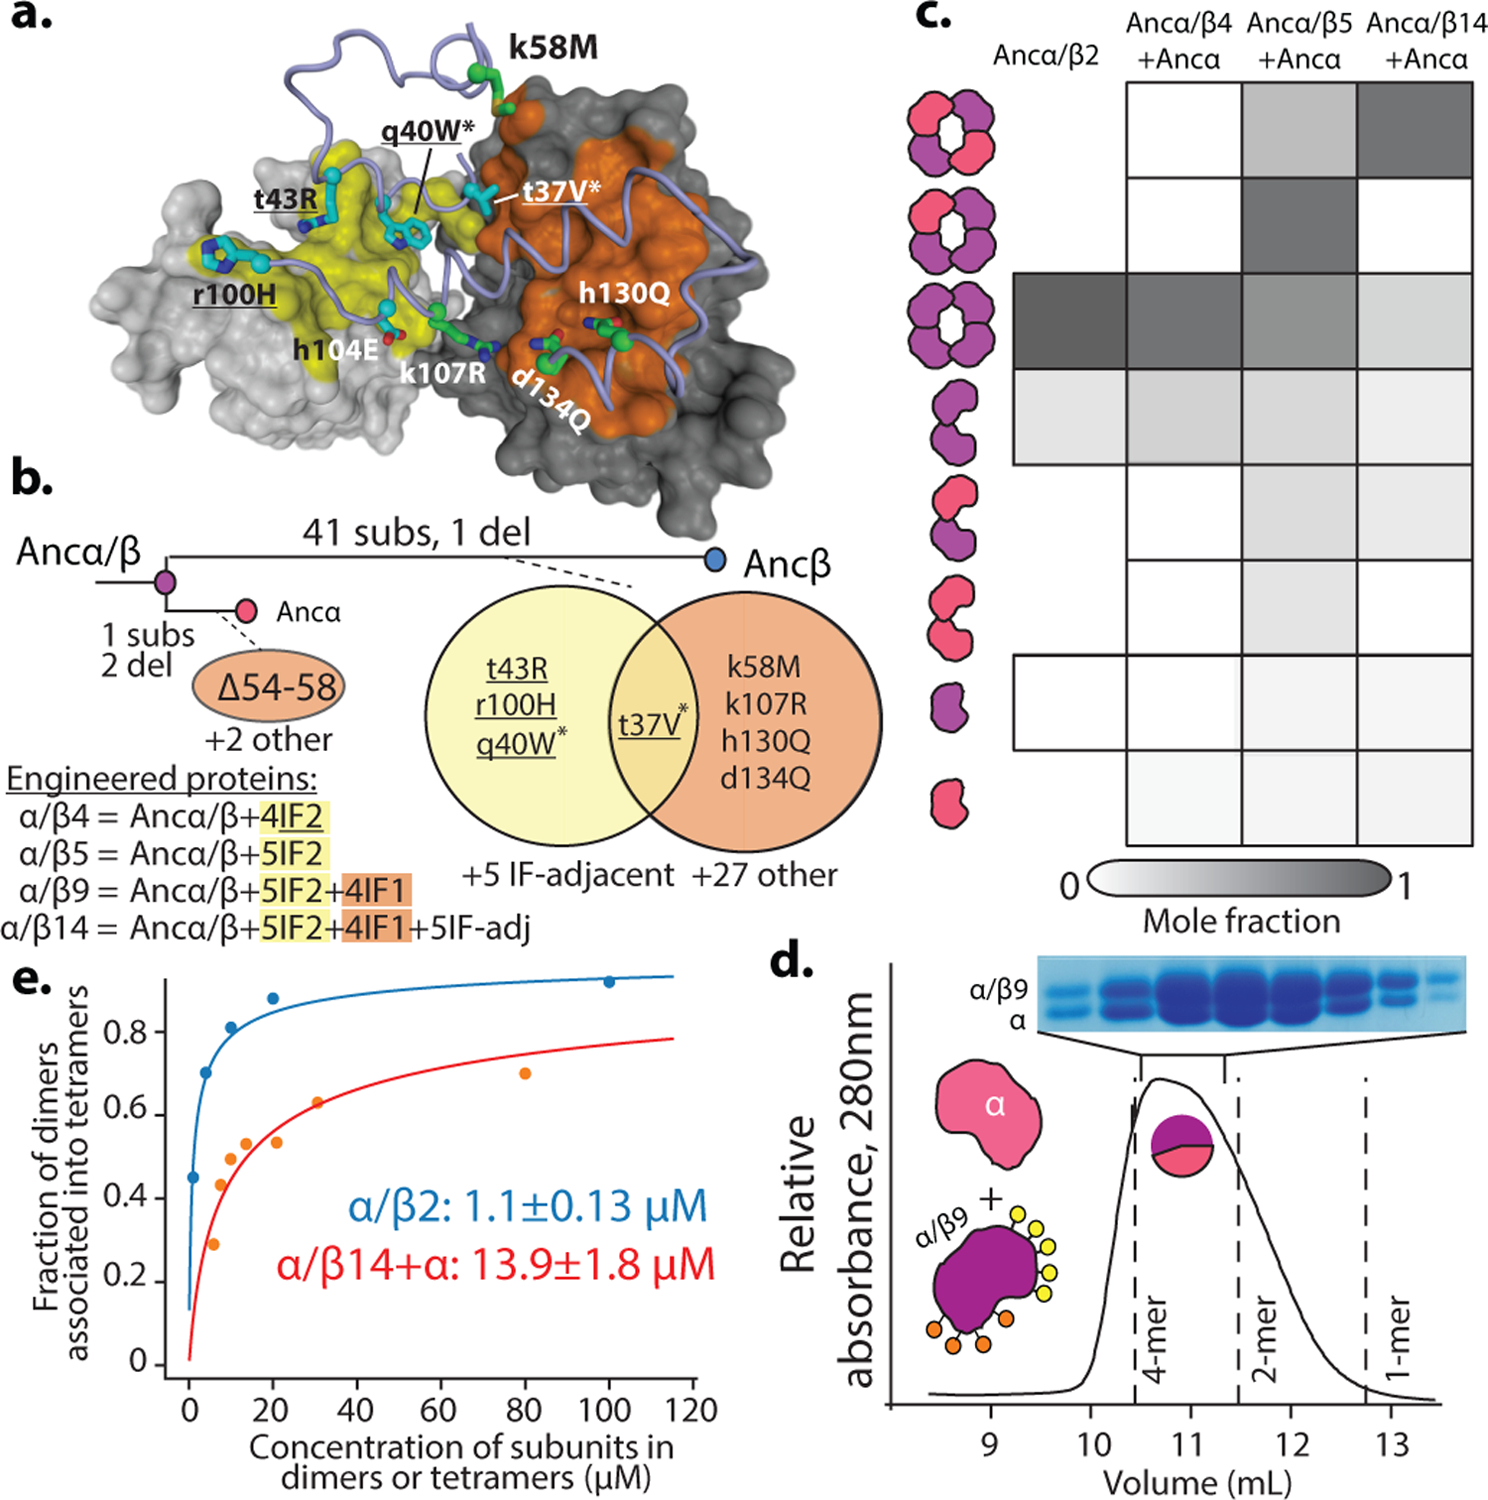
a) Homology model of Ancα+Ancβ tetramer with interface residues substituted between Ancα/β and Ancβ. Gray surfaces, two Ancα subunits; yellow, IF2; orange, IF1. Blue cartoon, partial backbone of one Ancβ subunit; sticks, side chains of substituted sites (IF2 cyan, IF1, green). Labels show state in Ancα/β (lower case) and Ancβ (upper). *, sites in Ancα/β2; underlined, Ancα/β4. b) Phylogenetic interval between Ancα/β and Ancα+Ancβ with number of substitutions and deletions per branch. Venn diagrams, sites substituted at interfaces. Below, substitutions incorporated in mutant proteins. c) Occupancy of multimers, measured by nMS at 20 μM, as fraction of moles of subunits in each state. Ancα/β2 was expressed in isolation, so only homomers are plotted. Spectra in Extended Fig. 10. d) SEC of Ancα/β9+Ancα at 80 μM. Lines, elution volumes of tetramer (Ancα+Ancβ), dimer (Ancα/β), monomer (Human Mb). Pie, proportions of Ancα and Ancα/β9 subunits in tetramer-containing fraction, by denaturing MS (Extended Fig. 11e). Above, electrophoresis of tetramer-containing fraction. e) Dimer-to-tetramer affinity of Ancα/β2 (blue) and Ancα/β14+Ancα (orange). Orange circles, fraction of Ancα/β14+Ancα heterodimers incorporated into heterotetramers; blue, fraction of Ancα/β2 homodimers in homotetramers, measured by nMS once. Kd (with SE) estimated by nonlinear regression.
Introducing the IF2 substitutions into Ancα/β (Ancα/β5) confers strong assembly into tetramers, including both heterotetramers and homotetramers, when coexpressed with Ancα (Fig. 3b, Extended Fig. 10c,d). A version containing only 4 of these (Ancα/β4) also forms homotetramers at 20μM but does not heteromerize with Ancα; the fifth change (h104E) therefore confers the capacity to associate with Ancα, presumably because it interacts with His104 on Ancα, forming a hydrogen bond in the heteromer but clashing in the homomer (Fig. 3b, Extended Fig. 10a,b). Even a subset of just two IF2 changes (Ancα/β2) causes high-affinity assembly into homotetramers (Kd=1 μM, Figs. 3b,3d, Extended Fig. 10g). The genetic basis for the evolution of a new strong interface was therefore simple.
The IF2 substitutions are not sufficient to yield specific occupancy of the α2β2 architecture: coexpression of Ancα/β5+Ancα forms a mixture of tetramers containing zero, one, or two α subunits (Fig. 3b, Ext. Figs. 10c,d). We hypothesized that IF1 substitutions conferred heterospecificity by favoring assembly of heterodimers across IF1, which then form α2β2 heterotetramers across IF2. We introduced the IF1 substitutions into Ancα/β5 (Ancα/β9) and coexpressed it with Ancα. As predicted, heterotetramers and heterodimers predominated over homomers (Fig. 3c). Ancα/β9+Ancα is poorly soluble, preventing quantitation by nMS, but adding 5 historical substitutions at sites proximal to the interfaces (Ancα/β14+Ancα) improved solubility, and nMS confirms preferential occupancy of α2β2 heterotetramers (Kd=6 μM, Fig. 3b,d, Extended Fig. 10e,f).
The Hb heterotetramer therefore evolved from the Ancα/β homodimer via two sets of substitutions. Changes at IF2 created a strong new interface that conferred tetramerization; changes at IF1 yielded heterospecificity. In both cases, only a few substitutions were required.
Structural mechanisms of interface acquisition.
How could so few substitutions have generated a new and specific multimeric interaction? Using a homology model of the heterotetramer, we identified all favorable contacts that mediate association across the ancestral interfaces and used the phylogeny to determine when these amino acids evolved (Fig. 4a–c, Extended Figs. 10h–i).
Figure 4. Structural mechanisms of Hb interface evolution.
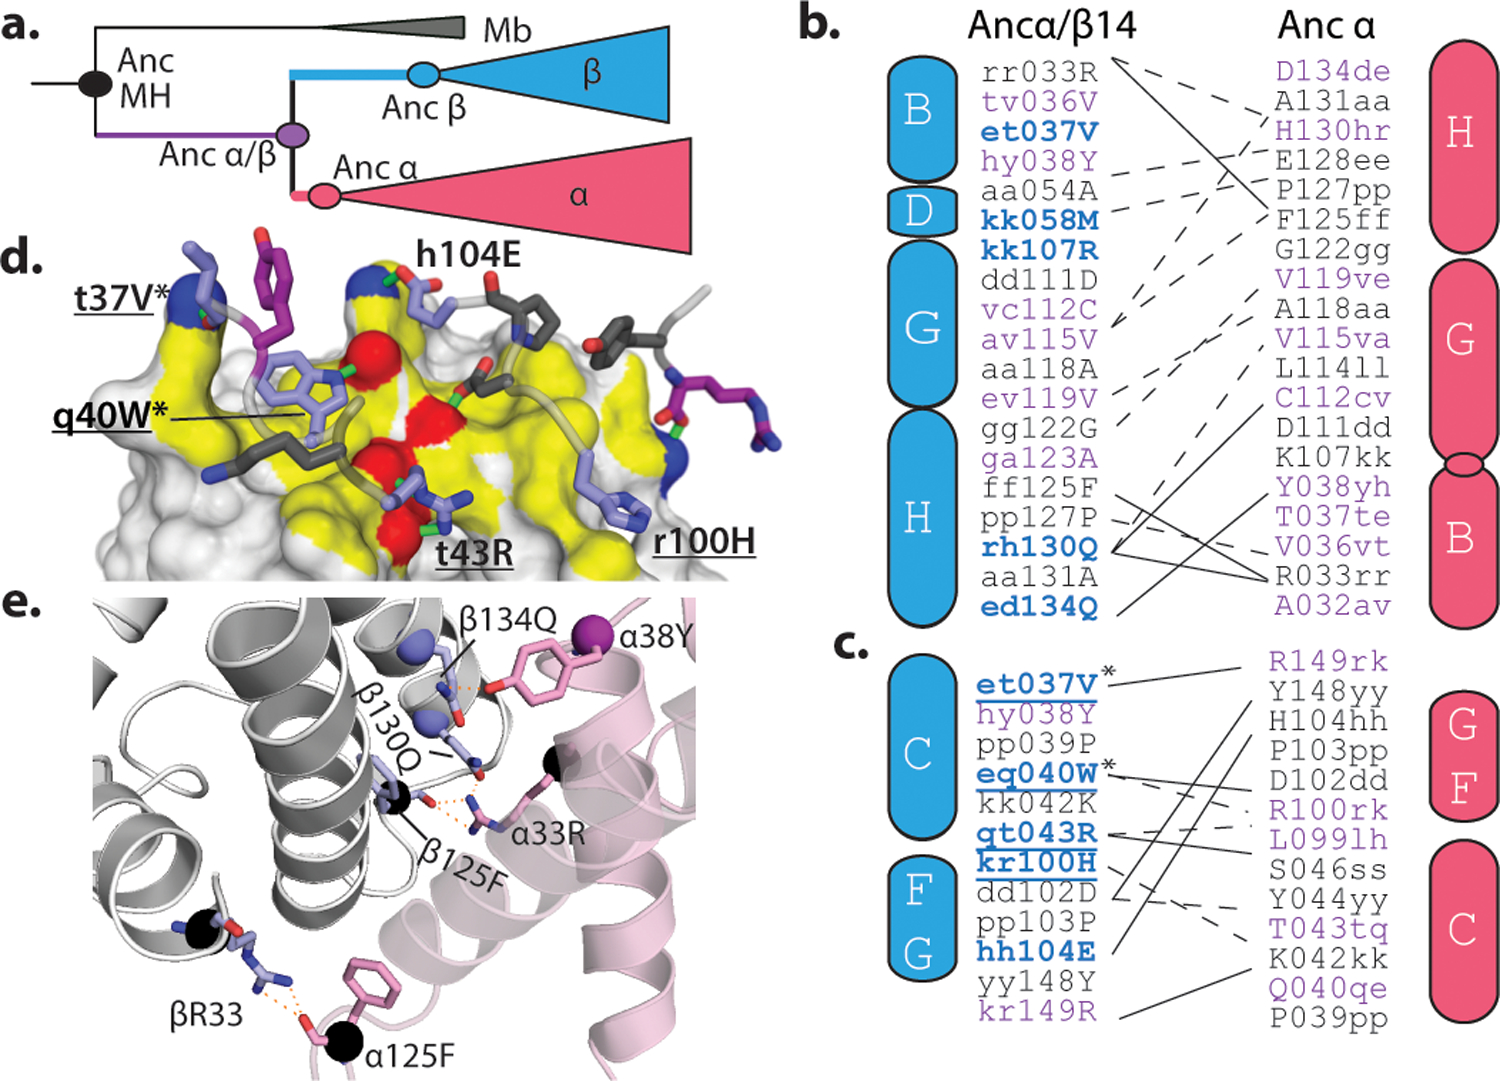
a) Phylogenetic classification of ancestral states and substitutions. Black, state in AncMH; purple, substituted from AncMH to Ancα/β; blue or red, substituted from Ancα/β to Ancβ or Ancα. b,c) Contact maps for residues buried at IF1 (b) and IF2 (c) Ancα+Ancβ. Residues colored by scheme in a. Letters, state in AncMH (outside, lower case), Ancα/β (middle, lower case) and Ancβ or Ancα (inside, upper case). Solid lines, predicted hydrogen bonds; dotted, van der Waals interactions. Underlined, substitutions in Ancα/β4; *, in Ancα/β2. Cylinders, helices (See Extended Fig. 2a). Circle, deletion of helix. d) IF2 contacts in Ancα+Ancβ. Grey surface, Ancα, with yellow IF2; hydrogen-bonding atoms are red (oxygen) or blue (nitrogen), with bonds as green lines. Cartoon, Ancβ backbone, with IF2 interacting sidechains (sticks, colored as in a). e) Close-up of IF1 in Ancα+Ancβ model. Sticks, hydrogen-bonding residues; spheres, Cα atoms, colored by a.
The substitutions that conferred tetramerization recruited residues that already existed on the opposing surface into newly favorable interactions. All 13 residues that Ancα contributes to IF2 are unchanged from their ancestral state in Ancα/β, and many were acquired earlier (Fig. 4c). The IF2 substitutions on the Ancβ branch yielded new van der Waals contacts and hydrogen bonds with these ancient residues (Fig. 4c,d). For example, the ring of Trp40 (substituted in Ancβ from the ancestral Gln) nestles tightly in an ancient hydrophobic indentation on Ancα. Similarly, the IF1 substitutions that increase occupancy of the α2β2 heterotetramer all modify interactions with ancient residues that were conserved on Ancα (Fig4b,e).
Both interfaces also involve favorable contacts between residues that were unchanged from their deep ancestral states in both subunits. In IF1, for example, R33 on each subunit donates two hydrogen bonds to F125 on the facing surface, and both residues evolved before AncMH. Each subunit contains both residues, and IF1 occurs twice in the tetramer, so these two sites form a total of 8 hydrogen bonds in the complex (Fig. 4b,e). Similarly, IF2 contains several hydrogen bonds and Van der Waals interactions between pairs of residues that originated before Ancα/β.
Because of the exponential relationship between binding energy and affinity, one substitution can dramatically increase occupancy of the multimer, if it builds on the foundation of even very weak interactions between older residues. Satisfying an unpaired hydrogen-bond donor/acceptor or burying a hydrophobic ring can contribute up to 16 kJ/mol to an association24,25. Each interface occurs twice in Hb (Fig. 2a), so a substitution that confers a favorable interaction does so twice in the tetramer, doubling its effect on binding free energy and reducing Kd by up to 6 orders of magnitude. A single mutation can therefore shift occupancy of the tetramer from virtually nonexistent to the predominant species.
Mechanisms of Cooperativity.
Finally, we sought insight into the evolution of Ancα+Ancβ’s cooperativity and reduced affinity. Cooperativity in extant Hb involves two conformational states that all subunits can adopt: one has higher affinity for oxygen but weaker IF2 contacts between subunits than the other23,26. Cooperativity is classically thought to be mediated by an “allosteric core” – the set of residues on the helix that connect the heme to IF2, which is positioned differently in the two conformations27.
To understand the mechanisms that triggered the evolution of cooperativity and reduced oxygen affinity, we first examined the phylogenetic history of residues in the heme pocket and allosteric core. At sites within 4 Å of the heme, no substitutions occurred during the interval when cooperativity was acquired. The vast majority were acquired prior to AncMH (Fig. 5a, Ext. Fig. 1c), including the “proximal histidine,” which covalently binds the heme iron and transduces the movement of the heme upon oxygen binding to the allosteric core and IF2, thereby triggering the conformational shift between low- and high-affinity states in other subunits. Two substitutions occurred in Ancβ on the helix that connects IF2 to the histidine, but there were none in Ancα (Fig. 5a), and both subunits make the conformational transition in extant Hb. These observations suggest that the structural properties that mediate the allosteric linkage between the heme/oxygen-binding site and IF2 already existed in Ancα/β, before cooperativity and tetramerization evolved. Consistent with this idea, many of the conformational changes that mediate Hb cooperativity, such as distortion of the heme’s geometry and movement of the histidine and helix upon oxygen binding, also occur in myoglobin, which is monomeric and noncooperative28,29.
Fig. 5. Evolution of cooperativity by interface acquisition.
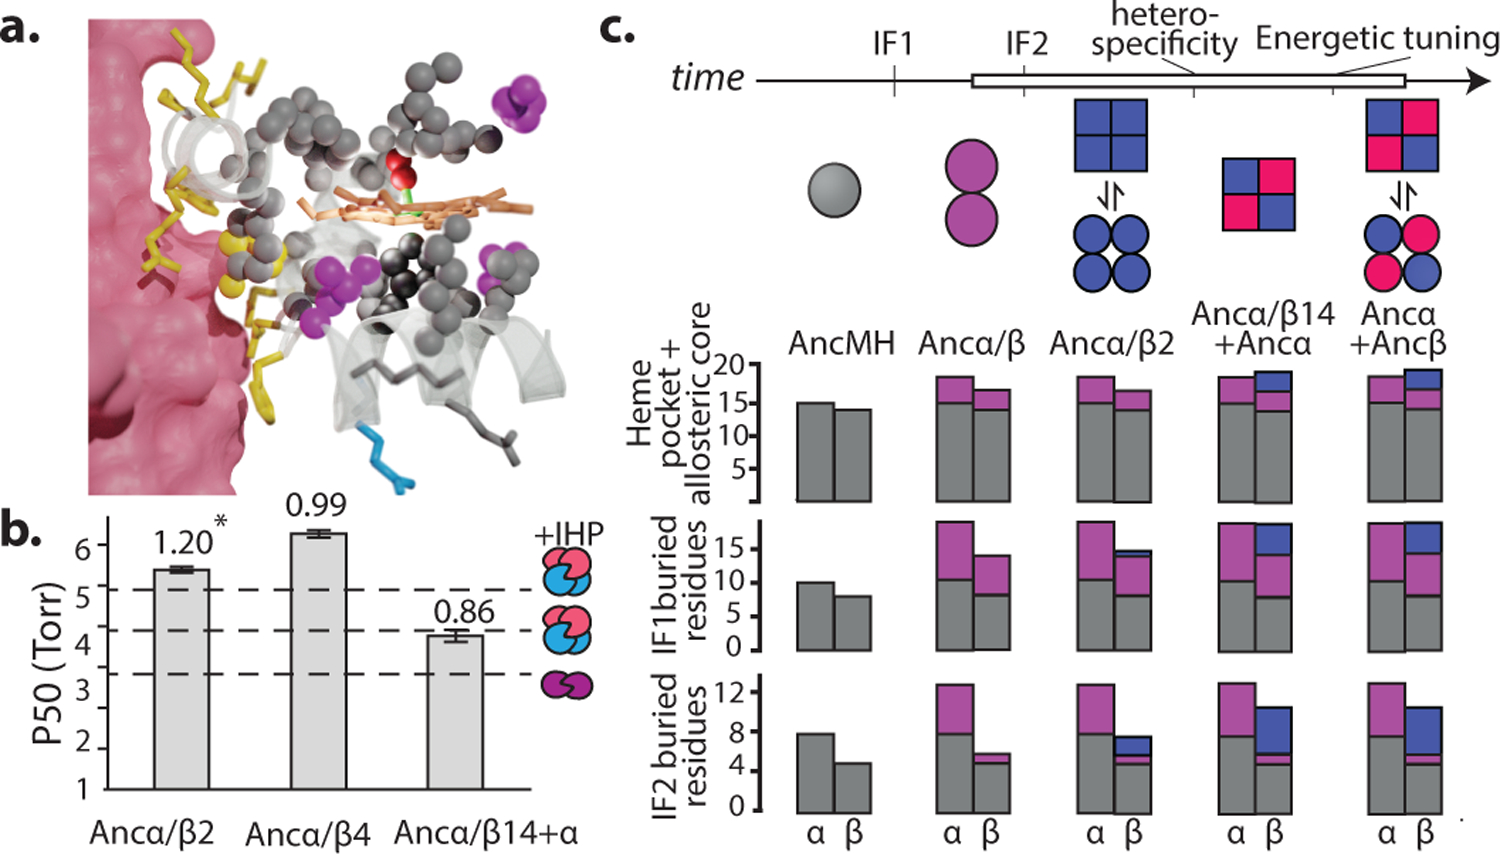
a) Heme pocket and IF2 in Ancα+Ancβ. Pink surface, one Ancα. Heme (tan sticks, with green iron and red oxygen). Spheres, Ancβ residues within 4 Å of heme, colored by temporal category: grey, conserved since AncMH (dark grey, iron-coordinating histidine); purple, conserved since Ancα/β; blue, substituted between Ancα/β and Ancβ. Sticks, other residues on helix connecting histidine to IF2, colored temporally. Yellow, Ancβ residues at IF2. No changes near heme or IF2 occurred in Ancα. b) Oxygen binding by Ancα/β mutants with historical substitutions. Columns and error bars, P50 ± SE, with Hill coefficient n above, estimated by nonlinear regression under effector-stripped conditions (raw data in Extended Figure 10j). *, significant cooperativity (n≠1, P=<0.05, F-test, Extended Fig. 1f). Dotted lines, affinities of Ancα+Ancβ and Ancα/β, which is unaffected by IHP. c) Evolution of the cooperative Hb heterotetramer. Circles and squares, conformations with high and low oxygen affinity, respectively. Two IF2 substitutions cause homotetramerization, cooperativity, and reduced affinity (see B). Other substitutions that confer heterotetramerization change the relative stabilities of high and low-affinity conformations, abolishing/restoring cooperativity. White box, interval in which order of substitutions is unknown. d) Acquisition of residues in structurally defined categories in Ancα and Ancβ, ordered as in d, colored by temporal category. No changed occurred in Ancα.
We hypothesized that, because of this ancient structural connection between the IF2 surface and the active site, evolution of the intersubunit interaction across IF2 conferred cooperativity and reduced affinity. We characterized oxygen binding by Ancα/β2, which contains only two historical substitutions at IF2. As predicted, these mutations reduce oxygen affinity by 2- to 3-fold compared to Ancα/β (Fig. 5b); they also confer weak but statistically significant cooperativity (Extended Fig. 5b). Acquisition of the tetrameric association alone therefore changes the protein’s oxygen-binding function and confers cooperative oxygen binding.
The tetramer’s ability to transition between high- and low-affinity states, however, is sensitive to mutation. Ancα/β4 and the Ancα/β14+Ancα heterotetramer also have reduced oxygen affinity relative to Ancα/β, but they lose the cooperativity found in Ancα/β2 (Fig. 5b). A likely explanation is that these additional mutations overstabilize the low-affinity conformation relative to the high-affinity state. If so, then some of the other substitutions that occurred between Ancα/β and the cooperative complex Ancα+Ancβ must have tuned this equilibrium so that both conformations are occupied, depending on the oxygen partial pressure (Fig. 5c). The order in which these changes occurred cannot be resolved: the IF2 substitutions may have immediately generated a cooperative Hb-like complex, similar to Ancα/β2; alternatively, cooperativity may have evolved via a low-affinity tetrameric intermediate, like Ancα/β4 (Fig. 5c).
Evolution of molecular complexity.
Our findings establish that simple genetic changes drove the evolution of Hb’s complex structure and functions from its dimeric precursor. Other molecular complexes may also have evolved by short mutational paths. Interactions between proteins and other kinds of substrates, such as DNA or small molecules, have historically evolved via one or a few historical substitutions30, and we see no reason why multimeric interactions should be more difficult to evolve. Multimers can be engineered from non-assembling precursors by one or a few mutations,31,32 and naturally occurring point mutations are known to cause disease by inducing higher-order complexes33.
The simple mechanism by which Hb appears to have evolved its cooperativity – acquisition of binding to a molecular partner at a new interface – could explain the origin of cooperativity and allostery in other systems34,35. If two plausible conditions are met – the new interface is near or structurally connected to the functionally active site, and the optimal conformation for binding is different from the optimal conformation for activity – then binding will impair activity, and vice versa. Given this tradeoff, evolution of binding will confer cooperativity or negative allostery.
Hb’s history shows that complex molecular structures and functions can arise by means other than the long, gradual trajectories of functional optimization by which biological complexity has long been thought to evolve6,36. In principle, molecular assemblies could arise and become more complex via neutral processes37–39, but this scenario is unlikely if many mutations are required. Our work shows that Hb’s higher-level multimeric state and functional properties evolved through just a few mutations, which fortuitously built upon and interacted with ancient structural features. These older features could not have been initially acquired because of selection for the functions of the final complex, because they existed before those functions first appeared. Some likely originated and were preserved by selection for ancestral functions, while others may have transiently appeared by chance. Although evolution of any particular molecular sequence or architecture without consistent selection for those properties is vanishingly improbable, our findings suggest that proteins evolve constantly through a dense space of possibilities in which complex new interactions and functional states are easily accessible.
METHODS
Sequence Data and Alignment.
177 annotated amino acid sequences of hemoglobin and related paralogs from 72 species were collected from UniPROT, Ensembl and NCBI RefSeq. Sequences were aligned using MAFFT v740. The ML phylogeny and branch lengths were inferred from the alignment using PHYML v3.141 and the LG model42 with gamma-distributed among-site rate variation and empirical state frequencies. This best-fit evolutionary model was selected using the Akaike Information Criterion in PROTTEST. Node support was evaluated using the approximate likelihood ratio test statistic (aLRS), which expresses the difference in likelihood between the most likely topology and the most likely topology that does not include the split of interest; aLRS has been shown to be reasonably accurate, robust, and efficient compared to other means of characterizing support43,44. The tree was rooted on neuroglobin and globin X, paralogs that are found in both deuterostomes and protostomes45. Tetrapods possess three paralogous Hbα genes, called Hbα(A), Hbα(D),and Hbα(Z); however, the ML phylogeny inferred from this alignment contained a weakly supported sister relationship between all Actinopterygian Hbα genes and the tetrapod Hbα(Z), to the exclusion of tetrapod Hbα(A) and Hbα(D). This is a nonparsimonious scenario, because it requires an early gene duplication and subsequent loss of the Hbα(A)/Hbα(D) lineage in Actinopterygii We therefore constrained the topology to unite the tetrapod Hbα(A), Hbα(D), and Hbα(Z) in a clade (Extended Fig. 1A). PhyML v3.1 was then used to re-infer the best-fit branch topology and branch lengths given this constraint.
Ancestral sequences were reconstructed and posterior probability distributions of ancestral states were inferred using the ML method using the codeml package in PAML 4.946, given the ML constrained phylogeny and branch lengths. Historical substitutions were assigned to phylogenetic branches as differences between the maximum a posteriori amino acid states between parent and daughter nodes. The asymmetry between the branch lengths leading from Ancα/β to Ancα and to Ancβ has been observed previously47 and presumably reflects there being more amino acid states shared between Hbα and the outgroups (myoglobin, globins E and Y, etc.) than between Hbβ and the outgroups. Sequences for reconstructed ancestors have been deposited in Genbank (IDs MT079112, MT079113, MT079114, MT079115).
Recombinant protein expression.
Ancestral genes were codon-optimized for E. coli expression using CodonOpt and generated by de novo DNA synthesis (IDT gBlocks). For globin expression, coding sequences were cloned into pLIC expression vector without affinity tags and expressed under a T7 polymerase promoter. For oxygen-affinity measurements, plasmid pCOMAP48, which expresses E coli. methionine aminopeptidase 1 (MAP1), was cotransformed to ensure efficient N-terminal methionine excision. For co-expression of two globins, sequences were expressed from a polycistronic operon in plasmid pGM, without tags and under a T7 promoter, separated by a spacer containing a stop codon and ribosome binding site. E coli. methionine aminopeptidase 1 (MAP1) was coexpressed from the same plasmid.
JM109 DE3 E. coli cells (NEB) were transformed and plated into solid Luria broth (LB) media containing 50 μg/ml carbenicillin (and 50 μg/ml kanamycin, if pCOMAP was being cotransformed). A single colony was inoculated into 50 mL of LB with appropriate antibiotics and grown overnight. 5 mL of this culture was inoculated into a larger 500 mL LB culture. Cells were grown at 37C and shaken at 225 rpm in an incubator (New Brunswick 126) until they reached an OD600 of 0.4–0.6. The culture was then supplemented with 0.5 mM isopropyl-β-d-1-thiogalactopyranoside (IPTG) and 50 mg/L of hemin (Sigma). After 4 hours of expression at 37C, CO was bubbled through the solution for 10 minutes and cells were collected by centrifugation at 5000 g. Protein purification was carried out immediately after expression.
Protein purification by ion exchange.
Ancα/β, P127R, V119A, Ancα/β4+Ancα and the alternative ancestral reconstructions were purified using ion exchange chromatography20,48. All buffers were saturated with CO prior to purification and vacuum filtered through a 0.2 μM PFTE membrane (Omnipore) to remove particulates. After expression, cells were resuspended in 200 mL of 50 mM Tris (pH 6.8) with 2 cOMPLETE protease inhibitor tablets (Roche) and 0.5 mM DTT. The cell suspension was lysed in 50 mL batches in a glass beaker using an FB505 sonicator with a power setting of 90%, 1s on/off for 2 minutes. The lysate was then centrifuged at 30000g to eliminate cell debris, inclusion bodies and aggregates. The supernatant was further syringe-filtered used HPX Millex Durapore filters (Millipore). A HiTrap SP cation exchange (GE) column was attached to an FPLC system (AKTAprime plus) and equilibrated in 50 mM Tris (pH 6.8). Lysate was passed over the column. The SP column was washed with 200 mL of 50 mM Tris to eliminate weakly bound contaminants. Bound Hbs eluted with a 100 mL gradient of 50 mM Tris (pH 6.9) 1 M NaCl, from 0 mM to 1M. 0.5 mL fractions were collected along the length of the gradient. The 4 reddest fractions were collected and then concentrated in an Amicon μLtra-15 tube by centrifugation at 4000 g to final volume of 500 μL. The sample was injected into a Sephacryl Hiprep 16/60 S-100 HR size-exclusion column (SEC) for additional purification. The SE column was equilibrated in phosphate buffered saline (PBS) at pH 7.4. Depending on molecular weight, purified globins elute at 48–52 mL (tetramer), 56–60 ml (dimer) or 64–67 ml (monomer). The purity and identity of isolated proteins was assessed using 20% SDS-PAGE and denaturing HRA-MS. The purified proteins were concentrated and then flash frozen with liquid nitrogen until usage.
Protein purification by zinc affinity chromatography.
Ancα/β5 + Ancα, Ancα/β9+Ancα, Ancα/β14+Ancα, and Ancα+Ancβ were purified using zinc-affinity chromatography, adapted from (53). Buffers were loaded onto the metal affinity column using an AKTAprime FPLC. To prepare the zinc affinity column, nickel was removed from a HisTrap column (GE) using stripping buffer (100 mM EDTA, 100 mM NaCl, 20 mM TRIS, pH 8.0). The column was then washed with diH2O for five column volumes. Then 0.1 M ZnSo4 was passed over the column until conductance reached a stable value. The column was then washed with 5 column volumes of water. After expression, cells were resuspended in 50 mL of lysis buffer containing 20 mM Tris and 150 mM Nacl (pH 7.4). The cells were sonicated as described in the previous section. The lysate was passed over a Zinc-affinity HisTrap column. The column was washed with 200 mL of wash buffer (20 mM Tris and 150 mM Nacl, pH 7.4). The bound Hbs were eluted with a 50 mL gradient of imidazole, upto 500 mM and 0.5 mL fractions were collected during the run. The 4 reddest fractions were collected. The Hb-containing fractions were concentrated and injected into a Sephacryl S-100 HR column for additional purification, as described above.
Purification of Globin Y.
The Globin Y sequences of Callorhincus milli (NCBI reference sequence NP_001279719.1) and Xenopus laevis (NCBI reference sequence NP_001089155.1) were synthesized (IDT, Coralville, IA, USA) and cloned into a pLIC vector with an N-terminal hexahistidine tag (MHHHHHH). Expression and lysis were carried out under the same conditions as described in previous sections. The bacterial lysate was passed over a 5 mL HisTrap Nickel-affinity column (GE). The column was washed with 5 column volumes of wash buffer (20 mM Tris and 150 mM Nacl, pH 7.4). The bound globins were eluted with a 15 mL gradient of imidazole from 0 to to 500 mM; five fractions of equal volume were collected. The 3 reddest fractions were combined. The eluted protein was concentrated to 2 mL, passed through a 0.45 μM filter, and subject to a final purification by size-exclusion chromatography using a Sephacryl S-100 HR column and an AKTA Prime FPLC system. Globin Y eluted in fractions collected between 61 and 64 mL.
Purification of his-tagged AncMH.
The sequence of AncMH was codon-optimized for expression in E. coli, synthesized, and cloned into a pLIC vector with an N-terminal hexahistidine tag, because untagged AncMH was not readily purifiable. Recombinant expression, cell lysis, and purification were carried out under the conditions described for GbY.
Characterization of protein stability.
Protein stability was measured by circular dichroism (CD) using a JASCO 1500 CD spectrophotometer. Experiments were conducted at protein concentration of 10 μM (50 mM Sodium fluoride, 20 mM Sodium phosphate buffer) in a 0.2 mm path length quartz cell. CD spectra were collected at 2°C intervals (10 minutes each) as the temperature was increased from 25°C to 95°C. Molar ellipticity at 222 nm was measured four times at each temperature; the mean was then divided by the value of molar ellipticity at 222 nm at room temperature (25°C) to estimate the fraction of unfolded protein. To estimate the melting point (Tm) of each protein, a custom script was written to find the best fit parameters (Tm and slope) for the Boltzmann sigmoid function: Fraction unfolded = 1/(1+e(t-Tm)/slope)). All three ancestral proteins were stable, with Tm> 60°C (Extended Fig.1c).
High resolution denaturing mass spectrometry.
200 μL of purified proteins were placed in Slide-A-Lyzer MINI dialysis unit that was suspended in 500 mL of 50 mM Ammonium Acetate. The solution was stirred overnight at 4C. After dialysis, the proteins were transferred to a microfuge tube and centrifuged at 30,000g to eliminate aggregates. Concentration was adjusted to 20 μM. 0.5 μL of sample was sprayed using an Agilent 6224 Tof Mass Spectrometer at fragment voltage 200V. Protein masses were estimated by maximum entropy mass deconvolution implemented in MassHunter (Agilent).
Size exclusion chromatography (SEC) and multi-angle light scattering (MALS).
All proteins were converted to the CO-bound form by adding sodium dithionite to 5 mg/ml, desalting on a Sephadex G-25 desalting column equilibrated with CO-saturated PBS (150 mM NaCl, pH 7.4), and then passing CO through the eluent. Protein concentration was measured by UV absorbance at 280 nm (Tryptophan) and 419 nm (HbCO-specific) using a Nanodrop 2000c (Thermo-scientific). For analytic size exclusion chromatography, a Superdex 75 10/300 GL column (GE) was equilibrated in CO-saturated PBS, and then injected with 500 μL of sample, using a 500 μL injection loop on an AKTAprime and monitored by absorbance at 280 nm. For SEC coupled with multi-angle light scattering (MALS), a Superdex 200 10/300 GL column was injected with 150 μL of sample on the AKTAprime; refractive index and light scattering of eluent was measured using a Dawn Helios-II (Wyatt) light scattering detector and Optilab T-rEX refractometer respectively. Molar mass fitting was carried using Astra software.
Globin concentration assay.
After protein expression, cells harvested by centrifugation from one 500 mL culture were resuspended in 15 mL PBS and sonicated as described above. Cell debris and aggregate were removed by centrifugation at 20,000g. Remaining lysate was concentrated to 5 mL in Amicon μLtra-15 centrifuge concentrators (3,000 NMWL). 500 μL of this sample was injected into a superdex-75 10/300 GL column. 0.2 mL fractions of eluent were collected. 50 μL was taken from each fraction and added to 150 μL of Hemoglobin Assay kit reagent (Sigma) in one well of a 96 well plate. In each plate, 50 μL of a 100 mg/dl calibrator (Sigma) was also added to 150 μL of Hemoglobin Assay kit reagent (Sigma) in one well. 50 μL of PBS added to the 150 μL reagent was used as a blank. Absorbance was measured at 400 nm using a Victor x5 plate reader (PerkinElmer). Heme concentration in each fraction was measured using the following equation: Concentration = 62.5* (ODsample- ODblank)/ (ODcallibrator- ODblank) μM.
Oxygen affinity and cooperativity.
Purified proteins were deoxygenated using sodium dithionite at 10 mg/ml and immediately passed through a PD-10 desalting column (GE Healthcare) equilibrated with 25 ml of 0.01 M HEPES/0.5 mM EDTA (pH 7.4). Eluted proteins were concentrated using Amicon μLtra-4 Centrifugal Filter Units (Millipore). Equilibrium oxygen-binding assays were performed at 25°C using a Blood Oxygen Binding System (Loligo Systems), using 0.1 mM protein (heme concentration) dialyzed in 0.1 M HEPES/0.5 mM EDTA buffer. Protein solution was sequentially equilibrated at three to five different oxygen tensions (PO2) yielding 30 to 70% saturation while continually monitoring absorbance at 430 nm (deoxy peak) and 421 nm (oxy/deoxy isosbestic point). Plots of fractional saturation vs PO2 were constructed from these measurements, and the Hill equation was fit to each plot using OriginPro 2016, yielding estimates of P50 (PO2 at half-saturation) and the cooperativity coefficient (n, the slope at half saturation in the Hill plot, n50). 95% confidence intervals on parameter estimates were calculated by multiplying the standard error of the mean over replicate experiments by 1.96 (Figs. 1d,e). Statistical significance of cooperativity was assessed by using an F-test to compare the fit of the data to a model in which n is a free parameter to a null model in which n=1.
To assess the potential for ancestral proteins to have been regulated by allosteric effectors, assays were performed in stripped medium or with inositol hexaphosphate (IHP) added at 0.5 mM. Although IHP may not have been the physiological effector in ancestral organisms, it has been shown to allosterically regulate Hbs of representatives from all major vertebrate lineages, whereas other organic phosphates like 2,3-biphosphoglycerate (BPG), ATP, and GTP have more lineage-specific effects49–51. IHP therefore serves as a useful “all-purpose” polyanion to test the allosteric regulatory capacity of the ancestral Hb. There is ample precedent for using IHP to study Hb allostery irrespective of whether it is the authentic physiological effector52–55. This is because IHP modulates Hb-O2 affinity in a manner that is qualitatively similar to other effectors, including BPG, ATP, GTP, and IPP8,53. These molecules all share the same mechanism of action, reversibly binding a set of cationic residues in the cleft between β1 and β2 subunits, thereby stabilizing the low-affinity T conformation via electrostatic interactions56–58.
Native Mass Spectrometry (nMS).
Proteins were buffer exchanged into 200 mM ammonium acetate with a centrifugal desalting column (Micro Bio-Spin P-6, BioRad) and loaded into a gold-coated glass capillary. Samples were ionized for MS measurement by electrospray ionization. MS and MS/MS ion isolation were performed on a Synapt G1 HDMS instrument (Waters Corporation) equipped with a radio frequency generator to isolate higher m/z species (up to 32k) in the quadrupole, and a temperature-controlled source chamber as previously described59. Instrument parameters were tuned to maximize signal intensity for MS and MS/MS while preserving the solution state of the protein complexes. All samples were sprayed at room temperature. Instrument settings were: source temperature of 50 °C, capillary voltage of 1.7kV, sampling cone voltage of 100V, extractor cone voltage of 5V, trap collision energy of 25V, argon flow rate in the trap was set to 7 ml/min (5.6 x 10⁻² mbar), and transfer collision energy set to 15V. The T-wave settings were for trap (300 ms−1/1.0V), IMS (300 ms−1/20V) and transfer (100 ms−1/10V), and trap DC bias (30V). For MS/MS, ion isolation was achieved using the same settings as described above, with the quadrupole LM resolution was set to 6. Activation of protein complexes for individual monomer identification was achieved by increasing the trap collision voltage to 120V in MS/MS mode, with all other settings unchanged. Analysis of the MS and MS/MS data to estimate masses and relative abundances was performed with the software program Unidec60.
Occupancy of each stoichiometric state was calculated as the proportion of globin subunits in that state, based on the summed areas under the corresponding peaks in the spectrum. To estimate Kd of the monomer-to-dimer transition Ancα/β, we performed nMS at variable protein concentrations. At each concentration, the observed fraction of subunits incorporated into dimers (Fd) was estimated as , where xm and xd are the sum of the signal intensities of all peaks corresponding to the monomeric and dimeric stoichiometries, respectively. This procedure was repeated at a range of protein concentrations. Nonlinear regression was then used to find the best-fit value of Kd using the equation: , where Ptot is the total protein concentration (expressed in terms of monomer) estimated by UV absorbance at 280 nm. The resulting Kd is expressed in terms of the concentration of globin subunits. We observed no higher stoichiometries.
To estimate Kd of the heterodimer-heterotetramer transition in Ancα+Ancβ (or mutant ancestral globins) we performed nMS at variable protein concentrations. Because nMS directly quantifies the abundance of all species in solution, we were able to extract molarities for the α1/β1 heterodimer and α2/β2 heterotetramers and directly calculate the Kd of their association/dissociation equilibrium, without having to fit a large number of Kds as part of a coupled set of many equilibria across many homomeric and heteromeric forms. At each concentration, we first calculated the total fraction of subunits that were incorporated into heme-bound heterodimers, including both free heterodimers and heterodimers assembled into heterotetramers, as , where x is the sum of the signal intensities of all peaks corresponding to the stoichiometry indicated by the subscript. yapo-α1β1 is the signal-intensity of the peaks corresponding to heterodimers that are only partially heme-bound and cannot associate into tetramers. The concentration of all heme-bound subunits incorporated into heterodimers (free heterodimers or assembled into heterotetramers) was calculated as Cαβ = Fαβ x Ptot. The fraction of all heterodimers incorporated into heterotetramers was calculated as . Assembly of heterodimers into heterotetramers as concentration increases was then analyzed to find the best-fit value of Kd using nonlinear regression and the following equation: . The resulting Kd is expressed in terms of the concentration of globin subunits contained in heterodimers and heterotetramers.
For homotetramerization of globins expressed in isolation, the Kd of the dimer-tetramer transition was calculated using a similar approach. The fraction of all subunits incorporated into homodimers (including both free homodimers and those associated into homotetramers) was calculated as , and the concentration of all dimers was calculated as Cd = Fd x Ptot. The fraction of all dimers that were incorporated into tetramers was calculated as . Nonlinear regression was then used to fit Kd to the data using the equation . The resulting Kd is expressed in terms of the concentration of globin subunits contained in homodimers and homotetramers. For Fig. 3c, Ancα/β4 was coexpressed with Ancα, fractionated by SEC, and the tetrameric fraction analyzed by nMS.
Native MS spectra for human Hb and Ancα/β14+Ancα at high concentrations contained peaks corresponding to dimers that had lost one or both hemes. In these cases, wWe calculated Kds by both including and excluding these species. For the fits shown in main figures (Figs. 1d, 3d), these peaks were excluded from the analysis; for the fits shown in Extended Fig. 2k, they were included. Both approaches yielded Kd estimates of the same order, although the fit to the data was much better in the former case. Spectra for Ancα+Ancβ included twinned peaks, which represent cesium iodide adducts on tetramers. For the fits shown in the main figures (Figs. 1c, 3d), these peaks were excluded; for the fits in Extended Fig. 2i, they were included. Both approaches gave almost identical Kd estimates, although the fit to the data was better in the former case.
Hydrogen/deuterium exchange mass spectrometry (HDX-MS).
All chemicals and reagents were purchased from Sigma Aldrich (Gilligham, UK). Native equilibration buffer contained 100 mM PBS (H2O), pH 7.4. Labelling buffer contained 100 mM PBS (D2O), pD 7.4. Quench buffer contained 100 mM potassium phosphate (H2O), pH 1.9, with 1 M guanadinium chloride. 5 µL of protein sample was diluted into 55 µL of a deuterated buffer of the same composition and corresponding pD. This results in a labelling solution ~92 % D2O. Samples were incubated between 15 s and 1 hour at 20° C before quenching with an ice-cold H2O buffer (pH 1.9) of equal volume. The quenched solution pH was ~2.5 at 0 °C. This was quickly injected into an on-line HDX manager (Waters, Milford, MA, USA). The sample was injected on to a 50 µL sample loop at 0 °C before passing over an immobilised pepsin column (Enzymate Pepsin 5 µm, 2.1 mm × 30mm, Waters) at 20 °C using an isocratic H2O (0.1 % v/v) formic acid solution (200 µL/min). Peptide products were collected on a trapping column (BEH C18, 1.7 µm, 2.1 mm × 5 mm, Waters) held at 0 °C. After 2 minutes of collection, and de-salting, peptides were eluted from the trap column on to an analytical column (BEH C18, 1.7 µm, 1 mm × 100 mm, Waters) for separation using a reverse-phase gradient with a flow rate of 40 µL/min. The elution profile using a H2O/MeCN (+0.1% formic acid v/v) gradient was as follows: 1–7 minutes 97 % water to 65 % water, 7–8 minutes 65 % water to 5 % water, 8–10 minutes hold at 5 % water. The analytical flow rate was 40 µL/min and the eluate was electrosprayed directly into a Synapt G2Si (Waters, Wilmslow, UK) Q-ToF instrument for mass analysis.
Sample handling was semi-automated using a robotic liquid handling HDX system (LEAP technologies, Ringwood, Australia) to ensure reproducibility in timings. A blank and cleaning injection cycle was performed between each labelling experiment. Mass spectrometry conditions were as follows: capillary 2.8 kV, sample cone 30 V, source offset 30 V, trap activation 4 V, transfer activation 2 V. The source temperature was set to 80 °C and cone gas flow 80 L/hr, the desolvation temperature was 150 °C and the desolvation gas flow of 250 L/hr. LeuEnk was used as an internal calibrant and acquired every 30 s. For reference, back-exchange was estimated separately using lyophilised samples of angiotensin II. Angiotensin II was dissolved into D2O (pH 4.0) and left for 48 hours. After which the sample was loaded onto the same robotic and UPLC system and analysed after 2 minutes of trapping to give a back-exchange of 31.8 ±0.2 %.
Peptides were identified, in the absence of labelling, by data-independent MS/MS analysis (MSE) of the eluted peptides and subsequent database searching in the Protein Lynx Global server 3.0 software (Waters). Peptide fragments were generated in the trap region through collisions with Ar gas (0.4 mL/min). Peptide identifications were filtered according to fragmentation quality (minimum fragmentation products per amino acid: 0.2), mass accuracy (maximum [MH]+ error: 5 ppm), and reproducibility (peptides identified in all MSE repeats) before their integration into HDX analysis. HDX-MS data were processed in DynamX 3.0 software (Waters), and all automated peptide assignments were manually verified, with noisy and overlapping spectra discarded. External python scripts were written to generate and analyse the Woods plots from data outputs of DynamX.
Sample concentration was varied to control the relative populations of monomeric and dimeric species of Ancα/β. After dilution into the labelling buffer Ancα/β concentrations were 0.67, 2, 15, and 75 µM; to avoid significant sample over-loading of the column when using high concentrations of Ancα/β, samples were diluted during quenching to give an injection quantity of ~15 pmol. To ensure back-exchange occurred equally across all diluted samples, the final ratio of H2O:D2O after quenching was kept constant at 54:46 and the pH of the quench buffer adjusted to pH 2.5. This allowed for all concentrations to be compared without correcting for back-exchange. All automated peptide assignments were manually verified, with noisy and overlapping spectra discarded. After processing a sequence coverage of 91% was achieved with a redundancy of 5.3.
Statistical comparison of peptides.
For each peptide in the dilution experiment, The difference in deuterium uptake between different conditions was normalized by dividing the difference by the absolute uptake in the dimeric condition (75 µM). In Fig 2c, Peptides that incorporated deuterons in the monomeric condition at quantities statistically indistinguishable from zero (P<0.01) were excluded. For peptide locations and alternative normalization methods, see Fig 6–7. A permutation test was used to determine if relative deuterium uptake by residues at IF1 (or IF2) was significantly different from that of other residues. To eliminate statistical non-independence arising from the fact that many peptides overlap, we constructed a non-overlapping peptide set by subsampling without replacement from the total set of peptides, requiring that selected peptides do not share any residues. 1000 such non-overlapping peptide sets were constructed, and a p-value was estimated for each set using the following permutation test. Peptides in the nonoverlapping set were partitioned into those containing residues mapping to IF1 and those containing no IF1 residues; a similar approach was used to test for a difference between peptides containing IF2 residues and those containing none; peptides containing residues contributing to both interfaces were excluded. The mean of the measured relative uptake difference over peptides in each partition was calculated, and the difference between the means of the two partitions was determined. A null distribution was then estimated by randomly partitioning peptides in the nonoverlapping set into two categories (without changing the size of the categories) and calculating the difference in means between the two randomly permuted peptide partitions. The p-value was calculated as the proportion of random partitions in which the difference between peptide category means was greater than or equal to that of the difference for the empirical categories. Extended Fig. 5 displays the distribution of p-values calculated this way for 1000 non-overlapping peptide sets. A interface category was identified as having significantly increased uptake if the mean p-value from this analysis was <0.05.
Homology models for Anc α/β IF1 and IF2.
Structural modelling of the Ancα/β monomer was performed using SWISS-MODEL. A deoxy structure of an Hbα monomer contained in recombinantly expressed human hemoglobin (1A3N) was used as the template. Hbα was used because its sequence similarity to Ancα/β is greater than that of any other extant globin. Further, both Hbα and Ancα/β form homodimers in isolation, unlike Hbβ (which is a mixture of dimers and tetramers at similar concentrations) or myoglobin. EMBO PISA61 was used to identify sites in 1A3N subunits that buried >50% of their surface area at the interfaces or formed intersubunit hydrogen-bonding or salt bridge contacts at either IF1 or IF2. The HADDOCK 2.2 webserver was used to dock two Ancα/β monomers along an IF1 or an IF2 orientation by specifying the corresponding homologous residues (1a3n). The best scoring docked complex was used for all subsequent analyses and visualizations.
Homology models, interface burial, and contact maps for Ancα+Ancβ and Anc α/β14.
Structural modelling was performed using SWISS-MODEL. A deoxy structure of recombinantly expressed human hemoglobin (PDB 1A3N) was used as the template for Ancα+Ancβ and for Ancα/β14 +Ancα. The extant Hbα and Hbβ were used as templates because they have higher sequence identity to to Ancα and Ancα/β14, respectively, than any other globin paralogs. EMBO PISA was used to estimate residue burial at the interfaces and predict hydrogen bonds across interfaces. Residues were classified as contributing to an interface if its solvent-accessible surface area was reduced by >10% in the assembled form relative to the nonassembled form. Van der waals contacts were identified as pairs of cross-interface atoms with center-to-center distances <3.5, using a custom script. PyMOL v4.19 was used to visualize and render protein structures. The similarity of interfaces in the homology model to those in X-ray crystal structures of extant hemoglobins was assessed by aligning the Ancα/β14 +Ancα tetramer to Hb of human (1A3N) and rainbow trout (Oncorhynchus mykiss 2R1H) (Extended Fig. 10).
Data and code availability.
Reconstructed ancestral sequences have been deposited in Genbank (IDs MT079112, MT079113, MT079114, MT079115). Alignment and inferred phylogeny, raw mass spectra, oxygen-binding data, and homology model coordinates have been deposited at https://doi.org/10.5061/dryad.w0vt4b8mx. HDX-MS data are available through doi: 10.5287/bodleian:5zRrdMB7E. Scripts for analysis for the HDX permutation analysis and identification of contacts between subunits in modeled structures have been deposited at https://github.com/JoeThorntonLab/Hb_evolution.
Extended Data
Extended Figure 1.
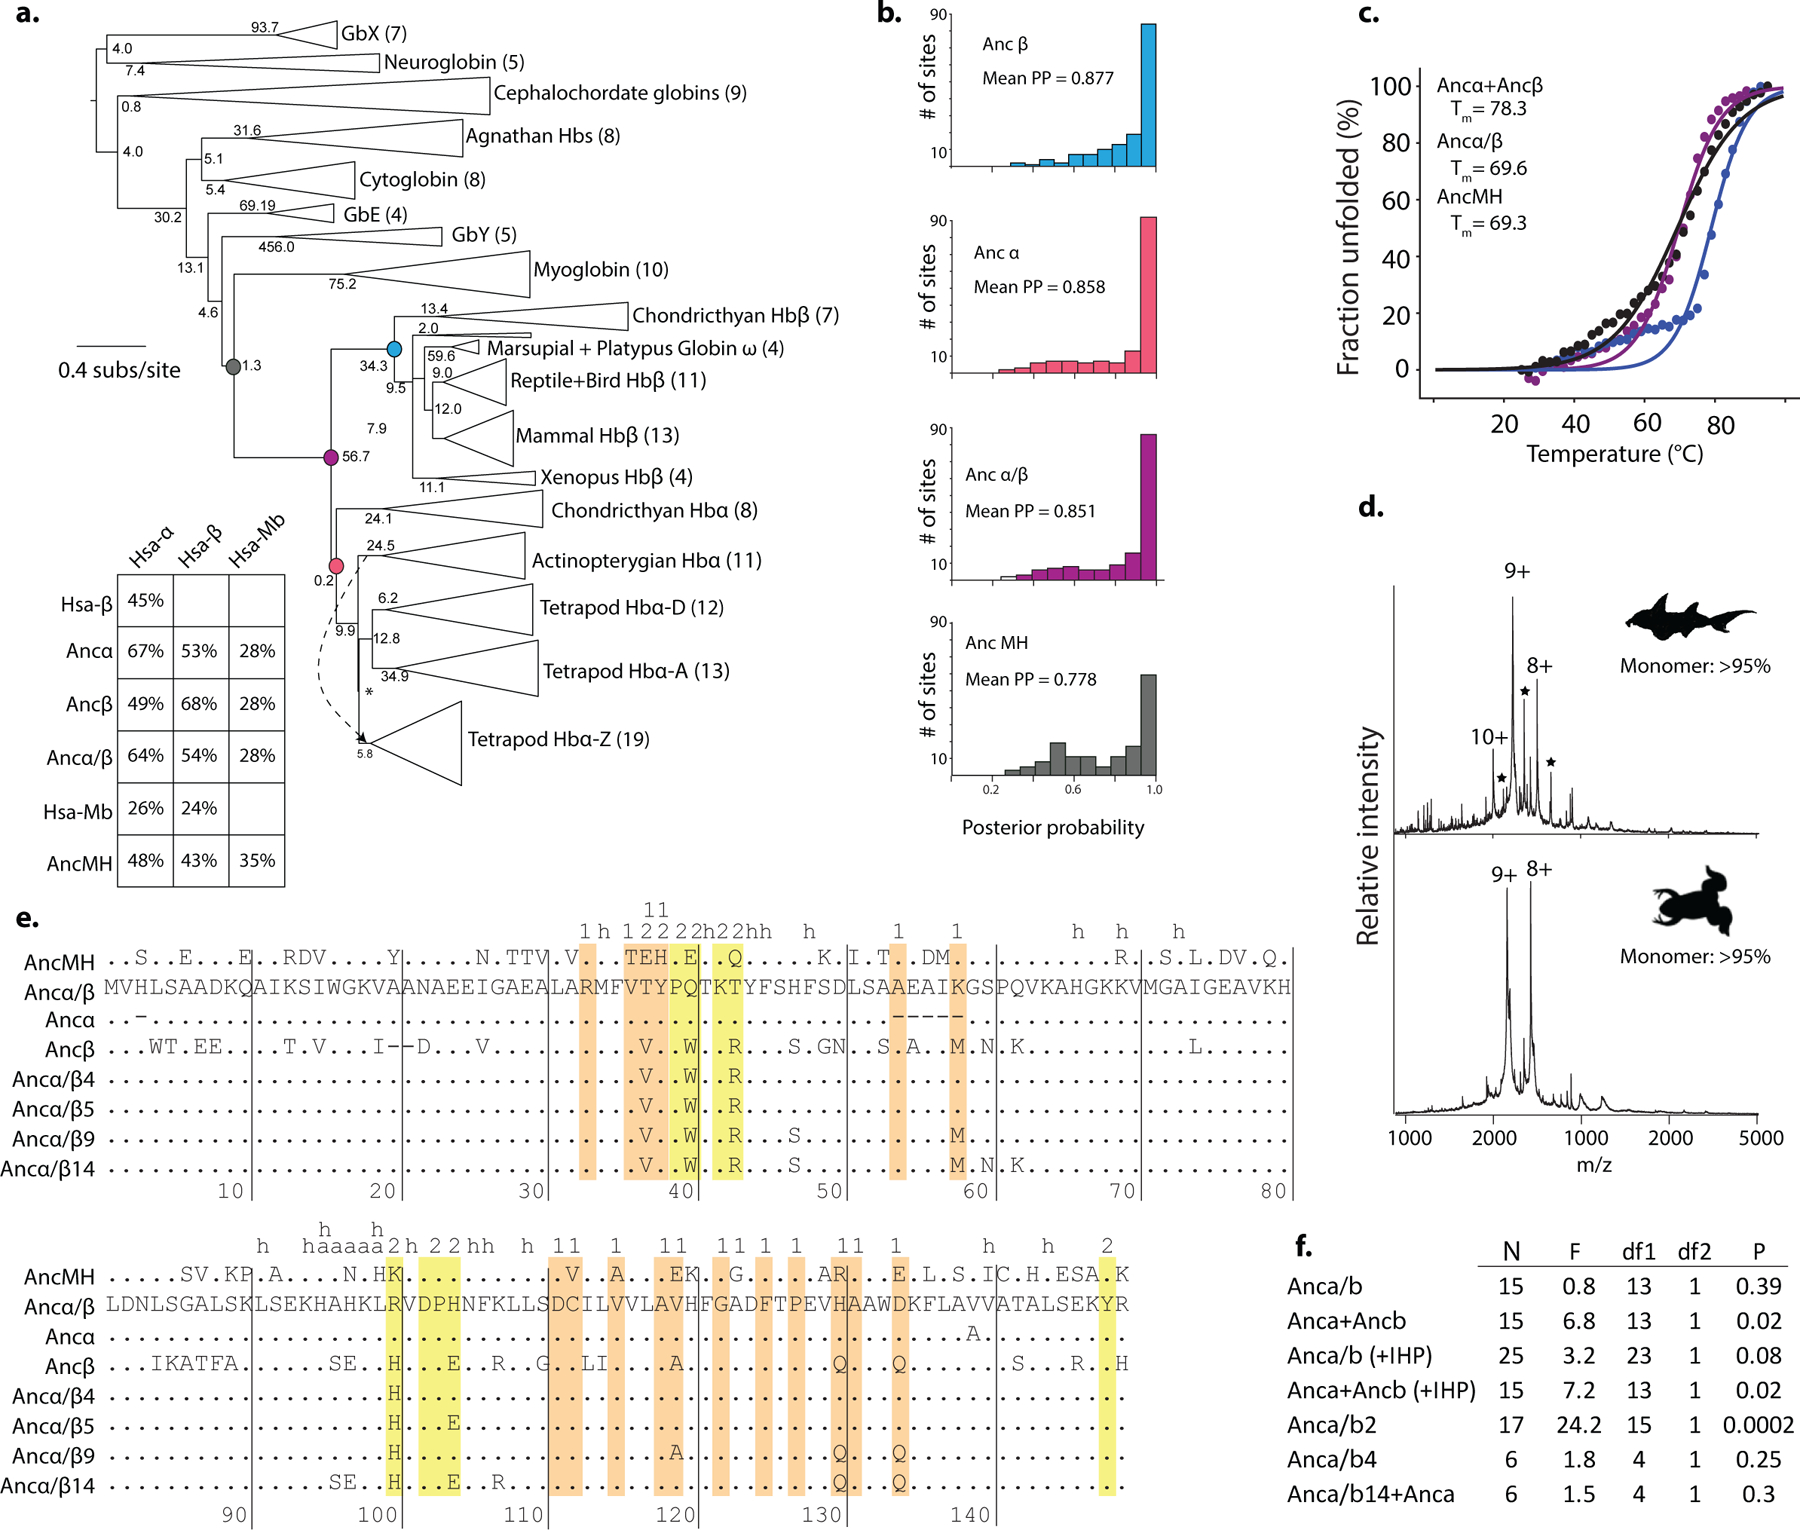
Reconstruction of ancestral hemoglobin and precursors. a) Phylogeny of Hb and related globins. Node supports are shown as approximate likelihood ratio statistic58,59. Numbers of sequences in each group are shown in parentheses. Ancestral sequences reconstructed in this study are shown as colored circles. Arrow, branch swap that differentiates this phylogeny from the unconstrained maximum likelihood phylogeny, which requires additional gene gains/losses. The tree is rooted on neuroglobin and globin X, paralogs that duplicated prior to the divergence of deuterostomes and protostomes60. Inset: Pairwise sequence identities among extant (human, Hsa) and reconstructed ancestral globins. b) Distribution across sites of the posterior probabilities (PP) of maximum a posteriori states for reconstructed ancestral proteins. c) Thermal stability of ancestral globins. Points, fraction of secondary structure lost as temperature increases in Ancα/β (purple), Ancα+Ancβ (blue) and AncMH (black), measured by circular dichroism spectroscopy at 222 nm, relative to signal at 23°C. Estimated Tm and SE from nonlinear regression and the best-fit curve (lines) are shown. Each point is the mean of 4 measurements. d) Native mass spectra (nMS) of Globin Y (GbY) from elephant shark (Callorhinchus milii) and African clawed frog (Xenopus laevis) at 30 μM. Charge states of heme-bound monomer shown. Asterisk, cleavage products. Spectra were collected once. e) Sequence alignment of reconstructed ancestral globins. Dots, states identical to Ancα/β. Yellow, IF2 sites; Orange, IF1 sites; h, sites 4 Å away from the heme; a, sites that link the heme-coordinated proximal histidine (H95) to IF2. f) Statistical test of cooperativity of oxygen binding for ancestral proteins and mutants. An F-test was used to compare the fit of a model in which the Hill coefficient (n) is a free parameter to a null model with no cooperativity (n=1). Computed P-value and degrees of freedom (df) are shown. N, number of concentrations measured. *, P<0.05. Data were pooled across replicate experiments for nonlinear regression.
Extended Figure 2. Stoichiometric characterization of ancestral globin complexes.
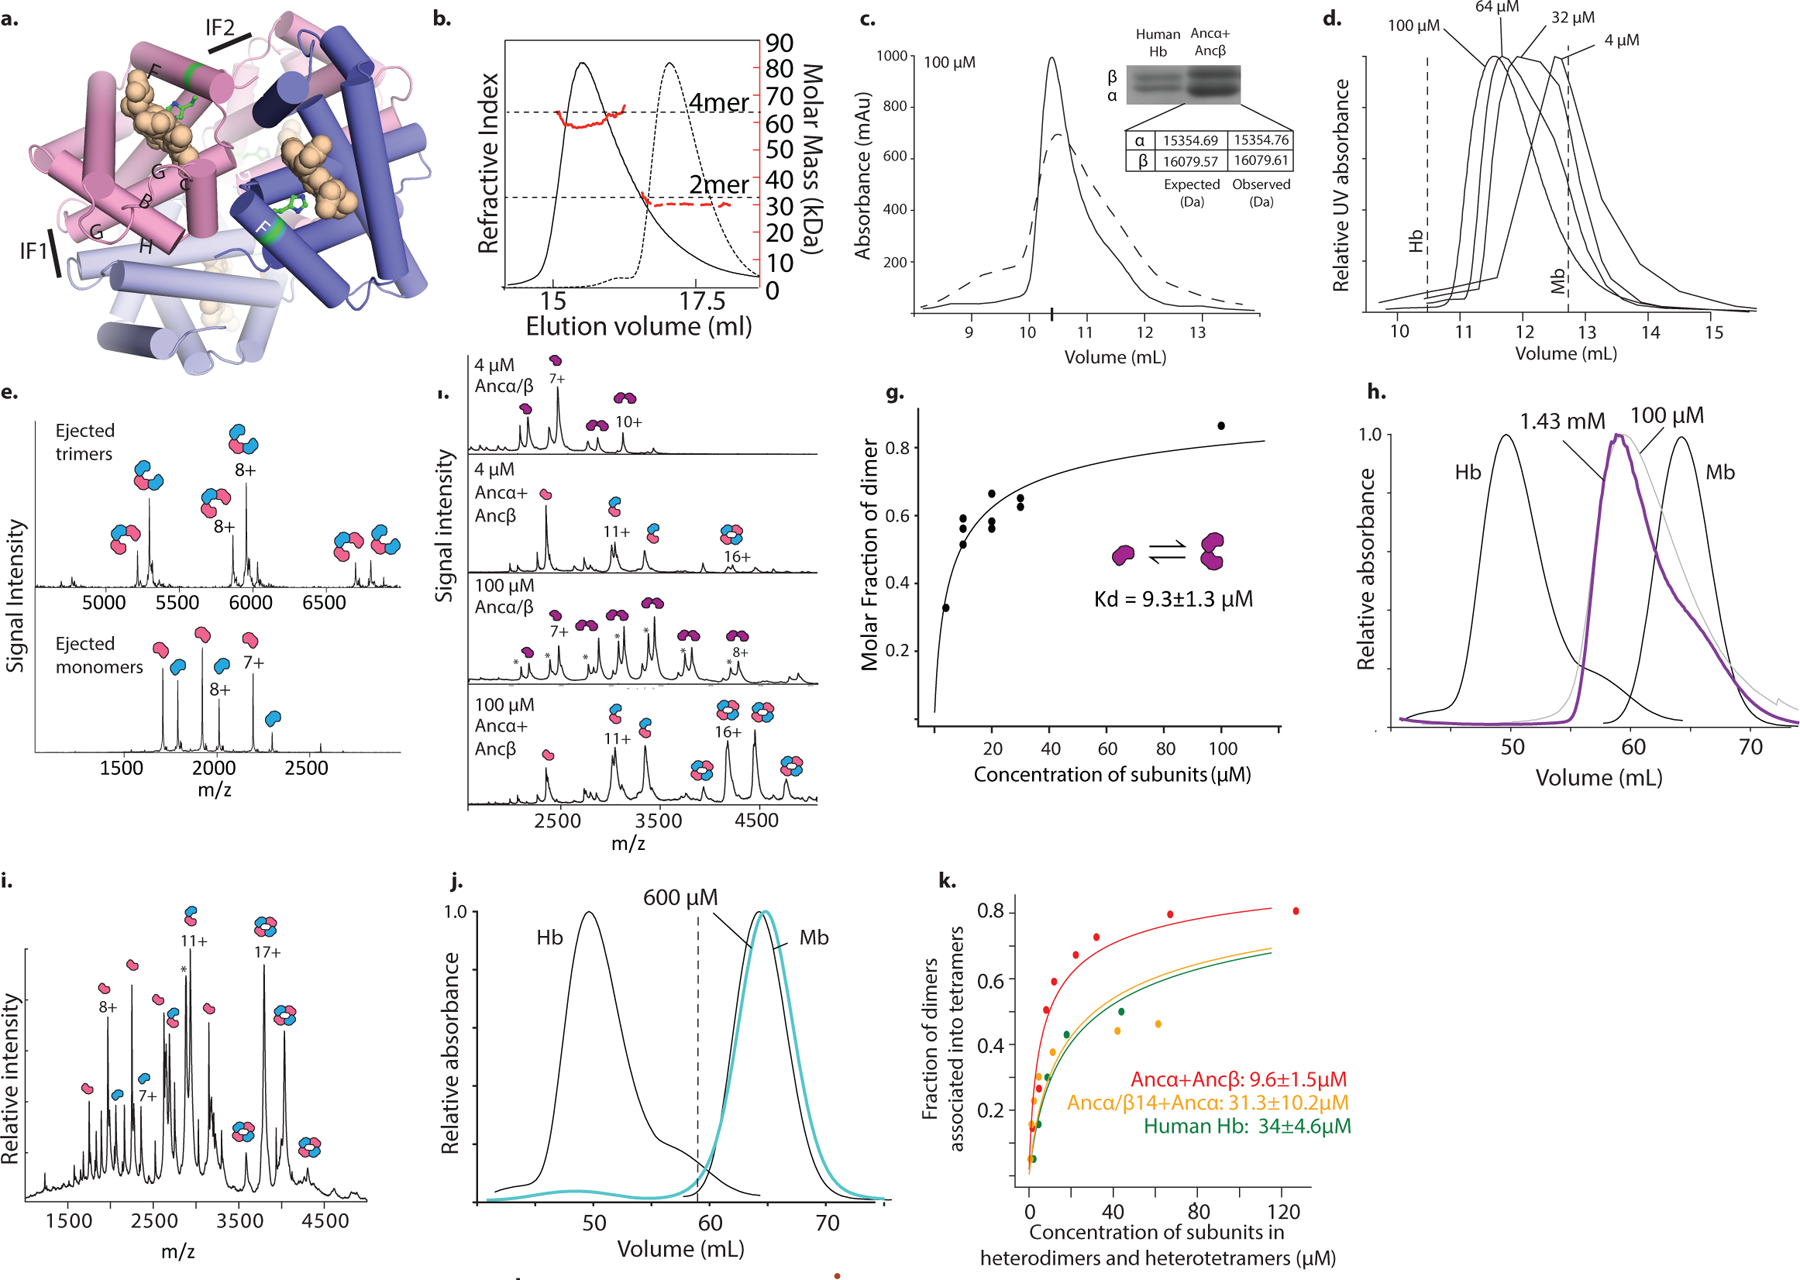
a) Homology model of Ancα+Ancβ (template 1A3N) showing heme (tan spheres). Blue cartoon, Ancβ subunits; red, Ancα. Helices and interfaces are labelled. Green, proximal histidine. b) Size exclusion chromatography and multiangle light scattering of Ancα/β (90 μM) and Ancα + Ancβ (60 μM). Black, relative refractive index. Red, estimated molar mass. Dotted lines, expected mass for dimers and tetramers. c) SEC of human Hb (dashed) and Ancα+Ancβ (solid) at 100 μM. Inset, SDS-PAGE of these complexes, with bands corresponding to α and β subunits. Inset, masses estimated by denaturing MS of Ancα+Ancβ, compared to expected masses based on primary sequence. d) SEC of Ancα/β across a series of concentrations. Dotted lines, elution peak volumes of human hemoglobin tetramer and myoglobin monomer. e) Tandem MS of the heterotetrameric peak in the Ancα + Ancβ nMS (indicated Fig 1b). Ejected monomer and trimer charge series and the subunits they contain are shown. f) nMS of Ancα+Ancβ and Ancα/β at 4 μM and 100 μM. Charge series and fitted stoichiometries are indicated. Dotted peaks represent apo-chains. g) Monomer-dimer association by Ancα/β. Abundance of monomer and dimer were characterized using nMS across a range of concentrations. Circles, fraction of all subunits that were assembled into dimers as a function of the concentration of subunits in all states. Nonlinear regression (line) was used to estimate the dissociation constant (Kd, with standard error). h) SEC of Ancα/β at high concentrations (purple and gray lines). SEC traces of human Hb, myoglobin (Mb) are shown for comparison. i) nMS of Human Hb at 50 μM. j) SEC of AncMH (cyan) at a high concentration. SEC of human Hb and myoglobin (black) are shown for reference. Dashed line, Ancα/β dimer elution peak volume (see f). k) Alternative estimation of affinity of dimer-tetramer association by nMS. For human Hb (blue) and Ancα/β14+Ancα (orange), the fraction of heterodimers incorporated into heterotetramers includes both heme-deficient and holo-heterodimers. For Ancα+Ancβ (red), cesium iodide adduct were included. Compare to Figs. 1d and 3d. Kds (with SE) were estimated by nonlinear regression (lines). All concentrations are expressed in terms of monomer. All nMS and SEC experiments were performed once at each concentration.
Extended Figure 3. Biochemical inferences about ancestral Hbs are robust to uncertainty in sequence reconstructions.
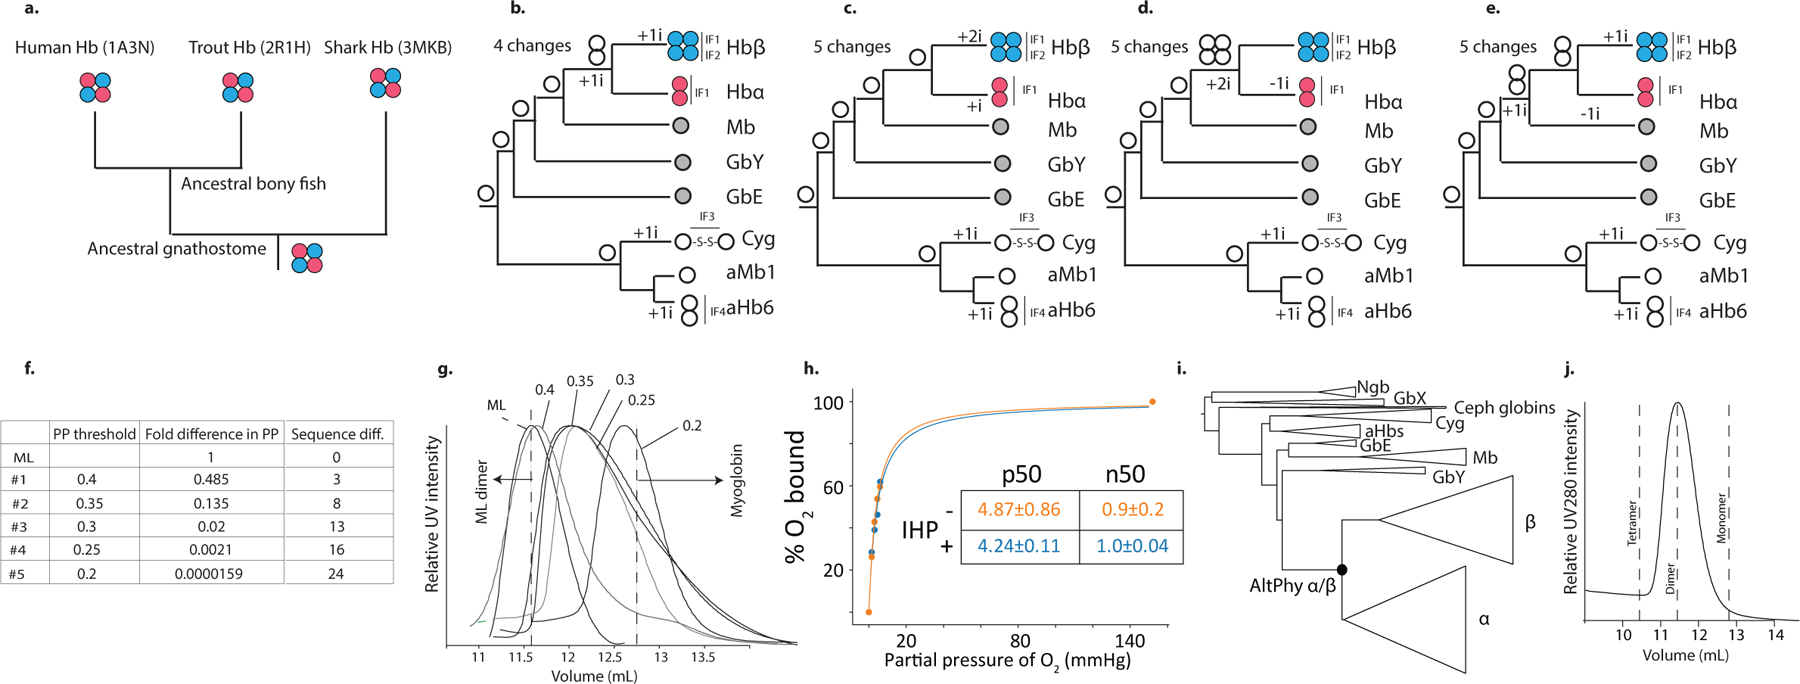
a-e) Maximum parsimony inferences of ancestral stoichiometry and interface loss/gains based on the distribution of stoichiometries among extant globins. a, Hbs in all extant lineages of jawed vertebrates are heterotetramers, supporting the inference that AncHb was heterotetrameric. Stoichiometries from representative species’ Hbs are shown with PDB IDs. b-e, Each panel shows a hypothetical set of ancestral stoichiometries, plotted on the phylogeny of extant Hb subunits and closely related globins, with the minimal number of changes required by each scenario. b) The most parsimonious reconstruction is that Ancα/β was a homodimer and AncMH was a monomer. c) For Ancα/β to have been a tetramer, early gain and subsequent loss of IF2 in Hbα would be required. d) For Ancα/β to have been a monomer, IF1 would have been independently gained in Hbα and Hbβ. e) For AncMH to have been a dimer, IF1 would have been lost in lineages leading to the monomers myoglobin (Mb) and globin E (GbE) 12,62. The dimeric globins most closely related to Hb -- agnathan “hemoglobin” (aHb) and cyotoglobin (Cyg) -- use interfaces that are structurally distinct from those in Hb15,16, indicating independent acquisition. f-j) Alternative reconstructions of Ancα/β are biochemically similar to ML reconstruction. f) Alternative ancestral versions of Ancα/β were constructed, each containing the the ML state at every unambiguously reconstructed site and the second most likely state at all ambiguously reconstructed sites, using different thresholds of ambiguity. For each alternative reconstruction, the table shows the threshold posterior probability (PP) used to define an ambiguous site, as well as the fold-difference in total PP of the entire sequence and the number of sites different from the ML reconstruction. g) SEC of ML α/β and alternative ancestors at 75 μM. Dotted lines show elution peak volumes for the dimeric ML α/β and monomeric human myoglobin. Constructs that elute between the expected volumes for dimer and monomer indicate dimers that partially dissociate during the run. None tetramerize; all form predominantly dimers, except AltAll(PP >0.2), which is ~62,000 times less probable than ML, which is mostly monomeric. UV traces were collected once for each construct. h) Oxygen binding curves of Ancα/β-AltAll(0.25), the dimeric AltAll with the lowest PP, with and without 2x IHP. Dissociation constant (P50, with SE) estimated by nonlinear regression is shown. Lack of cooperativity is indicated by the Hill coefficient (n50=~1.0). Oxygen binding at each concentration was measured once. i) Alternate globin phylogeny that is more parsimonious than the ML topology with respect to gene duplications and synteny but has lower likelihood given the sequence data. A version of Ancα/β (Ancα/β-AltPhy) was reconstructed on this phylogeny. j) SEC of Ancα/β-AltPhy. Dotted lines show expected elution volumes for various stoichiometric forms.
Extended Data Figure 4.
Stoichiometric analysis of Ancα, Ancβ, and AncMH. a) SEC of Ancα at 75 μM. b) nMS spectra (top, at 20 μM) and SEC-MALS (bottom) of Ancβ. c) Colorimetric hemoglobin concentration assay. Absorbance spectra before (black) and after (red) adding 150 uL Triton/NaOH reagent to 50 uL of purified Ancα/β. In the presence of reagent, globins absorb at 400 nm. d) SEC of crude cell lysate after expression of AncMH (purple) and Ancα/β (black). Dashed lines, expected elution volumes for monomer (human myoglobin) and dimer (Ancα/β). e) Colorimetric hemoglobin concentration assay on collected SEC fractions of crude lysate (panel e) containing AncMH (purple) and Ancα/β (black). f) nMS of His-tagged AncMH at 70 μM, with monomer charge series indicated. *, cleavage product. Green, apo. Fractional occupancy of the monomeric form is shown. All experiments were performed once.
Extended Figure 5. HDX-MS of Ancα/β.
a-c) Deuterium uptake measurements across time for three peptides, left vertical axis, raw deuterium incorporation; right vertical axis, deuterium incorporation divided by the total number of exchangeable amide hydrogens per peptide. Uptake curves for four concentrations by mutants IF1rev and P127R are shown. Each point shows mean with SE of 3 replicate measurements. d-f) Raw MS spectra for the peptides shown in a-c at 0.67 μM (red, at which the protein is monomeric), and 75 μM (purple, at which it is entirely dimeric: see Extended Figure 2). The traces are slightly offset to allow visualization. One replicate at each incubation time is shown. g) Amino acids 99 to 111 contact IF1 (orange) or IF2 (yellow). The homology model of one chain of Ancα/β (cartoon and sticks), was aligned to the α subunit of human Hb (PDB 1A3N); β subunits in are shown as surfaces. h) Normalized deuterium uptake difference (mean and SE from 3 replicates), defined as the uptake difference between monomer and dimer, divided by the uptake of the monomer, observed for peptides containing amino acids 99–111. Gray N-terminal residues do not contribute to uptake. Amino acid sequences are aligned and labeled (orange dots, IF1; yellow, IF2).
Extended Figure 6. Statistical analysis of HDX-MS results by peptides containing interface residues.
a) Residues in human Hb (PDB 1A3N) that bury at least 50% of their surface area in either IF1 (orange) or IF2 (yellow) are shown as spheres. Alpha subunits, red and pink; beta, blue. b) Homology models of Ancα/β dimer across IF1 (left) or IF2 (right). Two subunits of Ancα/β were computationally docked using HADDOCK using the α1/β1 inerface (IF1, left) or α1/β2 subunits (IF2, right) of human Hb (1A3N) as a template. c) Coverage of peptides produced by trypsinization of Ancα/β, assessed by MS. Sites that bury surface area at IF1 and IF2 in the modeled dimeric structures are orange or yellow, respectively. d) Classification of trypsin-produced peptides that contribute to IF1 or IF2. Each circle represents one peptide, plotted by average surface area per residue buried at each interface (total buried area divided by total number of residues). Dashed line, cutoffs to classify peptides as contributing to IF1 (orange zone) or IF2 (yellow). e,f) Correlation between change in deuterium uptake and burial of surface area at IF1 or IF2. Each point is one of 47 peptides, plotted according to the normalized difference in deuterium uptake between concentrations at which monomer or dimer predominate (0.67 or 75 μM, normalized by uptake at 75 μM) and average buried surface area at IF1 or IF2. r, Pearson correlation coefficient. g) Permutation test to evaluate the difference in deuterium uptake at two time points by peptides containing IF1 vs. all other peptides (orange), or IF2 vs. all other peptides (yellow). To avoid non-independence, the experimental data were reduced to a set of nonoverlapping peptides by sampling without replacement. Peptides were categorized by whether they contained residues at IF1, IF2, or neither; peptides contributing to both IFs were excluded. For each interface, the mean uptake by peptides contributing to the interface was calculated, as was the mean uptake by peptides not in that category, and the difference in means was recorded. Peptide assignment to categories was then randomized, and the difference in mean uptake recorded; this permutation process was repeated until all possible randomized assignment schemes for those peptides had been sampled once. P-value, fraction of permuted assignment schemes with a difference in mean uptake between categories greater than or equal to that from the true scheme. This process was repeated for 1000 nonoverlapping peptide sets; the histogram shows the frequency of P-values across these sets. Dotted line, P=0.05.
Extended Figure 7: Dissection of IF1 and IF2 by HDX-MS and mutagenesis.
a,b) Peptides with residues contributing to IF1 (a) or IF2 (b) that have the largest relative uptake difference upon dimerization are shown as purple tubes. Sticks, side chains predicted to contact the other subunit (orange surface, IF1; yellow IF2). Side chains are colored orange or yellow (IF1 or IF2) if they were substituted between AncMH and Ancα/β; purple, unchanged in that interval; green, site for targeted mutation P127; blue, Q40. Circled numbers show the rank of each peptide among all peptides for the normalized difference in deuterium uptake between monomer and dimer conditions. Homology models of the Ancα/β dimer using half-tetramers of human Hb (1A3N) are shown. In panel a, the dimer is modeled using the α1/β1 subunits; in b, it is modeled on the α1/β2 subunits. c,d) nMS of interface mutants Q40R (at IF2) and P127R (at IF1) and for mutants IF1 and IF2, in which interface residues in Ancα/β were reverted to their states in AncMH. All assays at 20 μM. Stoichiometries and charge states are labelled. Unhemed peak series due to heme ejection during nMS is labeled. Spectra were collected once.
Extended Figure 8. Alternative methods to normalize deuterium uptake.
a) Deuterium uptake difference between monomer (0.67μM) and dimer (75μM) at each time point was normalized by the length of each peptide. Peptides were categorized by the interface to which they contribute, as in Fig. 2c. *, interface peptide sets that have significantly increased uptake upon dilution when compared to peptides outside of that interface, as determined by a permutation test (see Extended Fig. 6). Each point shows the mean and SE from 3 replicates. b) Permutation test to evaluate the difference in deuterium uptake at 60 minutes by peptides at each interface, when uptake difference per peptide is normalized by length (using the methods described in Extended Fig. 6g). Orange, peptides with IF1-containing residues vs. those with no IF1 residues. Yellow, IF2-containing peptides vs. those with no IF2 residues. Dotted line, P=0.05. c, d) Average deuterium uptake difference per residue (c) and uptake difference normalized by dimer uptake (d) for peptides at different time points. IF1 sites (Orange), IF2 sites (Yellow). Each rectangle shows the position of the peptide in the linear sequence and its uptake (mean of 3 replicates).
Extended Figure 9. Effect of interface-disrupting mutations on Ancα/β.
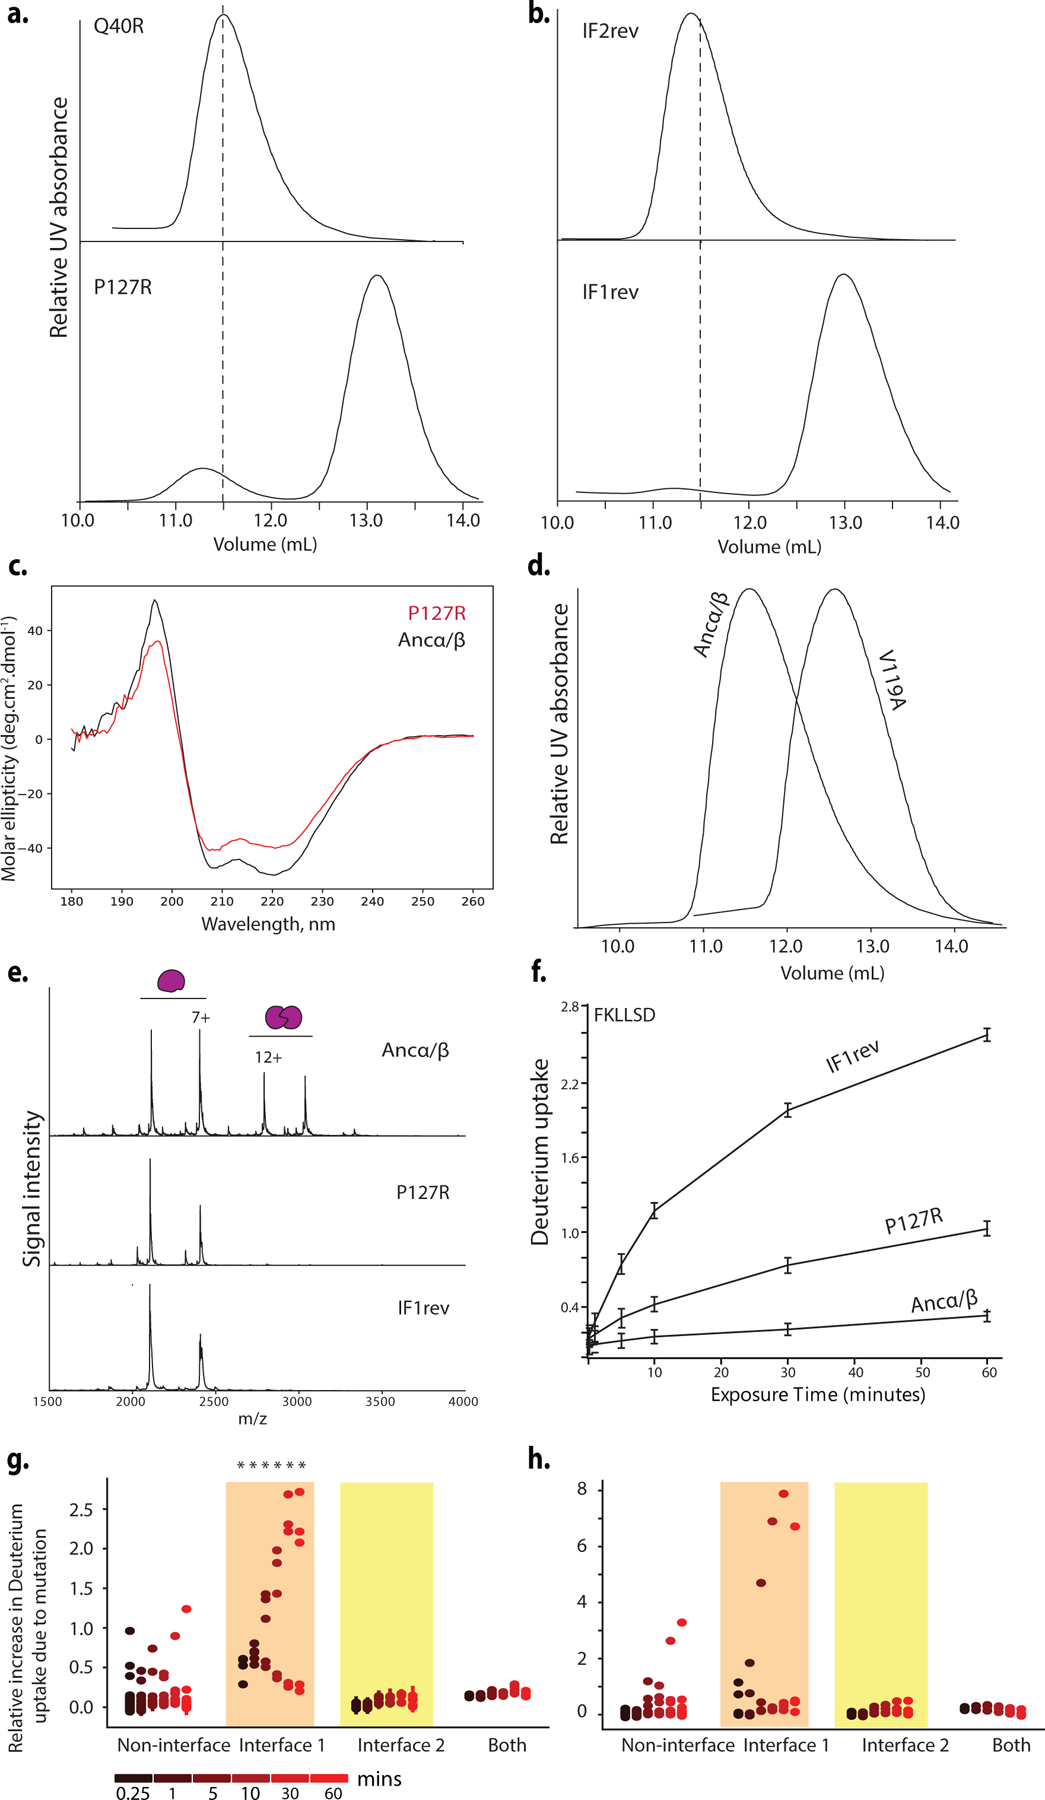
a,b) SEC of mutants at IF2 (Q40R and IF2rev, which reverts all substitutions that occurred between AncMH and Ancα/β at IF2 sites) and at IF1 (P127R and IF1rev), at 100 μM. Dashed line, elution peak volume for Ancα/β. c) Circular dichroism spectra for P127R and Ancα/β, showing comparable helical structure. d) SEC from IF1 mutant V119A at 64 μM. e) nMS of Ancα/β, P127R and IF1rev at 10 μM. Stoichiometries and charges are shown. For a-d, nMS and SEC experiments were performed once per concentration. f) Normalized deuterium uptake by IF1-containing peptide 106–111 in HDX-MS of Ancα/β (75 μM) and mutants P127R(2 μM) and IF1rev (2 μM). Points and error bars, mean and SE of 3 replicates. g,h). Difference between deuterium uptake by each peptide in Ancα/β and uptake by the same peptide IF1 mutants P127R (g) and IF1 rev (h), both at 2 μM, normalized by uptake in Ancα/β. Peptides are classified by interface category. Circles and error bars, mean and SE of 3 replicates. *, peptide sets that have significantly increased relative uptake (by permutation test, see Extended Fig. 6) compared to all other peptides (peptides containing both IF1 and IF2 residues excluded).
Extended Figure 10. Genetic mechanisms of tetramer evolution.
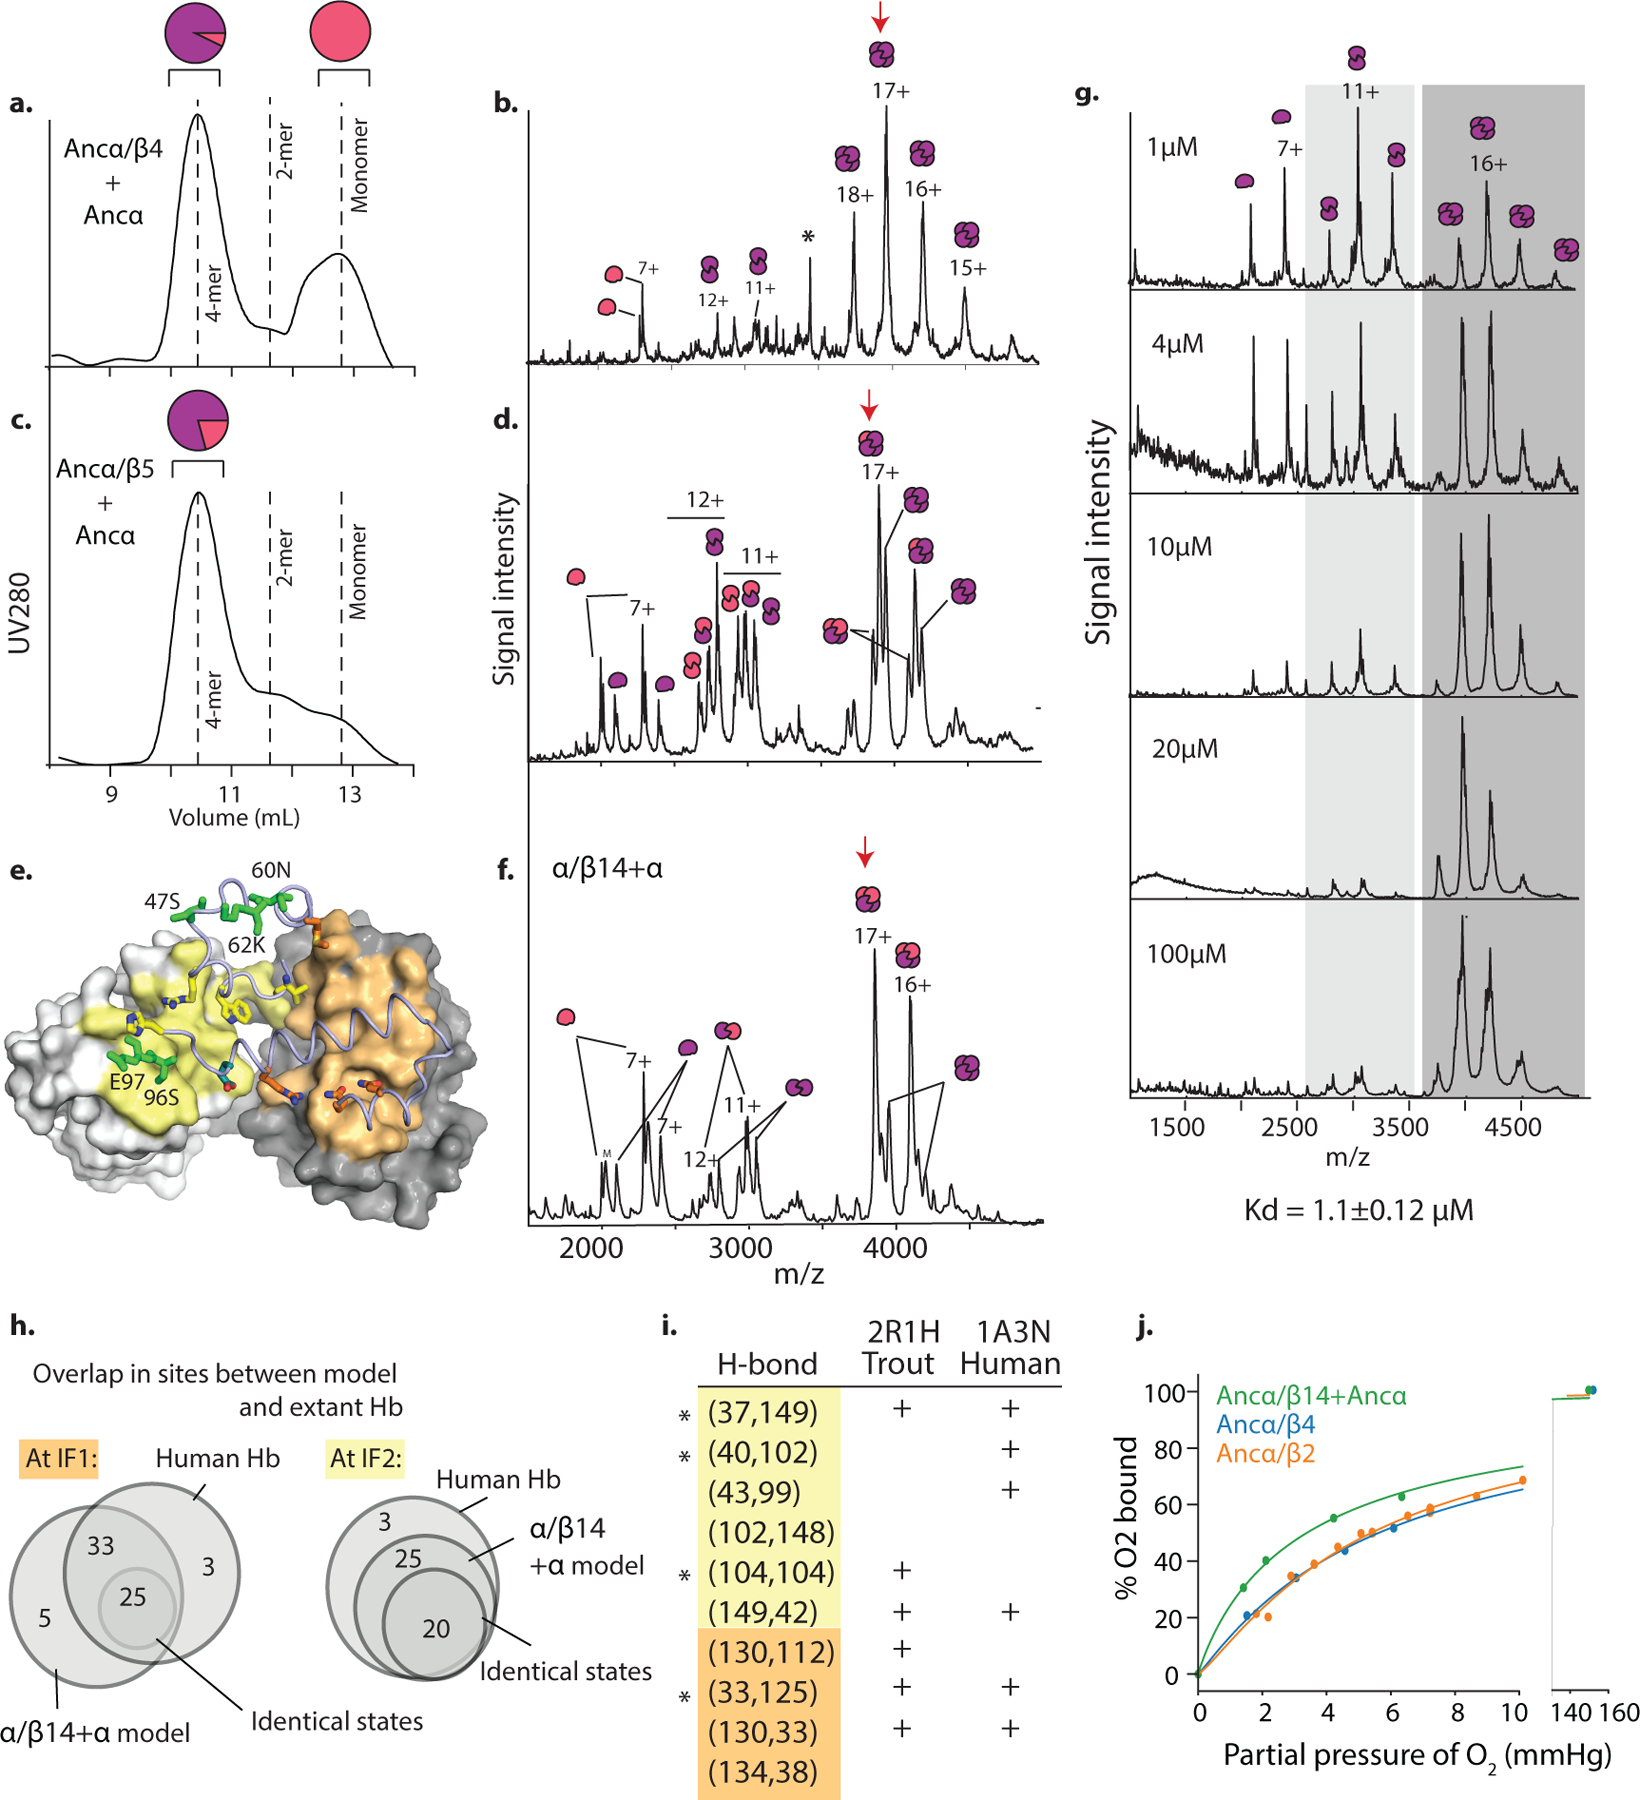
a,c) SEC of Ancα/β containing sets of historical substitutions, when coexpressed and purified with Ancα. Vertical lines, elution volumes of known stoichiometries (4mer, Ancα +Ancβ; 2mer, Ancα/β; monomer, human myoglobin). Pie graphs, relative proportions of α (pink) and α/β mutant (purple) subunits in fractions corresponding to each peak, as determined by high resolution MS (Extended Figure 11). b) nMS of tetrameric fraction in a. at 20 μM (monomer concentration). Together, a and b show that tetramers formed by coexpression of Ancα/β4+ Ancα incorporate virtually no alpha subunit. Occupancy from this experiment is shown in Fig. 3b. d, f) nMS of unfractionated purified protein complexes of Ancα/β5+α and Ancα/β14+α at 20 μM. Charge series, stoichiometries indicated. *, apparent impurity. e) Homology model of Ancα/β14+α using Human Hb (1a3n) as template. Yellow and cyan sticks, Ancβ-lineage substitutions on IF2, orange sticks, Ancβ substitutions on IF1. Yellow surface, α IF2; Orange surface, α IF1. Green, 5 β substitutions close to the interfaces included in Ancα/β14+α. Red arrows, peaks isolated for further characterization by tandem MS (Ext. Fig. 11). g) nMS of Ancα/β2 across concentrations. Charge series and stoichiometries indicated. h) Similarity between interfaces in Ancα/β14+Ancα homology model and X-ray crystal structure of Human Hb. Venn diagrams show sites buried at IF1 and IF2 in one or both structures. Small circle, number of shared interface sites with identical amino acid state. i) Hydrogen-bond contacts at interfaces in Ancα/β14+α homology model are also found in X-ray crystal structures of extant hemoglobins. Residue pairs hydrogen-bonded in Ancα/β14+α IF2 (yellow) and IF1 (orange) are listed; +, also present in crystal structure. *, interactions discussed in the text of this paper. PDB identifiers are shown. j. Oxygen equilibrium curves of Ancα/β14+α, Ancα/β4, Ancα/β2. All experiments were performed once per concentration. Lines, best-fit curve by nonlinear regression.
Extended Figure 11. Stoichiometric characterization of Ancα/β containing historical substitutions.
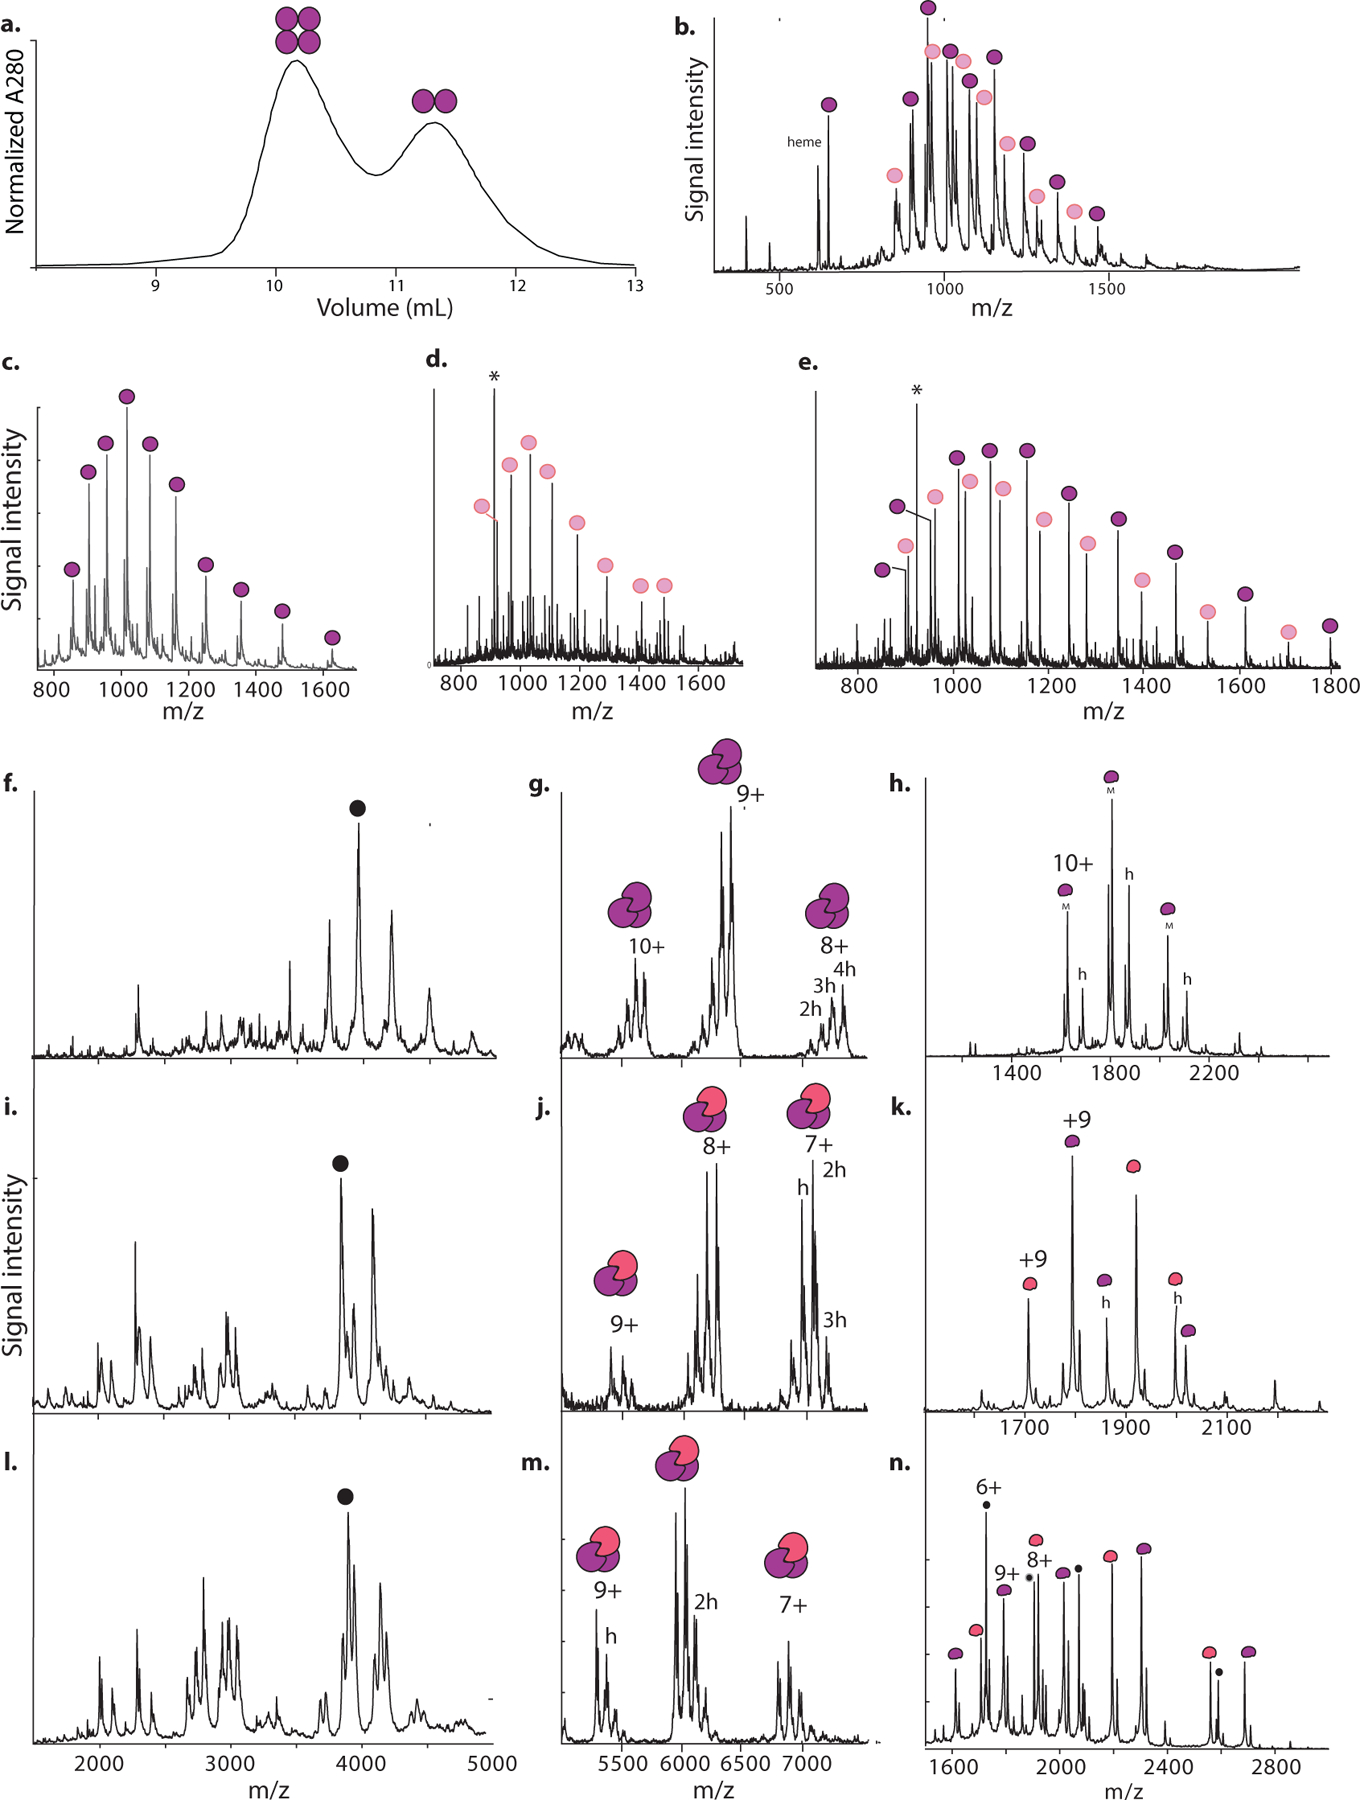
a) SEC of Ancα/β5. Circles show stoichiometry associated with each peak’s elution volume. b) High-resolution accuracy mass spectrometry (HRA-MS) of Ancα/β5 + α. Purple circles label peaks associated with Ancα/β5; pink, Ancα. *, 922 m/z reference standard. c) HRA-MS of tetramer-containing SEC fraction of Ancα/β4+Ancα. c) HRA-MS of monomer-containing SEC fraction of Ancα/β4+Ancα. e) HRA-MS of Ancα/β9+Ancα. f) nMS of tetramer-containing SEC fraction of Ancα/β4+Ancα (see Fig. 3a,b). Black circle, most abundant peak used for tandem MS. g) Tandem MS of isolated most-abundant peak in f, showing trimer-containing peaks. Charge states and number of hemes (h) in the 8+ peak are indicated. h) monomer-containing peaks. I, j, k) nMS (i) and tandem MS (j, k) of Ancα/β14+Ancα (see Fig. 3f). l, m, n). nMS and tandem MS of Ancα/β5+Ancα (see Fig. 3c,d). Black dots in (n) mark charge species produced by cleavage of Ancα/β5. All experiments were performed once.
Supplementary Material
Acknowledgments.
We thank Chandrashekar Natarajan for technical advice and the Hb co-expression plasmid and members of the Thornton Lab for technical advice and comments on the manuscript. Supported by NIH R01-GM131128 and R01-GM121931 (JWT), NIH R01-HL087216 and NSF OIA-1736249 (JFS), NIH T32-GM007197 (CRC), a Chicago Fellowship (GKAH), BBSRC BB/L017067/1 and Waters Corp. (JLPB).
Footnotes
Competing interests. The authors declare no competing interests.
References
- 1.Ahnert SE, Marsh JA, Hernández H, Robinson CV & Teichmann SA Principles of assembly reveal a periodic table of protein complexes. Science (80-. ) 350, (2015). [DOI] [PubMed] [Google Scholar]
- 2.Marsh JA & Teichmann SA Structure, Dynamics, Assembly, and Evolution of Protein Complexes. Annu. Rev. Biochem 84, 551–575 (2015). [DOI] [PubMed] [Google Scholar]
- 3.Monod J, Wyman J, & Changeux JP On the nature of allosteric transitions: a plausible model. Jounal Mol. Biol 12, 88–118 (1965). [DOI] [PubMed] [Google Scholar]
- 4.Goodsell DS & Olson AJ Structural symmetry and protein function. Annu. Rev. Biophys. Biomol. Struct 29, 105–153 (2000). [DOI] [PubMed] [Google Scholar]
- 5.Rivalta I et al. Allosteric pathways in imidazole glycerol phosphate synthase. Proc. Natl. Acad. Sci 109, E1428–E1436 (2012). [DOI] [PMC free article] [PubMed] [Google Scholar]
- 6.Dawkins R Climbing mount improbable (WW Norton & Company, 1997). [Google Scholar]
- 7.Perutz BMF et al. Structure of haemoglobin. Nature 1, 416–422 (1960). [DOI] [PubMed] [Google Scholar]
- 8.Storz JF Hemoglobin: Insights into protein structure, function, and evolution (Oxford University Press, 2018). [Google Scholar]
- 9.Goodman M & Moore GW Phylogeny of hemoglobin. Syst. Zool 22, 508–532 (1973). [Google Scholar]
- 10.Coates ML Hemoglobin function in the vertebrates: An evolutionary model. J. Mol. Evol 6, 285–307 (1975). [DOI] [PubMed] [Google Scholar]
- 11.Zuckerkandl E The evolution of hemoglobin. Sci. Am 212, 110–118 (1965). [DOI] [PubMed] [Google Scholar]
- 12.Kendrew JC, Dickerson RE, Strandberg BE, Hart RG, Davies DR, Phillips DC, & Shore VC Structure of myoglobin: A three-dimensional Fourier synthesis at 2 Å. resolution. Nature 185, 422 (1960). [DOI] [PubMed] [Google Scholar]
- 13.Blank M et al. Oxygen supply from the bird’s eye perspective: Globin E is a respiratory protein in the chicken retina 286, 26507–26515 (2011). [DOI] [PMC free article] [PubMed] [Google Scholar]
- 14.Fago A, Rohlfing K, Petersen EE, Jendroszek A & Burmester T Functional diversification of sea lamprey globins in evolution and development. Biochim. Biophys. Acta - Proteins Proteomics 1866, 283–291 (2018). [DOI] [PubMed] [Google Scholar]
- 15.Lechauve C et al. Cytoglobin conformations and disulfide bond formation. FEBS J 277, 2696–2704 (2010). [DOI] [PubMed] [Google Scholar]
- 16.Heaslet HA & Royer WE The 2.7 Å crystal structure of deoxygenated hemoglobin from the sea lamprey (Petromyzon marinus): Structural basis for a lowered oxygen affinity and Bohr effect. Structure 7, 517–526 (1999). [DOI] [PubMed] [Google Scholar]
- 17.Makino M et al. High-resolution structure of human cytoglobin: Identification of extra N- and C-termini and a new dimerization mode. Acta Crystallogr. Sect. D Biol. Crystallogr 62, 671–677 (2006). [DOI] [PubMed] [Google Scholar]
- 18.Kidd RD, Baker HM, Mathews AJ, Brittain T & Baker EN Oligomerization and ligand binding in a homotetrameric hemoglobin: Two high-resolution crystal structures of hemoglobin Bart’s (γ 4 ), a marker for α-thalassemia. Protein Sci 10, 1739–1749 (2002). [DOI] [PMC free article] [PubMed] [Google Scholar]
- 19.Kumar KK, Jacques DA, Guss JM & Gell DA The structure of α-haemoglobin in complex with a haemoglobin-binding domain from Staphylococcus aureus reveals the elusive α-haemoglobin dimerization interface. Acta Crystallogr. Sect. FStructural Biol. Commun 70, 1032–1037 (2014). [DOI] [PMC free article] [PubMed] [Google Scholar]
- 20.Hoffman SJ et al. Expression of fully functional tetrameric human hemoglobin in Escherichia coli. Proc. Natl. Acad. Sci. U. S. A 87, 8521–5 (1990). [DOI] [PMC free article] [PubMed] [Google Scholar]
- 21.Tyuma I, Benesch RE & Benesch R The Preparation and Properties of the Isolated α and β Subunits of Hemoglobin A. Biochemistry 5, 2957–2962 (1966). [DOI] [PubMed] [Google Scholar]
- 22.Manning LR, Dumoulin A, Jenkins WT, Winslow RM & Manning JM Determining subunit dissociation constants in natural and recombinant proteins. Methods Enzymol 306, 113–129 (1999). [DOI] [PubMed] [Google Scholar]
- 23.Ackers GK Energetics of subunit assembly and ligand binding in human hemoglobin. Biophys. J 32, 331–346 (1980). [DOI] [PMC free article] [PubMed] [Google Scholar]
- 24.Fersht AR et al. Hydrogen bonding and biological specificity analysed by protein engineering. Nature 314, 235–238 (1985). [DOI] [PubMed] [Google Scholar]
- 25.Eisenberg D & McLachlan AD Solvation energy in protein folding and stability. Nature 319, 199–203 (1986). [DOI] [PubMed] [Google Scholar]
- 26.Mihailescu M-R & Russu IM A signature of the T -> R transition in human hemoglobin. Proc. Natl. Acad. Sci 98, 3773–3777 (2002). [DOI] [PMC free article] [PubMed] [Google Scholar]
- 27.Gelin BR, Lee AWM & Karplus M Hemoglobin tertiary structural change on ligand binding its role in the co-operative mechanism. J. Mol. Biol 171, 489–559 (1983). [DOI] [PubMed] [Google Scholar]
- 28.Sato A, Gao Y, Kitagawa T & Mizutani Y Primary protein response after ligand photodissociation in carbonmonoxy myoglobin. Proc. Natl. Acad. Sci. U. S. A 104, 9627–9632 (2007). [DOI] [PMC free article] [PubMed] [Google Scholar]
- 29.Barends TRM et al. Direct observation of ultrafast collective motions in CO myoglobin upon ligand dissociation. Science (80-. ) 350, (2015). [DOI] [PubMed] [Google Scholar]
- 30.Siddiq MA, Hochberg GK & Thornton JW Evolution of protein specificity: insights from ancestral protein reconstruction. Current Opinion in Structural Biology vol. 47 113–122 (2017). [DOI] [PMC free article] [PubMed] [Google Scholar]
- 31.Garcia-Seisdedos H, Empereur-Mot C, Elad N & Levy ED Proteins evolve on the edge of supramolecular self-assembly. Nature 548, 244–247 (2017). [DOI] [PubMed] [Google Scholar]
- 32.Grueninger D et al. Designed protein-protein association. Science (80-. ) 319, 206–210 (2008). [DOI] [PubMed] [Google Scholar]
- 33.Pauling L et al. Sickle Cell Anemia, a Molecular Disease. Science (80-. ) 110, 543–548 (2019). [DOI] [PubMed] [Google Scholar]
- 34.Coyle SM, Flores J & Lim WA Exploitation of latent allostery enables the evolution of new modes of MAP kinase regulation. Cell 154, 875–887 (2013). [DOI] [PMC free article] [PubMed] [Google Scholar]
- 35.Reynolds KA, McLaughlin RN & Ranganathan R Hot spots for allosteric regulation on protein surfaces. Cell 147, 1564–1575 (2011). [DOI] [PMC free article] [PubMed] [Google Scholar]
- 36.Darwin C On the origin of species by means of natural selection, or the preservation of favoured races in the struggle for life. john murray, london. Orig. Species by Means Nat. Sel 204–208 (1859).
- 37.Lynch M Evolutionary diversification of the multimeric states of proteins. Proc. Natl. Acad. Sci 110, E2821–E2828 (2013). [DOI] [PMC free article] [PubMed] [Google Scholar]
- 38.Finnigan GC, Hanson-Smith V, Stevens TH & Thornton JW Evolution of increased complexity in a molecular machine. Nature 481, 360–364 (2012). [DOI] [PMC free article] [PubMed] [Google Scholar]
- 39.Gray MW, Lukeš J, Archibald JM, Keeling PJ & Doolittle WF Irremediable complexity? Science (80-. ) 330, 920–921 (2010). [DOI] [PubMed] [Google Scholar]
REFERENCES FOR METHODS AND EXTENDED DATA
- 40.Katoh K, Rozewicki J & Yamada KD MAFFT online service: multiple sequence alignment, interactive sequence choice and visualization. Brief. Bioinform 1–7 (2017) 10.1093/bib/bbx108. [DOI] [PMC free article] [PubMed] [Google Scholar]
- 41.Guindon S et al. New algorithms and methods to estimate maximum-likelihood phylogenies: Assessing the performance of PhyML 3.0. Syst. Biol 59, 307–321 (2010). [DOI] [PubMed] [Google Scholar]
- 42.Le SQ & Gascuel O An improved general amino acid replacement matrix. Mol. Biol. Evol 25, 1307–1320 (2008). [DOI] [PubMed] [Google Scholar]
- 43.Anisimova M & Gascuel O Approximate likelihood-ratio test for branches: A fast, accurate, and powerful alternative. Syst. Biol 55, 539–552 (2006). [DOI] [PubMed] [Google Scholar]
- 44.Anisimova M, Gil M, Dufayard JF, Dessimoz C & Gascuel O Survey of branch support methods demonstrates accuracy, power, and robustness of fast likelihood-based approximation schemes. Syst. Biol 60, 685–699 (2011). [DOI] [PMC free article] [PubMed] [Google Scholar]
- 45.Hoffmann FG, Opazo JC, Hoogewijs D, Ebner B, Vinogradov S, Hankeln T, Bailly X, & Storz JF Evolution of the globin gene family in deuterostomes: lineage-specific patterns of diversification and attrition. Molecular Biology and Evolution 29: 1735–1745 (2012). [DOI] [PMC free article] [PubMed] [Google Scholar]
- 46.Yang Z PAML 4: Phylogenetic analysis by maximum likelihood. Mol. Biol. Evol 24, 1586–1591 (2007). [DOI] [PubMed] [Google Scholar]
- 47.Schwarze K, Singh A & Burmester T The Full Globin Repertoire of Turtles Provides Insights into Vertebrate Globin Evolution and Functions. Genome Biol. Evol 7, 1896–1913 (2015). [DOI] [PMC free article] [PubMed] [Google Scholar]
- 48.Natarajan C et al. Expression and purification of recombinant hemoglobin in escherichia coli. PLoS One 6, 1–7 (2011). [DOI] [PMC free article] [PubMed] [Google Scholar]
- 49.Bonaventura C & Bonaventura J Anionic control of function in vertebrate hemoglobins. Integr. Comp. Biol 20, 131–138 (1980). [Google Scholar]
- 50.Weber RE, Jensen F Functional Adaptations In Hemoglobins From Ectothermic Vertebrates. Annu. Rev. Physiol 50, 161–179 (1988). [DOI] [PubMed] [Google Scholar]
- 51.Isaacks RE & Harkness DR Erythrocyte organic phosphates and hemoglobin function in birds, reptiles, and fishes. Integr. Comp. Biol 20, 115–129 (1980). [Google Scholar]
- 52.Benesch R, The BR Interaction of Hemoglobin and its subunits with 2,3-Diphosphoglycerate. Biochemistry 61, 1102–1106 (1968). [DOI] [PMC free article] [PubMed] [Google Scholar]
- 53.Imai K Allosteric effects in Haemoglobin (Cambridge University Press., 1982). [Google Scholar]
- 54.Imaizumi K, Imai K, Tyuma I & Biochem J The linkage between the four-step binding of oxygen and the binding of heterotropic anionic ligands in hemoglobin. J. Biochem 86, 1829–1840 (1979). [DOI] [PubMed] [Google Scholar]
- 55.Grispo MT et al. Gene duplication and the evolution of hemoglobin isoform differentiation in birds. J. Biol. Chem 287, 37647–37658 (2012). [DOI] [PMC free article] [PubMed] [Google Scholar]
- 56.Richard V, Dodson GG & Mauguen Y Human Deoxyhaemoglobin-2,3-Diphosphoglycerate Complex Low-Salt Structure at 2·5 Å Resolution. Journal of Molecular Biology vol. 233 270–274 (1993). [DOI] [PubMed] [Google Scholar]
- 57.Arnone A X-ray diffraction study of binding of 2,3-diphosphoglycerate to human deoxyhaemoglobin. Nature 237, 146–149 (1972). [DOI] [PubMed] [Google Scholar]
- 58.Arnone A, P. M. Structure of inositol hexaphosphate-human deoxyhaemoglobin complex 249, 195–197 (1974). [DOI] [PubMed] [Google Scholar]
- 59.Cong X et al. Determining membrane protein-lipid binding thermodynamics using native mass spectrometry. J. Am. Chem. Soc 138, 4346–4349 (2016). [DOI] [PubMed] [Google Scholar]
- 60.Marty MT et al. Bayesian deconvolution of mass and ion mobility spectra: From binary interactions to polydisperse ensembles. Anal. Chem 87, 4370–4376 (2015). [DOI] [PMC free article] [PubMed] [Google Scholar]
- 61.Krissinel E & Henrick K Inference of macromolecular assemblies from crystalline state. J. Mol. Biol 372, 774–797 (2007). [DOI] [PubMed] [Google Scholar]
- 62.Blank M et al. Oxygen Supply from the bird ‘s eye perspective globin E is a respiratory protein in the chicken GLOBIN E IS A RESPIRATORY PROTEIN IN THE CHICKEN RETINA. J. Biol. Chem 286, 26507–26515 (2011). [DOI] [PMC free article] [PubMed] [Google Scholar]
Associated Data
This section collects any data citations, data availability statements, or supplementary materials included in this article.
Supplementary Materials
Data Availability Statement
Reconstructed ancestral sequences have been deposited in Genbank (IDs MT079112, MT079113, MT079114, MT079115). Alignment and inferred phylogeny, raw mass spectra, oxygen-binding data, and homology model coordinates have been deposited at https://doi.org/10.5061/dryad.w0vt4b8mx. HDX-MS data are available through doi: 10.5287/bodleian:5zRrdMB7E. Scripts for analysis for the HDX permutation analysis and identification of contacts between subunits in modeled structures have been deposited at https://github.com/JoeThorntonLab/Hb_evolution.