

Abstract
Few studies have examined shiftwork adaptation among police officers or potential differences in disease biomarkers among adapted and maladapted shiftworkers. This study characterized shiftwork adaptation among 430 police officers from the Buffalo Cardio-Metabolic Occupational Police Stress (BCOPS) study. Police officers working fixed night shifts with symptoms characteristic of adaptation and maladaptation were identified using latent class analysis (n = 242). Two approaches were applied, one with police-specific symptoms and another using more general symptoms as shiftwork adaptation indicators. Biomarkers of inflammation, heart rate variability, and cardiometabolic risk were then compared between shiftwork adaptation groups, and with officers working day shifts, after adjusting for confounding. When analyses included police-specific symptoms, maladapted shiftworkers (n = 73) had more self-reported stress, sleep disturbances, fatigue, and less social support than adapted shiftworkers (n = 169). Using more general symptoms, maladapted officers (n = 56) reported more stress and depression, and less social support than adapted officers (n = 186). In police-specific models, adjusted (least-squares) means (± standard error) of circulating interleukin-6 (IL-6) concentrations in maladapted officers (0.8 ± 0.1 ln[pg/ml]) were modestly elevated relative to adapted shiftworkers (0.7 ± 0.1 ln[pg/ml], p = .09) and relative to permanent day workers (0.5 ± 0.1 ln[pg/ml], p ≤ 0.01), and leptin levels in maladapted officers (9.6 ± 0.1 ln[pg/ml]) exceeded those in the adapted (9.4 ± 0.1 ln[pg/ml], p ≤ 0.01) and day shift groups (9.4 ± 0.1 ln[pg/ml], p = .03). In the general model, adjusted mean tumor necrosis factor-alpha (TNF-α) concentrations among maladapted officers (5.6 ± 0.23 pg/ml) exceeded the adapted (4.8 ± 0.2 pg/ml, p ≤ 0.01) and day workers (5.0 ± 0.2 pg/ml, p = .04), and insulin among maladapted officers was higher (2.4 ± 0.1 ln[uu/ml]) than the adapted group (1.8 ± 0.1 ln[uu/ml], p = .03). No differences were observed for the other biomarkers. The results suggest that maladaptation among police officers working fixed night shifts may lead to increases in leptin, insulin, IL-6, and TNF-α; however, the cross-sectional design and possible residual confounding preclude interpretation of cause and effect. Prospective studies are planned to further characterize the relationship between shiftwork maladaptation and biomarkers of chronic disease risk in this police officer cohort.
Keywords: Police officers, shiftwork adaptation and maladaptation, metabolic and immune system biomarkers, sleep, stress
Introduction
Law enforcement is among the most dangerous and stressful occupations (Purba and Demou 2019; Syed et al. 2020; Violanti et al. 2017). Occupational hazards encountered by police include: physically and psychologically demanding working conditions (violence, physical exertion, injuries, pain, fatigue), potential exposure to hazardous materials and infectious agents, and irregular sleep/wake schedules. Police work is associated with increased mortality relative to the general population, as well as increased risks for major chronic diseases (metabolic syndrome, cardiovascular disease [CVD], cancer) and psychological disorders (Andrew et al. 2008; Hartley et al. 2011a, 2011b; Joseph et al. 2009; Rostami et al. 2019; Syed et al. 2020; Tharkar et al. 2008; Violanti et al. 2009, 2006b, 1998; Wirth et al. 2013).
Shiftwork is a critical aspect of law enforcement and other critical work sectors that require continuous vigilance, such as military service, and contributes to the adverse health and safety impacts encountered among those workers (Fischer et al. 2017; Violanti et al. 2017). Approximately 15–30% of U.S. workers’ timetables are outside the typical daytime work schedule of ~06:00–18:00 h (Alterman et al. 2013; Caruso 2014). Shiftwork forces rearrangement of the schedule of sleep and wakefulness, leading to dysregulation of circadian rhythms, with associated immune, endocrine, metabolic, psychological, and social impacts (Faraut et al. 2013; Proper et al. 2016; Sack et al. 2007; Violanti 2012; Wyse et al. 2017). Shiftwork has been associated with increased levels of biomarkers of inflammation as well as metabolic and autonomic nervous system dysregulation (Andrew et al. 2017; Canuto et al. 2013; Esquirol et al. 2009; Fink 2020; James et al. 2017; Jarczok et al. 2013; Puttonen et al. 2011; Ulhoa et al. 2015; Zimberg et al. 2012). Changes in these measures are associated with increased risks for diseases that are observed among law enforcement officers and other shiftwork employees (Elenkov 2008; Licht et al. 2013; Puttonen et al. 2010, 2011; Reutrakul and Knutson 2015; Sookoian et al. 2007; Zimberg et al. 2012).
Despite the evidence linking shiftwork to adverse health outcomes, some individuals adapt to shiftwork better than others. This concept was introduced in 1979 and was defined as the ability to adapt to shiftwork without adverse consequences (Andlauer et al. 1979). Factors associated with shiftwork adaptation include circadian preference (chronotype), sleep flexibility, positive affect, beneficial family and social relationships, low work demands, and certain genetic traits (Arendt 2010; Boudreau et al. 2013; Burch et al. 2009; Drake et al. 2015; Gamble et al. 2011; Lammers-van Der Holst and Kerkhof 2014; Natvik et al. 2011; Reinberg and Ashkenazi 2008; Reszka et al. 2013; Saksvik-Lehouillier et al. 2015; Saksvik et al. 2011; Sulkava et al. 2017; Tamagawa et al. 2007). However, there is scant objective evidence indicating the extent to which maladapted shiftworkers are at greater risk of disease relative to adapted shiftworkers. This may be due in part to the lack of a consensus definition for shiftwork adaptation; however, it can be operationalized as an absence of shiftwork-associated stress, fatigue, sleep disruption, psychological disturbances, and related symptoms or stressors (Andlauer et al. 1979; Ritonja et al. 2019; Saksvik et al. 2011).
Few investigations have examined shiftwork adaptation among police officers, or potential differences in disease biomarkers among adapted and maladapted shiftworkers in law enforcement or in other occupations (Kecklund et al. 2008; Lammers-van Der Holst and Kerkhof 2014; Willis et al. 2008; Wirth et al. 2011). The Buffalo Cardio-Metabolic Occupational Police Stress (BCOPS) study provided a useful framework for addressing these objectives (Violanti et al. 2006a). First, latent class analysis (LCA) was applied to officers working evenings and nights using a series of ‘symptom indicator variables’ as surrogate measures to classify shiftworkers as either adapted or maladapted (i.e., in the absence of a direct measure of shiftwork adaptation). Those working permanent day shifts were excluded from this analysis because the focus was only on shiftworkers and their symptoms of adaptation or maladaptation. Next, analyses were performed to identify traits or other inherent characteristics that predicted membership in groups designated as adapted and maladapted. The final analyses determined the extent to which biomarkers of inflammation (C-reactive protein [CRP], interleukin-6 [IL-6], tumor necrosis factor-alpha [TNF-α], fibrinogen), heart rate variability (HRV), and cardiometabolic risk indicators (high density lipoprotein [HDL], low density lipoprotein [LDL], triglycerides, glucose, systolic blood pressure, diastolic blood pressure, waist circumference, hemoglobin A1C, insulin, adiponectin, leptin) differed between adapted and maladapted shiftworkers. These biomarkers target diseases observed among police officers and other occupations that involve shiftwork. The biomarker analyses also included officers working permanent days as an additional comparison group to further determine whether adapted workers are more similar to those working day shifts, and if maladapted workers may be at greater disease risk relative to those working days. The following hypotheses were tested: (1) symptom indicators can be used to identify groups of shiftworking police officers with and without characteristics of shiftwork adaptation; (2) officers adapted to shiftwork have lifestyle characteristics or personality traits that differ from maladapted shiftworking police officers, and (3) officers adapted to shiftwork have different levels of inflammation, HRV, or cardiometabolic risk factors relative to maladapted officers or those working day shifts.
Methods
Participants
Study participants were officers enrolled in the Buffalo Cardio-Metabolic Occupational Police Stress (BCOPS) study. The BCOPS study is a cross-sectional study with a prospective component designed for investigating associations between occupational stressors and psychological or physiological health indicators (Violanti et al. 2006a). Specifics regarding recruitment, data collection, and methods are described elsewhere (Hartley et al. 2011a; Violanti et al. 2006a). A total of 710 police officers working in the Buffalo, New York Police Departments were invited to participate in the study, of which 430 officers agreed to participate and were examined between June 4, 2004 and October 2, 2009. Participants were evaluated during the normal business hours of a clinic visit scheduled on an off day. Questionnaires were administered to collect information on demographics such as age, gender, education, rank, psychosocial factors, and lifestyle behaviors. Officers were asked to provide a detailed medical history and to self-report current medication usage. Additionally, 10 h fasting blood samples were collected. All measures were collected during an off day and not directly following an afternoon or night shift. The BCOPS study received Institutional Review Board approval from The State University of New York at Buffalo and the National Institute for Occupational Safety and Health, and the protocol conforms to international ethical standards (Portaluppi et al. 2010). All participating officers provided written informed consent. Initial analyses using latent class analysis (LCA) included a total of 242 officers working either evening or night shifts. Subsequent biomarker comparisons examined among adapted and maladapted shiftworkers as well as a group of permanent day shift workers; those analyses included 430 participants.
Shiftwork
Daily shiftwork histories were obtained from electronic payroll records for each officer from 1994 or the start of employment to the date of study participation between 2004 and 2009 (Violanti et al. 2009). A typical work cycle consisted of 4 workdays, 3 off days, 3 workdays, 3 off days, and then the cycle was repeated. Officers generally worked fixed shifts but occasionally were assigned to a different shift on a temporary basis. A previous examination of work start time distributions demonstrated consistency with standard shift start times of: 07:00 or 08:00 h for the day shift, 16:00 h for the evening shift, and 20:00 or 21:00 h for the night shift (Weder et al. 2014). Work start times that fell outside these standard start times were assigned to shifts according to the following criteria: day (04:00–11:59 h), evening (12:00–19:59 h), or night shift (20:00–03:59 h) (Violanti et al. 2008; Wirth et al. 2017). Total cumulative hours of work on day, evening, or night shifts were individually summarized for each participant over their entire available work history. The shift that a participant spent a majority of his or her time working (i.e., the shift that had the largest percentage of total hours worked) was assigned as their dominant, long-term work shift (day, evening, or night).
Questionnaires
Participants completed self- and interviewer-administered questionnaires to provide information on sociodemographic (age, sex, race, years of service, and education), lifestyle behaviors (alcohol consumption, dietary factors, tobacco consumption, and physical activity), and medical history. Officers reported highest level of education attained, number of years employed as a police officer, and current rank (Police Officer, Sergeant/Lieutenant/Detective). Weekly consumption of alcoholic beverages (one 12oz can or bottle of beer, a medium glass of wine, or a shot of liquor) was obtained. Work activity was assessed using the Seven-Day Physical Activity Recall (PAR) questionnaire, an interviewer-administered questionnaire developed in the Stanford Five-City Project, and reported as the duration (hours/week and hours/weekend) and intensity (moderate, hard, and very hard) of physical activity during the previous seven days (Sallis et al. 1985). Work activity was dichotomized as high work activity versus low or moderate activity.
Each participant completed several psychometric instruments. Sleep was characterized using the Pittsburgh Sleep Quality Index (PSQI) (Buysse et al. 1989), which consists of nineteen self or bed partner-rated questions that are used to characterize sleep: quality, onset latency, duration, efficiency, as well as sleep disturbance, sleep medication use, and daytime dysfunction. The global sleep score is a composite of the seven components, with higher scores indicating poorer sleep quality. A global score >5 was used as the cutoff for poor overall sleep (Buysse et al. 1989; Grandner et al. 2006).
The Spielberger Police Stress Survey (SPPS) (Spielberger et al. 1981) is a 60-item measure that was used to characterize specific sources of police work stress on a scale ranging from 0–100, with higher scores representing more stress. For each item, officers were asked to estimate the frequency with which they experienced the event in the previous month and year; however, for this analysis, scores across the 60 items were summed to obtain a total stress rating. In some cases, the three subscale scores were used instead of the total stress rating: (1) administrative and organizational pressure, which measures satisfaction with departmental policies and procedures plus fairness of rewards, performance, and judicial system; (2) physical and psychological threats, which measures dangerous situations and experiences; and (3) lack of support, which includes political pressures and relationships with supervisors and coworkers). Each subscale has acceptable internal consistency (Cronbach’s alpha > 0.90) (Spielberger et al. 1981).
Vital exhaustion (VE) was assessed using the 10-item Maastricht Questionnaire, which has three dimensions, i.e., feelings of: (1) excessive fatigue and lack of energy; (2) increasing irritability; and (3) demoralization (Appels and Mulder 1988). Perceived stress was measured using the 10-item Perceived Stress Scale (PSS), which is a validated and widely used instrument that measures the perception of stress (Cohen et al. 1983). Perceived stress is calculated by summing all item responses that range in scores from 0–5 (never, almost never, sometimes, fairly often, and very often). Higher scores represent higher levels of perceived stress. Depression was measured using the Center for Epidemiologic Studies Depression Scale (CESD) (Van Dam and Earleywine 2011). Participants with a score ≥16 are considered to have depression. Social support (SS) was measured using the Social Provision Scale, which consists of 22 items that were developed to assess six provisions of social relationships (Cutrona and Russell 1983). A total score was derived by summing the score of all six provisions, with higher scores representing higher social support. For this analysis, participants with a total score <75% percentile were considered to have low social support.
Personality traits were measured using the Neuroticism-Extraversion-Openness Five-Factor Inventory (NEO-FII) (Costa and McCrae 1989; Zillig et al. 2016), which is a shortened version of the NEO Personality Inventory that includes the following traits: neuroticism, openness to experience, extraversion, conscientiousness, and agreeableness. Each item is rated on a five-point Likert scale, ranging from strongly disagree to strongly agree. Higher scores indicate a stronger presence of a given trait.
Hardiness was assessed using the 15-item instrument developed by Bartone (2007), which is comprised of three dimensions, including control (belief one is capable of managing stressful events), commitment (ability to find meaning in stressful events), and challenge (ability to interpret stressful events as opportunities). Each item is rated on a four-point Likert scale that ranges from not at all true to completely true. A summary score is obtained by appropriately coding and summing all 15 items.
The Family Environment Scale (FES) is a 90-item measure that assesses perceived family interactions using three dimensions of the family and its social environment (relationships, personal growth, system maintenance) (Charalampous et al. 2013). It is comprised of 10 subscales (cohesion, expressiveness and conflict, independence, achievement orientation, intellectual-cultural orientation, active-recreational orientation, moral religious emphasis, and organization and control). Total scores (range: 0–9) are obtained by adding each value in the respective subscale; higher scores indicate a higher degree of perceived family interaction for the specified dimension.
Biomarkers
Standardized laboratory assays were used to quantify inflammatory cytokines (IL-6, TNF-α, fibrinogen, and CRP), as well as cardiometabolic measures (HDL, LDL, triglycerides, fasting glucose, insulin, adiponectin, and leptin). Fasting 10 h blood samples were obtained in the morning (i.e., prior to 0830) from all participants by a trained phlebotomist. The samples were then sent to Kalieda Laboratory (Buffalo, NY) for analysis. IL-6 (pg/ml), TNF-α (pg/ml), fibrinogen (mg/dl), and CRP (mg/l) were measured at the University of Vermont Laboratory for Clinical Biochemistry Research (McCanlies et al. 2011; Wirth et al. 2017). Portions of the blood were saved and stored in 0.05 ml cryovials frozen at −80°C. IL-6 was measured using a solid-phase quantitative sandwich enzyme-linked immunosorbent assay (ELISA) provided by R&D Systems, Inc., Minneapolis, MN. The lower limit of quantification for the IL-6 assay is 0.16 pg/ml, and the upper quantification range is between 10.0 and 12.0 pg/ml. The normal range for IL-6 is 0.24–12.5 pg/ml, and the inter-assay coefficient of variation (CV) ranged from 8% to 12%. The normal range for TNF-α and fibrinogen is <5.6 pg/ml and 200–393 mg/dl, respectively. The assay for high-sensitivity CRP was performed using the BNII nephelometer from Dade Behring using an immunonephelometric technique (range: 0.16–1100 mg/l). CRP concentrations in healthy individuals are typically ≤3 mg/l. Five percent of all samples were reanalyzed for quality control purposes. Inter-assay CVs ranged from 2.1% to 5.7%. Further details regarding the collection and analysis of these measures are provided elsewhere (McCanlies et al. 2011). Briefly, cardiometabolic biomarkers were measured using the Beckman Coulter LX20 clinical chemistry analyzer (Mikolaenko et al. 2000). Insulin was measured using a chemiluminescent microparticle immunoassay (CMIA) test using the ARCHITECT i1000SR System. The normal range for insulin is 2–20 uu/ml (Jennings et al. 2007). The presence of metabolic syndrome was defined based on the National Cholesterol Education Program Adult Treatment Panel guidelines; individual components include abdominal obesity, reduced HDL, elevated triglycerides, elevated blood pressure, and glucose intolerance. The presence of at least three components is considered diagnostic for metabolic syndrome (NCEP 2002).
HRV measures were derived by electrocardiography (ECG) using a standardized protocol as described previously (Andrew et al. 2013; Camm et al. 1996). ECG measures were obtained from a three-electrode lead during the clinical examination. Participants were supine and resting for 5 min prior to ECG data being collected between 09:15 and 12:00 h, depending on the participant’s scheduled clinic visit. Each time series was processed using an automated data-adaptive QRS detection package. Data editing included visual inspection of the ECG time series overlaid with QRS markers and hand-editing of R wave markers where needed (Andrew et al. 2013). The resultant RR time series were processed using cubic spline interpolation to provide a time series with equal sample increments at two samples per second. The interpolated time series were then detrended using a smoothness priors method (Tarvainen et al. 2002). Spectral analyses were performed using an autoregressive order of p = 16 (Boardman et al. 2002). Following these analyses, high frequency (HF) and low frequency (LF) components of HRV, as well as time-domain indices; standard deviations of all RR intervals (SDRR), and the square root of the mean squared differences of successive RR intervals (RMSSD) were obtained. HF was defined as the area under the power spectral density from 0.15 to 0.40 Hz, and the LF domain was defined as that between 0.04 and 0.15 Hz. The time-domain indices of HRV quantify the amount of variability between successive heartbeats; whereas, frequency domain measures distribute absolute power within the HRV spectrum into frequency bands (Shaffer and Ginsberg 2017).
Data analysis
Analyses were performed using SAS 9.4 (Cary, North Carolina, USA) and R version 3.5.0. Descriptive statistics for categorical variables were evaluated using frequencies and chi-square tests. For continuous variables, means and standard deviations were generated, and tests of significance were estimated using independent t-tests or Wilcoxon rank sum tests, depending on the normality of each variable. Latent class variable selection was conducted using the R-package LCAvarsel version 1.1 (Dean and Raftery 2010; Fop and Murphy 2017; Fop et al. 2017) in order to identify state-like variables (i.e., current symptoms), and subsequent analyses were conducted using the PROC LCA procedure in SAS (Lanza et al. 2007). Two approaches were used to characterize participants as either adapted or not to shiftwork; one that included police-specific questionnaire data (SPPS, VE), and another more general symptom approach that excluded police-specific symptoms. Analyses were conducted in four stages: (1) Symptom indicator variables were selected for use in the LCA; (2) LCA model specification was used to identify putative shiftwork adaptation groups (one police-specific model, one general model); (3) sociodemographic and behavioral characteristics and personality traits associated with each shiftwork adaptation group were identified; and (4) inflammatory, cardiometabolic, and HRV biomarkers that differed between adapted, maladapted, and day shift groups were identified. Note that only officers working evenings or nights were included in stages 2 and 3 of the analysis. This was done to increase the likelihood that factors identified at these stages were inherent to shiftwork adaptation. In stage 4, day workers were added as an additional comparison group so that both adapted and maladapted groups could be compared to those working a regular day schedule. For example, if a biomarker is similar among adapted and day workers, but different among maladapted shiftworkers, this would support the hypothesis that shiftwork maladaptation may alter intermediate health indicator biomarkers.
Stage 1. Symptom indicator variable selection
For the police-specific approach, twenty-two potentially maladaptive symptom indicator variables were identified from questionnaire data (PSQI, SPPS, VE, SS, CESD) based on a literature review and data availability (Table S1). Only state-like variables were considered for inclusion into the LCA; whereas personality traits, sociodemographic, and behavioral factors were evaluated in the second stage of the analysis to determine whether those traits differed among the adapted and maladapted latent classes. Note, that no sleep symptoms were included in the general symptom LCA; furthermore, variables included in the LCA analysis were not used in subsequent analyses. The PROC LCA procedure requires categorical variables to characterize a discrete latent variable (Lanza et al. 2007; Schreiber 2017). The VE measures were dichotomized based on a ‘yes’ response for each question, and the continuous symptom indicator variables; lack of support (SPPS), PSS, and SS were dichotomized using a 75% percentile cut-point for the item response probability. Sleep quality, sleep disturbance, sleep latency, sleep duration, daytime dysfunction, habitual sleep efficiency, and sleep medication usage, all components of PSQI, were dichotomized using a cutoff value of ≥2, which indicates moderate to severe sleep difficulty for each component (Buysse et al. 1989). Variable selection for the LCA was conducted using a swap-stepwise procedure (Dean and Raftery 2010). For the general symptom approach, 17 symptom indicator variables were considered (Table S1), and the police-specific components (SPPS, VE) were excluded from that analysis.
Stage 2. LCA model specification
After the variable selection procedures were completed, latent class models were fitted consecutively, starting with a two-cluster model to identify groups of individuals who were alike in their response to the categorical indicator variables (Goodman 1974; Lanza et al. 2007; Lazarsfeld and Henry 1968). A series of LCA models were evaluated using the G-squared, Bayesian Information Criterion (BIC), and Akaike Information Criterion (AIC) fit statistics, with the final model selected based on objective fit statistics, bootstrapped parametric likelihood ratios tests, and the interpretability of the resultant latent classes (Lanza et al. 2007; Lanza and Rhoades 2013).
Stage 3. Traits predicting membership in adapted or maladapted shiftworker groups
Univariate general linear models (PROC GLM in SAS) and chi-square tests were used initially to identify sociodemographic factors, personality traits, and lifestyle behaviors that differed between the adapted and maladapted shiftworker groups. Multivariable logistic regression analyses were then used to estimate odds ratios with 95% confidence intervals in a combined analysis to determine which variables independently predicted membership in the adapted or maladapted group. Linear regression assumptions were evaluated by examining the final model’s residuals. Covariates with a p-value ≤0.20 in the univariate analyses were included in the combined analysis. Using a manual backwards selection procedure, variables that changed the beta coefficient for latent class membership by ≥10%, and variables that were statistically significant (p ≤ 0.05), were retained in the final model. Variables included in the final logistic regression models also were evaluated using area under the receiver operating characteristic curve (AUC ROC) (Hosmer and Lemeshow 2000).
Stage 4. Biomarker comparisons among adapted and maladapted shiftworkers, and day workers
General linear models were used to determine whether adjusted (least squares [LS]) means of inflammatory cytokines, HRV indices, or cardiometabolic measures differed among maladapted shiftworkers relative to adapted workers or relative to those working permanent day shifts. Natural logarithm (ln) transformations of CRP, IL-6, triglycerides, insulin, leptin, SDNN, RMSSD, HF-HRV, and LF-HRV variables were used to normalize their distribution, and differences between groups were evaluated using the least significant differences statistic.
Results
The study population characteristics are presented in Table 1. The mean age (± standard deviation) of the shiftworker population was 40 ± 7 y, whereas the mean age of day workers was 46 ± 7 y. Shiftworkers were primarily white (84%), male (86%), and married (75%). Day workers relative to shiftworkers were more likely to be nonwhite (30% vs. 16%, respectively) and female (30% vs. 14%, respectively, Table 1). Most of the study population hasd more than a high school education (89%) and an annual income >$70,000 (71%). The average number of years employed was 13 ± 7 y (data not shown), and the majority of the sample held the rank of police officer (78%). The mean (± standard deviation) number of shift changes per person among individual officers over the entire study period (2004–2009) was higher among evening (51 ± 38) and day workers (33 ± 44) compared to night workers (26 ± 51). In the combined category of evening and night workers, a total of 148 officers (61%) spent ≥70% of their work time on their dominant, long-term shift (evening or night), 78 (32%) spent 50–69% of their total work time on their dominant, long-term shift, and 13 (5%) spent 44–49% of their total work time on their assigned shift. Among day workers 139 (74%) subjects spent ≥70% of their total work time on the day shift, 37 (20%) spent 50–69% of their total work time on the day shift, and 12 (6%) spent 36–49% of their time on that shift.
Table 1.
Demographic characteristics of study participants, BCOPS study, Buffalo, NY, USA, 2004–2005 (n = 430).
| Characteristics | Evening and Night Workers (n = 242) |
Day Workers (n = 188) |
||||||
|---|---|---|---|---|---|---|---|---|
| N | % | Mean | SD | N | % | Mean | SD | |
| Age (y) | 40 | 7.1 | 46 | 7.6 | ||||
| Body Mass Index (kg/m2) | 30 | 4.5 | 29 | 5.2 | ||||
| Gender | ||||||||
| Male | 209 | 86 | 111 | 59 | ||||
| Female | 33 | 14 | 77 | 30 | ||||
| Race | ||||||||
| White | 200 | 84 | 131 | 70 | ||||
| Nonwhite | 38 | 16 | 55 | 30 | ||||
| Marital Status | ||||||||
| Single | 27 | 11 | 24 | 13 | ||||
| Married | 179 | 75 | 140 | 75 | ||||
| Divorced | 34 | 14 | 24 | 13 | ||||
| Education (y) | ||||||||
| ≤12 | 26 | 11 | 24 | 13 | ||||
| College < 4 | 127 | 53 | 110 | 59 | ||||
| College ≥ 4 | 88 | 37 | 53 | 28 | ||||
| Rank | ||||||||
| Police Officer | 160 | 78 | 102 | 64 | ||||
| Sergeant/Lieutenant/Captain | 30 | 13 | 35 | 22 | ||||
| Detective/Executive/Other | 20 | 9 | 22 | 14 | ||||
| Years of police service (y) | ||||||||
| 0–9 | 81 | 34 | 24 | 13 | ||||
| 10–14 | 64 | 27 | 25 | 13 | ||||
| 15–19 | 49 | 20 | 46 | 25 | ||||
| 20+ | 47 | 20 | 93 | 50 | ||||
| Income (USD, $) | ||||||||
| <70,000 | 54 | 23 | 48 | 27 | ||||
| 70,000 to 90,000 | 77 | 33 | 44 | 25 | ||||
| >90,000 | 104 | 44 | 84 | 48 | ||||
Percentages not totaling 100% are due to rounding or missing data. SD = standard deviation
For both the police-specific and general symptom models, LCAs that specified a 2-class model were optimal (Table S2). According to the Bootstrap Likelihood Ratio Test, the addition of a third latent class did not increase the model fit (police-specific model: 2 class vs. 3 class, p = .18; general symptom model: 2 class vs. 3 class, p = .22; Table S2). In the 2-class police-specific model, a group of officers (n = 73), relative to the group with more adapted characteristics (n = 169, Figure 1), was identified that was more likely to have moderate to high probabilities of the following symptoms: sleep disturbances (PSQI), sleep latencies >30 min (PSQI), less social support (SS), more perceived stress (PSS), and greater symptoms of fatigue (VE). Using the general symptom approach, the maladapted group (n = 56), relative to those with a more adapted profile (n = 186, Figure 2), was more likely to have moderate to high probabilities of the following symptom indicators: low social support (SS), elevated stress and depression scores, and greater fatigue. Officers classified as adapted tended to work the evening shift rather than the night shift, although the differences were not statistically significant (police-specific: 57% vs. 43%, p = .37; general: 58% vs. 42%, p = .51, respectively).
Figure 1.
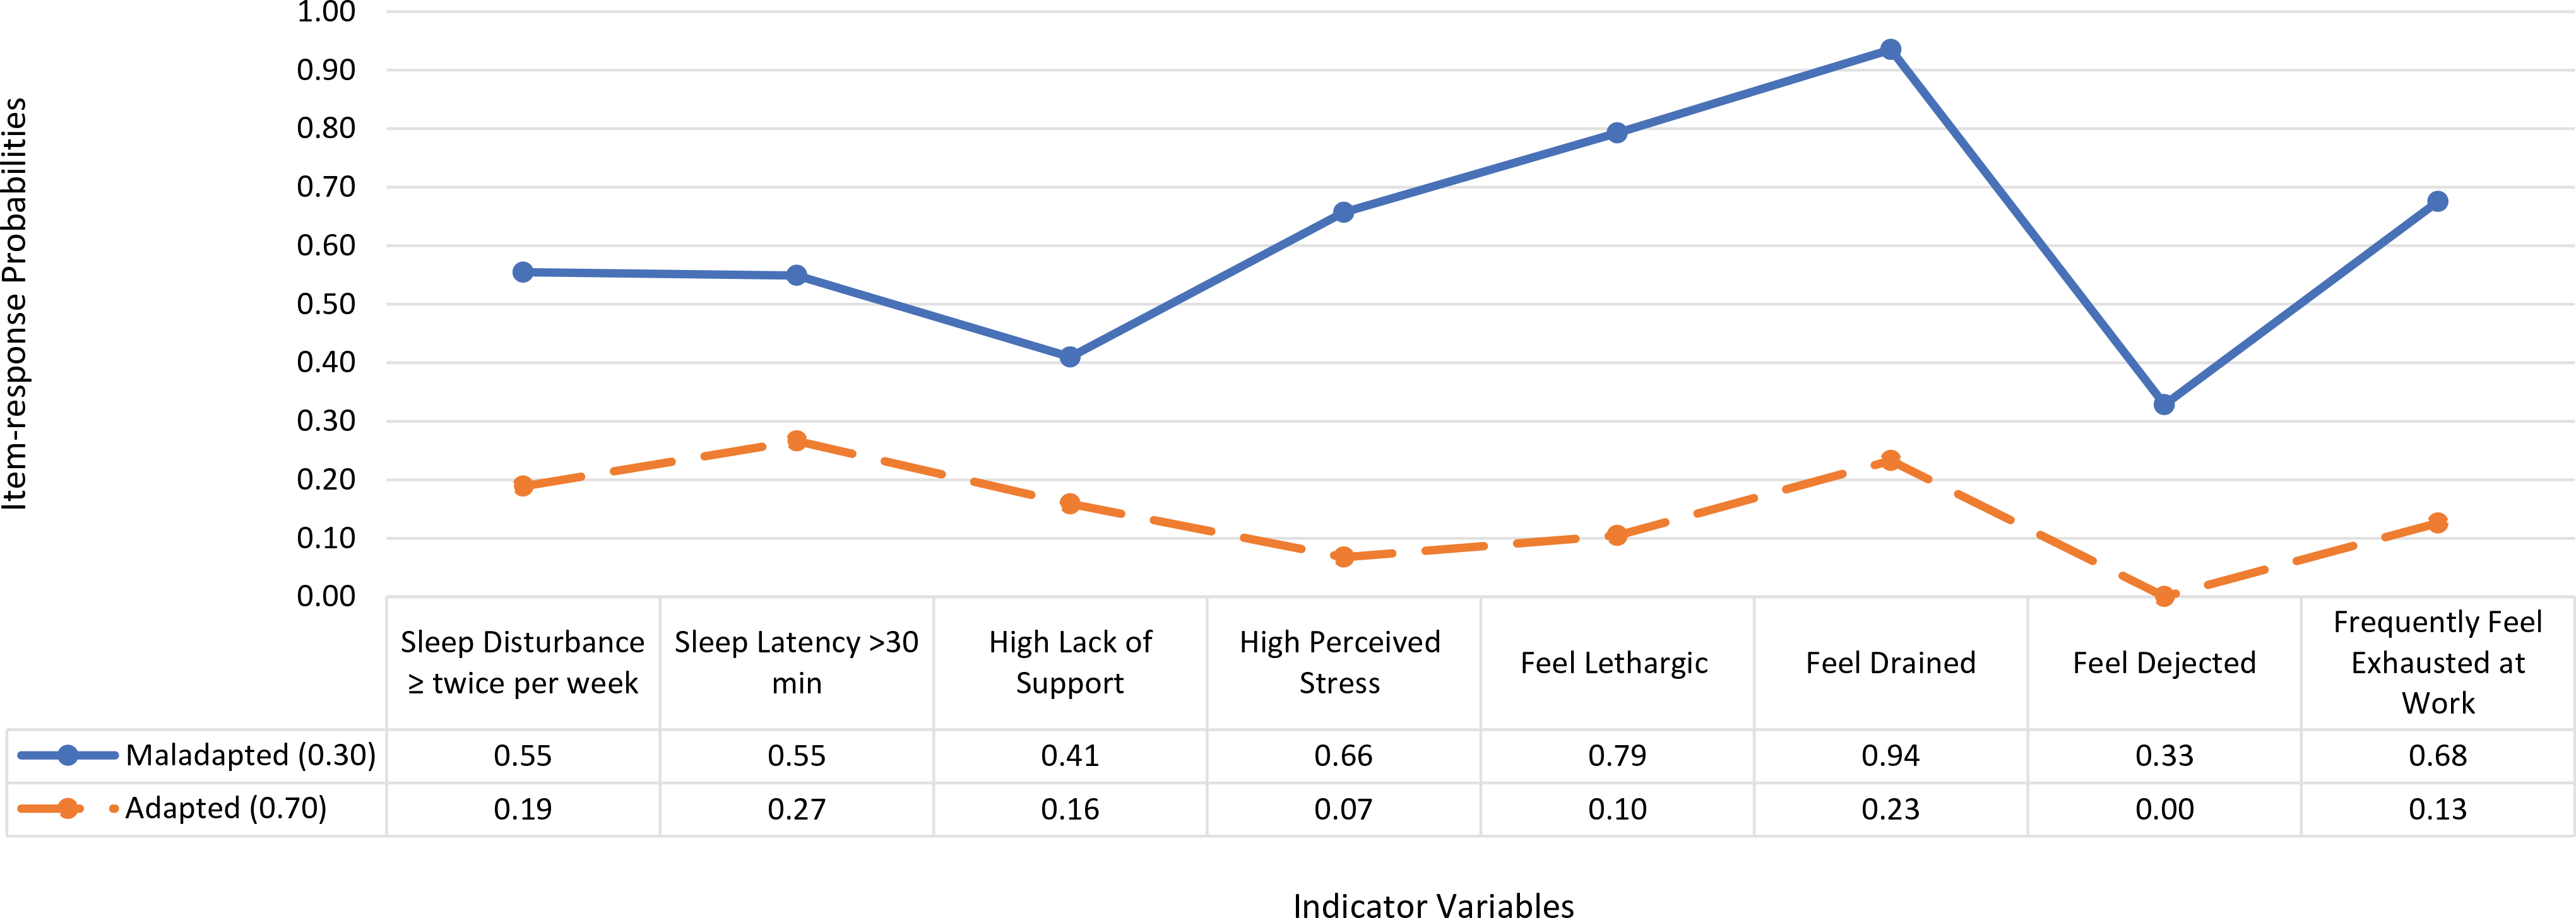
Prevalence of latent class membership and item-response probabilities among the symptom indicator variables evaluated for their contribution to adaptation or maladaptation among shiftworking police officers (Police-specific model), BCOPS study, Buffalo, NY, USA, 2004–2005 (n = 242)
The item-response probabilities represent the conditional probability that an officer would have a maladaptive response to an indicator variable. For example, the probability that an officer in the adapted shiftwork group reports sleep disturbance ≥twice per week is 0.19 and 0.55 for a maladapted officer. Indicator variables are components of the PSQI, SPPS, and VE questionnaires.
Figure 2.
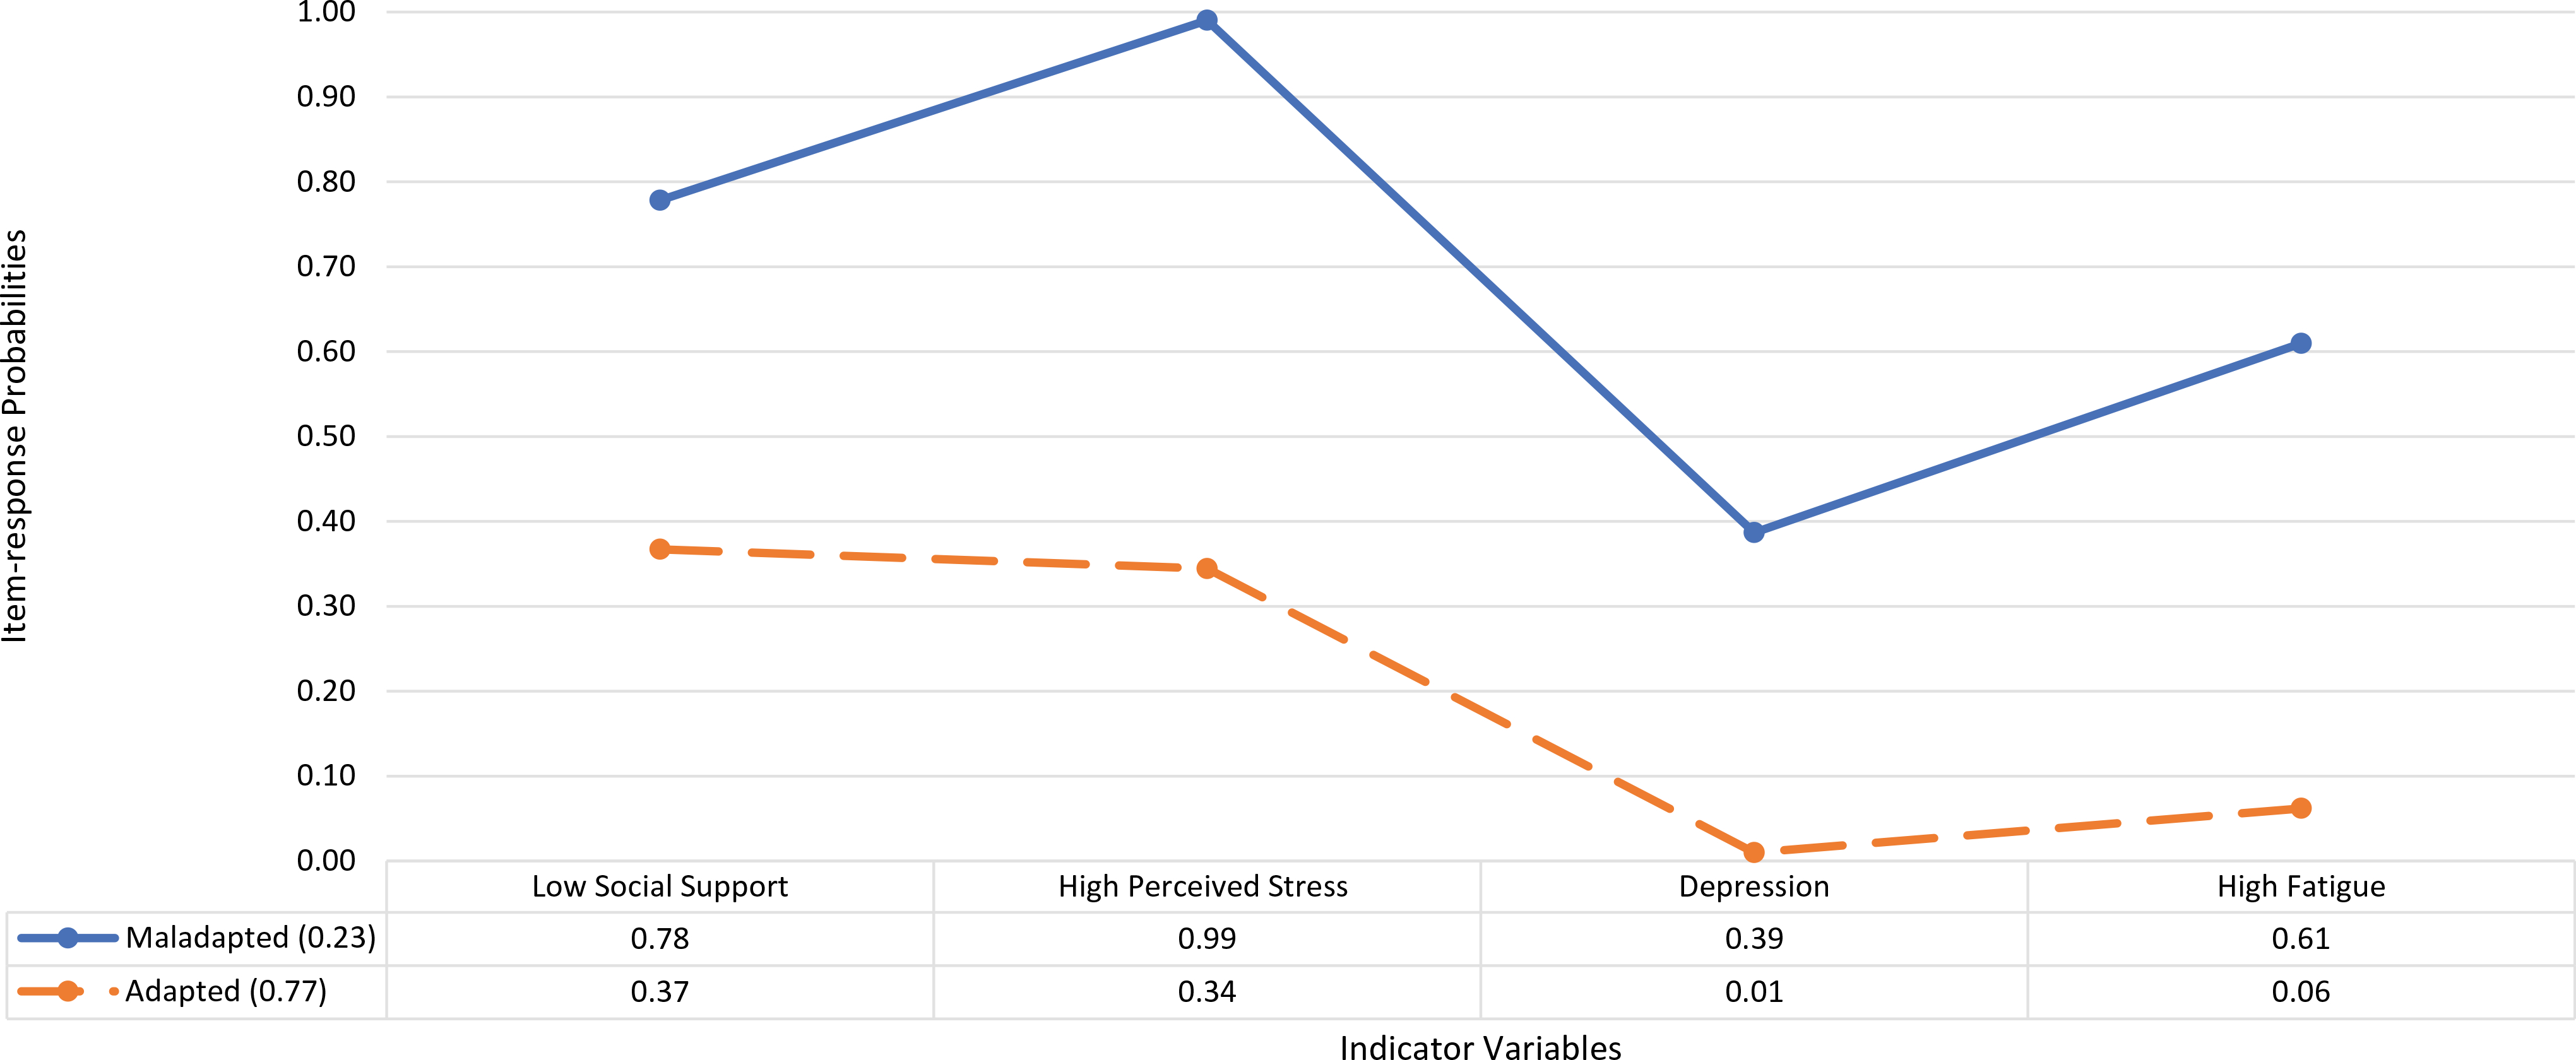
Prevalence of latent class membership and item-response probabilities among the symptom indicator variables evaluated for their contribution to adaptation or maladaptation among shiftworking police officers (General symptom model), BCOPS study, Buffalo, NY, USA, 2004–2005 (n = 242).
The item-response probabilities represent the conditional probability that an officer would have a maladaptive response to an indicator variable. For example, the probability that an officer in the adapted shiftwork group reports low social support is 0.37 and 0.78 for a maladapted officer. Indicator variables are components of SS, PSS, CESD, and VE questionnaires.
When group comparisons were conducted using the police-specific approach, there were no statistically significant differences in age, race, sex, income, or education between groups with shiftwork adaptation or maladaptation symptoms (Tables 2 and Table 3). There were differences in dietary factors; specifically, fruit and vegetable consumption was greater in the adapted group (Table 3). As expected, those in the adapted shiftwork group had higher mean scores for extraversion, agreeableness, conscientiousness, hardiness, family independence, active-recreational orientation, and family organization compared to those in the maladapted group for both the police-specific and general symptoms approaches (Table 4). In addition, those with symptoms consistent with shiftwork adaptation had lower levels of neuroticism and family conflict. In contrast, there were no differences in openness, family control, or the number of children between the two groups in both the police-specific and general-symptom approaches (Table 4). Using the general symptom approach, those in the adapted shiftworker group were more likely to be male, married (Table 2), and have greater vegetable and fruit consumption (Table 3).
Table 2.
Factors associated with shiftwork adaptation, BCOPS study, Buffalo, NY, USA, 2004–2005 (n = 242).
| Police-specific Model |
General Symptom Model |
|||||||||||||
|---|---|---|---|---|---|---|---|---|---|---|---|---|---|---|
| Adapted (n = 169) |
Maladapted (n = 73) |
Adapted (n = 186) |
Maladapted (n = 56) |
|||||||||||
| Characteristics | % | Mean | SD | % | Mean | SD | p-value | % | Mean | SD | % | Mean | SD | p-value |
| Age (y) | 40.6 | 7.4 | 38.8 | 5.9 | .05 | 40.3 | 7.3 | 39.3 | 6.1 | .35 | ||||
| Body Mass Index (kg/m2) | 30.0 | 4.3 | 29.2 | 4.7 | .20 | 30.2 | 4.5 | 28.1 | 4.1 | <.01 | ||||
| Body Mass Index Group | ||||||||||||||
| ≤25 | 11.2 | 16.4 | .46 | 10.2 | 21.4 | .02 | ||||||||
| 26–30 | 42.6 | 43.8 | 41.4 | 48.2 | ||||||||||
| >30 | 46.2 | 39.8 | 48.4 | 30.4 | ||||||||||
| Race | ||||||||||||||
| White | 82.6 | 87.3 | .37 | 82.7 | 88.7 | .30 | ||||||||
| Nonwhite | 17.4 | 12.7 | 17.3 | 11.3 | ||||||||||
| Sex | ||||||||||||||
| Male | 88.2 | 82.2 | .22 | 89.8 | 75.0 | <.01 | ||||||||
| Female | 11.8 | 17.8 | 10.2 | 25.0 | ||||||||||
| Marital Status | ||||||||||||||
| Single | 8.3 | 18.1 | .06 | 8.7 | 19.6 | .04 | ||||||||
| Married | 78.6 | 65.3 | 78.3 | 62.5 | ||||||||||
| Divorced | 13.1 | 16.7 | 13.0 | 17.9 | ||||||||||
| Income (USD, $) | ||||||||||||||
| <70,000 | 22.8 | 23.3 | 1.00 | 22.4 | 25.0 | .50 | ||||||||
| 70,000 to 90,000 | 32.7 | 32.9 | 31.3 | 37.5 | ||||||||||
| >90,000 | 44.4 | 43.8 | 46.4 | 37.5 | ||||||||||
Each characteristic was analyzed as a separate univariate model.
Table 3.
Factors associated with shiftwork adaptation, BCOPS study, Buffalo, NY, USA, 2004–2005 (n = 242).
| Police-specific Model |
General Symptom Model |
|||||
|---|---|---|---|---|---|---|
| Adapted (n = 169) |
Maladapted (n = 73) |
Adapted (n = 186) |
Maladapted (n = 56) |
|||
| Characteristics | % | % | p-value | % | % | p-value |
| Police of Service (y) | ||||||
| 0–9 | 33.9 | 32.9 | .33 | 33.5 | 33.9 | .12 |
| 10–14 | 28.0 | 23.3 | 29.2 | 17.9 | ||
| 15–19 | 17.3 | 27.4 | 17.3 | 30.4 | ||
| 20+ | 20.8 | 16.4 | 20.0 | 17.9 | ||
| Rank | ||||||
| Police Officer | 79.4 | 75.7 | .73 | 80.7 | 70.4 | .25 |
| Sergeant/Lieutenant/Captain | 11.9 | 15.7 | 11.9 | 16.7 | ||
| Detective/Executive/Other | 8.6 | 8.6 | 7.4 | 13.0 | ||
| Work Activity | ||||||
| High | 31.0 | 63.0 | .70 | 36.1 | 28.6 | .30 |
| Low-Moderate | 69.1 | 37.0 | 63.9 | 71.4 | ||
| Education (y) | ||||||
| ≤12 | 10.7 | 11.0 | .89 | 11.4 | 8.9 | .88 |
| College < 4 | 51.8 | 54.8 | 52.4 | 53.6 | ||
| College ≥4 | 37.5 | 35.3 | 36.2 | 37.5 | ||
| Tobacco Use | ||||||
| Never | 53.9 | 50.7 | .52 | 54.4 | 48.2 | .27 |
| Former | 17.4 | 13.7 | 17.4 | 12.5 | ||
| Current | 28.7 | 35.6 | 28.3 | 39.3 | ||
| Servings of food cooked in fat/d | ||||||
| High (Quartile 4) | 27.8 | 38.4 | .11 | 72.0 | 58.9 | .06 |
| Low (Quartile 1–3) | 72.2 | 61.6 | 28.0 | 41.1 | ||
| Servings of vegetables/d | ||||||
| High (Quartile 4) | 69.8 | 50.7 | <.01 | 67.7 | 51.8 | .03 |
| Low (Quartile 1–3) | 30.2 | 49.3 | 32.3 | 48.2 | ||
| Servings of fruit/d | ||||||
| High (Quartile 4) | 89.4 | 75.3 | <.01 | 88.7 | 73.2 | <.01 |
| Low (Quartile 1–3) | 10.6 | 24.0 | 11.3 | 26.8 | ||
| Global Sleep Quality Score (PSQI) | ||||||
| Poor | 31.0 | 63.0 | <.01 | 30.8 | 73.2 | <.01 |
| Good | 69.1 | 37.0 | 69.2 | 26.8 | ||
Each characteristic was analyzed as a separate univariate model.
Table 4.
Factors associated with shiftwork adaptation, BCOPS study, Buffalo, NY, USA, 2004–2005 (n = 242).
| Police-specific Model |
General Symptom Model |
|||||||||
|---|---|---|---|---|---|---|---|---|---|---|
| Adapted (n = 169) |
Maladapted (n = 73) |
Adapted (n = 186) |
Maladapted (n = 56) |
|||||||
| Characteristic | Mean | SD | Mean | SD | p-value | Mean | SD | Mean | SD | p-value |
| Neuroticisma | 12.4 | 5.0 | 19.6 | 7.7 | <.01 | 12.6 | 5.2 | 21.0 | 7.5 | <.01 |
| Extraversiona | 30.1 | 5.6 | 26.8 | 6.0 | <.01 | 30.0 | 5.4 | 26.3 | 6.6 | <.01 |
| Opennessa | 23.5 | 5.4 | 23.2 | 4.7 | .74 | 23.4 | 5.3 | 23.4 | 4.8 | .98 |
| Agreeablenessa | 31.6 | 5.0 | 29.2 | 5.2 | <.01 | 31.6 | 4.8 | 28.3 | 5.6 | <.01 |
| Conscientiousnessa | 34.1 | 5.4 | 30.1 | 7.0 | <.001 | 33.8 | 5.6 | 29.7 | 7.2 | <.01 |
| Hardinessa | 29.3 | 4.3 | 24.9 | 5.4 | <.01 | 28.9 | 4.5 | 24.8 | 5.5 | <.01 |
| Family Conflict (FES)b | 2.2 | 1.9 | 3.3 | 2.4 | <.01 | 2.4 | 2.0 | 3.1 | 2.2 | .03 |
| Family Independence (FES)b | 7.0 | 1.4 | 6.4 | 1.4 | <.01 | 6.4 | 1.1 | 3.1 | 2.2 | .05 |
| Active-Recreational Orientationb | 6.2 | 1.9 | 5.4 | 2.1 | <.01 | 6.1 | 1.9 | 5.3 | 2.2 | .01 |
| Familial Organization (FES)b | 6.6 | 2.0 | 5.2 | 2.4 | <.01 | 6.6 | 2.0 | 4.9 | 2.2 | <.01 |
| Familial Control (FES)b | 5.0 | 1.9 | 5.2 | 2.1 | .69 | 5.1 | 1.9 | 5.0 | 2.2 | .64 |
| Number of Children | 2.5 | 1.2 | 2.9 | 1.5 | 16 | 2.6 | 1.2 | 2.9 | 1.5 | .18 |
| Global Sleep Quality Score (PSQI) | 5.7 | 2.9 | 8.6 | 2.7 | <0.01 | 5.9 | 2.9 | 5.0 | 2.2 | <.01 |
Higher scores represent more extraversion, agreeableness, openness, conscientiousness, or hardiness.
Higher scores correspond to more family independence, active-recreational orientation, conflict, control, or organization. Each characteristic was analyzed as a separate univariate model. SD = standard deviation, FES = Family Environment Scale, PSQI = Pittsburgh Sleep Quality Index.
Multivariable logistic regression was used in a combined analysis to identify which variables were independently associated with membership in the adapted shiftworker group. Using the police-specific approach, high vegetable consumption (odds ratio [OR]: 2.57; 95% confidence interval [CI]: 1.10–5.98) and hardiness (OR: 1.13; 95% CI: 1.03–1.25) were positively associated with adaptation to shiftwork, whereas neuroticism (OR: 0.85; 95% CI: 0.79–0.92) and family conflict (OR: 0.73; 95% CI: 0.60–0.88) were less likely to be associated with adaptation (Table 5). In the general symptom model, neuroticism (OR: 0.85; 95% CI: 0.80–0.90) and poor sleep (OR: 0.74; 95% CI: 0.65–0.84) were associated with maladaptation (Table 5). Results of the AUC ROC analyses of the final models obtained using either the police-specific (AUC: 0.84, 95% CI: 0.78–0.89, Figure S1) or general symptom approaches (AUC = 0.85, 95% CI = 0.79–0.91, Figure S2) both exhibited excellent predictive capabilities.
Table 5.
Factors associated with shiftwork adaptation – multivariable analysis, BCOPS study, Buffalo, NY, USA, 2004–2005 (n = 242)*.
| Characteristics | Odds Ratio | 95% CI | p-value |
|---|---|---|---|
| Police-specific Model | |||
| Servings of vegetables/d | |||
| High | 2.57 | 1.10–5.98 | .03 |
| Low | Referent | ||
| Neuroticisma | 0.85 | 0.79–0.92 | <.01 |
| Hardinessa | 1.13 | 1.03–1.25 | .01 |
| Family Conflictb | 0.73 | 0.60–0.88 | <.01 |
| General Symptom Model Neuroticisma | 0.85 | 0.80–0.90 | <.01 |
| Global Sleep Quality Score (PSQI)c | 0.74 | 0.65–0.84 | <.01 |
The outcome being modeled is the odds of being adapted to shiftwork. For continuous variables, the odds ratio represents a one-unit change in the predictor variable. For example, the odds of being adapted to shiftwork increased by 13% with a one-unit increase in hardiness. Reference Group: Maladapted officers. CI = Confidence Interval. PSQI = Pittsburgh Sleep Quality Inventory.
Higher scores represent more extraversion, agreeableness, openness, conscientiousness, or hardiness.
Higher scores correspond to more family conflict.
Higher scores correspond to worse sleep quality.
When inflammatory biomarkers were compared among the groups in the police-specific approach, officers who worked day shifts generally had inflammatory cytokine concentrations that were similar to the adapted group (Table 6). Mean IL-6 concentrations were lower among day workers (0.5 ± 0.1 ln[pg/ml], range: −0.78–2.48 ln[pg/ml]) relative to those of the maladapted group (0.8 ± 0.1 ln[pg/ml], range: −0.59–2.48 ln[pg/ml], p < .01), but there were no notable differences between the adapted and maladapted groups (Table 6, police-specific model). There were no statistically significant differences in the other inflammatory biomarkers utilizing the police-specific approach.
Table 6.
Inflammation measuresa by shiftwork adaptation group, BCOPS study, 2004–2005 (n = 430).
| Inflammatory Cytokines | Police-specific Model |
||||||||
| Adapted (n = 169) |
Maladapted (n = 73) |
Day Shift (n = 188) |
p-valueb |
||||||
| Mean | SE | Mean | SE | Mean | SE | A vs. M | A vs. D | M vs. D | |
| C-Reactive Protein ln(mg/l)1 | 0.7 | 0.1 | 0.7 | 0.1 | 0.6 | 0.1 | .98 | .19 | .32 |
| Interleukin-6 ln(pg/ml)2 | 0.7 | 0.1 | 0.8 | 0.1 | 0.5 | 0.1 | .09 | .02 | <.01 |
| Tumor Necrosis Factor-α (pg/ml)3 | 4. 9 | 0.2 | 5.3 | 0.3 | 4.9 | 0.2 | .16 | .93 | .17 |
| Fibrinogen (mg/dl)4 | 318 | 5.5 | 309 | 8.4 | 312 | 5.4 | .34 | .42 | .76 |
| General Symptom Model |
|||||||||
| Adapted (n = 186) |
Maladapted (n = 56) |
Day Shift (n = 188) |
p-valueb |
||||||
| Inflammatory Cytokines | Mean | SE | Mean | SE | Mean | SE | A vs. M | A vs. D | M vs. D |
| C-Reactive Protein ln(mg/l)1 | 0.7 | 0.1 | 0.7 | 0.1 | 0.6 | 0.1 | .69 | .15 | .50 |
| Interleukin-6 ln(pg/ml)5 | 0.7 | 0.1 | 0.7 | 0.1 | 0.5 | 0.1 | .86 | .01 | .03 |
| Tumor Necrosis Factor-α (pg/ml)6 | 4.8 | 0.2 | 5.6 | 0.3 | 5.0 | 0.2 | <.01 | .37 | .04 |
| Fibrinogen (mg/dl)7 | 325 | 6.9 | 320 | 10.4 | 318 | 6.3 | .65 | .41 | .89 |
Least squares mean ± standard error of the mean.
Model adjusted for age, gender, BMI, and marital status.
Model adjusted for age, sex, BMI, and alcohol.
Model adjusted for age, gender, race, and BMI.
Model adjusted for age.
Model adjusted for age, gender, BMI, and alcohol.
Model adjusted for gender, race, BMI, and tobacco.
Model adjusted for age, race, BMI, and marital status.
p-values for comparisons between shiftwork categories. Data for fibrinogen and TNF-α were not log-transformed because values were normally distributed. Abbreviations: A: Adapted, D: Day Shift, M: Maladapted. ln = natural logarithm. BMI = body mass index (kg/m2).
In the general symptom model, mean IL-6 concentrations among day workers (0.5 ± 0.1 ln[pg/ml]) were lower than those among maladapted officers (0.7 ± 0.1 ln[pg/ml], range: −0.59–2.48 ln[pg/ml], p = .03). TNF-α concentrations in both the adapted (4.8 ± 0.2 pg/ml, range: 0.53–11.39 pg/ml), and day shift (5.0 ± 0.2 mg/ml, range: 1.1–12.7 pg/ml) groups were lower than those of the maladapted group (5.6 ± 0.3 pg/ml, range: 1.5–16.5 pg/ml, p < .01, p = .04, respectively, Table 6). There were no statistically significant differences in the other inflammatory biomarkers.
When evaluating metabolic biomarkers in the police-specific approach, officers in the adapted group had lower diastolic blood pressure (77.5 ± 1.0 mmHg) than the maladapted group (80.3 ± 1.3 mmHg, p = .05). Both the adapted (9.4 ± 0.1 ln[pg/ml]) and day shift (9.4 ± 0.1 ln[pg/ml]) groups had lower levels of leptin than the maladapted group (9.6 ± 0.1 ln[pg/ml], p < .01, p = .03, Table 7).
Table 7.
Cardiometabolic measuresa by shiftwork adaptation group, BCOPS study, 2004–2005 (n = 430).
| Police pecific Model |
|||||||||
| Adapted (n = 169) |
Maladapted (n = 73) |
Day shift (n = 188) |
p-value |
||||||
| Cardiometabolic Measure | Mean | SE | Mean | SE | Mean | SE | A vs. M | A vs. D | M vs. D |
| High Density Lipoprotein (mg/dl)1 | 50.8 | 1.3 | 49.0 | 1.6 | 50.0 | 1.1 | .33 | .68 | .58 |
| Low Density Lipoprotein (mg/dl)2 | 126 | 2.9 | 132 | 4.2 | 123 | 3.0 | .25 | .41 | .07 |
| Triglycerides ln(mg/dl)3 | 4.4 | 0.1 | 4.5 | 0.1 | 4.5 | 0.1 | .14 | .40 | .42 |
| Glucose (mg/dl)4 | 90.9 | 1.1 | 90.9 | 1.4 | 91.3 | 0.9 | .99 | .77 | .83 |
| Systolic Blood Pressure (mmHg)5 | 123 | 1.0 | 124 | 2.0 | 121 | 1.0 | .64 | .16 | .13 |
| Diastolic Blood Pressure (mmHg)6 | 77.5 | 1.0 | 80.3 | 1.3 | 77.6 | 0.8 | .05 | .97 | .07 |
| Waist Circumference (cm)7 | 90.8 | 1.4 | 90.6 | 1.6 | 91.0 | 1.4 | .89 | .92 | .84 |
| HbA1C (%)8 | 5.6 | 0.04 | 5.6 | 0.1 | 5.7 | 0.04 | .83 | .31 | .33 |
| Insulin ln(uu/ml)9 | 1.8 | 0.1 | 2.0 | 0.1 | 1.9 | 0.1 | .09 | .33 | .36 |
| Adiponectin (ng/ml)10 | 14,142 | 653 | 13,654 | 848 | 14,006 | 550 | .57 | .85 | .71 |
| Leptin ln(pg/ml)11 | 9.4 | 0.1 | 9.6 | 0.1 | 9.4 | 0.1 | <.01 | .36 | .03 |
| Metabolic Syndrome Components12 | 1.4 | 0.1 | 1.5 | 0.1 | 1.6 | 0.1 | .53 | .29 | .84 |
| General Symptom Model |
|||||||||
| Adapted (n = 186) |
Maladapted (n = 56) |
Day shift (n = 188) |
p-value |
||||||
| Cardiometabolic Measure | Mean | SE | Mean | SE | Mean | SE | A vs. M | A vs. D | M vs. D |
| High Density Lipoprotein (mg/dl)1 | 51.0 | 1.2 | 48.1 | 1.8 | 50.1 | 1.1 | .13 | .49 | .31 |
| Low Density Lipoprotein (mg/dl)2 | 127 | 3.0 | 129 | 5.0 | 123 | 3.0 | .80 | .22 | .28 |
| Triglycerides ln(mg/dl)3 | 4.4 | 0.1 | 4.6 | 0.1 | 4.5 | 0.1 | .08 | .38 | .27 |
| Glucose (mg/dl13 | 90.1 | 1.0 | 92.8 | 1.7 | 90.7 | 0.9 | .10 | .62 | .22 |
| Systolic Blood Pressure (mmHg)5 | 123 | 1.0 | 124 | 2.0 | 121 | 1.0 | .66 | .15 | .16 |
| Diastolic Blood Pressure (mmHg)6 | 77.7 | 1.0 | 80.2 | 1.4 | 77.6 | 0.9 | .11 | .92 | .11 |
| Waist Circumference (cm)7 | 91.7 | 1.4 | 88.8 | 1.8 | 91.2 | 1.3 | .11 | .73 | .21 |
| HbA1C (%)8 | 5.6 | 0.04 | 5.6 | 0.1 | 5.7 | 0.04 | .92 | .23 | .47 |
| Insulin ln(uu/ml)14 | 1.8 | 0.1 | 2.0 | 0.1 | 1.9 | 0.1 | .03 | .29 | .17 |
| Adiponectin (ng/ml)10 | 14,188 | 644 | 13,423 | 929 | 14,006 | 549 | .42 | .81 | .57 |
| Leptin ln(pg/ml)11 | 9.4 | 0.1 | 9.5 | 0.1 | 9.4 | 0.1 | .15 | .72 | .23 |
| Metabolic Syndrome Components12 | 1.4 | 0.1 | 1.7 | 0.2 | 1.6 | 0.1 | .12 | .17 | .56 |
Least squares mean ± standard error of the mean.
Model adjusted for gender, alcohol, physical activity, marital status, and BMI.
Model adjusted for race, physical, activity, and BMI.
Model adjusted for gender, race, and BMI.
Model adjusted for age, gender, BMI, Tobacco, and education.
Model adjusted for age, race, alcohol, and BMI.
Model adjusted for age, gender, BMI, and marital status.
Model adjusted for age, gender, alcohol, antidepressants, tobacco, and marital status.
Model adjusted for age, race, and BMI.
Model adjusted for sex, tobacco, and BMI.
Model adjusted for age, gender, race, marital status, and BMI.
Model adjusted for gender, race BMI, and tobacco.
Model adjusted for gender, BMI, and antidepressants.
Model adjusted for age, gender, BMI, and education.
Model adjusted for gender, BMI, and antidepressants.
Using the general symptom approach, mean concentrations of insulin in the adapted group (1.8 ± 0.1 ln[uu/ml]) were lower than those of the maladapted group (2.0 ± 0.1 ln [uu/ml], p = .03, Table 7). Mean concentrations of triglycerides were also lower in the adapted group (4.4 ± 0.1 ln [uu/ml]) compared to the maladapted group (4.6 ± 0.1 ln [uu/ml], p = .08, Table 7), although the difference was not statistically significant. There were no statistically significant differences in the other cardiometabolic or HRV measures among the adapted, day shift, and maladapted groups of police officers (Table 7 and S3).
Discussion
This study used cluster analysis (LCA) in a novel way to identify groups of adapted or maladapted shiftworking police officers of the BCOPS study. Two approaches were applied, one with police-specific symptoms and another using more general symptoms as shiftwork adaptation indicators. In the police-specific model, adapted (~70%) and maladapted (~30%) shiftworkers were characterized by eight symptom indicators that assessed sleep disturbance, perceived stress, exhaustion, and low social support (Figure 1). Several of the hypothesized lifestyle or personality characteristics were independently associated with shiftwork adaptation, including diet (vegetable servings/day), hardiness, low neuroticism, and less family conflict (Table 5). Using the general symptom approach, the adapted (~77%) and maladapted (~23%) groups were characterized by symptom indicators that assessed social support, perceived stress, exhaustion, and depression (Figure 2; note that sleep was not included as a symptom indicator in the general model). Shiftwork adaptation was independently associated with less neuroticism and better sleep quality (Table 5). These findings are consistent with previous studies that identified associations between shiftwork adaptation and personality traits, sleep, and diet (Costa 1996; Grant et al. 2017; Harma 1993; Jung et al. 2020; Saksvik et al. 2011; Saksvik-Lehouillier et al. 2013; Souza et al. 2019; Tamagawa et al. 2007). In the police-specific model, maladapted officers had higher levels of IL-6 and leptin relative to comparison officers. In the general symptom model, maladapted officers had higher levels of TNF-α and insulin relative to comparison officers. No other hypothesized differences in measures of inflammation, HRV, or cardiometabolic risk were noted between the maladapted and comparison groups using either approach.
Shiftwork forces rearrangement of sleep/wake timing, leading to dysregulation of circadian rhythms and its associated physiological, psychological, and social impacts (Rivera et al. 2020; Walker et al. 2020). The central role of age, gender, circadian misalignment, sleep, positive and negative moods, and personality in shiftwork adaptation have been characterized in several studies; however, these studies varied in methods, study population, and characterization of shiftwork adaptation, leading to some inconsistencies (Harma 1993; Nachreiner 1998; Saksvik et al. 2011; Tamagawa et al. 2007). A systematic review of shiftwork tolerance reported that females relative to male shiftworkers tend to have more sleep problems, fatigue, disability, coping issues, and metabolic dysregulation (Saksvik et al. 2011). In a study among nurses, shiftwork adaptation was facilitated by a sense of well-being and good physical health (Saksvik-Lehouillier et al. 2015). In the current analysis, the identified adaptation traits of low neuroticism, high extraversion, positive affect, and better familial interactions are consistent with previous studies (McLaughlin et al. 2008; Parkes 2002; Tamagawa et al. 2007). Maladapted workers of the current study tended to be younger (police-specific model), whereas younger age has been previously associated with shiftwork adaptation (Costa and Di Milia 2008). However, adaptation among older workers also has been reported, which may reflect more job satisfaction, greater seniority, more decision latitude, or a survivor effect (Burch et al. 2009). The adapted group also tended to have more family independence and organization, and less family conflict, which could be attributed to the adapted group being slightly older, or to self-selection out of shiftwork due to difficulties with work-family balance (Arlinghaus et al. 2019; Costa 2016).
Associations between shiftwork and biomarkers of disease risk have been reported, although the exact mechanisms remain to be elucidated (Canuto et al. 2013; Depner et al. 2014; James et al. 2017; Puttonen et al. 2011; Ulhoa et al. 2015). In the current study, officers adapted to shiftwork were hypothesized to have different levels of inflammation, HRV, or cardiometabolic risk factors relative to maladapted officers. Shiftwork maladaptation is stressful, and pro-inflammatory effects of stress have been described (Chovatiya and Medzhitov 2014; Irwin et al. 2016; Siegrist and Li 2017). In one previous study, mean levels of TNF-α and IL-6 were higher among shiftworkers compared to day workers (Crispim et al. 2012). In a 2007 study, rotating shiftwork was associated with elevated leukocyte counts, another marker of systemic inflammation, as well as metabolic syndrome (Sookoian et al. 2007). Elevated levels of CRP, TNF-α, and IL-6 have been associated with adverse health outcomes, such as metabolic syndrome, CVD, and diabetes (Arican et al. 2005; Blake and Ridker 2002; Crispim et al. 2012; Gabay 2006; Puttonen et al. 2011; Srikanthan et al. 2016). CRP has a benchmark value that is associated with increased risk of CVD mortality (≥3.0 mg/l) (Ridker et al. 2003; Wang et al. 2017). However, in the current study, both adapted and maladapted groups had mean CRP levels below this threshold. In contrast, differences in mean TNF-α, and IL-6 levels were observed between the adapted and maladapted groups. Although statistically significant, some of the differences between mean values were relatively small. However, note that log-transformed values were used for some biomarker comparisons (e.g., IL-6, leptin, insulin). It is unclear whether the changes in biomarkers observed in this study are biologically relevant or if they result from normal physiological variation. The results are consistent with some previous studies and extend those observations specifically to maladapted shiftworkers.
Mean levels of LDL, triglycerides, systolic and diastolic blood pressure, insulin, and leptin among maladapted officers in the present study tended to be present at less favorable levels than those observed among adapted and day shift workers; with statistically significant differences observed only for leptin and insulin. Whether this is suggestive of insulin or leptin resistance or another adverse health impact is uncertain. Leptin is expressed in adipose tissue and plays a central role in food intake, energy balance, and upregulation of inflammatory markers involved with obesity-related diseases, such as CVD (Ble et al. 2005; Hasan-Ali et al. 2011; Liu et al. 2010; Vadacca et al. 2011). Circadian misalignment, a component of shiftwork maladaptation, may alter leptin concentrations, leading to leptin resistance (Ding et al. 2018; Monti et al. 2006; Scheer et al. 2009). Other evidence suggests that chronic shiftwork is associated with the development of obesity and insulin resistance (Knutsson and Kempe 2014; Liu et al. 2018; Sun et al. 2018).
The limitations of this study include its relatively modest sample size, the potential for healthy-worker or survivor bias, and lack of a direct question or instrument examining shiftwork adaptation. The average time in service for officers in the present study was 13.9 y, and officers who might have been intolerant (unable to adapt) of shiftwork may have left police service altogether or changed to the day shift. The relatively long average duration of police service may provide some reassurance that there was ample time for adaptation to develop among officers in the study. It is unknown whether officers who left service early were less healthy than the officers included in this analysis, but, if so, this likely attenuated some of the study results, particularly concerning the biomarker comparisons. There may have been some residual misclassification of shift assignment; however, assessment of previous work history and workers’ hours in this analysis indicated that such misclassification was likely minimal (Weder et al. 2014). Most officers classified to either the night, evening, or day shifts spent over 70% of their cumulative work time on their assigned shift, suggesting that the dominant, long term shift was assigned appropriately. Differences observed in the mean number of shift changes between those working nights, evenings, or day may have attenuated differences in biomarkers between adapted and maladapted workers. The biological variables were measured only once (morning hours) during a 24 h period, and some of these outcome measures exhibit circadian variation. The inability to evaluate whether changes in the circadian timing of the biomarkers was related to shiftwork adaptation thus represents a study limitation. Another limitation was that certain factors known to be associated with shiftwork adaptation, such as circadian preference (or chronotype) and certain genetic polymorphisms, were unavailable for this analysis. Eveningness is an adaptive trait, and morningness is related to shiftwork maladaptation (Burch et al. 2009; Saksvik et al. 2011). Finally, the symptoms were self-reported measures collected cross-sectionally and thus susceptible to temporal variability.
Strengths of this study include the incorporation of quantitative physiological and biochemical measures, which were performed in a clinical setting by trained personnel using standardized and validated procedures. The utilization of a validated latent class variable selection procedure allowed for the maximal separation of shiftworking police officers into groups with adapted and maladapted symptoms in the absence of a direct measure for this construct. Several traits identified as predictors of adaptation were consistent with previous research, which lends validity to the methods that were implemented. Variables selected via the LCA may be useful for defining shiftwork adaptation when a direct measure is unavailable. In some cases, a subscale score provided the most parsimonious classification strategy for defining shiftwork adaptation (e.g., sleep disturbance and sleep latency from PSQI; lack of support from SPPS; feeling lethargic, drained, dejected, and exhausted from work from VE). This may suggest that certain aspects of stress and fatigue may be more important to shiftwork adaptation than general symptomology. Analyses evaluating differences in inflammatory, autonomic, and cardiometabolic biomarkers included adjustment for important confounders such as age, race, gender, alcohol use, physical activity, BMI, tobacco consumption, and medication use. However, the possibility of residual confounding cannot be excluded. Analyses of area under the curve and goodness of fit for the predictive models of both the police-specific and general symptom approaches indicated that adequate discrimination between the adapted and maladapted groups was achieved (AUC ROC ≥0.84). Finally, although requiring validation, the results may be generalizable not only to police officers but also to other populations of shiftworkers, such as the military, emergency medical personnel, or fire fighters.
In summary, to the author’s knowledge, the current analysis was the first to compare biomarker levels among maladapted relative to adapted evening and night shiftworkers, or those working permanent days. The maladapted group exhibited higher mean levels of inflammatory cytokines, leptin, and insulin compared to the adapted or day shift groups, suggesting that these biomarkers may serve as early indicators of shiftwork-related chronic disease risks. However, the cross-sectional nature of the analysis precludes an interpretation of causal inference; prospective studies are needed to further evaluate that possibility.
Supplementary Material
Summary.
This study utilized pre-specified symptoms and latent class analysis to identify police officers with or without symptoms that characterize shiftwork adaptation. To the author’s knowledge, this is the first study to report higher levels of cardiometabolic or inflammation biomarkers in maladapted relative to comparison shiftworkers; however, the cross-sectional study design precludes an interpretation of cause and effect.
Acknowledgements
The work was performed at the University of South Carolina, Columbia, SC. The findings and conclusions expressed in this document are those of the author and do not reflect the official position of the National Institute for Occupational Safety and Health, Centers for Disease Control and Prevention, U.S. Army Medical Center of Excellence, U.S. Army Training and Doctrine Command, U.S. Army Medicine, Department of the Army, Department of Defense, or the U.S. Government. JBB, MW, and JMV were supported by a grant from the National Institute of Justice (2019-R2-CX-0021).
Funding
This work was supported by the National Institute of Justice [2019-R2-CX-0021].
Footnotes
Disclaimer
The views and information presented are those of the authors and do not represent the official position of the U.S. Army Medical Center of Excellence, U.S. Army Training and Doctrine Command, Department of the Army, Department of Defense, or the U.S. Government.
Supplemental data for this article can be accessed on the publisher’s website.
References
- Alterman T, Luckhaupt SE, Dahlhamer JM, Ward BW, Calvert GM. 2013. Prevalence rates of work organization characteristics among workers in the U.S.: data from the 2010 National Health Interview Survey. Am J Ind Med. 56 (6):647–659. doi: 10.1002/ajim.22108. [DOI] [PMC free article] [PubMed] [Google Scholar]
- Andlauer P, Reinberg A, Fourre L, Battle W, Duverneuil G. 1979. Amplitude of the oral temperature circadian rhythm and the tolerance to shift-work. J Physiol (Paris). 75 (5):507–512. [PubMed] [Google Scholar]
- Andrew ME, McCanlies EC, Burchfiel CM, Charles LE, Hartley TA, Fekedulegn D, Violanti JM. 2008. Hardiness and psychological distress in a cohort of police officers. Int J Emerg Ment Health. 10(2):137–147. [PubMed] [Google Scholar]
- Andrew ME, Shengqiao L, Wactawski-Wende J, Dorn JP, Mnatsakanova A, Charles LE, Fekedulegn D, Miller DB, Violanti JM, Burchfiel CM, et al. 2013. Adiposity, muscle, and physical activity: predictors of perturbations in heart rate variability. Am J Hum Biol. 25(3):370–377. doi: 10.1002/ajhb.22379. [DOI] [PubMed] [Google Scholar]
- Andrew ME, Violanti JM, Gu JK, Fekedulegn D, Li S, Hartley TA, Charles LE, Mnatsakanova A, Miller DB, Burchfiel CM. 2017. Police work stressors and cardiac vagal control. Am J Hum Biol. 29(5):e22996. doi: 10.1002/ajhb.22996. [DOI] [PMC free article] [PubMed] [Google Scholar]
- Appels A, Mulder P. 1988. Excess fatigue as a precursor of myocardial infarction. Eur Heart J. 9(7):758–764. doi: 10.1093/eurheartj/9.7.758. [DOI] [PubMed] [Google Scholar]
- Arendt J 2010. Shift work: coping with the biological clock. Occup Med (Lond). 60(1):10–20. doi: 10.1093/occmed/kqp162. [DOI] [PubMed] [Google Scholar]
- Arican O, Aral M, Sasmaz S, Ciragil P. 2005. Serum levels of TNF-alpha, IFN-gamma, IL-6, IL-8, IL-12, IL-17, and IL-18 in patients with active psoriasis and correlation with disease severity. Mediators Inflamm. 2005(5):273–279. doi: 10.1155/MI.2005.273. [DOI] [PMC free article] [PubMed] [Google Scholar]
- Arlinghaus A, Bohle P, Iskra-Golec I, Jansen N, Jay S, Rotenberg L. 2019. Working time society consensus statements: evidence-based effects of shift work and non-standard working hours on workers, family and community. Ind Health. 57(2):184–200. doi: 10.2486/indhealth.SW-4. [DOI] [PMC free article] [PubMed] [Google Scholar]
- Bartone PT. 2007. Test-retest reliability of the dispositional resilience scale-15, a brief hardiness scale. Psychol Rep. 101 (3 Pt 1):943–944. doi: 10.2466/pr0.101.3.943-944. [DOI] [PubMed] [Google Scholar]
- Blake GJ, Ridker PM. 2002. Inflammatory bio-markers and cardiovascular risk prediction. J Intern Med. 252 (4):283–294. doi: 10.1046/j.1365-2796.2002.01019.x. [DOI] [PubMed] [Google Scholar]
- Ble A, Windham BG, Bandinelli S, Taub DD, Volpato S, Bartali B, Tracy RP, Guralnik JM, Ferrucci L. 2005. Relation of plasma leptin to c-reactive protein in older adults (from the Invecchiare nel Chianti Study). Am J Cardiol. 96 (7):991–995. doi: 10.1016/j.amjcard.2005.05.058. [DOI] [PubMed] [Google Scholar]
- Boardman A, Schlindwein FS, Rocha AP, Leite A. 2002. A study on the optimum order of autoregressive models for heart rate variability. Physiol Meas. 23(2):325–336. doi: 10.1088/0967-3334/23/2/308. [DOI] [PubMed] [Google Scholar]
- Boudreau P, Dumont GA, Boivin DB, Bartell PA. 2013. Circadian adaptation to night shift work influences sleep, performance, mood and the autonomic modulation of the heart. PLoS One. 8 (7):e70813. doi: 10.1371/journal.pone.0070813. [DOI] [PMC free article] [PubMed] [Google Scholar]
- Burch JB, Tom J, Zhai Y, Criswell L, Leo E, Ogoussan K. 2009. Shiftwork impacts and adaptation among health care workers. Occup Med (Lond). 59(3):159–166. doi: 10.1093/occmed/kqp015. [DOI] [PubMed] [Google Scholar]
- Buysse DJ, Reynolds CF 3rd, Monk TH, Berman SR, Kupfer DJ. 1989. The Pittsburgh sleep quality index: a new instrument for psychiatric practice and research. Psychiatry Res. 28 (2):193–213. doi: 10.1016/0165-1781(89)90047-4. [DOI] [PubMed] [Google Scholar]
- Camm AJ, Malik M, Bigger JT, Breithardt G, Cerutti S, Cohen RJ, Coumel P, Fallen EL, Kennedy HL, Kleiger RE, et al. 1996. Heart rate variability. Standards of measurement, physiological interpretation, and clinical use. Circulation. 93(5):1043–1065. doi: 10.1161/01.Cir.93.5.1043. [DOI] [PubMed] [Google Scholar]
- Canuto R, Garcez AS, Olinto MT. 2013. Metabolic syndrome and shift work: a systematic review. Sleep Med Rev. 17 (6):425–431. doi: 10.1016/j.smrv.2012.10.004. [DOI] [PubMed] [Google Scholar]
- Caruso CC. 2014. Negative impacts of shiftwork and long work hours. Rehabil Nurs. 39(1):16–25. doi: 10.1002/rnj.107. [DOI] [PMC free article] [PubMed] [Google Scholar]
- Charalampous K, Kokkinos CM, Panayiotou G. 2013. The family environment scale: resolving psychometric problems through an examination of a Greek translation. Int J Edu Psychol Assess. 13:81–99. [Google Scholar]
- Chovatiya R, Medzhitov R. 2014. Stress, inflammation, and defense of homeostasis. Mol Cell. 54(2):281–288. doi: 10.1016/j.molcel.2014.03.030. [DOI] [PMC free article] [PubMed] [Google Scholar]
- Cohen S, Kamarck T, Mermelstein R. 1983. A global measure of perceived stress. J Health Soc Behav. 24(4):385–396. doi: 10.2307/2136404. [DOI] [PubMed] [Google Scholar]
- Costa G 1996. The impact of shift and night work on health. Appl Ergon. 27(1):9–16. doi: 10.1016/0003-6870(95)00047-x. [DOI] [PubMed] [Google Scholar]
- Costa G 2016. Introduction to problems of shift work. In: Iskra-Golec I, Barnes-Farrell J, Bohle P, editors. Social and family issues in shift work and non standard working hours. Switzerland: Springer International Publishing. Chapter 2, p. 19–35. [Google Scholar]
- Costa G, Di Milia L. 2008. Aging and shift work: a complex problem to face. Chronobiol Int. 25(2):165–181. doi: 10.1080/07420520802103410. [DOI] [PubMed] [Google Scholar]
- Costa P, McCrae R. 1989. The NEO-PI/NEO-FFI manual supplement. Odessa (FL): Psychological Assessment Resources. [Google Scholar]
- Crispim CA, Padilha HG, Zimberg IZ, Waterhouse J, Dattilo M, Tufik S, De Mello MT. 2012. Adipokine levels are altered by shiftwork: a preliminary study. Chronobiol Int. 29(5):587–594. doi: 10.3109/07420528.2012.675847. [DOI] [PubMed] [Google Scholar]
- Cutrona C, Russell D 1983. The provisions of social relationships and adaptation to stress. Advances in Personal Relationships. Greenwich (CT): JAI Press; p. 37–67. [Google Scholar]
- Dean N, Raftery AE. 2010. Latent class analysis variable selection. Ann Inst Stat Math. 62(1):11–35. doi: 10.1007/s10463-009-0258-9. [DOI] [PMC free article] [PubMed] [Google Scholar]
- Depner CM, Stothard ER, Wright KP Jr. 2014. Metabolic consequences of sleep and circadian disorders. Curr Diab Rep. 14(7):507. doi: 10.1007/s11892-014-0507-z. [DOI] [PMC free article] [PubMed] [Google Scholar]
- Ding C, Lim LL, Xu L, Kong APS. 2018. Sleep and obesity. J Obes Metab Syndr. 27(1):4–24. doi: 10.7570/jomes.2018.27.1.4. [DOI] [PMC free article] [PubMed] [Google Scholar]
- Drake CL, Belcher R, Howard R, Roth T, Levin AM, Gumenyuk V. 2015. Length polymorphism in the period 3 gene is associated with sleepiness and maladaptive circadian phase in night-shift workers. J Sleep Res. 24(3):254–261. doi: 10.1111/jsr.12264. [DOI] [PubMed] [Google Scholar]
- Elenkov IJ. 2008. Neurohormonal-cytokine interactions: implications for inflammation, common human diseases and well-being. Neurochem Int. 52(1–2):40–51. doi: 10.1016/j.neuint.2007.06.037. [DOI] [PubMed] [Google Scholar]
- Esquirol Y, Bongard V, Mabile L, Jonnier B, Soulat JM, Perret B. 2009. Shift work and metabolic syndrome: respective impacts of job strain, physical activity, and dietary rhythms. Chronobiol Int. 26(3):544–559. doi: 10.1080/07420520902821176. [DOI] [PubMed] [Google Scholar]
- Faraut B, Bayon V, Leger D. 2013. Neuroendocrine, immune and oxidative stress in shift workers. Sleep Med Rev. 17 (6):433–444. doi: 10.1016/j.smrv.2012.12.006. [DOI] [PubMed] [Google Scholar]
- Fink AM. 2020. Measuring the effects of night-shift work on cardiac autonomic modulation: an appraisal of heart rate variability metrics. Int J Occup Med Environ Health. 33 (4):409–425. doi: 10.13075/ijomeh.1896.01560. [DOI] [PubMed] [Google Scholar]
- Fischer D, Lombardi DA, Folkard S, Willetts J, Christiani DC. 2017. Updating the “Risk Index”: a systematic review and meta-analysis of occupational injuries and work schedule characteristics. Chronobiol Int. 34(10):1423–1438. doi: 10.1080/07420528.2017.1367305. [DOI] [PubMed] [Google Scholar]
- Fop M, Murphy TB 2017. LCAvarsel: Variable selection for latent class analysis: R package version 1.1.
- Fop M, Smart KM, Murphy TB. 2017. Variable selection for latent class analysis with application to low back pain diagnosis. Ann Appl Stat. 11(4):2080–2110. doi: 10.1214/17-aoas1061. [DOI] [Google Scholar]
- Gabay C 2006. Interleukin-6 and chronic inflammation. Arthritis Res Ther. 8(Suppl 2):S3. doi: 10.1186/ar1917. [DOI] [PMC free article] [PubMed] [Google Scholar]
- Gamble KL, Motsinger-Reif AA, Hida A, Borsetti HM, Servick SV, Ciarleglio CM, Robbins S, Hicks J, Carver K, Hamilton N, et al. 2011. Shift work in nurses: contribution of phenotypes and genotypes to adaptation. PLoS One. 6(4): e18395. doi: 10.1371/journal.pone.0018395. [DOI] [PMC free article] [PubMed] [Google Scholar]
- Goodman LA. 1974. Exploratory latent structure analysis using both identifiable and unidentifiable models. Biometrika. 61(2):215–231. doi: 10.1093/biomet/61.2.215. [DOI] [Google Scholar]
- Grandner MA, Kripke DF, Yoon IY, Youngstedt SD. 2006. Criterion validity of the Pittsburgh sleep quality index: investigation in a non-clinical sample. Sleep Biol Rhythms. 4(2):129–139. doi: 10.1111/j.1479-8425.2006.00207.x. [DOI] [PMC free article] [PubMed] [Google Scholar]
- Grant CL, Coates AM, Dorrian J, Kennaway DJ, Wittert GA, Heilbronn LK, Pajcin M, Della Vedova C, Gupta CC, Banks S. 2017. Timing of food intake during simulated night shift impacts glucose metabolism: a controlled study. Chronobiol Int. 34(8):1003–1013. doi: 10.1080/07420528.2017.1335318. [DOI] [PubMed] [Google Scholar]
- Harma M 1993. Individual differences in tolerance to shiftwork: a review. Ergonomics. 36(1–3):101–109. doi: 10.1080/00140139308967860. [DOI] [PubMed] [Google Scholar]
- Hartley TA, Burchfiel CM, Fekedulegn D, Andrew ME, Knox SS, Violanti JM. 2011a. Associations between police officer stress and the metabolic syndrome. Int J Emerg Ment Health. 13(4):243–256. doi: 10.1016/bs.mcb.2015.01.016.Observing. [DOI] [PMC free article] [PubMed] [Google Scholar]
- Hartley TA, Burchfiel CM, Fekedulegn D, Andrew ME, Violanti JM. 2011b. Health disparities in police officers: comparisons to the U.S. general population. Int J Emerg Ment Health. 13(4):211–220. doi: 10.1016/S2215-0366(16)30284-X.Epidemiology. [DOI] [PMC free article] [PubMed] [Google Scholar]
- Hasan-Ali H, Abd El-Mottaleb NA, Hamed HB, Abd-Elsayed A. 2011. Serum adiponectin and leptin as predictors of the presence and degree of coronary atherosclerosis. Coron Artery Dis. 22(4):264–269. doi: 10.1097/MCA.0b013e3283452431. [DOI] [PubMed] [Google Scholar]
- Hosmer DW, Lemeshow S. 2000. Assessing the fit of the model. In: Shewhart WA, Wilks SS, editors. Applied logistic regression. Danvers (MA): John Wiley & Sons, Inc. Chapter 5, p. 160–164. [Google Scholar]
- Irwin MR, Olmstead R, Carroll JE. 2016. Sleep disturbance, sleep duration, and inflammation: a systematic review and meta-analysis of cohort studies and experimental sleep deprivation. Biol Psychiatry. 80(1):40–52. doi: 10.1016/j.biopsych.2015.05.014. [DOI] [PMC free article] [PubMed] [Google Scholar]
- James SM, Honn KA, Gaddameedhi S, Van Dongen HPA. 2017. Shift work: disrupted circadian rhythms and sleep-implications for health and well-being. Curr Sleep Med Rep. 3(2):104–112. doi: 10.1007/s40675-017-0071-6. [DOI] [PMC free article] [PubMed] [Google Scholar]
- Jarczok MN, Jarczok M, Mauss D, Koenig J, Li J, Herr RM, Thayer JF. 2013. Autonomic nervous system activity and workplace stressors: a systematic review. Neurosci Biobehav Rev. 37(8):1810–1823. doi: 10.1016/j.neubiorev.2013.07.004. [DOI] [PubMed] [Google Scholar]
- Jennings JR, Muldoon MF, Hall M, Buysse DJ, Manuck SB. 2007. Self-reported sleep quality is associated with the metabolic syndrome. Sleep. 30(2):219–223. doi: 10.1093/sleep/30.2.219. [DOI] [PubMed] [Google Scholar]
- Joseph PN, Violanti JM, Donahue R, Andrew ME, Trevisan M, Burchfiel CM, Dorn J. 2009. Police work and subclinical atherosclerosis. J Occup Environ Med. 51(6):700–707. doi: 10.1097/jom.0b013e3181a02252. [DOI] [PubMed] [Google Scholar]
- Jung H, Dan H, Pang Y, Kim B, Jeong H, Lee JE, Kim O. 2020. Association between dietary habits, shift work, and the metabolic syndrome: the Korea Nurses’ Health Study. Int J Environ Res Public Health. 17(20):7697. doi: 10.3390/ijerph17207697. [DOI] [PMC free article] [PubMed] [Google Scholar]
- Kecklund G, Eriksen CA, Akerstedt T. 2008. Police officers attitude to different shift systems: association with age, present shift schedule, health and sleep/wake complaints. Appl Ergon. 39(5):565–571. doi: 10.1016/j.apergo.2008.01.002. [DOI] [PubMed] [Google Scholar]
- Knutsson A, Kempe A. 2014. Shift work and diabetes: a systematic review. Chronobiol Int. 31(10):1146–1151. doi: 10.3109/07420528.2014.957308. [DOI] [PubMed] [Google Scholar]
- Lammers-van Der Holst HM, Kerkhof GA. 2014. Shift work tolerance and the importance of sleep quality: a study of police officers. Biol Rhythm Res. 46(2):257–264. doi: 10.1080/09291016.2014.985002. [DOI] [Google Scholar]
- Lanza ST, Collins LM, Lemmon DR, Schafer JL. 2007. PROC LCA: a SAS procedure for latent class analysis. Struct Equ Modeling. 14(4):671–694. doi: 10.1080/10705510701575602. [DOI] [PMC free article] [PubMed] [Google Scholar]
- Lanza ST, Rhoades BL. 2013. Latent class analysis: an alternative perspective on subgroup analysis in prevention and treatment. Prev Sci. 14(2):157–168. doi: 10.1007/s11121-011-0201-1. [DOI] [PMC free article] [PubMed] [Google Scholar]
- Lazarsfeld PF, Henry NW. 1968. Latent structure analysis. Boston (MA): Houghton Mifflin. [Google Scholar]
- Licht CM, De Geus EJ, Penninx BW. 2013. Dysregulation of the autonomic nervous system predicts the development of the metabolic syndrome. J Clin Endocrinol Metab. 98 (6):2484–2493. doi: 10.1210/jc.2012-3104. [DOI] [PubMed] [Google Scholar]
- Liu J, Butler KR, Buxbaum SG, Sung JH, Campbell BW, Taylor HA. 2010. Leptinemia and its association with stroke and coronary heart disease in the Jackson Heart Study. Clin Endocrinol (Oxf). 72(1):32–37. doi: 10.1111/j.1365-2265.2009.03627.x. [DOI] [PMC free article] [PubMed] [Google Scholar]
- Liu Q, Shi J, Duan P, Liu B, Li T, Wang C, Li H, Yang T, Gan Y, Wang X, et al. 2018. Is shift work associated with a higher risk of overweight or obesity? A systematic review of observational studies with meta-analysis. Int J Epidemiol. 47(6):1956–1971. doi: 10.1093/ije/dyy079. [DOI] [PubMed] [Google Scholar]
- McCanlies EC, Araia SK, Joseph PN, Mnatsakanova A, Andrew ME, Burchfiel CM, Violanti JM. 2011. C-reactive protein, interleukin-6, and posttraumatic stress disorder symptomology in urban police officers. Cytokine. 55 (1):74–78. doi: 10.1016/j.cyto.2011.03.025. [DOI] [PubMed] [Google Scholar]
- McLaughlin C, Bowman ML, Bradley CL, Mistlberger RE. 2008. A prospective study of seasonal variation in shift-work tolerance. Chronobiol Int. 25(2):455–470. doi: 10.1080/07420520802118269. [DOI] [PubMed] [Google Scholar]
- Mikolaenko I, Benson E, Konrad RJ, Chaffin C, Robinson CA, Hardy RW. 2000. Evaluation of the Beckman Coulter LX20 clinical chemistry analyzer. Lab Med. 31(7):387–393. doi: 10.1309/urea-eu4h-um16-3b2w. [DOI] [Google Scholar]
- Monti V, Carlson JJ, Hunt SC, Adams TD. 2006. Relationship of ghrelin and leptin hormones with body mass index and waist circumference in a random sample of adults. J Am Diet Assoc. 106(6):822–828. doi: 10.1016/j.jada.2006.03.015. [DOI] [PubMed] [Google Scholar]
- Nachreiner F 1998. Individual and social determinants of shiftwork tolerance. Scand J Work Environ Health. 24(Suppl–42). [PubMed] [Google Scholar]
- Natvik S, Bjorvatn B, Moen BE, Mageroy N, Sivertsen B, Pallesen S. 2011. Personality factors related to shift work tolerance in two- and three-shift workers. Appl Ergon. 42 (5):719–724. doi: 10.1016/j.apergo.2010.11.006. [DOI] [PubMed] [Google Scholar]
- NCEP. 2002. Third report of the National Cholesterol Education Program (NCEP) expert panel on detection, evaluation, and treatment of high blood cholesterol in adults (Adult treatment panel III). Circulation. 106 (25):3143–3421. doi: 10.1161/circ.106.25.3143. [DOI] [PubMed] [Google Scholar]
- Parkes KR. 2002. Age, smoking, and negative affectivity as predictors of sleep patterns among shiftworkers in two environments. J Occup Health Psychol. 7(2):156–173. doi: 10.1037//1076-8998.7.2.156. [DOI] [PubMed] [Google Scholar]
- Portaluppi F, Smolensky MH, Touitou Y. 2010. Ethics and methods for biological rhythm research on animals and human beings. Chronobiol Int. 27(9–10):1911–1929. doi: 10.3109/07420528.2010.516381. [DOI] [PubMed] [Google Scholar]
- Proper KI, Van De Langenberg D, Rodenburg W, Vermeulen RCH, Van Der Beek AJ, Van Steeg H, Van Kerkhof LWM. 2016. The relationship between shift work and metabolic risk factors: a systematic review of longitudinal studies. Am J Prev Med. 50(5):e147–e157. doi: 10.1016/j.amepre.2015.11.013. [DOI] [PubMed] [Google Scholar]
- Purba A, Demou E. 2019. The relationship between organisational stressors and mental wellbeing within police officers: a systematic review. BMC Public Health. 19(1):1286. doi: 10.1186/s12889-019-7609-0. [DOI] [PMC free article] [PubMed] [Google Scholar]
- Puttonen S, Harma M, Hublin C. 2010. Shift work and cardiovascular disease - pathways from circadian stress to morbidity. Scand J Work Environ Health. 36(2):96–108. doi: 10.5271/sjweh.2894. [DOI] [PubMed] [Google Scholar]
- Puttonen S, Viitasalo K, Harma M. 2011. Effect of shiftwork on systemic markers of inflammation. Chronobiol Int. 28 (6):528–535. doi: 10.3109/07420528.2011.580869. [DOI] [PubMed] [Google Scholar]
- Reinberg A, Ashkenazi I. 2008. Internal desynchronization of circadian rhythms and tolerance to shift work. Chronobiol Int. 25(4):625–643. doi: 10.1080/07420520802256101. [DOI] [PubMed] [Google Scholar]
- Reszka E, Peplonska B, Wieczorek E, Sobala W, Bukowska A, Gromadzinska J, Lie JA, Kjuus H, Wasowicz W. 2013. Rotating night shift work and polymorphism of genes important for the regulation of circadian rhythm. Scand J Work Environ Health. 39(2):178–186. doi: 10.5271/sjweh.3299. [DOI] [PubMed] [Google Scholar]
- Reutrakul S, Knutson KL. 2015. Consequences of circadian disruption on cardiometabolic health. Sleep Med Clin. 10 (4):455–468. doi: 10.1016/j.jsmc.2015.07.005. [DOI] [PMC free article] [PubMed] [Google Scholar]
- Ridker PM, Buring JE, Cook NR, Rifai N. 2003. C-reactive protein, the metabolic syndrome, and risk of incident cardiovascular events: an 8-year follow-up of 14,719 initially healthy American women. Circulation. 107(3):391–397. doi: 10.1161/01.cir.0000055014.62083.05. [DOI] [PubMed] [Google Scholar]
- Ritonja J, Aronson KJ, Matthews RW, Boivin DB, Kantermann T. 2019. Working time society consensus statements: individual differences in shift work tolerance and recommendations for research and practice. Ind Health. 57(2):201–212. doi: 10.2486/indhealth.SW-5. [DOI] [PMC free article] [PubMed] [Google Scholar]
- Rivera AS, Akanbi M, O’Dwyer LC, McHugh M. 2020. Shift work and long work hours and their association with chronic health conditions: a systematic review of systematic reviews with meta-analyses. PLoS One. 15(4):e0231037. doi: 10.1371/journal.pone.0231037. [DOI] [PMC free article] [PubMed] [Google Scholar]
- Rostami H, Tavakoli HR, Rahimi MH, Mohammadi M. 2019. Metabolic syndrome prevalence among armed forces personnel (Military personnel and police officers): a systematic review and meta-analysis. Mil Med. 184(9–10):e417–e425. doi: 10.1093/milmed/usz144. [DOI] [PubMed] [Google Scholar]
- Sack RL, Auckley D, Auger RR, Carskadon MA, Wright KP Jr., Vitiello MV, Zhdanova IV. 2007. Circadian rhythm sleep disorders: part I, basic principles, shift work and jet lag disorders. An American academy of sleep medicine review. Sleep. 30(11):1460–1483. doi: 10.1093/sleep/30.11.1460. [DOI] [PMC free article] [PubMed] [Google Scholar]
- Saksvik IB, Bjorvatn B, Hetland H, Sandal GM, Pallesen S. 2011. Individual differences in tolerance to shift work: a systematic review. Sleep Med Rev. 15(4):221–235. doi: 10.1016/j.smrv.2010.07.002. [DOI] [PubMed] [Google Scholar]
- Saksvik-Lehouillier I, Bjorvatn B, Hetland H, Sandal GM, Moen BE, Mageroy N, Akerstedt T, Pallesen S. 2013. Individual, situational and lifestyle factors related to shift work tolerance among nurses who are new to and experienced in night work. J Adv Nurs. 69(5):1136–1146. doi: 10.1111/j.1365-2648.2012.06105.x. [DOI] [PubMed] [Google Scholar]
- Saksvik-Lehouillier I, Pallesen S, Bjorvatn B, Mageroy N, Folkard S. 2015. Towards a more comprehensive definition of shift work tolerance. Ind Health. 53(1):69–77. doi: 10.2486/indhealth.2014-0112. [DOI] [PMC free article] [PubMed] [Google Scholar]
- Sallis JF, Haskell WL, Wood PD, Fortmann SP, Rogers T, Blair SN, Paffenbarger RS Jr. 1985. Physical activity assessment methodology in the Five-City Project. Am J Epidemiol. 121(1):91–106. doi: 10.1093/oxfordjournals.aje.a113987. [DOI] [PubMed] [Google Scholar]
- Scheer FA, Hilton MF, Mantzoros CS, Shea SA. 2009. Adverse metabolic and cardiovascular consequences of circadian misalignment. Proc Natl Acad Sci USA. 106 (11):4453–4458. doi: 10.1073/pnas.0808180106. [DOI] [PMC free article] [PubMed] [Google Scholar]
- Schreiber JB. 2017. Latent class analysis: an example for reporting results. Res Social Adm Pharm. 13 (6):1196–1201. doi: 10.1016/j.sapharm.2016.11.011. [DOI] [PubMed] [Google Scholar]
- Shaffer F, Ginsberg JP. 2017. An overview of heart rate variability metrics and norms. Front Public Health. 5:258. doi: 10.3389/fpubh.2017.00258. [DOI] [PMC free article] [PubMed] [Google Scholar]
- Siegrist J, Li J. 2017. Work stress and altered biomarkers: a synthesis of findings based on the effort-reward imbalance model. Int J Environ Res Public Health. 14(11):1373. doi: 10.3390/ijerph14111373. [DOI] [PMC free article] [PubMed] [Google Scholar]
- Sookoian S, Gemma C, Fernandez Gianotti T, Burgueno A, Alvarez A, Gonzalez CD, Pirola CJ. 2007. Effects of rotating shift work on biomarkers of metabolic syndrome and inflammation. J Intern Med. 261(3):285–292. doi: 10.1111/j.1365-2796.2007.01766.x. [DOI] [PubMed] [Google Scholar]
- Souza RV, Sarmento RA, De Almeida JC, Canuto R. 2019. The effect of shift work on eating habits: a systematic review. Scand J Work Environ Health. 45(1):7–21. doi: 10.5271/sjweh.3759. [DOI] [PubMed] [Google Scholar]
- Spielberger CD, Westberry LG, Grier KS, Greenfield G. 1981. The police stress survey: sources of stress in law enforcement. Tampa (FL): Human Resources Institute Monograph Series Three, No. 6. [Google Scholar]
- Srikanthan K, Feyh A, Visweshwar H, Shapiro JI, Sodhi K. 2016. Systematic review of metabolic syndrome biomarkers: a panel for early detection, management, and risk stratification in the West Virginian population. Int J Med Sci. 13 (1):25–38. doi: 10.7150/ijms.13800. [DOI] [PMC free article] [PubMed] [Google Scholar]
- Sulkava S, Ollila HM, Alasaari J, Puttonen S, Harma M, Viitasalo K, Lahtinen A, Lindstrom J, Toivola A, Sulkava R, et al. 2017. Common genetic variation near melatonin receptor 1A gene linked to job-related exhaustion in shift workers. Sleep. 40(1):1–10. doi: 10.1093/sleep/zsw011. [DOI] [PMC free article] [PubMed] [Google Scholar]
- Sun M, Feng W, Wang F, Li P, Li Z, Li M, Tse G, Vlaanderen J, Vermeulen R, Tse LA. 2018. Meta-analysis on shift work and risks of specific obesity types. Obes Rev. 19(1):28–40. doi: 10.1111/obr.12621. [DOI] [PubMed] [Google Scholar]
- Syed S, Ashwick R, Schlosser M, Jones R, Rowe S, Billings J. 2020. Global prevalence and risk factors for mental health problems in police personnel: a systematic review and meta-analysis. Occup Environ Med. 77(11):737–747. doi: 10.1136/oemed-2020-106498. [DOI] [PubMed] [Google Scholar]
- Tamagawa R, Lobb B, Booth R. 2007. Tolerance of shift work. Appl Ergon. 38(5):635–642. doi: 10.1016/j.apergo.2006.05.003. [DOI] [PubMed] [Google Scholar]
- Tarvainen MP, Ranta-Aho PO, Karjalainen PA. 2002. An advanced detrending method with application to HRV analysis. IEEE Trans Biomed Eng. 49(2):172–175. doi: 10.1109/10.979357. [DOI] [PubMed] [Google Scholar]
- Tharkar S, Kumpatla S, Muthukumaran P, Viswanathan V. 2008. High prevalence of metabolic syndrome and cardiovascular risk among police personnel compared to general population in India. J Assoc Physicians India. 56:845–849. [PubMed] [Google Scholar]
- Ulhoa MA, Marqueze EC, Burgos LG, Moreno CR. 2015. Shift work and endocrine disorders. Int J Endocrinol. 2015:826249. doi: 10.1155/2015/826249. [DOI] [PMC free article] [PubMed] [Google Scholar]
- Vadacca M, Margiotta DP, Navarini L, Afeltra A. 2011. Leptin in immuno-rheumatological diseases. Cell Mol Immunol. 8 (3):203–212. doi: 10.1038/cmi.2010.75. [DOI] [PMC free article] [PubMed] [Google Scholar]
- Van Dam NT, Earleywine M. 2011. Validation of the Center for Epidemiologic Studies Depression Scale–Revised (CESD-R): pragmatic depression assessment in the general population. Psychiatry Res. 186(1):128–132. doi: 10.1016/j.psychres.2010.08.018. [DOI] [PubMed] [Google Scholar]
- Violanti JM. 2012. Shifts, extended work hours, and fatigue: an assessment of health and personal risks for police officers. Nat Inst Correct. 1–63. [Google Scholar]
- Violanti JM, Burchfiel CM, Hartley TA, Mnatsakanova A, Fekedulegn D, Andrew ME, Charles LE, Vila BJ. 2009. Atypical work hours and metabolic syndrome among police officers. Arch Environ Occup Health. 64(3):194–201. doi: 10.1080/19338240903241259. [DOI] [PubMed] [Google Scholar]
- Violanti JM, Burchfiel CM, Miller DB, Andrew ME, Dorn J, Wactawski-Wende J, Beighley CM, Pierino K, Joseph PN, Vena JE, et al. 2006a. The Buffalo Cardio-Metabolic Occupational Police Stress (BCOPS) pilot study: methods and participant characteristics. Ann Epidemiol. 16(2):148–156. doi: 10.1016/j.annepidem.2005.07.054. [DOI] [PubMed] [Google Scholar]
- Violanti JM, Charles LE, Hartley TA, Mnatsakanova A, Andrew ME, Fekedulegn D, Vila B, Burchfiel CM. 2008. Shift-work and suicide ideation among police officers. Am J Ind Med. 51(10):758–768. doi: 10.1002/ajim.20629. [DOI] [PubMed] [Google Scholar]
- Violanti JM, Charles LE, McCanlies E, Hartley TA, Baughman P, Andrew ME, Fekedulegn D, Ma CC, Mnatsakanova A, Burchfiel CM. 2017. Police stressors and health: a state-of-the-art review. Policing. 40(4):642–656. doi: 10.1108/PIJPSM-06-2016-0097. [DOI] [PMC free article] [PubMed] [Google Scholar]
- Violanti JM, Fekedulegn D, Hartley TA, Andrew ME, Charles LE, Mnatsakanova A, Burchfiel CM. 2006b. Police trauma and cardiovascular disease: association between PTSD symptoms and metabolic syndrome. Int J Emerg Ment Health. 8(4):227–237. [PubMed] [Google Scholar]
- Violanti JM, Vena JE, Petralia S. 1998. Mortality of a police cohort: 1950–1990. Am J Ind Med. 33(4):366–373. doi:. [DOI] [PubMed] [Google Scholar]
- Walker WH 2nd, Walton JC, DeVries AC, Nelson RJ. 2020. Circadian rhythm disruption and mental health. Transl Psychiatry. 10(1):28. doi: 10.1038/s41398-020-0694-0. [DOI] [PMC free article] [PubMed] [Google Scholar]
- Wang A, Liu J, Li C, Gao J, Li X, Chen S, Wu S, Ding H, Fan H, Hou S 2017. Cumulative exposure to high-sensitivity c-reactive protein predicts the risk of cardiovascular disease. J Am Heart Assoc. 6(10). doi: 10.1161/JAHA.117.005610. [DOI] [PMC free article] [PubMed] [Google Scholar]
- Weder N, Zhang H, Jensen K, Yang BZ, Simen A, Jackowski A, Lipschitz D, Douglas-Palumberi H, Ge M, Perepletchikova F, et al. 2014. Child abuse, depression, and methylation in genes involved with stress, neural plasticity, and brain circuitry. J Am Acad Child Adolesc Psychiatry. 53(4):417–424. doi: 10.1016/j.jaac.2013.12.025. [DOI] [PMC free article] [PubMed] [Google Scholar]
- Willis TA, O’Connor DB, Smith L. 2008. Investigating effort–reward imbalance and work–family conflict in relation to morningness–eveningness and shift work. Work Stress. 22 (2):125–137. doi: 10.1080/02678370802180558. [DOI] [Google Scholar]
- Wirth M, Burch J, Violanti J, Burchfiel C, Fekedulegn D, Andrew M, Zhang H, Miller DB, Hebert JR, Vena JE. 2011. Shiftwork duration and the awakening cortisol response among police officers. Chronobiol Int. 28 (5):446–457. doi: 10.3109/07420528.2011.573112. [DOI] [PMC free article] [PubMed] [Google Scholar]
- Wirth M, Vena JE, Smith EK, Bauer SE, Violanti J, Burch J. 2013. The epidemiology of cancer among police officers. Am J Ind Med. 56(4):439–453. doi: 10.1002/ajim.22145. [DOI] [PMC free article] [PubMed] [Google Scholar]
- Wirth MD, Andrew ME, Burchfiel CM, Burch JB, Fekedulegn D, Hartley TA, Charles LE, Violanti JM. 2017. Association of shiftwork and immune cells among police officers from the Buffalo Cardio-Metabolic Occupational Police Stress study. Chronobiol Int. 34(6):721–731. doi: 10.1080/07420528.2017.1316732. [DOI] [PMC free article] [PubMed] [Google Scholar]
- Wyse CA, Celis Morales CA, Graham N, Fan Y, Ward J, Curtis AM, Mackay D, Smith DJ, Bailey MES, Biello S, et al. 2017. Adverse metabolic and mental health outcomes associated with shiftwork in a population-based study of 277,168 workers in UK biobank. Ann Med. 49(5):411–420. doi: 10.1080/07853890.2017.1292045. [DOI] [PubMed] [Google Scholar]
- Zillig LMP, Hemenover SH, Dienstbier RA. 2016. What do we assess when we assess a Big 5 trait? A content analysis of the affective, behavioral, and cognitive processes represented in Big 5 personality inventories. Pers Soc Psychol Bull. 28(6):847–858. doi: 10.1177/0146167202289013. [DOI] [Google Scholar]
- Zimberg IZ, Fernandes Junior SA, Crispim CA, Tufik S, De Mello MT. 2012. Metabolic impact of shift work. Work. 41 (Suppl 1):4376–4383. doi: 10.3233/WOR-2012-0733-4376. [DOI] [PubMed] [Google Scholar]
Associated Data
This section collects any data citations, data availability statements, or supplementary materials included in this article.