Abstract
Hemoglobin III (HbIII) is one of the two oxygen reactive hemoproteins present in the bivalve, Lucina pectinata. The clam inhabits a sulfur-rich environment and HbIII is the only hemoprotein present in the system which does not yet have a structure described elsewhere. It is known that HbIII exists as a heterodimer with hemoglobin II (HbII) to generate the stable Oxy(HbII-HbIII) complex but it remains unknown if HbIII can form a homodimeric species. Here, a new chromatographic methodology to separate OxyHbIII from the HbII-HbIII dimer has been developed, employing a Fast Performance Liquid Chromatography (FPLC) and Ionic Exchange Chromatography (IEC) column. The nature of OxyHbIII in solution at concentrations from 1.6 mg/mL to 20.4 mg/mL was studied using Small Angle X-ray Scattering (SAXS). The results show that at all concentrations, the Oxy(HbIII-HbIII) dimer dominates in solution. However, as the concentration increases to non-physiological values, 20.4 mg/mL, HbIII forms a 30% tetrameric fraction. Thus, there is a direct relationship between the Oxy(HbIII-HbIII) oligomeric form and hemoglobin concentration. We suggest it is likely that the OxyHbIII dimer contributes to active oxygen transport in tissues of Lucina pectinata, where the Oxy(HbII-HbIII) complex is not present.
Graphical abstract
Introduction
Lucina pectinata are bivalves that are able to live in hydrogen sulfide-rich environments due to a chemosymbiotic relationship with a sulfide-oxidizing proteobacteria1,2. Three hemoglobins enable this essential process: the reactive sulfide protein, hemoglobin I (HbI), and the oxygen reactive proteins hemoglobin II (HbII) and hemoglobin III (HbIII)2–4. During this process H2S and O2 are delivered to the symbiont and are used to fix CO2 and synthesize organic nutrients4. These three heme proteins are in a cysteine-rich protein medium located in the bacteriocytes’ dark cytoplasmic patches, but their function and structure remain unknown4.5. HbI in the ferric state binds H2S with a kon of 226 × 103 M−1s−1 (at a pH higher than 5.5), and it dissociates with a koff = 0.22 × 10⁻³ s−1 (pH 7.5). The HbII-HbIII heterodimer, compared to the monomeric HbII and HbIII species, has slower oxygen association and dissociation constants than the corresponding homodimeric HbII-HbII and HbIII-HbIII protein complexes. Oxygen binding to the HbII-HbIII heterodimer occurs with a kon of 3.90 × 10⁵ M−1s−1 and koff of 2.88 × 10⁵ M−1s−1. Simultaneously, oxygen dissociation from the OxyHbII homodimer and OxyHbIII homodimer complexes happens with a corresponding koff = 0.11 s−1 and koff = 0.075 s−1 respectively. These kinetic studies support the idea that both HbII and HbIII can work as oxygen transport proteins4 and that such transport could occur via the HbII-HbII and HbIII-HbIII homodimers and HbII-HbIII heterodimer states. The primary structure of HbIII consists of 152 residues6,7, with a molecular weight of 18,068 Da, including the heme group. The molecular weight of HbII is 17,654 Da, again including the heme group. HbII and HbIII have a 64% identical amino acid compositions, but differ significantly from HbI which is only 32% identical7. The oxygen reactivity mechanism is partially known, where the distal tyrosine (Tyr) and glutamine (Gln) residues are responsible for the high oxygen affinity. The HbII and HbIII oxygen stability has been related to B10 tyrosine and E7 glutamine amino acids, which control the hydrogen bond network of the Oxyheme complexes8–10. Kraus et al. suggested that HbIII can self-associate as a homodimer, form larger oligomers, or associate with HbII when present4. This interaction between HbII and HbIII appears to have a relatively high affinity as it is difficult to isolate pure HbIII from the HbII-HbIII heterodimer complex.
The first attempt to obtain the crystallographic structures of L. pectinata oxygen reactive proteins11 used the hanging drop technique. It produced crystals in the presence of 10% ammonium sulfate with 0.05M Tris-HCl (pH 7). Early X-ray crystallography studies using these crystals produced diffraction with a resolution of 3.1 Å and a P42212 tetragonal space group, but HbII or HbIII structures were not able to be solved11. Later, crystallographic results of the HbII and HbIII homodimer complexes concluded that the crystals were isomorphous, diffracted to 2.7 Å, and contained a dimer in the asymmetric unit12. Gavira et al. (2006) employed a capillary counter-diffusion technique for Oxy(HbII-HbII) to obtained crystals and reported the crystallographic structure at 1.9 Å resolution13 (PDB ID 2OLP). These results confirmed the presence of a distal tyrosine (Tyr) and glutamine (Gln) residues in the heme pocket region9. To evaluate the effect of pH on the hydrogen bonding network surrounding the distal residues and the oxygen stabilization and transport mechanism in OxyHbII, crystals were grown at various pHs (4, 5, 8, and 9). The pH experiment produced four crystal structures with a resolution of 3.3, 1.9, 1.8, and 2.0 Å, respectively, which are now deposited in the RCSB PDB (PDB IDs: 3PI1–3PI4)14. The Oxy(HbII-HbIII) complex’s best crystallization conditions were produced using capillary counter-diffusion and sodium formate as a precipitant and were determined by Ruiz-Martinez et al.15. The heterodimer structures for both the oxy and cyano forms at pH 5 were deposited at the RCSB (PDB ID 3PT7 and 3PT8) with a 2.2 Å resolution. These crystals were isomorphous with a P42212 space group. The OxyHbIII homodimer is the only hemoprotein complex from L. pectinata that has not been structurally characterized. Here, SAXS data from the newly isolated HbIII shows that the Oxy(HbIII-HbIII) homodimer dominates in solution. Still, as HbIII concentration increases to 20.4 mg/mL, 30% of the sample shifts towards a tetrameric species. These results support the observations made by Kraus and Wittenberg4 that the tetramer may exist in solution, but it may be a non-functional oxygen carrier (HbIII)4. Therefore, the OxyHbIII homodimer is a probable contributor to active oxygen transport in tissues of Lucina pectinata, where the Oxy(HbII-HbIII) complex is not present.
Material and Methods
Protein Isolation, Purification, and Concentration
The OxyHbIII protein was obtained from Oxy(HbII-III) complex using a Fast Performance Liquid Chromatography (FPLC) instrument and a combination of Size Exclusion Chromatography (SEC) and Ionic Exchange Chromatography (IEC). Initially, the heterodimer was separated, from the centrifuged ctenidium extract, by SEC with a HiLoad 26/60 Superdex 200 prep grade column (ÄKTA FPLC, Amersham Bioscience)4. The column was equilibrated with a buffer solution containing 50.0 mM of sodium phosphate monobasic (NaH2PO4) and 0.5 mM of ethilenediaminetetraacetic acid (EDTA) at pH 7.515. The flowrate used with the SEC column was optimized at 1.0 mL/min to produce complete separation of the HbII-III complex from the raw extract. The samples were concentrated in distilled water up to 0.15 – 0.20 mM using a regenerated MWCO 10k cellulose membrane in an Amicon® ultrafiltration concentrator in preparation for Ion Exchange Chromatography (IEC). The initial IEC method employed a HiPrep 16/10 column, but its resolution was not sufficient to isolate completely HbIII from HbII. The new approach used an IEC column, XK 16/70 (GE, Healthcare Life Science), packed with a Q Sepharose High-Performance resin (GE Healthcare Life Science) bead size (34 μm) and a HiTrap Q HP pre-column (GE, Healthcare Life Science). Both columns were equilibrated with 10.0 mM TEA/sodium acetate at pH 7.5 at 2.0 mL/min. Next, the Oxy(HbII-III) sample was loaded, washed with 0.2 M sodium phosphate buffer, containing 0.2 M NaCl and eluted with the elution buffer (10.0 mM TEA/sodium acetate and 180 mM sodium chloride at pH 7.5) at 2.5 mL/min with a step elution from 0% to 40%, for 235 minutes. The last step consisted of changing the step elution from 40% to 100% using 525 mL with the same elution rate. Samples purity was determined using sodium dodecyl sulfate-polyacrylamide gel electrophoresis, SDS-PAGE, (14%) loading, 15μL of sample at 0.1 mg/mL protein concentration (Figure 1c). The oxygen ligand bound to HbIII and its concentration was verified with UV-Vis spectroscopy using the extinction coefficients reported for HbIII, Soret (414 nm), and Q bands (540 and 576 nm)4. Following the FPLC purification procedure, the HbIII fractions were concentrated by centrifugation with a Millipore Amicon® Ultra-15 Ultracel 10K.
Figure 1.
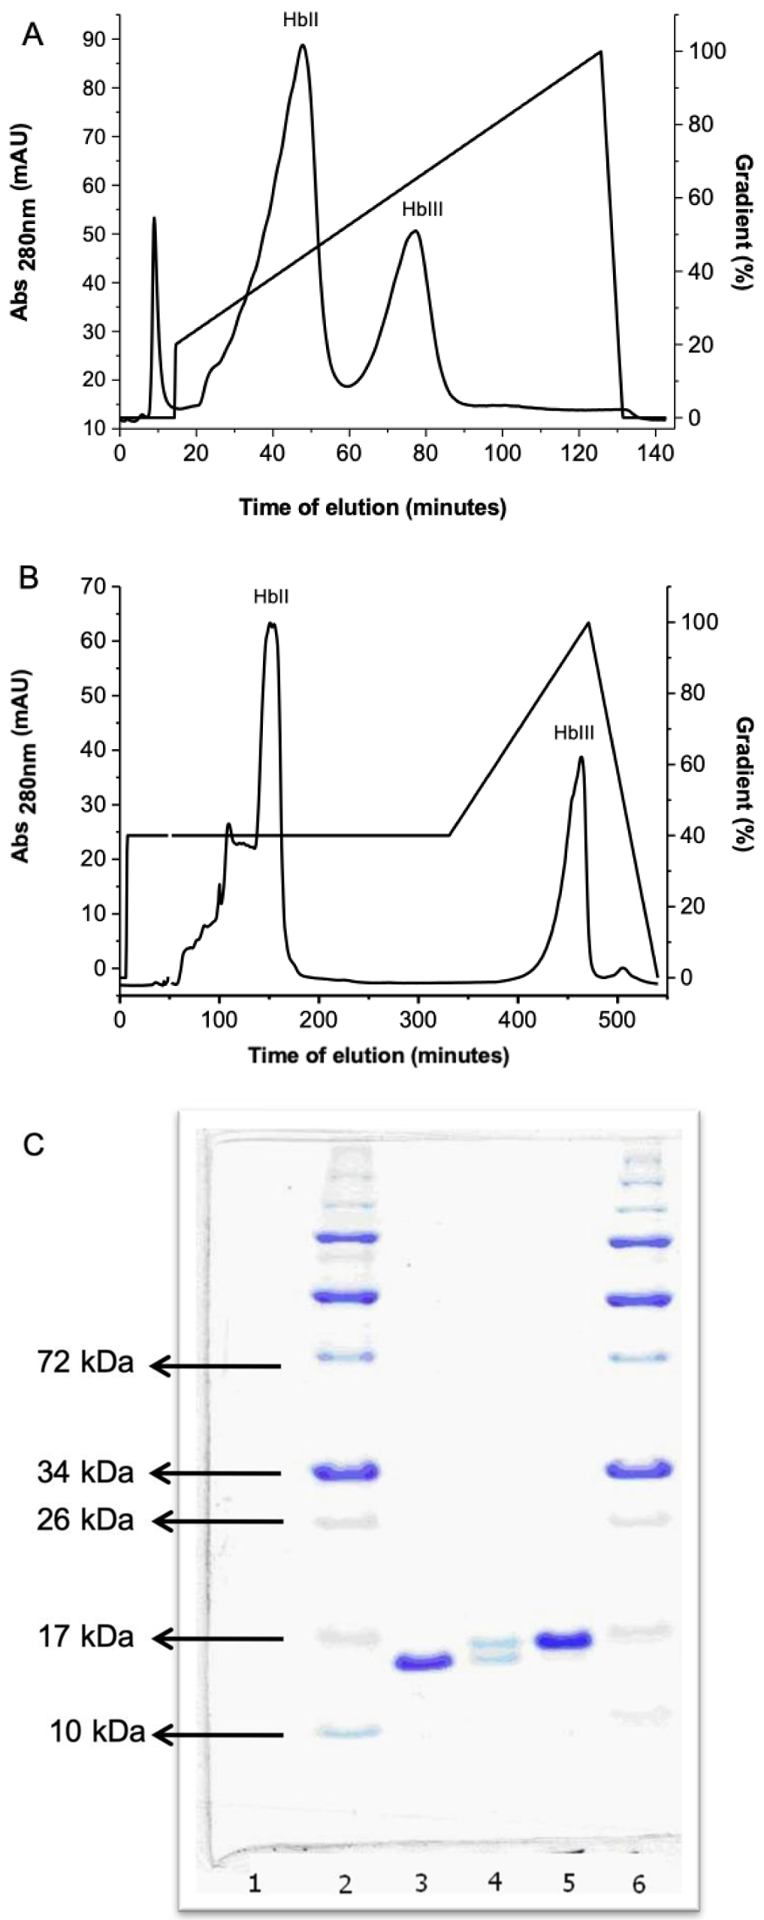
A) Ionic Exchange Chromatography (IEC) chromatogram of the complex of oxy (HbII-III) using the HiPrep 16/10 column. The components present at 45 seconds and 75 second elution times are HbII and HbIII, respectively. B) Ionic Exchange Chromatography (IEC) of Oxy(HbII-III) complex with a new column, XK 16/70 packed with Q Sepharose high performance (Q HP) matrix with a column pH of 7.5. The first peak represents the OxyHbII (150 elution time) component, and the second peak is OxyHbIII (450 elution time). C). SDS-PAGE profile for HbII and HbIII separation: lane 1 empty, lane 2 and 6 are molecular-weight markers, lane 3 HbII, lane 4 HbII-III, and lane 5 HbIII.
MS/MS sample purity confirmation
The integrity of the pure isolated Oxy-HbIII complex was also verified using a tandem MS/MS technique. The purified HbIII sample (100 μg/mL) was separated by one-dimensional electrophoresis. The band corresponding to the expected molecular weight of the HbIII was cut out and subjected to protein-digestion (Trypsin was added at a 1:20 protease:protein ratio and incubated overnight at 37 °C).. The resulting peptides were extracted with 0.1% trifluoroacetic acid (in 60% acetonitrile), dried, and purified using a zip-tip (C18 from Millipore Corp). The obtained peptides were resuspended in 0.1% formic acid in HPLC grade water16–18. Peptides were fractionated on a microcapillary RP-C18 column, followed by a ESI-LC-MS/MS system (ProteomeX system with LTQ XL) in a nano-spray configuration. Mass Spectrometric analysis was carried out using Mascot (Matrix Science, London UK; version 2.4.0), with a fragment ion mass tolerance of 0.8 Da and a parent ion tolerance of 10.0 PPM. Mascot uses the carbamidomethyl of cysteine as a fixed modification and S-carbamoyl-methyl cysteine cyclation on the n-terminus, oxidation of methionine, and acetyl of the n-terminus as a variable modification. To validate the peptide and protein identified by MS/MS we used Scaffold (version Scaffold 4.2.1, Proteome Software inc., Portland, OR). The peptide identification was accepted if they could be established at 80% or greater by the Peptide Prophet algorithm19 with Scaffold delta-mass correction. Identification of the MS/MS protein, was accepted when the protein identification could be established at greater than 90% probability and contained at least 2 identified peptides20. The protein regions that contained similar peptide sequences and could not distinguished based on MS/MS spectrometry analysis alone were grouped using the parcimony principle.
SAXS Analysis
For SAXS measurements, the OxyHbIII sample buffer was exchanged using a Superdex 200 SEC column from the original SEC buffer (50.0 mM NaH2PO4/0.5 mM EDTA at pH 7.5) to 10 mM HEPES pH 7.0. Data sets were collected at the Stanford Synchrotron Radiation Lightsource (SSRL) Small Angle X-ray Scattering (SAXS) beamline, BL4–2. The sample was prepared by an approximately 2-fold serial dilution, starting with approximately 1.1 mM (20.4 mg/mL) protein concentration in 10 mM HEPES pH 7.0. Data were collected using a model MX225-HE charge-coupled device detector (Rayonix) with a 1.7 m sample-to-detector distance and beam energy of 11 keV (wavelength, λ = 1.100 Å). SAXS data were taken in a series of 20 1-s exposures, and the results were inspected for aggregation and radiation damage. Scattering profiles were generated, after buffer subtraction, using the beamline software SasTool (http://ssrl.slac.stanford.edu/~saxs/analysis/sastool.htm). SAXS analysis was performed using a 2.8.0 ATSAS Package21. The scattering curves for each concentration without visible radiation damage were averaged using ATSAS. The final experimental scattering curve used to build our 3D surface model was generated by averaging the experimental data for all concentrations by regions. For low q (0.0–0.16), the three lowest concentrations were averaged, for middle q (0.16–0.29), the two middle concentrations were averaged, and for high q (0.29–0.51), the highest two concentrations were averaged and then merged. A 3D surface model, GNOM22 from the ATSAS suite, was used to fit the data and calculate a P(r) curve and estimate the Porod volume. Electron density was calculated by DENSS23 using the DENSSWeb online server. Twenty reconstructions were averaged together using the default slow mode. Density was displayed using UCSF ChimeraX24 using a surface representation where the threshold was set such that the enclosed volume of the surface matched the Porod volume. The Oxy (HbIII-HbIII) structure was determined upon substitution of the HbII unit by HbIII in the heterodimer, Oxy(HbII-HbIII) (PDB ID #3PT7). The homodimer scattering data were modeled and fit using the Oxy(HbIII-HbIII) homodimer and the CRYSOL© software25.
Results and Discussion
Here we present evidence for a new purification strategy that is capable of isolating the individual components of the HBII-HBIII heterodimer. As shown in Figure 1A, under the previous IEC conditions, where a linear gradient of sodium chloride concentration (50 to 180mM) in TEA buffer pH 8.3 and at T= 4°C is employed, the separation between OxyHbII and OxyHbIII is not optimal. In fact, under those conditions, only the Oxy(HbII-HbIII) heterodimer structure can be isolated and crystallized (as determined by X-ray crystallography). Therefore, a new chromatographic methodology that separates OxyHbIII from the Oxy(HbII-HbIII) dimer was developed. We employed the use of a Q Sepharose High-Performance column, a strong anion exchanger with a smaller mean bead size (34 μm), and a HiTrap Q HP pre-column. Together, these columns allowed for the complete separation of the HbII and HbIII subunits. Using this new strategy, we are able to produce excellent separation of the HbIII protein from the HbII-III complex (Figure 1B). The identity of the proteins in the resulting elution fractions were further verified by both SDS-PAGE analysis and LC-MS/MS. As shown in Figure 1C, relatively pure fractions of the individual components of the HbII-HbIII heterodimer are clearly resolved on the polyacrylamide gel using samples taken directly from the purification shown in the FPLC chromatogram (Figure 1B). The results show the HbII and HbIII SDS-PAGE profile separation The SDS-PAGE gel exhibits the purity of HbIII (lane 5) and HbII (lane 3), while this is not the case for the HbII-HbIII mixture (lane 4), which almost overlap The literature supports the separation, purification and identification of each monomer as HbIII has a high molecular weight than HbII at 18,068 Da. and 17,654 Da., respectively.4,6,7 The electrophoresis demonstrates a well-defined separation between HbIII and HbII present in lanes 5 and 3, respectively. The HbIII and HbII LC-MS/MS results (Figure 2) show a unique set of peptides for each protein, further suggesting that the individual lanes of the SDS-PAGE have only one of the desired purified proteins. However, this was not the case for the HbIII samples obtained from Figure 1A. The LC-MS/MS resulted in a mixture of HbII and HbIII, suggesting that these FPLC conditions were not sufficient to isolate HbIII. Nevertheless, the SDS-PAGE data, together with the LC-MS/MS results, strongly suggest that the new conditions result in a purification procedure that is capable of isolating HbII and HbIII from the HbII-HbIII mixture. Still, it is recommended to obtain LC-MS/MS directly from the FLPC samples to further validate HbIII and HbII purification. Table 1 shows the protein components obtained by tandem MS/MS analysis from HbIII examined using the scaffold 4 proteome software. The HbIII (OS=Phacoides pectinatus), sample 1, presents 9 exclusive unique peptides, 17 exclusive unique spectra, 31 total spectra, 82/153 amino acids (54% coverage), and 100% protein identification. Sample 2 for HbIII presents 10 exclusive unique peptides, 18 exclusive unique spectra, 32 total spectra, 84/153 amino acids (55% coverage), and 100% protein identification. HbII LC-MS/MS sequence data indicates 7 exclusive unique peptides, 15 exclusive unique spectra, 20 total spectra, 84/151 amino acids (56% coverage)”.
Figure 2.
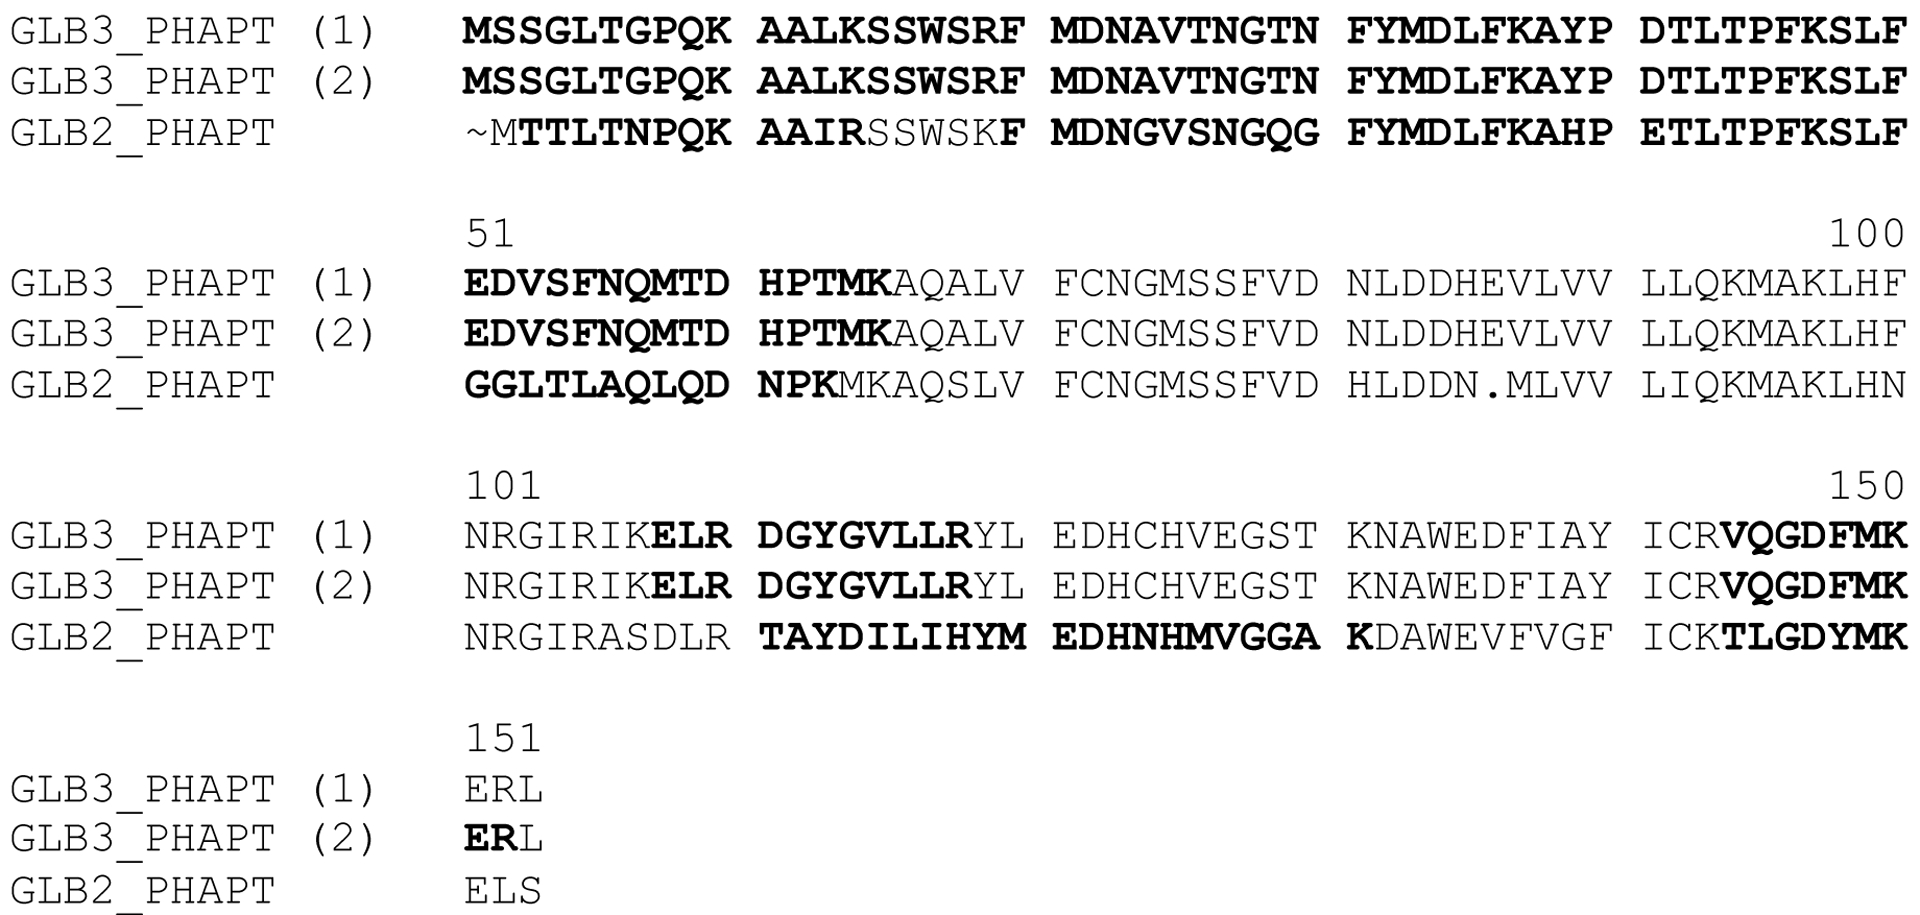
Clustal Omega-aligned peptide sequences of HbIII and HbII, identified by the Accession number GLB3_PHAPT and GLB2_PHAPT. Numbers in parenthesis (1) and (2) are two HbIII LC-MS/MS data sets. Black characters indicate the HbIII, and HbII LC-MS/MS sequence data obtain for these proteins
Table 1.
Protein components obtained by MS/MS analysis from HbIII and HbII examined using the scaffold 4 proteome software.
| Proteins | Accession number | Molecular Weight kDa | Number of peptides | |
|---|---|---|---|---|
| Sample 1 | Sample 2 | |||
| Hemoglobin-3 OS = Phacoides pectinatus PE = 1 SV = 2 | GLB3_PHAPT | 18 | 31 | 32 |
| Hemoglobin-2 OS = Phacoides pectinatus | GLB2_PHAPT | 17 | 20 | N/A |
| Keratin, type I cytoskeletal 10 OS = Homo sapiens GN=KRT10 PE = 1 SV = 6 | K1C10_HUMAN | 59 | 0 | 3 |
| Keratin, type I cytoskeletal 9 OS = Homo sapiens GN=KRT9 PE = 1 SV = 3 | K1C9_HUMAN | 62 | 2 | 1 |
| Phosphate binding protein OS= Unknown prokaryotic organism PE =1 SV =1 | PHBP_UNKP | 39 | 3 | 2 |
| Trypsin OS=Sus scrofa PE=1 SV=1 | TRYP_PIG | 24 | 6 | 4 |
In order to demonstrate that the purified HbIII is indeed still forming a dimer in solution and further characterize the structural properties of HbIII, SAXS analysis was performed on the purified sample. In Figure 3, we show the scattering curve for OxyHbIII as a function of the sample concentration. At higher protein concentrations, there is a downturn in the low Q region of the scattering curve which is characteristic of inter-particle repulsion26. The presence of this distortive phenomenon on the scattering curve as a function of concentration suggests there is present a higher molecular weight oligomer in the solution. Figures 4A–C show the relationship of sample concentration and the calculated I0, Porod’s molecular weight (MWPorod), and oligomer fraction, respectively. As shown in Figures 4A and 4B, there is a directly proportional relationship between the calculated I0 and MWPorod and the sample concentration, respectively. I0 is directly related to the size of the particle that is scattering the X-rays. An increase in I0/c as a concentration function suggests the presence of inter-particle repulsion and, potentially, more than one size particle in solution26–28. Examining MWPorod aims to determine the type of oligomers present in the solution. An average of MWPorod from 1.6 mg/mL to 5.2 mg/mL (0.090–0.3 mM) sample concentration corresponds to 36,226 Da. The reported MW for the HbIII monomer is 18,068 Da without the O26,7 and 18,084 Da with the O2 ligand. The results suggest that the calculated value corresponds to that of aHbIII dimer. Individual mass estimate values at each concentration and the average agree within the expected experimental error of approximately 10%26. At a higher sample concentration, the MWPorod increases and represents the dimer’s average MW in addition to the presences of a higher MW oligomer.
Figure 3.
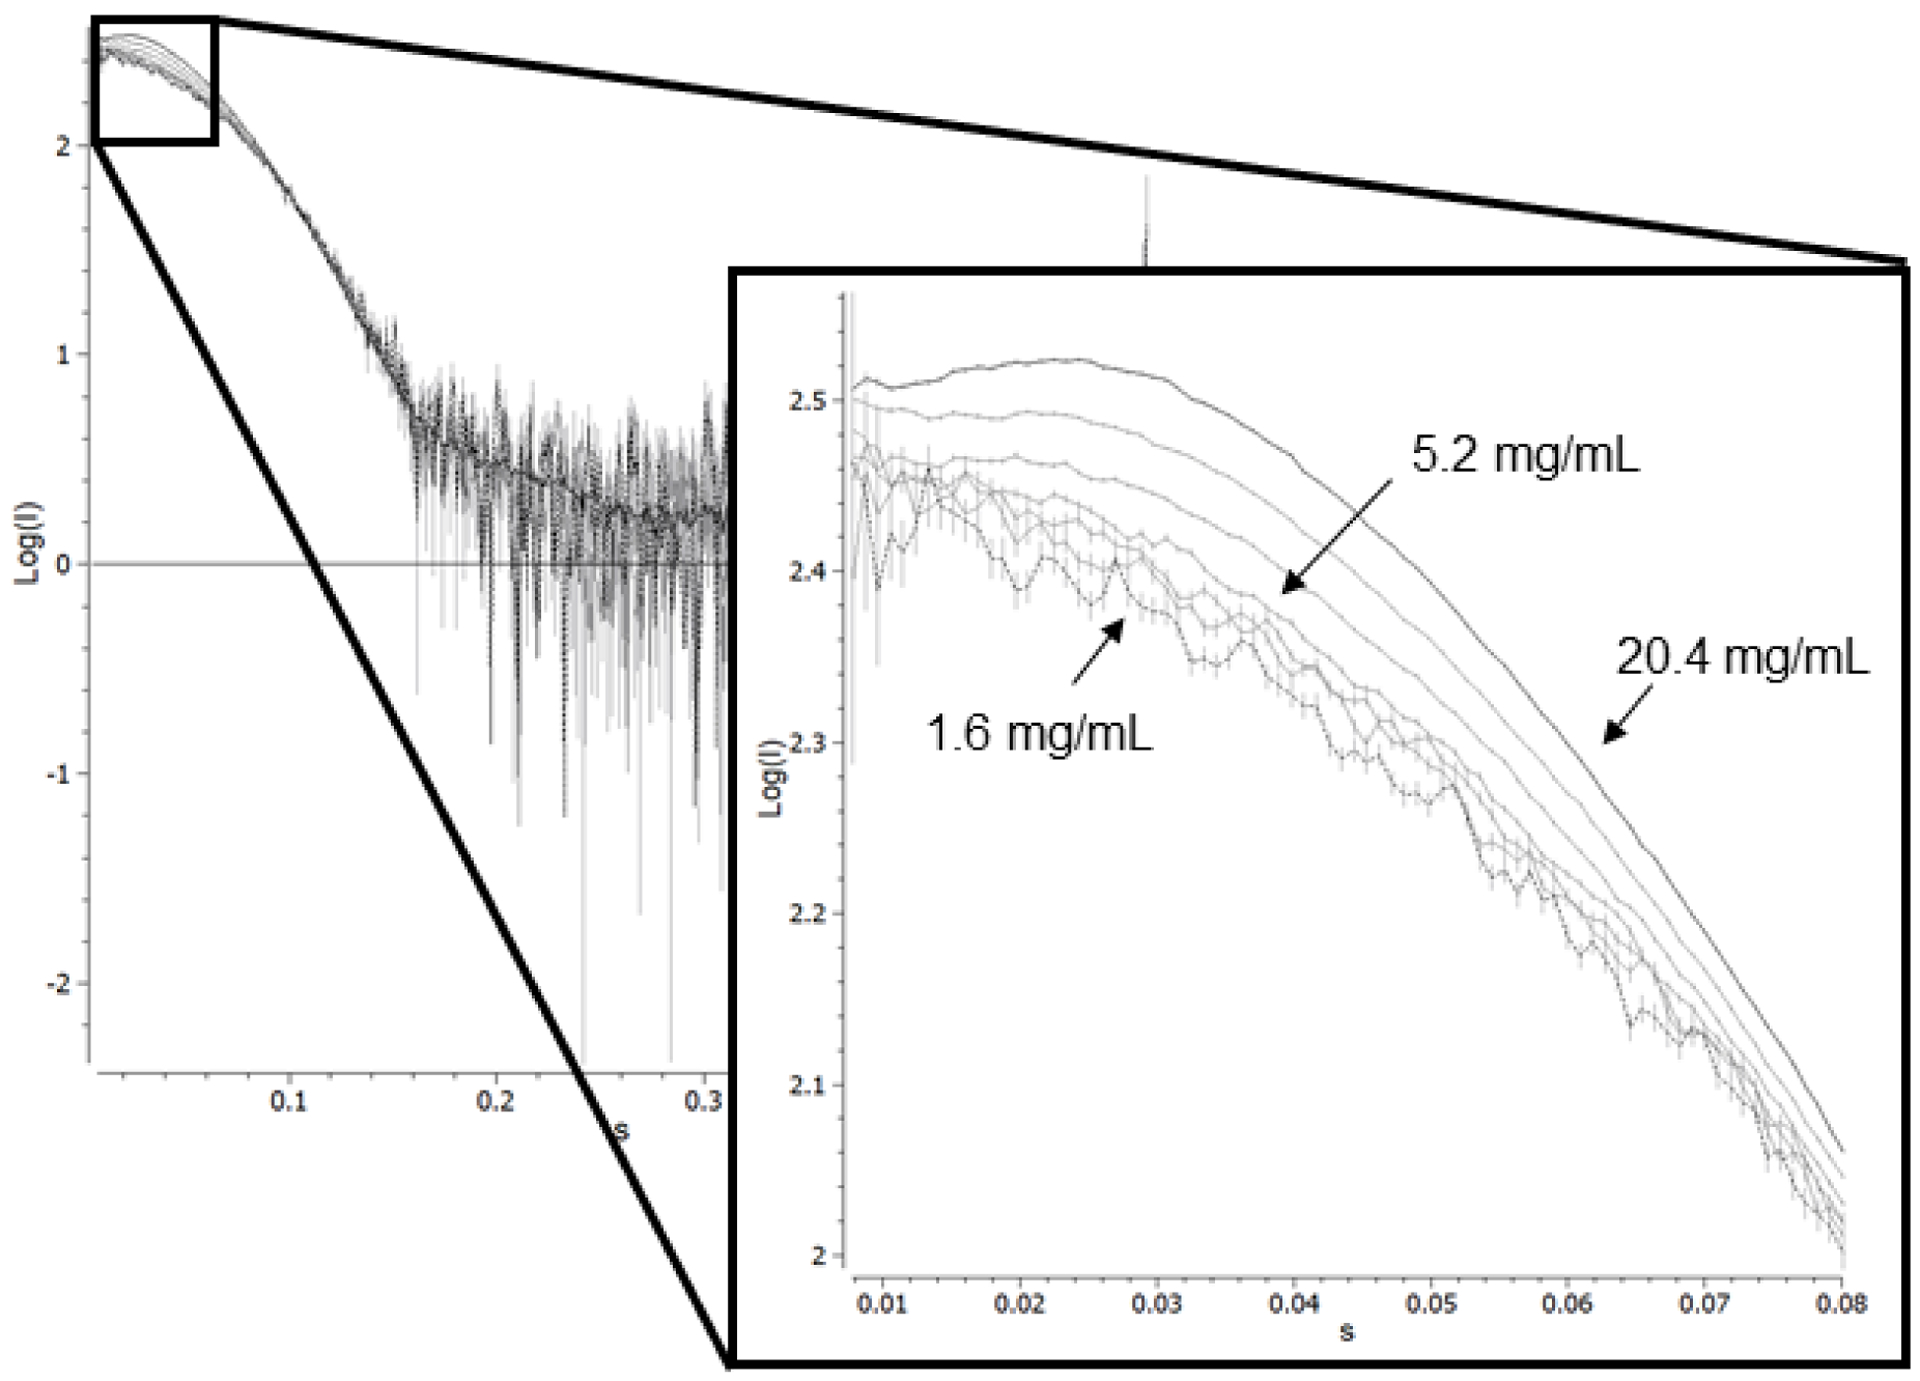
Scattering curves for OxyHbIII as a function of concentration. The scattering curves were determined by serial dilution starting with approx. 20.4 mg/mL (black solid line) and ending at 1.6 mg/mL (black dashed line) protein concentration in 10 mM HEPES pH 7.0. X-ray scattering data collected at SSRL. Inset: Expansion of the low q region. At higher protein concentrations, there is a downturn in the scattering curve characteristic of inter-particle repulsion.
Figure 4.
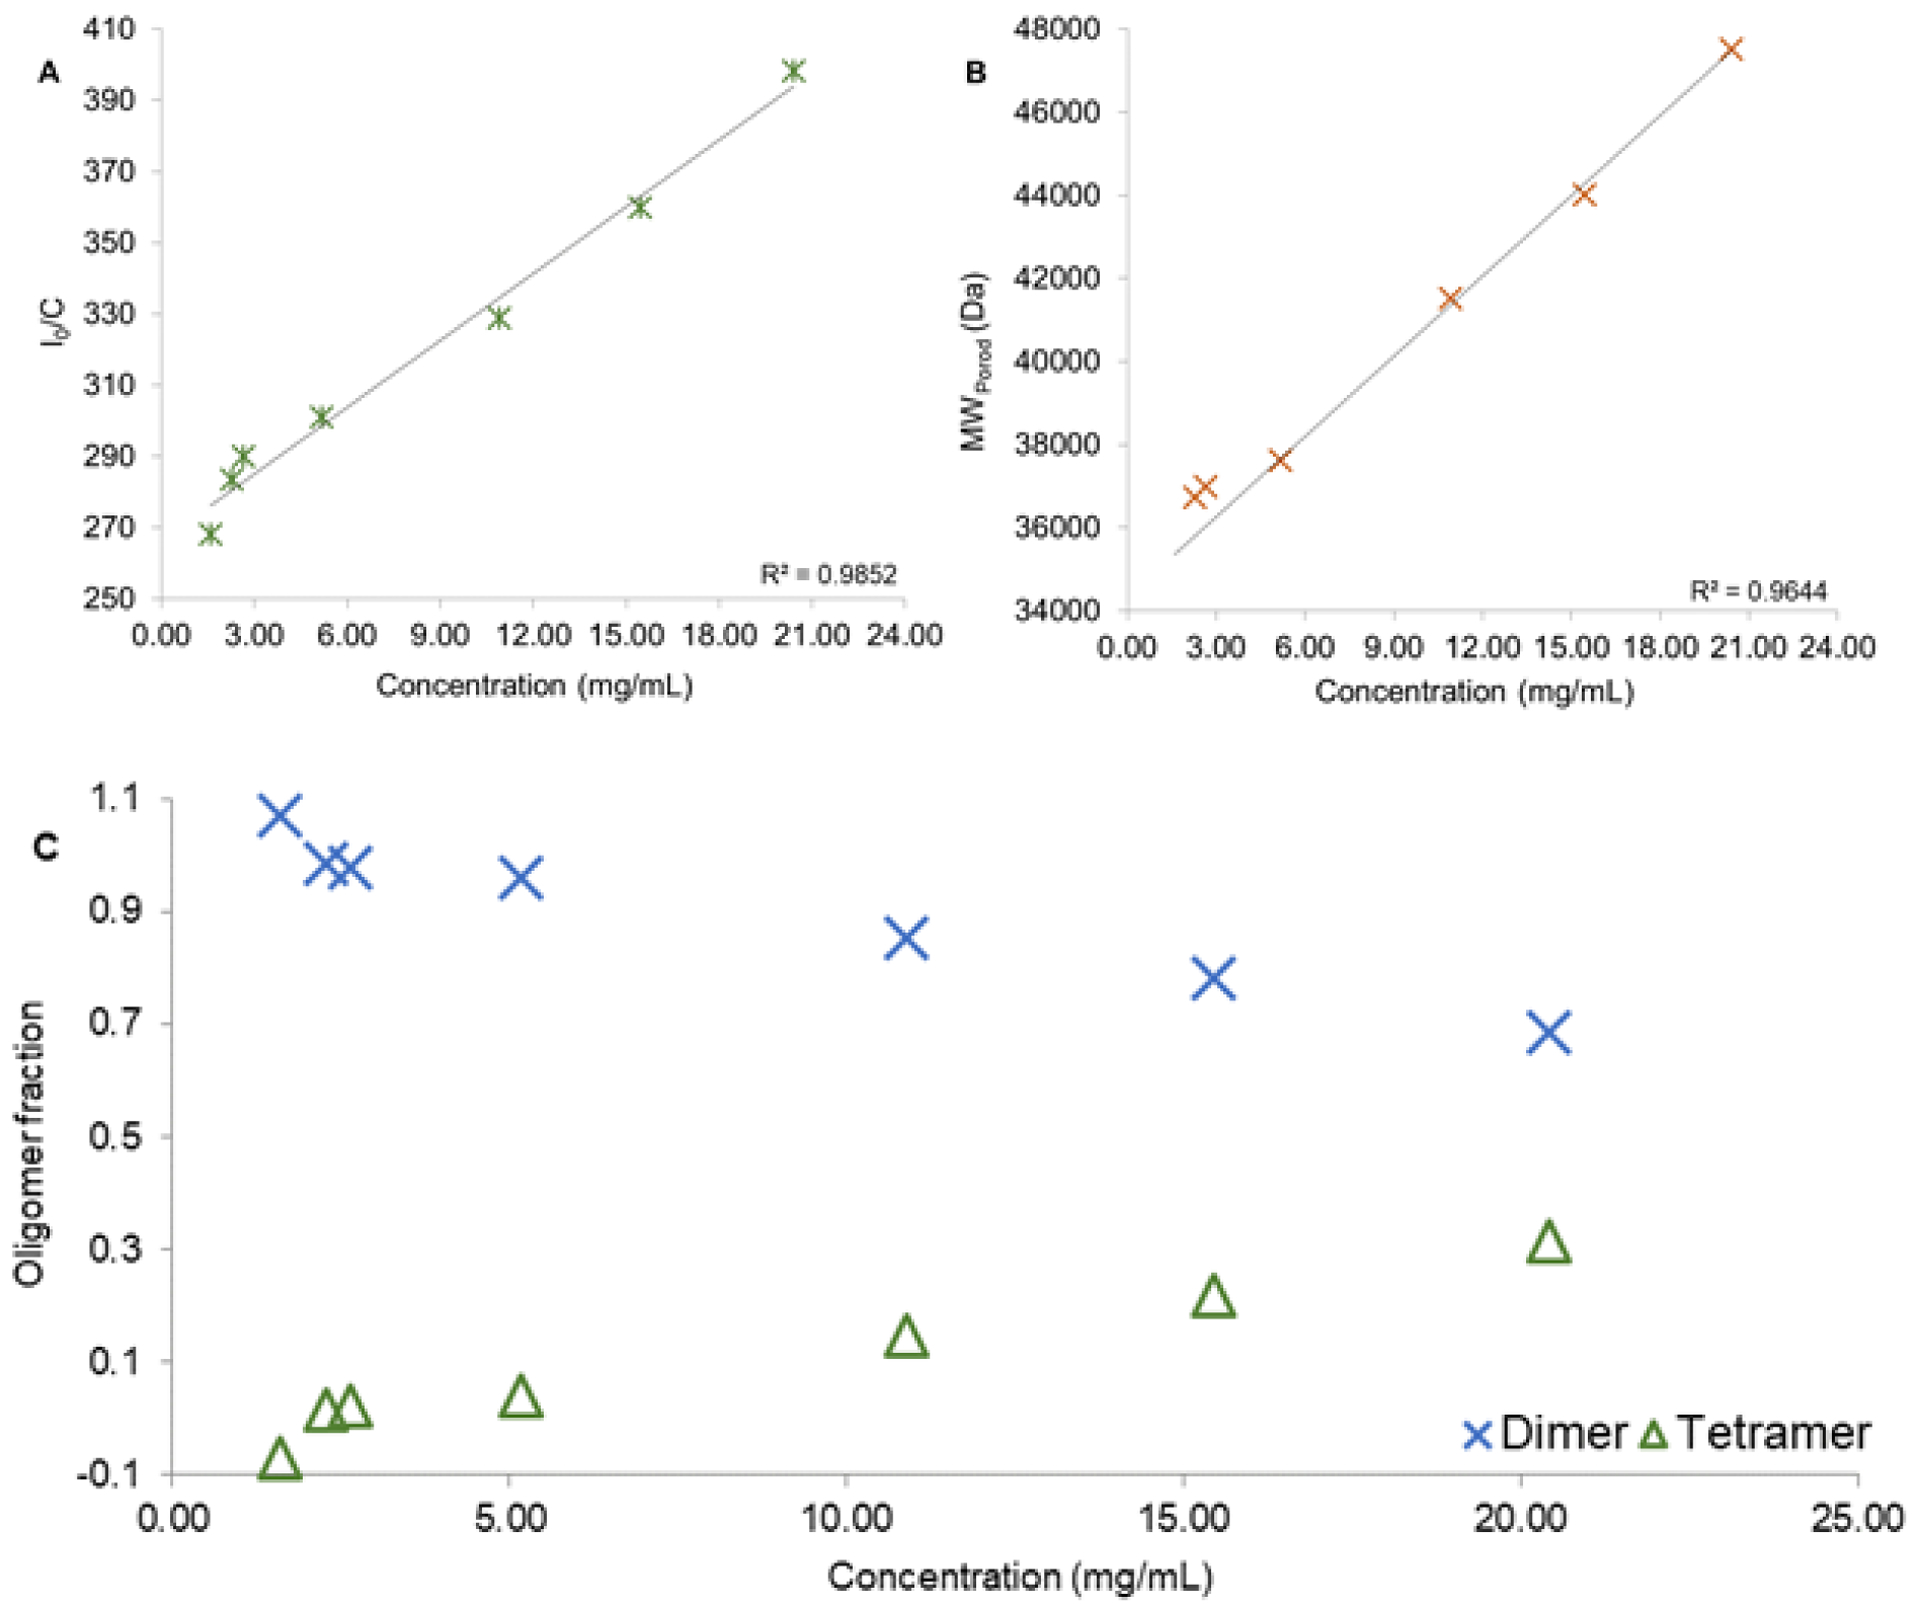
OxyHbIII plausible oligomers (dimer and tetramer) as a function of concentration. A) Relationship of I0/c with sample concentration. B) Calculated Porod’s molecular weight (MWPorod) relationship to sampling concentration. C) Oligomer fraction in solution as a function of sample concentration. Blue ‘X’ represents the dimer population, while the green triangle represents the tetramer.
Kraus and Wittenberg (1990) determined the apparent MW of HbIII by gel filtration4, where, HbIII, at 35.5 – 71.0 mg/mL (2 – 4 mM) is predominately a dimer (most prominent elution peak), with a tetramer present in small amounts. At lower concentration, down to ~ 0.1 mg/mL heme concentration, a monomer was suggested to be present. Based on this knowledge, a plausible tetramer model can be generated to evaluate its contribution to the experimental scattering curves presented here as a function of the HbIII concentration. The HbIII tetrameric structure was constructed using the HbIII homodimer and its analogy HbII-HbIII (3PT7)15. The theoretical scattering curve for the tetrameric structure was determined with CRYSOL©. Figure 4C shows each oligomer’s fractions based on the calculated MW as they change as a concentration function. The fraction of the dimer (blue ‘X’s) has an inverse relationship to the protein concentration, while the tetramer (green triangles) has a direct one. The results show that, at the different concentrations (1.6 – 20.4 mg/mL), the Oxy(HbIII-HbIII) homodimer is always predominant. At the same time, the tetrameric HbIII derivative presence is limited only to higher HbIII concentrations.
Under these experimental conditions, the analysis permitted the quantification of the fractions. Nevertheless, at physiological hemoglobin concentrations found in the clam’s gill, 1.5 mM (~25.0 mg/mL) total heme, around 1/3 of total heme corresponds to HbIII (9.2 mg/mL)4. Consequently, if HbIII exists on its own, it will be predominantly a homodimeric structure. Therefore, the results support the hypothesis that HbIII tends toward a functional dimer instead of a tetrameric structure. A similar analogy was generated for the HbII-HbIII dimer instead of its non-interactive tetramer because Hill’s n values were always a unity4. Figure 5A shows the fitting of the intensity curves for OxyHbIII at 5.2 mg/mL. The differences in the scattering curve at low q are small. As q increases, the scattering data deviated from the fit curve, as is expected for low Q data. The apparent higher-noise in the high Q region does not affect the determination of the Rg and Dmax values for OxyHbIII. Figures 5B and 5C show the Guinier plot and the p(r) function, respectively, from which the Rg and Dmax values were calculated. The Guinier plot should be linear for a globular protein, indicating no detectable aggregation, and the p(r) function a symmetric bell-shaped curve26. The OxyHbIII data meet both requirements. The Rg value for OxyHbIII was 22.05 (± 0.06) and 22.14, as determined by Guinier approximation and the p(r) function, respectively, being in good agreement between them.
Figure 5:
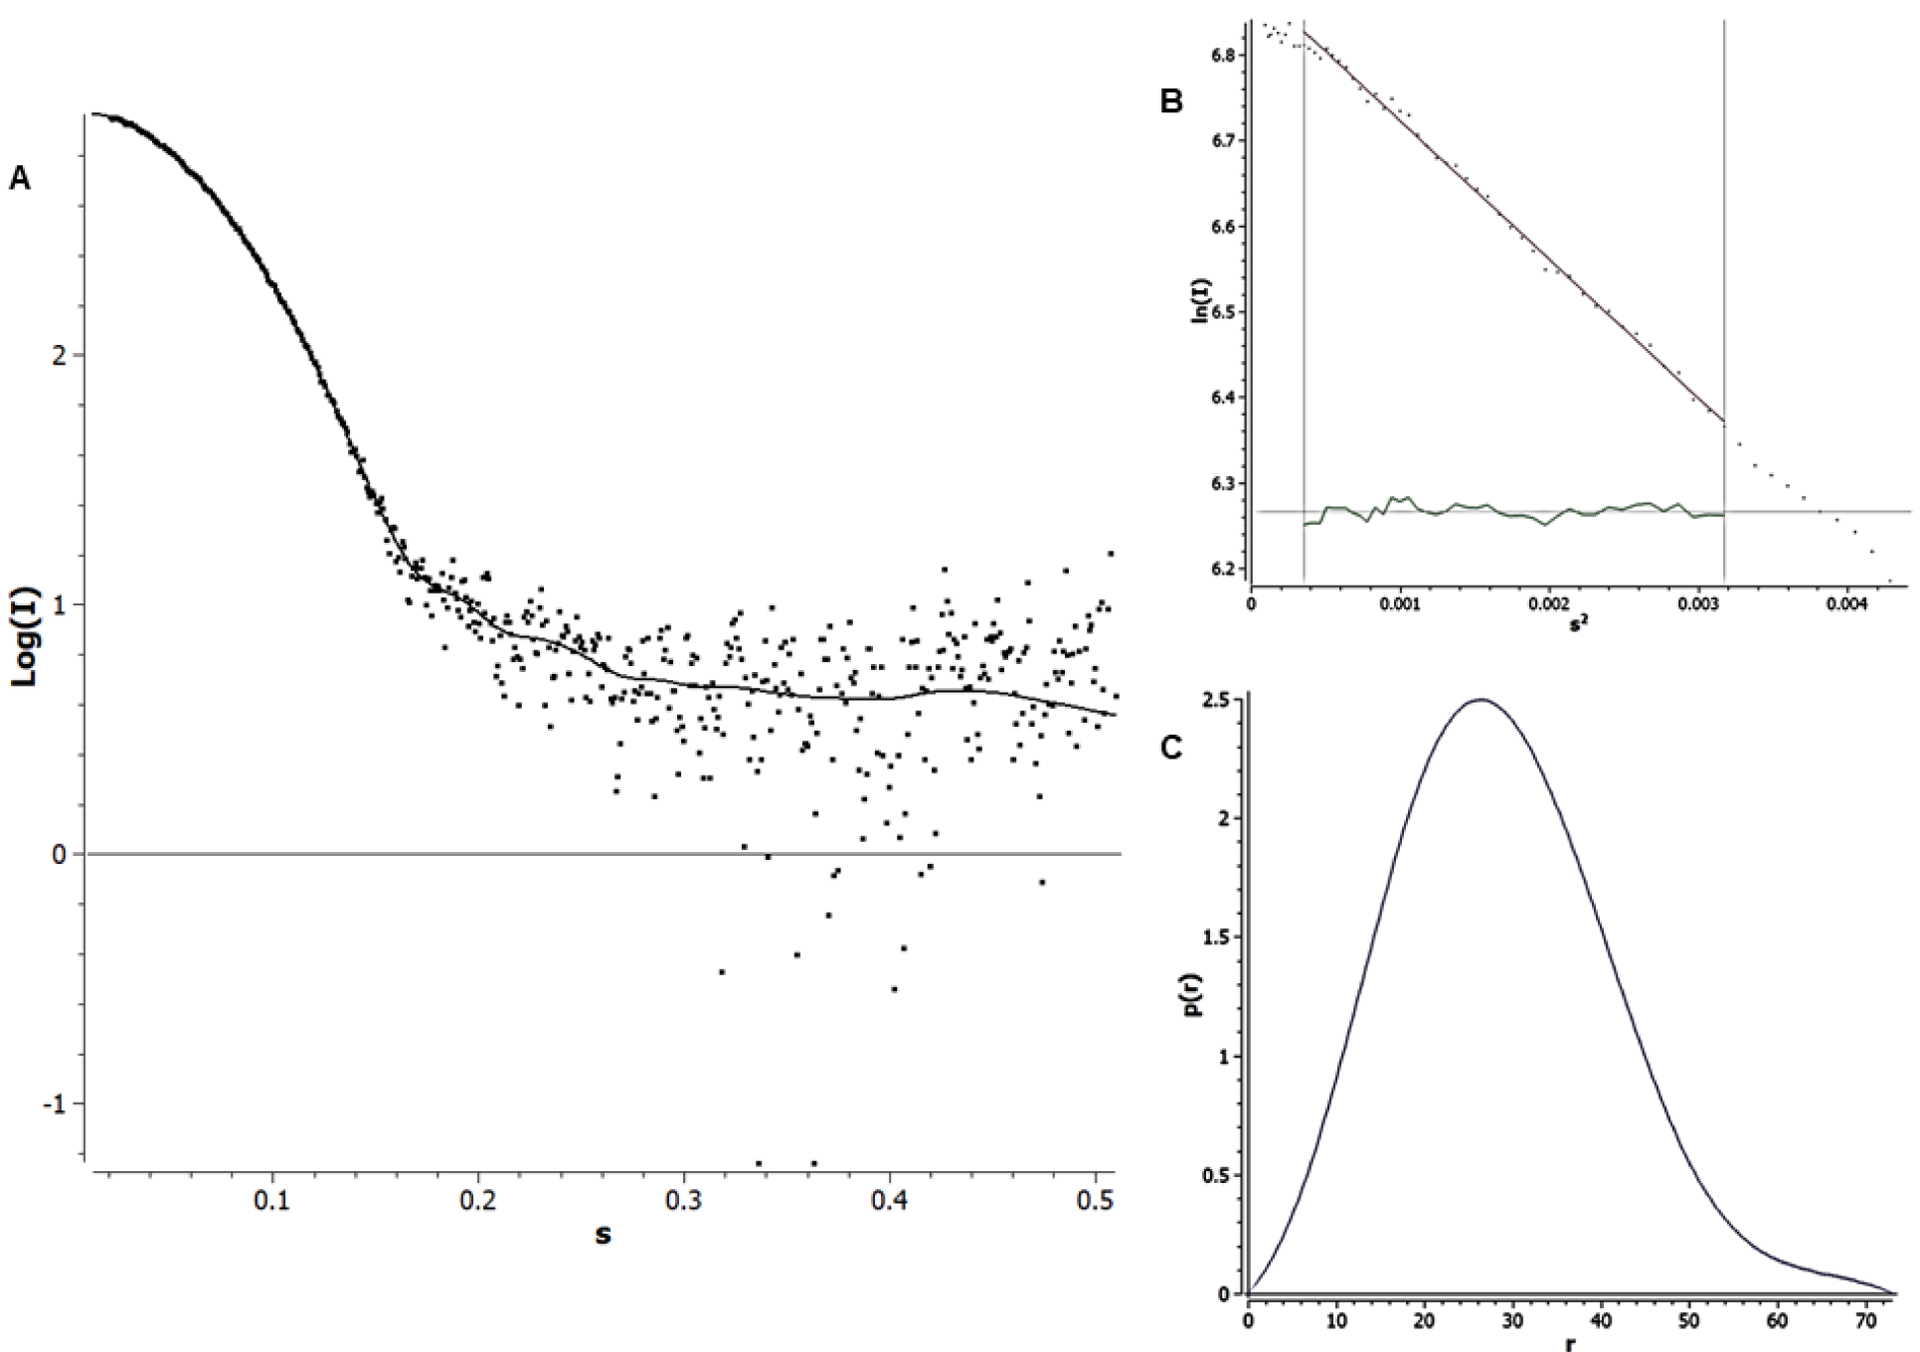
SAXS analysis of OxyHbIII at 5.2 mg/mL in 10 mM HEPES pH 7. A) Experimental scattering curve (red dots) and GNOM fitting (solid line). B) Guinier plot shows no deviation in linearity, and C) Pair-distance distribution function: p(r) shows the bell-shaped form expected for a globular protein.
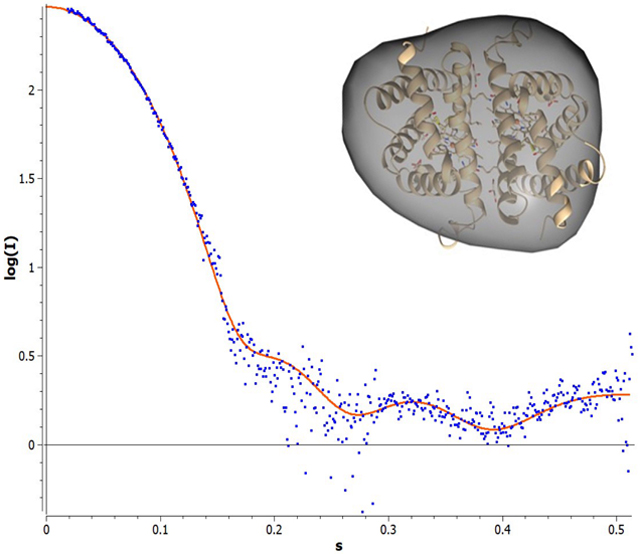
The serial protein dilution allowed for the data analysis and the shape reconstruction with negligible inter-particle effects. Concentrations within the series that were associated with an unfavorable interparticle effects were omitted from the analysis. The experimental curve was fit to the model (Figure 6) and was calculated as previously described, resulting in an Rg and Dmax of 21.09 and 62.3 Å, respectively. The theoretical HbIII model was built as described in the Methodology section, and its theoretical scattering profile was generated in CRYSOL©. The χ2 value for this fit is 4.10, demonstrating an excellent analytical fit between the experimental and predicted theoretical curves of the dimer model. An envelope was calculated from the experimental data (Figure 7), as described in the methods, and reveals a low-resolution structural envelope for the OxyHbIII homodimer structure. SAXS does not afford the resolution required to differentiate between the homo and heterodimers structures, however the model suggests that HbIII forms approximately the same interface contacts as the HbII monomer to form the dimeric oligomer, yielding a similar overall size and shape.
Figure 6:
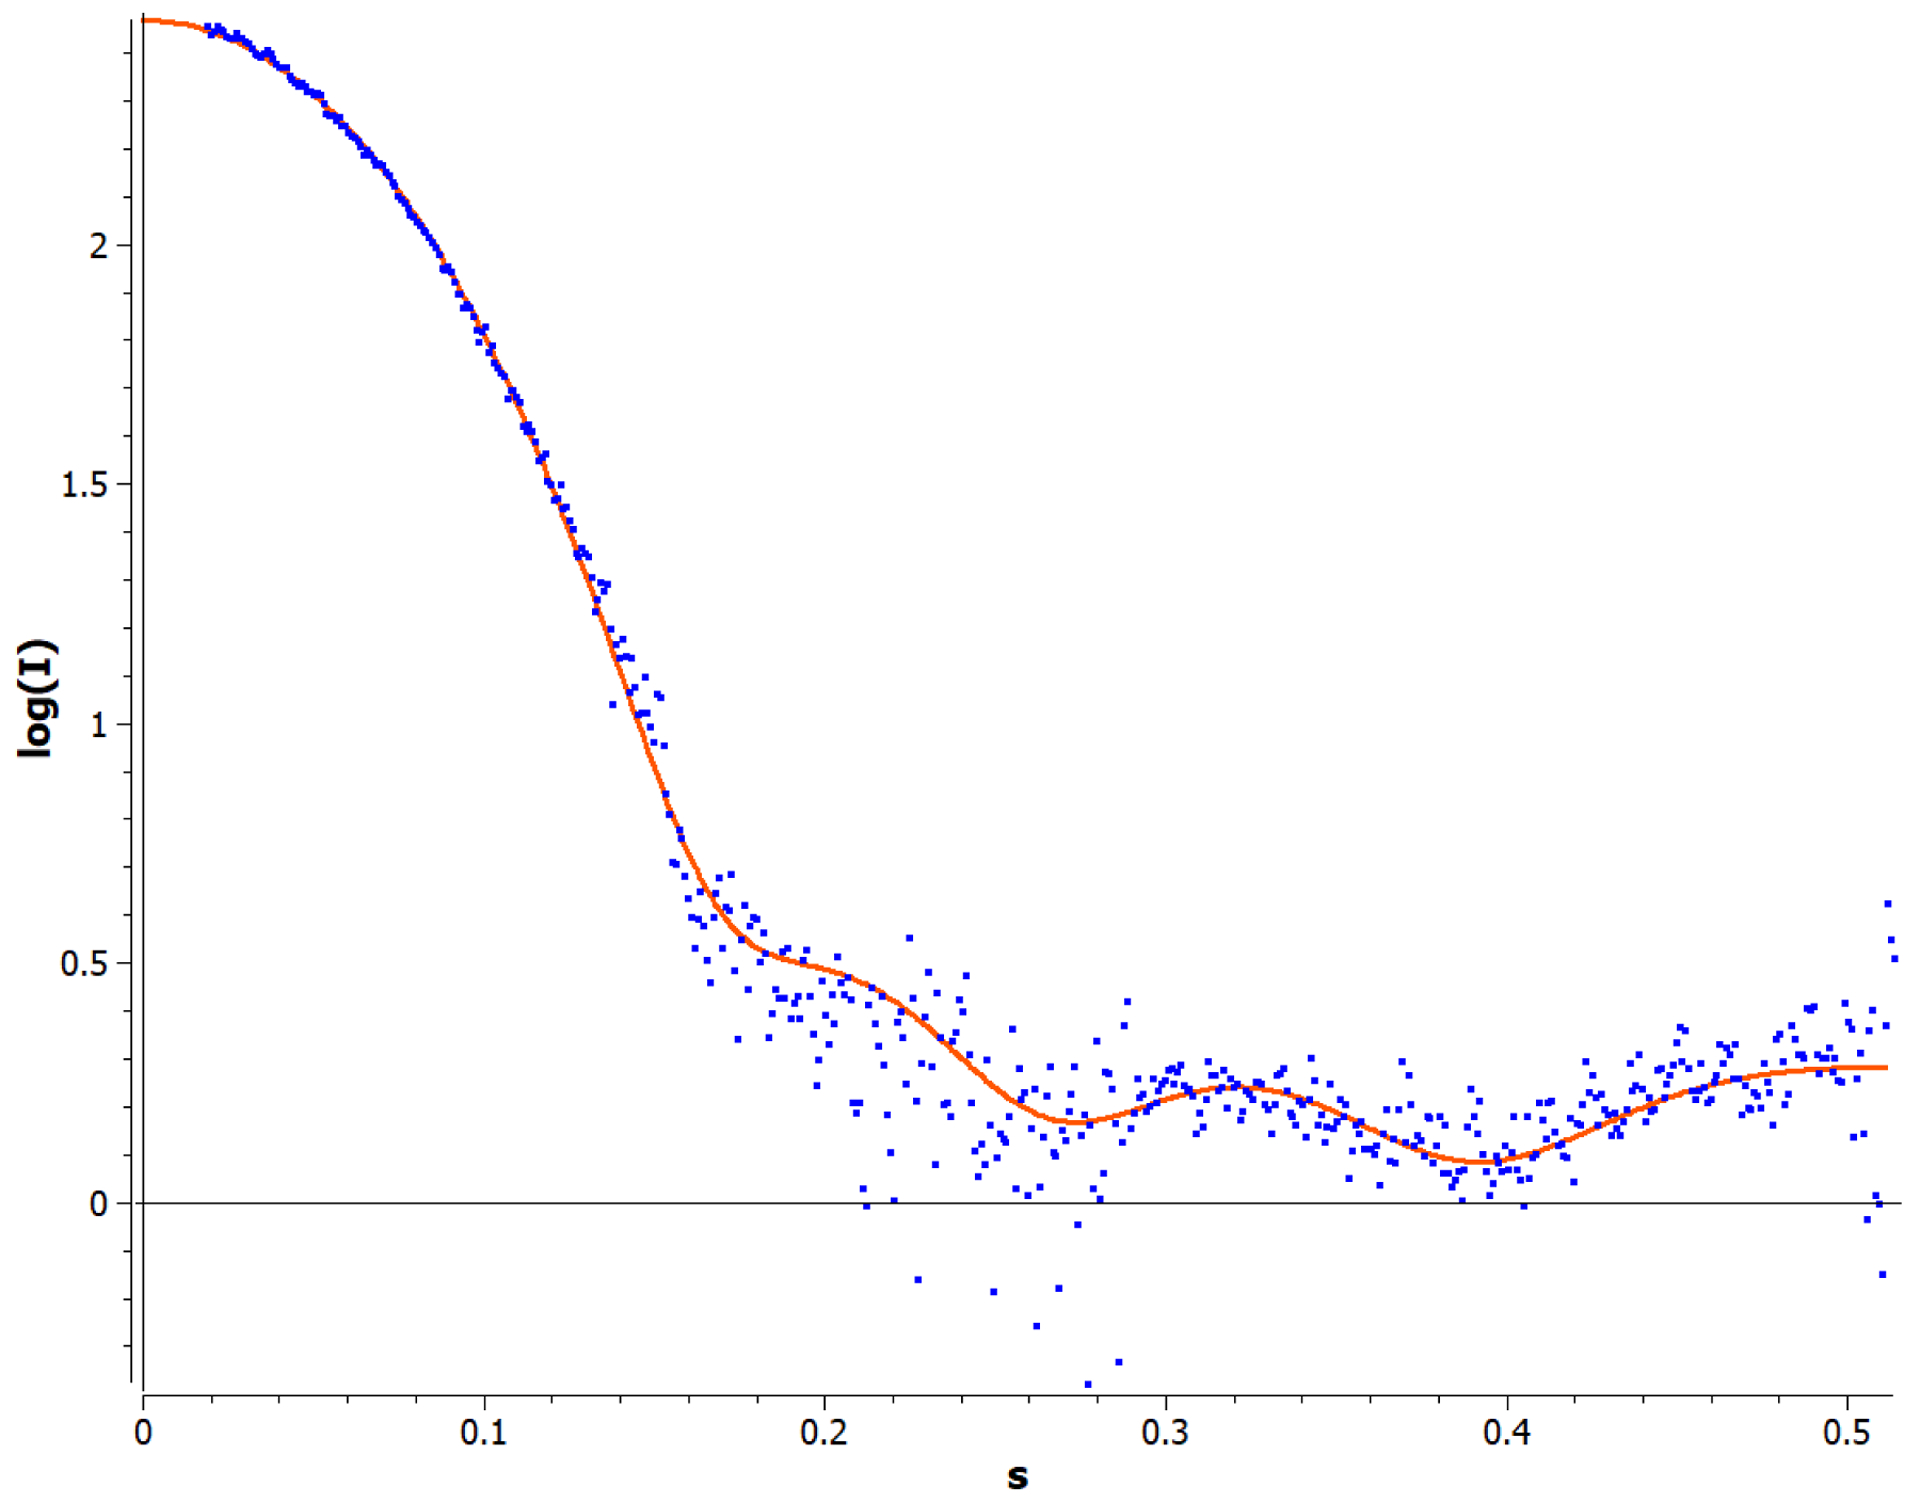
Comparison of the average experimental scattering curves (dots), as described in the methodology section, with the OxyHbIII homodimer theoretical dimer model generated by CRYSOL© (solid line).
Figure 7.
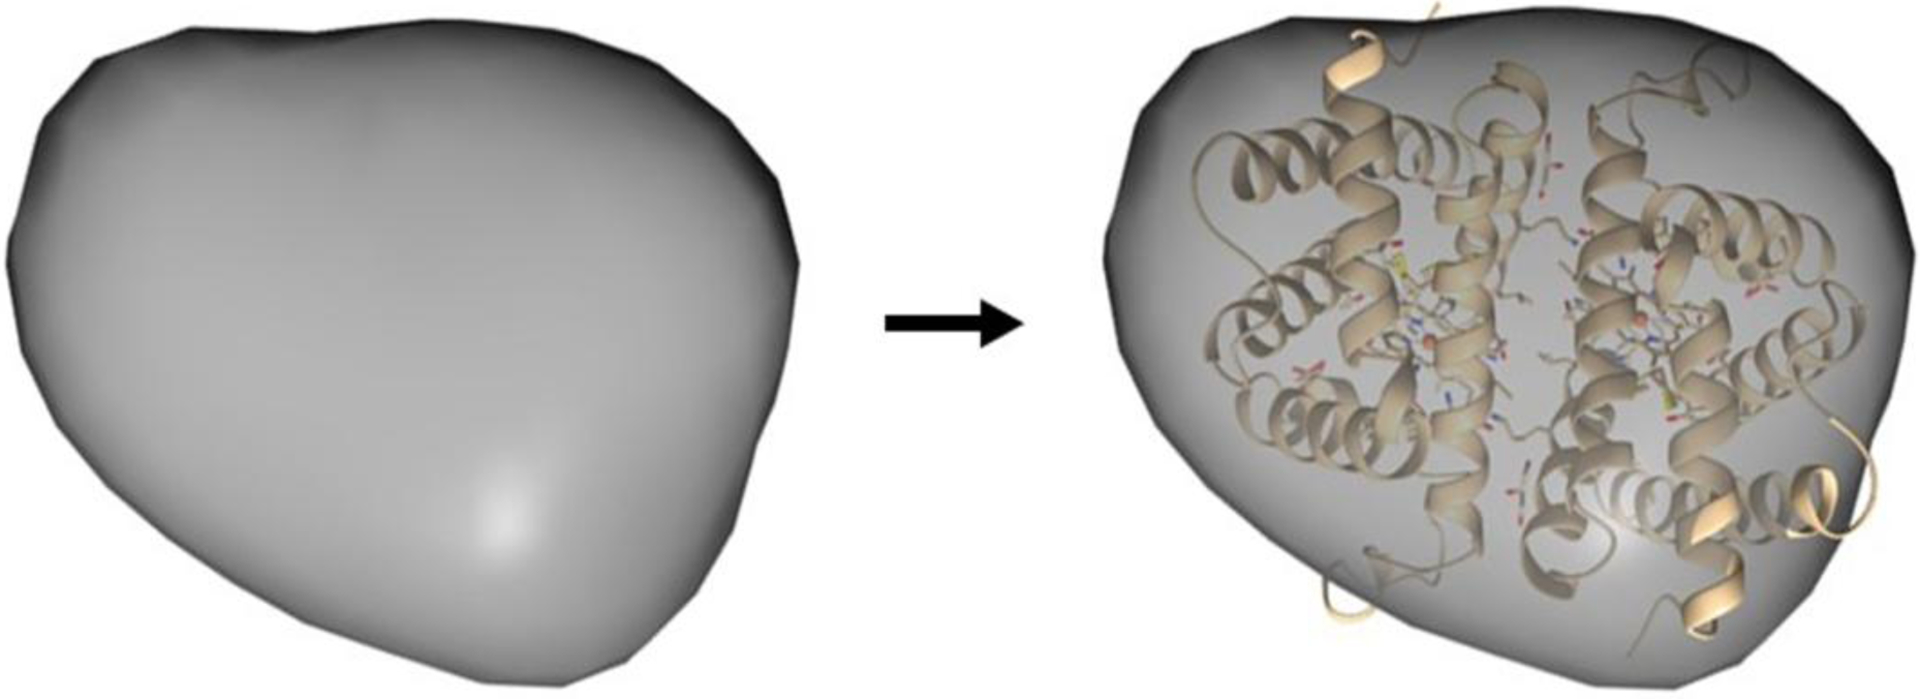
Three-dimensional structural envelope for Oxy(HbIII-HbIII) homodimer obtained by DENSSweb, the theoretical HbIII-HbIII model was built, as described in the Methodology section.
Even though the Oxy(HbIII-HbIII) is the predominant structure in solution (~25.0 mg/mL) total heme, around 1/3 of total heme corresponds to HbIII (9.2 mg/mL)4, at non-physiological HbIII concentrations, the presence of HbIII tetrameric structure is plausible. This tetrameric assembly suggests two dimers related by symmetry. In the dark cytoplasmic patches5 of L. pectinata, HbIII is in the presence of HbII, which self-associate to form a heterodimer. This heterodimer was previously suggested to be the active oxygen reactive protein4,29 and forms a non-functional tetramer as a function of concentration4. Furthermore, protein expression analysis using L. pectinata’s hemoglobin mRNA, compared to the18S rRNA of the clam, showed HbI, HbII and HbIII are highly expressed in ctenidia. In contrast, foot, muscle, mantle, and visceral mass tissues all had lower expression levels. There was no statistical difference in hemoglobin presence within tissues, supporting the formation of HbII-HbII, HbIII-HbIII, and HbII-HbIII dimers30. However, in the clam’s internal environment, the H2S concentration has been correlated with Hb’s expression levels30. Therefore, the hydrogen sulfide concentration is a factor regulating the expression of HbII and HbIII and may also control the formation of both dimeric and tetrameric species. Another potential factor regulating the protein oligomerization is the cysteine-rich protein (CRP) present in the clam3,4,29,30. However, this is an open question, and additional studies are necessary to reveal the role of the CRP in this pathway.
Conclusion
Here we report a new methodology to facilitate the chromatographic separation of Oxy(HbIII-HbIII) from the Oxy(HbII-HbIII) complex. The identity and purity of the final purified HbIII homodimer product was confirmed by both SDS-PAGE and LC-MS/MS. This new process has allowed us to define the overall structure of OxyHbIII in solution using SAXS measurements at concentrations from 1.6 mg/mL to 20.4 mg/mL. The results indicate that the OxyHbIII species is predominantly present as a homodimer, Oxy(HbIII-HbIII). These data fully support that the environment present within Lucina pectinata defines the hemoglobin III oligomerization states and the nature of its dimeric oxygen transport.
Acknowledgments
This work was supported in part by the National Science Foundation (NSF) Science and Technology Center (STC) “BioXFEL” through award STC-1231306 and the SLOAN Minority Ph. D. Program NACME Grant 2010-3-02. Use of SSRL, SLAC National Accelerator Laboratory, is supported by the U.S. Department of Energy, Office of Science, and Office of Basic Energy Sciences under Contract No. DE-AC02-76SF00515. The SSRL Structural Molecular Biology Program is supported by the DOE Office of Biological and Environmental Research. We acknowledge using the High-Throughput Crystallization Screening Center and the Hauptman-Woodward Medical Institute in Buffalo, New York. National Institutes of Health-INBRE PR (P20GM103475, to J.L.G.). This publication’s contents are solely the authors’ responsibility and do not necessarily represent NIGMS or NIH’s official views.
Footnotes
Conflict of interest statement: All authors disclose that they do not have any conflicts of interest to declare.
Data Availability: Data supporting these findings is available upon request to the corresponding author.
References
- 1.Taylor JD, Glover EA, Functional anatomy, chemosymbiosis and evolution of the Lucinidae, Geol. Soc. London 177 (2000) 207–225. 10.1144/GSL.SP.2000.177.01.12. [DOI] [Google Scholar]
- 2.Read KRH, The Characterization of the Hemoglobins of the Bivalve Mollusc Phacoides pectinatus, Comp. Biochem. Physiol 15 (1965) 137–158. [DOI] [PubMed] [Google Scholar]
- 3.Read KRH, The Hemoglobin of the Bivalved Mollusc, Phacoides Pectinatus Gmelin, Biol. Bull 123 (1962) 605–617. http://www.biolbull.org/content/123/3/605.abstract. [Google Scholar]
- 4.Kraus D, Wittenberg JB, Hemoglobins of the Lucina pectinata/Bacteria Symbiosis I. Molecular Properties, Kinetics and Equilibria Of Reactions With Ligands, J. Biol. Chem l265 (1990) 16043–16053. [PubMed] [Google Scholar]
- 5.Frenkiel L, Gros O, Mouëza M, Gill structure in Lucina pectinata (Bivalvia: Lucinidae) with reference to hemoglobin in bivalves with symbiotic sulphur-oxidizing bacteria, Mar. Biol 125 (1996) 511–524. 10.1007/BF00353264. [DOI] [Google Scholar]
- 6.Hockenhull-Johnson JD, Stern MS, Wittenberg JB, Vinogradov SN, Kapp OH, Walz DA, The amino acid sequence of hemoglobin III from the symbiont-harboring clam Lucina pectinata, J. Protein Chem 12 (1993) 261–277. 10.1007/BF01028189. [DOI] [PubMed] [Google Scholar]
- 7.Rivera L, López-Garriga J, Cadilla CL, Characterization of the full length mRNA coding for Lucina pectinata HbIII revealed an alternative polyadenylation site, Gene. 410 (2008) 122–128. 10.1016/j.gene.2007.12.005. [DOI] [PMC free article] [PubMed] [Google Scholar]
- 8.Pietri R, Granell L, Cruz A, De Jesús W, Lewis A, Leon R, Cadilla CL, Garriga JL, Tyrosine B10 and heme-ligand interactions of Lucina pectinata hemoglobin II: Control of heme reactivity, Biochim. Biophys. Acta - Proteins Proteomics 1747 (2005) 195–203. 10.1016/j.bbapap.2004.11.005. [DOI] [PubMed] [Google Scholar]
- 9.Gavira JA, Camara-Artigas A, De Jesús-Bonilla W, López-Garriga J, Lewis A, Pietri R, Yeh SR, Cadilla CL, García-Ruiz JM, Structure and ligand selection of hemoglobin II from Lucina pectinata, J. Biol. Chem 283 (2008) 9414–9423. 10.1074/jbc.M705026200. [DOI] [PMC free article] [PubMed] [Google Scholar]
- 10.Bonaventura C, Henkens R, De Jesus-Bonilla W, Lopez-Garriga J, Jia Y, Alayash AI, Siburt CJP, Crumbliss AL, Extreme differences between Hemoglobins I and II of the Clam Lucina pectinalis in their reactions with nitrite, Biochim. Biophys. Acta - Proteins Proteomics 1804 (2010) 1988–1995. 10.1016/j.bbapap.2010.06.016. [DOI] [PMC free article] [PubMed] [Google Scholar]
- 11.Kemling N, Kraus DW, Hockenhull-Johnson JD, Wittenberg JB, Vinogradov SN, Walz DA, Edwards BFP, Martin PD, Crystallization of a complex of hemoglobin component II and III of the symbiont-harboring clam Lucina pectinata, J. Mol. Biol 222 (1991) 463–464. 10.1016/0022-2836(91)90489-S. [DOI] [PubMed] [Google Scholar]
- 12.Doyle MA, Vitali J, Wittenberg JB, Vinogradov SN, Walz DA, Edwards BFP, Martin PD, Crystallization of hemoglobins II and III of the symbiont-harboring clam Lucina pectinata, Acta Crystallogr. Sect. D, Biol. Crystallogr 50 (1994) 757–759. 10.1107/S0907444994002556. [DOI] [PubMed] [Google Scholar]
- 13.Gavira JA, De Jesus W, Camara-Artigas A, López-Garriga J, García-Ruiz JM, Capillary crystallization and molecular-replacement solution of haemoglobin II from the clam Lucina pectinata, Acta Crystallogr. Sect. F Struct. Biol. Cryst. Commun 62 (2006) 196–199. 10.1107/S1744309106002648. [DOI] [PMC free article] [PubMed] [Google Scholar]
- 14.Nieves-Marrero CA, Ruiz-Martínez CR, Estremera-Andjar RA, González-Ramírez LA, López-Garriga J, Gavira JA, Two-step counterdiffusion protocol for the crystallization of haemoglobin II from Lucina pectinata in the pH range 4–9, Acta Crystallogr. Sect. F Struct. Biol. Cryst. Commun 66 (2010) 264–268. 10.1107/S1744309109053081. [DOI] [PMC free article] [PubMed] [Google Scholar]
- 15.Ruiz-Martínez CR, Nieves-Marrero CA, Estremera-Andújar RA, Gavira JA, González-Ramírez LA, López-Garriga J, García-Ruiz JM, Crystallization and diffraction patterns of the oxy and cyano forms of the Lucina pectinata haemoglobins complex, Acta Crystallogr. Sect. F Struct. Biol. Cryst. Commun 65 (2009) 25–28. 10.1107/S1744309108038542. [DOI] [PMC free article] [PubMed] [Google Scholar]
- 16.Pérez-Laspiur J, Anderson ER, Ciborowski P, Wojna V, Rosek W, Duan F, Mayo R, Rodriguez E, Plaud-Valentín M, Rodríguez-Orengo J, Gendelman HE, Meléndez LM, CSF proteomic fingerprints for HIV- associated cognitive impairment. J Neuroimmunol, 192(1–2), (2007) 157–170. [DOI] [PMC free article] [PubMed] [Google Scholar]
- 17.Rivera-Rivera L, Perez--Laspiur J, Colón K, Meléndez LM, Inhibition of interferon response by cystatin B: Implication in HIV replication of macrophage reservoirs. Journal of NeuroVirology, 18(1), (2012) 20–29. 10.1007/s13365-011-0061-2 [DOI] [PMC free article] [PubMed] [Google Scholar]
- 18.Toro-Nieves DM, Rodriguez Y, Plaud M, Ciborowski P, Duan F, Laspiur JP, Wojna V, Meléndez LM, Proteomic analyses of monocyte-derived macrophages infected with human immunodeficiency virus type 1 primary isolates from Hispanic women with and without cognitive impairment. Journal of NeuroVirology, 15(1), (2009) 36–50. 10.1080/13550280802385505 [DOI] [PMC free article] [PubMed] [Google Scholar]
- 19.Keller A, Nesvizhskii AI, Kolker E, Aebersold R, Empirical statistical model to estimate the accuracy of peptide identifications made by MS/MS and database search. Analytical Chemistry, 74(20), (2002) 5383–5392. 10.1021/ac025747h [DOI] [PubMed] [Google Scholar]
- 20.Nesvizhskii AI, Keller A, Kolker E, Aebersold R, A statistical model for identifying proteins by tandem mass spectrometry. Analytical Chemistry, 75(17), (2003) 4646–4658. 10.1021/ac0341261 [DOI] [PubMed] [Google Scholar]
- 21.Franke D, Petoukhov MV, Konarev PV, Panjkovich A, Tuukkanen A, Mertens HDT, Kikhney AG, Hajizadeh NR, Franklin JM, Jeffries CM, Svergun DI, ATSAS 2.8: A comprehensive data analysis suite for small-angle scattering from macromolecular solutions, J. Appl. Crystallogr 50 (2017) 1212–1225. 10.1107/S1600576717007786. [DOI] [PMC free article] [PubMed] [Google Scholar]
- 22.Svergun DI, Determination of the regularization parameter in indirect-transform methods using perceptual criteria. J. Appl. Crystallogr 25, (1992) 495–503. 10.1107/S0021889892001663 [DOI] [Google Scholar]
- 23.Grant T, Ab initio electron density determination directly from solution scattering data. Nat. Methods, 15 (2018) 191–193. 10.1038/nmeth.4581 [DOI] [PubMed] [Google Scholar]
- 24.Goddard TD, Huang CC, Meng EC, Pettersen EF, Couch GS, Morris JH, Ferrin TE, UCSF ChimeraX: Meeting modern challenges in visualization and analysis. Protein Sci. 27(1), (2018) 14–25. [DOI] [PMC free article] [PubMed] [Google Scholar]
- 25.Svergun D, Barberato C, Koch MH, CRYSOL - A program to evaluate X-ray solution scattering of biological macromolecules from atomic coordinates, J. Appl. Crystallogr 28 (1995) 768–773. 10.1107/S0021889895007047. [DOI] [Google Scholar]
- 26.Skou S, Gillilan RE, Ando N, Synchrotron-based small-angle X-ray scattering of proteins in solution, Nat. Protoc 9 (2014) 1727–1739. 10.1038/nprot.2014.116. [DOI] [PMC free article] [PubMed] [Google Scholar]
- 27.Goldenberg DP, Argyle B, Self crowding of globular proteins studied by small-angle X-ray scattering, Biophys. J 106 (2014) 895–904. 10.1016/j.bpj.2013.12.004. [DOI] [PMC free article] [PubMed] [Google Scholar]
- 28.Liu J, Li Z, Wei Y, Wang W, Wang B, Liang H, Gao Y, Measurement of protein size in concentrated solutions by small angle X-ray scattering, Protein Sci. 25 (2016) 1385–1389. 10.1002/pro.2957. [DOI] [PMC free article] [PubMed] [Google Scholar]
- 29.Marchany-Rivera D, Smith CA, Rodriguez-Perez JD, López-Garriga J, Lucina pectinata oxyhemoglobin (II-III) heterodimer pH susceptibility, J. Inorg. Biochem 207 (2020) 111055. 10.1016/j.jinorgbio.2020.111055. [DOI] [PMC free article] [PubMed] [Google Scholar]
- 30.Montes-Rodríguez IM, Rivera LE, López-Garriga J, Cadilla CL, Characterization and expression of the Lucina pectinata oxygen and sulfide binding hemoglobin genes, PLoS One. 11 (2016) 1–31. 10.1371/journal.pone.0147977. [DOI] [PMC free article] [PubMed] [Google Scholar]


