

Abstract
Background: Tuberculosis (TB) is still a serious health problem with a remarkable global burden. In this study, we aimed to assess the trend of TB mortality in Asian and North African countries in the period 1990-2017 and provide a new classification according to TB mortality trend.
Methods: TB mortality rates from 1990 to 2017 were extracted from the Global Burden of Disease website for 55 Asian and North African countries. Trend analysis of TB mortality rates for males, females, and the total population was performed using the marginal modeling approach. Moreover, the latent growth mixture modeling (LGMM) framework was applied to classify these 55 countries based on their trend of TB mortality rate.
Results: In the period between 1990 and 2017, South Asia and High Income Asia-Pacific regions had the highest and lowest death rates due to TB, respectively. The marginal modeling results showed that the Asian and North African countries had experienced a downward trend with an intercept of 28.79 (95%CI: 19.64, 37.94) and a slope (mean annual reduction) of -0.67 (95%CI: -0.91, -0.43) per 100,000 the study period. Finally, the LGMM analysis classified these 55 countries into four distinct classes.
Conclusion: In general, our findings revealed that although the countries in Asia and North Africa super region experienced a descending TB mortality trend in the past decades, the slope of this reduction is quite small. Also, our new classification may be better suited for combating TB through future healthcare planning in lieu of the commonly used geographic classifications.
Keywords: Tuberculosis, Asia and North Africa, Trend Analysis, Classification
↑ What is “already known” in this topic:
The trend of TB burden has already been investigated in different parts of the world by other researchers. Generally, these researchers have used the reported statistics by the WHO or GBD and the other data sources and revealed that the global prevalence, incidence and mortality rates of TB had a downward trend in the recent decades.
→ What this article adds:
In the present study, we used more advanced statistical methods to model the mortality trend of TB in Asia and North Africa. We also presented a new classification framework for these countries based on their TB mortality rate trend using growth mixture modeling approach.
Introduction
Tuberculosis (TB), with a long history of about 3000 years, is still a major health problem in human communities. Based on th e World Health Organization (WHO) reports, Mycobacterium tuberculosis is responsible for TB bacterial infection in more than one-third of the global population. It might lead to latent tuberculosis, while the risk of getting TB disease in the whole life is low (1, 2). In the first decade of the 21st century, this disease was recorded in the top ten causes of death around the world (3). In contrast, a more recent detailed study on the burden of disease has revealed that the rank of TB moved to 11th among the major causes of mortality (4). Since 2000 a remarkable decrease in the prevalence rate of TB has been observed in different Asian regions as well as a decline in mortality rate with a steeper slope (5). The United Nations Millennium Development Goals (MDGs) are set to warrant a reverse tendency in the incidence of TB, in addition to the halved prevalence and mortality rates by 2015 compared to 1990 (6). Although South-East Asia, Western Pacific, Africa and the Eastern Mediterranean WHO regions still experience the high burden of TB, prevalence and mortality rates seem to decrease in all WHO regions and it is likely that the Eastern Mediterranean, the Americas and South-East Asia meet the MDG targets too (7-9).
According to the published reports, the human immunodeficiency virus (HIV) is still a key element of the global TB control program, especially in low-income countries. In the year 2014, for instance, the WHO estimated 9.6 million TB cases around the world, with 1.2 million co-infected with HIV and 1.5 million deaths from TB including 1.1 million without HIV infection (4, 10-11). Some previous studies have indicated that the relative risk of developing TB in HIV positive persons is 20 to 37 times higher than the HIV uninfected persons; therefore, TB is the primary cause of mortality for those infected with HIV (8, 12-16).In Africa, TB control program progression is prolonged due to the high burden of HIV coinfection in this region (17). Using recommended Isoniazid Preventive Therapy (IPT) for treating HIV positive persons is an example of global efforts for the reduction of TB infection (18, 19).In addition to IPT, TB preventive therapy is used for cancer patients undergoing chemotherapy treatment with a high risk of developing TB. In this context, diabetes is another health problem with a serious impact on the risk of mortality during TB treatment (20, 21).
There are some evidence about the effects of TB on poverty by reduction of patients’ physical activities and loss of adults’ working age at the microeconomic level. These studies have emphasized macroeconomic level effects of TB by productivity reduction, family investment decreasing for longer-term payoff activities such as education, and increasing the portion of health expenditures of Gross Domestic Product (GDP) (17, 22-25).Therefore, TB is known as the “disease of the poor” with a high impact on poor families in low-income communities. The Asia continent includes seven countries as the member of the top 22 countries with high TB burden (26). Although there is no epidemic situation of TB in this region, the Asian countries are commonly faced with situations such as poverty, civil war, malnutrition and huge numbers of illegal refugees imposing a considerable variability of TB burden. Regarding this, estimating the trend of TB burden indices and determining related factors with TB burden in this region is of great importance.
In recent decades, the Latent Growth Mixture Models (LGMMs) have frequently been used in the analysis of longitudinal data. This family of statistical models enables us to incorporate the possible heterogeneity of outcome growth trends and also classify sampling units into distinctive subpopulations based on their growth trajectories.
In our literature search, we found several reports about the burden of TB in different parts of the world. However, we found no published article about advanced statistical modeling of TB burden trends and classification of Asian countries based on these trends. Regarding this, we designed the present study to evaluate the trend of TB Mortality Rates (TBMRs) in Asian and North African countries using the data from Global Burden of Disease (GBD) 2017 study and introduce a new classification for these countries based on their TB mortality trends. This new classification can be more meaningful than geographic classification introduced by the United Nations, World Health Organization or Institute for Health Metric and Evaluation (IHME) because it examines the heterogeneity of TBMRs in all Asian and North African countries and also classifies these countries into subpopulations based on their TB mortality growth trajectories (trends). For this purpose, two appropriate statistical modeling approaches for trend analysis (i.e., marginal models and LGMMs) were employed.
Methods
Database
Two distinct primary sources of TBMRs are accessible; the WHO TB burden estimates (27) and the GBD database (28). Estimates of TB incidence and mortality rates by the WHO are based on vital registration systems and verbal autopsy studies, while GBD estimates contain information from four potential sources of data, including annual case notifications, expert judgment on the case detection, prevalence surveys and cause of deaths data, which makes them more appropriate than WHO estimates. The GBD annually updates about 240 causes of death as well as the standard population of the world countries and territories to provide more reliable and accurate data. Generally, GBD uses a complicated country/region-based methods for computing age standardized rates. In brief, the GBD hierarchically utilized the data from seven super-regions, 21 regions nested within those super-regions, and 195 countries or territories within the 21 regions. In this process, five types of data sources (Vital Registration systems, sample registration systems, household surveys, censuses and Demographic Surveillance Sites) are employed to estimate the age-specific mortality as well as standard population and fertility by age, sex and year for 195 countries and territories as the denominator of the age-standardized rates. To do this, the GBD uses different advanced statistical and epidemiological methods such as mixed effects, patio-temporal regression models and so on to generate more proper rates. More details about the GBD estimation methods could be found elsewhere (5, 29).
A list of fifty five Asian and North African countries and their geographical regions were extracted according to the IHME database. In this database, countries are classified into six different geographic regions: Central Asia (including 9 countries), East Asia (including 3 countries), South-East Asia (13 countries), Southern Asia (including 5 countries), North Africa and Middle East (including 21 countries) and High Income Asia-Pacific (including 4 countries). In the present research, the age-standardized TBMRs from 1990 to 2017 (per 100,000) for each Asian and North African country were assembled using the data from GBD 2017 study.
Trend analysis using the marginal models
To analyze the trend of TBMR, the marginal modeling framework was utilized. More formally, the following marginal model was applied for trend analysis in which β0 and β1 are, respectively, the intercept and slope of the TBMR trend:
yti=β0+β1 timet+ɛti,
where yti indicates the TBMR for ith country (i=1,2,...,55) in tth time of measurements ( t=0,1,...,27 as an indicator for year=1990,1991,...,2017). As usual, ɛti represents the model residual. In addition, to assess the gender effect on TBMR, the following marginal model was fitted:
yti=β0+β1 time+β2 gender+ɛti,
where gender is a binary variable (0=female, 1=male) and β2 indicates the gender effect on TBMR. It should be noted that in the modeling process, we also included the interaction term in the model. Since this interaction term was not significant, the model was fitted only with the main effects of time and gender variables.
The model parameters were estimated using the unstructured working correlation matrix, which had the best fit indices, and Generalized Estimating Equations (GEE) methodology. We also used the QIC and QICC indices to assess the model fit; so that the model with the lowest fit indices was considered as the best model. The standard errors of the parameter estimates were calculated using the robust estimation method (30).
The SPSS software version 22.0 was used to fit the marginal models. P-values less than 0.05 were considered statistically significant.
Clustering the countries using the LGMMs
Latent growth mixture models are statistical tools that enable data analysts to take into account the heterogeneity in the growth trajectories and classify the sampling units into different classes. In the present study, the LGMMs were used to identify different classes of countries with analogous TBMR trends over the study period. To determine the kth(k=1,...,K) latent subgroup, the following equations can be written using the usual LGMM framework:
yitk=ɳi0k+ɳi1kλtk+ɛitk
ɳi0k=ɳ00k+ɛi0k
ɳi1k=ɳ10k+ɛi1k
where ɳ00k and ɳ10k represent the overall mean level of the TBMR at the starting point of the study and its average rate of change over time (1990-2017) in the kth class, respectively (31). To simplify the model fitting process, the 5-year intervals of TBMR data were considered in addition to the ending year of the study (years 1990, 1995, 2000, 2005, 2010, 2015, and 2017). We started to run the LGMMs with two subgroups (k=2) and increased the number of classes one by one and checked the related indices in each step to find an optimal number of subgroups (optimal number of k). In this context, we conducted a series of tests for the adequacy of reduced models with respect to the number of classes. The parametric Bootstrapped Likelihood Ratio Test (BLRT), AIC, and BIC goodness of fit indices were commonly used to determine the optimal number of latent classes. Also, according to some related texts, cluster sample sizes greater than 1% of the total sample size and the entropy statistic close to 1.0 shows a proper fit for LGMMs (31).
The Mplus software version 6.0 was used to fit the LGMMs, and the determined classes of the Asian and North African countries were illustrated in color-coded geographical maps using the ArcMap software version 9.3. P-values less than 0.05 were considered statistically significant.
Results
Generally, the TBMR data per 100,000 people in 55 Asian and North African countries from 1990 to 2017 was studied. Table 1 shows the descriptive statistics for TB mortality rates in different IHME regions by gender. In addition, Figure 1 displays the mean trend of TBMRs in the described regions for both genders.
Table 1. Descriptive statistics for TB mortality rates (per 100000 people) in different Asian and North African regions by gender from 1990 to 2017 .
| Region | Gender | 1990 | 1995 | 2000 | 2005 | 2010 | 2015 | 2017 |
| Central Asia1 | Male | 16.88 (7.03) | 25.28 (13.18) | 28.14 (13.98) | 23.98 (10.54) | 15.75 (5.16) | 11.64 (4.95) | 10.92 (4.45) |
| Female | 7.89 (6.53) | 9.64 (7.18) | 10.14 (6.18) | 8.49 (4.61) | 5.81 (3.23) | 4.37 (2.75) | 4.10 (2.58) | |
| Total | 11.95 (6.39) | 16.84 (8.79) | 18.54 (8.85) | 15.75 (6.92) | 10.46 (3.99) | 7.76 (3.69) | 7.29 (3.37) | |
| East Asia2 | Male | 20.91 (4.93) | 17.36 (2.04) | 15.47 (3.83) | 11.74 (6.66) | 8.46 (6.64) | 7.17 (6.41) | 6.88 (6.13) |
| Female | 9.29 (3.92) | 7.40 (1.97) | 6.26 (2.34) | 4.84 (3.32) | 3.61 (3.35) | 3.03 (3.08) | 2.78 (2.92) | |
| Total | 14.53 (4.10) | 11.88 (1.70) | 10.19 (1.90) | 7.67 (4.03) | 5.57 (4.31) | 4.72 (4.20) | 4.52 (4.04) | |
| South-East Asia3 | Male | 82.73 (60.29) | 72.84 (56.39) | 63.31 (51.99) | 50.52 (42.37) | 39.35 (33.10) | 29.93 (24.78) | 27.35 (22.50) |
| Female | 46.86 (38.25) | 39.34 (34.15) | 32.18 (28.95) | 23.74 (21.37) | 17.16 (15.12) | 12.73 (10.96) | 11.63 (9.96) | |
| Total | 63.38 (48.02) | 54.62 (44.01) | 46.27 (39.14) | 35.81 (30.76) | 27.04 (23.08) | 20.34 (17.06) | 18.57 (15.51) | |
| South Asia4 | Male | 86.37 (25.00) | 76.78 (22.31) | 63.77 (25.18) | 48.31 (23.10) | 37.32 (20.82) | 30.26 (16.84) | 27.95 (15.78) |
| Female | 59.43 (26.25) | 53.75 (22.82) | 44.31 (21.19) | 33.87 (18.72) | 25.41 (15.53) | 20.14 (12.90) | 18.46 (12.01) | |
| Total | 73.68 (21.95) | 65.96 (18.76) | 54.54 (20.91) | 41.37 (19.58) | 31.48 (17.26) | 25.23 (14.37) | 23.22 (13.50) | |
| North Africa & Middle East5 | Male | 13.45 (14.37) | 11.37 (13.44) | 9.16 (12.57) | 7.34 (11.16) | 5.72 (8.61) | 4.46 (6.61) | 4.16 (6.14) |
| Female | 10.17 (14.05) | 8.51 (12.36) | 6.70 (10.54) | 5.33 (8.90) | 4.08 (6.91) | 3.16 (5.45) | 2.92 (5.06) | |
| Total | 11.85 (14.25) | 9.99 (12.97) | 7.80 (11.63) | 6.36 (10.08) | 4.92 (7.77) | 3.83 (6.02) | 3.56 (5.59) | |
| High Income Asia-Pacific | Male | 19.21 (19.84) | 13.43 (13.09) | 10.56 (10.59) | 7.01 (6.69) | 5.02 (4.67) | 4.27 (3.91) | 4.09 (3.76) |
| Female | 7.17 (7.35) | 5.20 (5.27) | 4.05 (4.04) | 2.94 (2.93) | 2.30 (2.41) | 2.02 (2.22) | 1.98 (2.21) | |
| Total | 12.04 (12.02) | 8.51 (8.21) | 6.59 (6.44) | 4.53 (4.36) | 3.37 (3.28) | 2.92 (2.90) | 2.83 (2.84) | |
| Total | Male | 37.84 (44.83) | 34.60 (40.45) | 30.47 (36.38) | 24.21 (29.44) | 18.28 (23.04) | 14.13 (17.65) | 13.05 (16.11) |
| Female | 22.69 (29.15) | 19.80 (25.56) | 16.49 (21.44) | 12.59 (16.32) | 9.24 (12.07) | 7.07 (9.23) | 6.51 (8.46) | |
| Total | 29.83 (36.09) | 26.75 (32.03) | 23.01 (27.92) | 17.98 (22.02) | 13.39 (16.79) | 10.30 (12.83) | 9.50 (11.74) |
1Central Asia (9 Countries): Mongolia, Georgia, Armenia, Azerbaijan, Kazakhstan, Kyrgyzstan, Tajikistan, Turkmenistan, and Uzbekistan
2East Asia (3 Countries): China, North Korea, Taiwan
3South-East Asia (13 Countries): Sri Lanka, Cambodia, Thailand, Viet Nam, Timor-Leste, Seychelles, Malaysia, Myanmar, Maldives, Philippines, Indonesia, Laos, Mauritius
4South Asia (5 Countries): Bangladesh, Bhutan, India, Nepal, Pakistan,
5North Africa & Middle East (21 Countries): Bahrain, Iraq, Jordan, Kuwait, Lebanon, Oman, Qatar, Saudi Arabia, State of Palestine, Syrian Arab Republic, Turkey, United Arab Emirates, Yemen, Iran (Islamic Republic of), Afghanistan, Algeria, Egypt, Libya, Morocco, Tunisia, Sudan
6High Income Asia-Pacific (4 Countries): Brunei, Japan, South Korea and Singapore
Fig. 1.

TB mortality trend in different Asian and North African regions from 1990 to 2017
Regarding Table 1 and Figure 1, one can observe that all the regions had a decreasing trend of TBMR over the study period, except Central Asia, which had an increasing trend during the years 1990 to 1999 followed by a decreasing trend until the ending point of the study. Moreover, countries in South and South-East Asia had the highest mortality rates in the starting point of the study. These two Asian regions have also experienced the steepest downward slope during the study period. On the other hand, countries in High Income Asia-Pacific, Middle East & North Africa and East Asia regions have experienced the smallest starting point and downward slope of TBMR in the period 1990- 2017.
Figure 2 displays the observed mean TBMR trend per 100,000 for male, female and total population of Asian and North African countries. In the next step of the data analysis, we fitted the illustrated marginal model in the Methods section to inference about the trend of TBMRs from 1990 to 2017. Table 2 shows the obtained estimates. For the total population, the estimated intercept of 28.79 tells us that these 55 countries had a mean TBMR about 29 per 100,000 in 1990. Besides, the estimated slope of -0.67 means that Asian and North African countries had an annual reduction of less than 1 person per 100,000 (more accurately 6.7 per million) in the study period. The estimated parameters for males and females can be interpreted similarly. As can be observed, the mean TBMR in males had a higher intercept and sharper declining slope than females in this 28-year period.
Fig. 2.

TB mortality trend for male, female and total population of Asia and North Africa from 1990 to 2017
Table 2. Marginal modeling estimates for trend analysis of TB mortality rates (per 100,000) in Asian and North African countries from 1990 to 2017 .
| Gender | Parameter | Estimate | 95%CI | P |
| Male | Intercept | 37.85 | (26.11, 49.59) | <0.001 |
| Slope | -0.92 | (-1.21, -0.63) | <0.001 | |
| Female | Intercept | 22.62 | (15.02, 30.22) | <0.001 |
| Slope | -0.60 | (-0.82, -0.38) | <0.001 | |
| Total | Intercept | 28.79 | (19.64, 37.94) | <0.001 |
| Slope | -0.67 | (-0.91, -0.43) | <0.001 |
We also fitted a model including the gender effect to test the TBMR difference between men and women. The estimated parameter for the gender effect was -11.66 (SE=1.96), which indicated that mean TBMR in the male population was about 12 per 100,000 higher than females (p<0.001).
In the last step of data analysis, the described LGMM in the Methods section was fitted to the TBMR data in order to classify the Asian and North African countries according to their mean trends over the study period. Table 3 shows the obtained estimates for different LGMMs with 1 to 5 classes. Concerning the AIC and BIC values, one can conclude that the goodness of fit indices tend to be more appropriate with increasing the number of classes from 1 to 5. Regarding this improvement in AIC, BIC, and BLRT p values, one may suggest that increasing the number of classes (even more than 5-class) will result in a better fit. However, when we divide the countries into five or more classes, a small number of countries appear in some of them. For instance, (in the 5-class LGMM, the first class consists of only one country). Therefore, we decided to consider the 4-class LGMM as the best choice for classifying the countries. Figure 3 represents the estimated mean trend of TBMRs for this 4-class LGMM.
Table 3. Goodness of fit indices for LGMMs with different number of classes fitted to TB mortality rates in total population of Asian and North African countries .
| Model | AIC | BIC | Entropy | P-value (BLRT) | Class Membership |
| 1-Class LGMM | 2013.77 | 2047.90 | - | - | 55 |
| 2-Class LGMM | 1922.63 | 1972.82 | 1.000 | <0.001 | 7, 48 |
| 3-Class LGMM | 1847.46 | 1913.70 | 0.976 | <0.001 | 38, 8, 9 |
| 4-Class LGMM | 1792.51 | 1874.81 | 0.998 | <0.001 | 35, 8, 7, 5 |
| 5-Class LGMM | 1756.88 | 1855.24 | 0.999 | <0.001 | 1, 8, 5, 6, 35 |
Fig. 3.
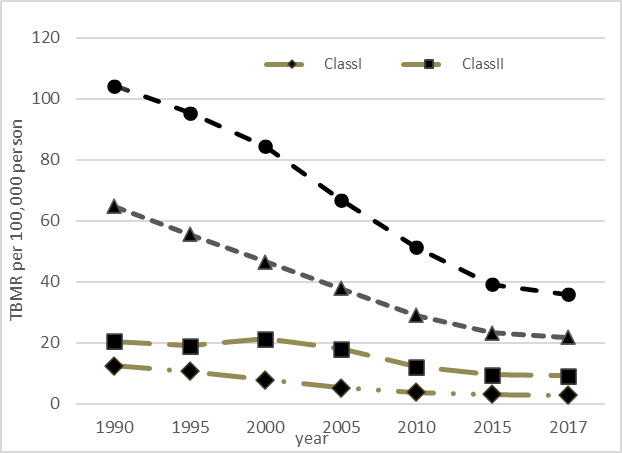
Estimated TB mortality trends from the 4-class LGMM in Asia and North Africa from 1990 to 2017
Table 4 presents the estimates from the fitted 4-class LGMM. The interpretation of the results can be performed in terms of the estimated parameters and time scores. More formally, countries in class III (mostly including South and South-East Asian countries) had the highest mean TBMR in the year 1990 (104.25 per 100,000). These countries have experienced a rather sharp reduction in TBMR after the starting year of the study (especially between 2000 and 2015). Countries in class IV had the second highest intercept (64.70 per 100,000). Countries in this class have experienced the sharpest decreasing slope (-9.13 per 100,000) in the study period. Countries in class II (mostly including Central Asian countries) have a rather low intercept in the starting year of the study (20.42 per 100,000), then experienced an upward trend until the year 2000, followed by a downward trend until the ending year of the study. Class I contains 35 Asian and North African countries (mostly including Middle-East, East Asia and High Income Asia-Pacific countries) with the lowest TBMR in 1990 (12.42 per 100,000) and a relatively low declining slope between 1990 and 2017.
Table 4. Results of 4-class LGMM for clustering Asian and North African countries based on TB mortality rate .
| Class | No. of countries | Parameter | Est. | 95%CI | p |
Time score (1990,1995,2000,2005,2010,2015,2017) |
| I | 35 | Intercept | 12.42 | (7.78, 17.07) | <0.001 | (0.0, 1.0, 2.6, 3.9, 4.8, 5.2, 5.3) |
| Slope | -1.82 | (-2.76, -0.88) | <0.001 | |||
| II | 8 | Intercept | 20.42 | (15.91, 24.93) | <0.001 | (0.0, 1.0, -0.5, 1.7, 5.8, 7.7, 8.0) |
| Slope | -1.43 | (-2.02, -0.84) | <0.001 | |||
| III | 7 | Intercept | 104.25 | (84.77, 123.73) | <0.001 | (0.0, 1.0, 2.2, 4.2, 5.9, 7.2, 7.6) |
| Slope | -8.99 | (-12.48, -5.50) | <0.001 | |||
| IV | 5 | Intercept | 64.70 | (53.98, 75.42) | <0.001 | (0.0, 1.0, 2.0, 2.9, 3.9, 4.5, 4.7) |
| Slope | -9.13 | (-12.01, -6.25) | <0.001 |
Class I: Algeria, Armenia, Bahrain, Bangladesh, Bhutan, Brunei, China, Egypt, Georgia, Iran, Iraq, Japan, Jordan, Kuwait, Lebanon, Libya, Malaysia, Maldives, Mauritius, Oman, Palestine, Qatar, Saudi Arabia, Seychelles, Singapore, South Korea, Sri Lanka, Sudan, Syria, Taiwan, Thailand, Tunisia, Turkey, United Arab Emirates and Yemen.
Class II: Azerbaijan, Kazakhstan, Kyrgyzstan, Mongolia, North Korea, Tajikistan, Turkmenistan and Uzbekistan.
Class III: Cambodia, India, Indonesia, Laos, Myanmar, Pakistan and Philippines.
Class IV: Afghanistan, Morocco, Nepal, Timor Lest and Vietnam.
The obtained results from the LGMM approach in Table 4 can also be interpreted according to the estimated time scores. In Class II, for instance, the countries had an estimated TBMR of 20.42 in the year 1990 (estimated intercept), then had a decreasing pattern so that the estimated TBMR in the year 1995 is
Intercept + (slope × time score)= 20.42 + (-1.43 × 1.0)= 18.99
For year 2000, the estimated TBMR is
Intercept + (slope × time score)= 20.42+(-1.43 × (-0.5))= 21.135
Likewise, the estimated TBMR for years 2005, 2010, 2015, and 2017 would be 17.99, 12.13, 9.41 and 8.98 per 100,000, respectively. According to the free time scores, similar calculations can be performed to estimate the TBMR in other classes.
Figure 4 displays the geographical distribution of TBMR according to the determined classes based on the 5 LGMM analysis.
Fig. 4.

Geographical map of Asian and North African countries based on their TBMR trends from 1990 to 2017
Discussion
Global efforts to control TB around the world initiated in the early 1990s by the WHO declaration of TB as a global emergency and introducing “Directly Observed Therapy, Short-course: DOTS” as a new treatment protocol (32). United Nations’ Millennium Development Goals (MDGs) intensified worldwide efforts to halve TB incidence, prevalence, and mortality rates by 2015 (6, 33). Despite the success of these global attempts in reducing the TB burden, more than half of all TB cases have been identified in Asia. Unfortunately, seven Asian countries (including Afghanistan, Bangladesh, India, Pakistan, Philippine, Thailand and Vietnam) are announced on the list of the 22 high TB burden countries. Additionally to, fourteen Asian countries included in the 27 high MDR TB burden countries (26).
In this study, a linear growth model was fitted to specify the trend of TBMR for total Asian and North African countries from 1990 to 2017. The obtained results from the fitted model showed a negative linear slope of -2.58 for the entire population under the study. This finding revealed that the mean TBMR decreases about 9% every five years in Asian and North African countries. In agreement with the other researches in different parts of the world, our findings showed that men had higher TBMRs compared to women (34, 35). Some related factors such as smoking and the amount of cigarette smoking, outdoor air pollution, alcohol, and drug use have been reported to be responsible for the excess burden of TB mortality in men (34-36).In addition, poorer access of females to health care services compared to males in some parts of this region might be a reason for underestimating TB incidence, prevalence and mortality rates among females (13, 34).
According to the obtained results in the present study, the decrease in TBMRs in South and South-East Asia regions appeared to be faster than the other Asian and North African regions. Based on other studies in this field, it has been suggested that the TB control programs success in different countries in the South and East of Asia might be attributed to socioeconomic improvement, urbanization and rapid economic growth in some countries such as India (36). Moreover, some researches have declared that poor sanitation and hygiene, areas with high population density and significant movement of migrant peoples (because of civil war, socioeconomic conditions and so on) represent TB hotspots in the other regions (37, 38).
An increase in mean trend of TBMR was observed in the last decade of the twentieth century, followed by a decrease in the trend by the end of study in Central Asia region. There are some reasons for the raised mean TBMR between 1990 and 2000 in this region. Primarily, different surveys have suggested the former Soviet Union as one of the focal points of the Multi Drug Resistance Tuberculosis (MDR-TB). Destruction of health care system and paralysis of the TB control system added to the decline of socioeconomic status were consequences of the Soviet Union collapse (39-41).Also, Turkmenistan, Uzbekistan and Tajikistan have long borders with their southern neighbor Afghanistan (one of 22 high TB burden countries) putting them at the forefront of the Afghanistan war. Transmission and immigration from Afghanistan to these countries could be considered as another reason for the high TB burden in Central Asia (42).
From Figure 1, the observed trends for North Africa and Middle East, East and High Income Asia-Pacific show a gentle decreasing slope for these three regions. In these regions, a rather low intercept at the beginning year of the research for TBMR may be the main reason for this gentle reduction during the study period. In fact, this low intercept do not allow a sharp decrease in mortality rates in the above mentioned regions.
Simple descriptive statistics about the trend of TBMRs in different Asian and North African countries show a high variation (heterogeneity) among them. Therefore, we used the LGMMs to determine different clusters according to trends of TBMRs over the study period. For all Asian and North African regions, we showed that a 4-class LGMM with linear growth trend may be a proper choice for clustering the countries according to their TBMR trends.
As illustrated in the results section, the class III (which mostly includes South and South-East Asian countries such as India, Indonesia and Pakistan) had the highest TBMRs and a relatively sharp decreasing trend during the study period. According to recent reports by the WHO in year 2019, India, Indonesia and Pakistan have known as top 5 countries with the highest TB incidence cases throughout the world. Although about one-third of the global TB burden is attributed to India, more accurate results of TB burden will be available from the national TB prevalence survey planned for 2019/2020 (43).
Class IV is related to countries in different parts of Asia and North Africa with the second highest rate at the starting point of the study and the highest decreasing slope over years 1990-2017. Naming this class and discussion about its TBMR trend seems to be complicated due to the geographical variation and lack of published research about burden of TB in the countries of this class. However, the dramatic reduction in TB mortality in Afghanistan might be attributed to improving access to TB services by decentralization of diagnostic services, promoting community-based case-finding approaches and development of policies, regulatory frameworks, and strategies after the fall of Taliban regime. In Vietnam, the National Tuberculosis Control Programme (NTP), which was conducted based on the principles of Directly Observed Treatment, Short-Course (DOTS) is one of the key governmental actions in controlling the burden of TB (44). Moreover, the Center for Disease Control (CDC) started to support Vietnam’s NTP to screen, treat and prevent TB, HIV-associated TB, and multidrug-resistant TB since 1997 (45). Similar activities by the health systems might be considered as a justification for this sharp reduction in TBMR in these countries.
Countries in class II (Mostly including Central Asian countries) showed a mild increase in TBMRs until year 2000 and then had a decreasing trend until the end of the study. Most of the countries in this class were under the territory of the former Soviet Union. The collapse of the Soviet Union in 1991 and weakening the health systems in newly independents republics is the main reason for the upward trend from 1990 to 2000 (39, 40).
Countries in class I (mostly including Middle East and North African, Eastern and High Income Asia-Pacific countries) displayed the lowest intercept and a fairy slow downward trend during the study period. Again, the diversity of regions in this class makes the discussion very difficult. However, the lower values of TBMR in these countries could be attributed to better nationwide expansion of DOTS and decentralized DOTS services from hospitals to health centers in most countries of this class (46, 47).
Generally, there was a significant difference in TBMRs in males and females at the starting point of the study, while we found no significant difference between the slopes of trends. This leads to rather parallel (but not coincident) trends for males and females. It is not a surprising finding, because it was generally known that TB is more incident in males than females and values between 1.5 and 2.0 have been previously reported for global M:F ratios (9, 43). In year 2017, for instance, nearly 6 million adult men contracted TB while this disease was diagnosed for about 3.2 million adult women (48). Consequently, higher TB incidence in men leads to higher mortality and this fact could be thought as a justification for the presence of different patterns for TB mortality in male and female populations.
The major limitation of this study was small sample size in some regions and lack of regular TB data in some countries. Lack of reliable and accurate TBMR data for these countries due to their healthcare system weaknesses was another limitation of our study. However, we believe that the GBD data sets are the most reliable and comprehensive data in this field. Applying advanced and powerful longitudinal models for analyzing the data is a strength point of the present study.
In this study we used two well-known statistical models, i.e. marginal models and LGMMs, to analyze the trend of TBMR data and cluster the Asian and North African countries according to their TBMR pattern over the study period. In this context, there are a number of alternative statistical models which could be used for the same purposes. For instance, random effects and transition models are two alternatives for the marginal models. In addition, the spatio-temporal models could be used for clustering the countries based on their trend of TBMR instead of the applied LGMMs. In the present study, we did not aim to compare these alternative models using the real data or simulation approaches. Regarding this, we cannot claim that the utilized models in this research are the best choices, however we believe that marginal models and LGMMs are authentic and reliable statistical approaches for analyzing these kinds of data sets.
Conclusion
Generally, the obtained results from the present study showed a decreasing pattern for TBMR in Asia and North Africa region with 10-year mean reduction of 6.7 per 100,000 people. It was also revealed that all six IHME regions have experienced a downward trend of TBMR over the study period. Moreover, it was found that the South and High Income Asia- Pacific regions had, respectively, the highest and lowest TBMRs among six IHME regions. The latter result demonstrates the relationship between TB mortality and economic condition of the countries. It seems regions with poorer economic status had higher death rates than the wealthier ones. The results of longitudinal clustering of countries in six regions into four classes also confirmed the effect of socioeconomic status on the burden of TB in a different manner. This clustering provides an up to date evidence on levels and trends of homogenous classes of Asian countries for evaluating the health programs as well as hitting the explicit targets and developing the regional and global health policies for controlling and reducing the future burden of TB within each cluster.
Acknowledgments
This article is part of a research project approved by the Faculty of Allied Medical Sciences, Shahid Beheshti University of Medical Sciences, Tehran, Iran. The authors would like to express their gratitude to the Research Deputy of this faculty for the facilitation of the process to conduct this study.
Availability of data and materials
The TB mortality and HDI data sets are freely accessible in the GBD compare website (available at http://ghdx.healthdata.org/gbd-results-tool).
Ethics approval and consent to participate
The Ethical aspect of the present research has been approved by the Ethics Committee of the Shahid Beheshti University of Medical Sciences (Ethics code: #IR.SBMU.RETECH.REC.1399.236).
Conflict of Interests
The authors declare that they have no competing interests.
Cite this article as: Salehi M, Vahabi N, Pirhoseini H, Zayeri F. Trend analysis and longitudinal clustering of tuberculosis mortality in Asian and North African countries: Results from the global burden of disease 2017 study. Med J Islam Repub Iran. 2021 (8 Apr);35:46. https://doi.org/10.47176/mjiri.35.46
Footnotes
Conflicts of Interest: None declared
Funding:This study is financially suppported by the Research Deputy of Shahid Beheshti Uuniversity of Medical Science, Tehran, Iran (Project code: #22252)
References
- 1.Dye C, Scheele S, Dolin P, Pathania V, Raviglione MC. Consensus statement Global burden of tuberculosis: Estimated incidence, prevalence, and mortality by country WHO Global Surveillance and Monitoring Project. JAMA. 1999;282:677–86. doi: 10.1001/jama.282.7.677. [DOI] [PubMed] [Google Scholar]
- 2. World Health Organization (WHO). Global Tuberculosis Report, 2012-World Health Organization. 2012. https://apps.who.int/iris/bitstream/handle/10665/75938/9789241564502_eng.pdf?sequence=1&isAllowed=y. Accessed 1 Aug 2020.
- 3.Dye C, Bassili A, Bierrenbach AL, Broekmans JF, Chadha VK, Glaziou P. et al. Measuring tuberculosis burden, trends, and the impact of control programmes. Lancet Infect Dis. 2008;8:233–43. doi: 10.1016/S1473-3099(07)70291-8. [DOI] [PubMed] [Google Scholar]
- 4. GBD 2013 Mortality and causes of death collaborators. Global, regional, and national age-sex specific all-cause and cause-specific mortality for 240 causes of death, 1990-2013: a systematic analysis for the Global Burden of Disease Study 2013. Lancet. 2015;385:117–71. doi: 10.1016/S0140-6736(14)61682-2. [DOI] [PMC free article] [PubMed] [Google Scholar]
- 5.Murray CJL, Ortblad KF, Guinovart C, Lim SS, Wolock TM, Roberts DA. et al. Global, regional, and national incidence and mortality for HIV, tuberculosis, and malaria during 1990–2013: a systematic analysis for the Global Burden of Disease Study 2013. Lancet. 2014;384:1005–70. doi: 10.1016/S0140-6736(14)60844-8. [DOI] [PMC free article] [PubMed] [Google Scholar]
- 6.Dye C, Maher D, Weil D, Espinal M, Raviglione M. Targets for global tuberculosis control. Int J Tuberc Lung Dis. 2006;10:460–62. [PubMed] [Google Scholar]
- 7.Donald PR, van Helden PD. The global burden of tuberculosis--combating drug resistance in difficult times. N Engl J Med. 2009;360:2393–5. doi: 10.1056/NEJMp0903806. [DOI] [PubMed] [Google Scholar]
- 8.Churchyard GJ, Chaisson RE, Maartens G, Getahun H. Tuberculosis preventive therapy: an underutilized strategy to reduce individual risk of TB and contribute to TB control. S Afr Med J. 2014;104:339–43. doi: 10.7196/samj.8290. [DOI] [PubMed] [Google Scholar]
- 9. World Health Organization (WHO). Global Tuberculosis Report, 2015. https://apps.who.int/iris/bitstream/handle/10665/191102/9789241565059_eng.pdf?sequence=1&isAllowed=y. Accessed 1 Aug 2020.
- 10.Serafino Wani RL. Tuberculosis1 Epidemiology of mycobacterium tuberculosis. SSMJ. 2012;5:45–6. [Google Scholar]
- 11.Corbett EL, Marston B, Churchyard GJ, De Cock KM. Tuberculosis in sub-Saharan Africa: opportunities, challenges, and change in the era of antiretroviral treatment. Lancet. 2006;367:926. doi: 10.1016/S0140-6736(06)68383-9. [DOI] [PubMed] [Google Scholar]
- 12.Lawn SD, Churchyard G. Epidemiology of HIV-associated tuberculosis. Curr Opin HIV AIDS. 2009;4:325–33. doi: 10.1097/COH.0b013e32832c7d61. [DOI] [PMC free article] [PubMed] [Google Scholar]
- 13.Holmes CB, Hausler H, Nunn P. A review of sex differences in the epidemiology of tuberculosis. Int J Tuberc Lung Dis. 1998;2:96–104. [PubMed] [Google Scholar]
- 14.Murray JF. Cursed duet: HIV infection and tuberculosis. Respiration. 1990;57:210–20. doi: 10.1159/000195844. [DOI] [PubMed] [Google Scholar]
- 15.Gao J, Zheng P, Fu H. Prevalence of TB/HIV coinfection in countries except China: a systematic review and meta-analysis. PLOS One. 2013:e64915. doi: 10.1371/journal.pone.0064915. [DOI] [PMC free article] [PubMed] [Google Scholar]
- 16.Friedland G, Churchyard GJ, Nardell E. Tuberculosis and HIV coinfection: current state of knowledge and research priorities. J Infect Dis. 2007;196 Suppl 1:S1–3. doi: 10.1086/518667. [DOI] [PubMed] [Google Scholar]
- 17.Laxminarayan R, Klein EY, Darley S, Adeyi O. Global investments in TB control: economic benefits. Health Aff (Millwood) 2009;28:w730–42. doi: 10.1377/hlthaff.28.4.w730. [DOI] [PubMed] [Google Scholar]
- 18. World Health Organization (WHO). WHO policy on collaborative TB/HIV activities: Guidelines for national programmes and other stakeholders. 2012. https://apps.who.int/iris/bitstream/handle/10665/44789/9789241503006_eng.pdf?sequence=1. Accessed 1 Aug 2020. [PubMed]
- 19. World Health Organization (WHO). Guidelines for intensified tuberculosis case-finding and isoniazid preventive therapy for people living with HIV in resource-constrained settings. 2011. https://apps.who.int/iris/bitstream/handle/10665/44472/9789241500708_eng.pdf?sequence=1. Accessed 1 Aug 2020.
- 20.Baker MA, Harries AD, Jeon CY, Hart JE, Kapur A, Lo¨nnrothK Lo¨nnrothK. et al. The impact of diabetes on tuberculosis treatment outcomes: a systematic review. BMC Medicine. 2011;9:81. doi: 10.1186/1741-7015-9-81. [DOI] [PMC free article] [PubMed] [Google Scholar]
- 21.Kapur A, Harries AD. The double burden of diabetes and tuberculosis - public health implications. Diabetes Res Clin Pract. 2013;101:10–9. doi: 10.1016/j.diabres.2012.12.001. [DOI] [PubMed] [Google Scholar]
- 22.Barter DM, Agboola SO, Murray MB, Bärnighausen T. Tuberculosis and poverty: the contribution of patient costs in sub-Saharan Africa-a systematic review. BMC Public Health. 2012;12:980. doi: 10.1186/1471-2458-12-980. [DOI] [PMC free article] [PubMed] [Google Scholar]
- 23.Tanimura T, Jaramillo E, Weil D, Raviglione M, Lönnroth K. Financial burden for tuberculosis patients in low- and middle-income countries: a systematic review. Eur Respir J. 2014;43:1763–75. doi: 10.1183/09031936.00193413. [DOI] [PMC free article] [PubMed] [Google Scholar]
- 24. World Health Organization (WHO). Addressing poverty in TB control: Options for national TB control programmes. 2005. https://apps.who.int/iris/bitstream/handle/10665/43256/WHO_HTM_TB_2005.352.pdf?sequence=1. Accessed 1 Aug 2020.
- 25.Lonnroth K, Jaramillo E, Williams BG, Dye C, Raviglione M. Drivers of tuberculosis epidemics: The role of risk factors and social determinants. Soc Sci Med. 2009;68:2240–6. doi: 10.1016/j.socscimed.2009.03.041. [DOI] [PubMed] [Google Scholar]
- 26. World Health Organization (WHO). Use of high burden country lists for TB by WHO in the post-2015 era. 2015. https://www.who.int/tb/publications/global_report/high_tb_burdencountrylists2016-2020.pdf?ua=1. Accessed 1 June 2020.
- 27. World Health Organization (WHO). Tuberculosis (TB). https://www.who.int/news-room/fact-sheets/detail/tuberculosis. Accessed 1 August 2020.
- 28. Institute for Health Metrics and Evaluation (IHME). GBD Compare. Seattle, WA: IHME, University of Washington, 2019. http://vizhub.healthdata.org/gbd-compare. Accessed 1 July 2020.
- 29.GBD Tuberculosis Collaborators. The global burden of tuberculosis: results from the Global Burden of Disease Study 2015. Lancet Infect Dis. 2018;18:261–284. doi: 10.1016/S1473-3099(17)30703-X. [DOI] [PMC free article] [PubMed] [Google Scholar]
- 30. Fitzmaurice G M, Nan M. Laird, and James H. Applied Longitudinal Analysis, 2nd ed. John Wiley & Sons; 2011.
- 31. [31] Wang J, Wang X. Structural equation modeling: Application using Mplus. 2nd ed. Wiley, 2012.
- 32. World Health Organization (WHO). Global Tuberculosis Control: Surveillance, Planning, Financing. 2005. https://apps.who.int/iris/bitstream/handle/10665/42889/9241562641.pdf?sequence=2. Accessed 1 Aug 2020.
- 33. World Health Organization (WHO). Global Tuberculosis Report, 2014. https://apps.who.int/iris/bitstream/handle/10665/137094/9789241564809_eng.pdf?sequence=1&isAllowed=y. Accessed 1 Aug 2020.
- 34.Neyrolles O, Quintana-Murci L. Sexual inequality in tuberculosis. PLOS Med. 2009;6:e1000199. doi: 10.1371/journal.pmed.1000199. [DOI] [PMC free article] [PubMed] [Google Scholar]
- 35. Babamahmoodi F, Alikhani A, Yazdani Charati J, Ghovvati A, Ahangarkani F, Delavarian L, et al. Clinical epidemiology and paraclinical findings in tuberculosis patients in north of Iran. Biomed Res Int 2015; 10.1155/2015/381572 [DOI] [PMC free article] [PubMed]
- 36.Trinh QM, Nguyen HL, Nguyen VN, Nguyen TV, Sintchenko V, Marais BJ. Tuberculosis and HIV co-infection-focus on the Asia-Pacific region. Int J Infect Dis. 2015;32:170–8. doi: 10.1016/j.ijid.2014.11.023. [DOI] [PubMed] [Google Scholar]
- 37.Chan-yeung M, Yeh AG, Tam CM, Kam KM, Leung CC, Yew WW. et al. Socio-demographic and geographic indicators and distribution of tuberculosis in Hong Kong: a spatial analysis. Int J Tuberc Lung Dis. 2005;9:1320–6. [PubMed] [Google Scholar]
- 38.Wu J, Dalal K. Tuberculosis in Asia and the Pacific: The Role of Socioeconomic Status and Health System Development. Int J Prev Med. 2012;3:8–16. [PMC free article] [PubMed] [Google Scholar]
- 39.McKee M, Figueras J, Chenet L. Health sector reform in the former soviet republics of central Asia. Int J Health Plann Manage. 1998;13:131–47. doi: 10.1002/(SICI)1099-1751(199804/06)13:2<131::AID-HPM506>3.0.CO;2-8. [DOI] [PubMed] [Google Scholar]
- 40.Cox HS, Orozco JD, Male R, Ruesch-Gerdes S, Falzon D, Small I. et al. Multidrug-resistant tuberculosis in central Asia. Emerg Infect Dis. 2004;10:865–72. doi: 10.3201/eid1005.030718. [DOI] [PMC free article] [PubMed] [Google Scholar]
- 41.Cox HS, Kubica T, Doshetov D, Kebede Y, Rüsch-Gerdess S, Niemann S. The Beijing genotype and drug resistant tuberculosis in the Aral Sea region of Central Asia. Respir Res. 2005;6:134. doi: 10.1186/1465-9921-6-134. [DOI] [PMC free article] [PubMed] [Google Scholar]
- 42. U.S. Government Printing Office. Central Asia and the Transition in Afghanistan. Committee on Foreign Relations United States Senate One Hundred Twelfth Congress. 2011. https://www.foreign.senate.gov/imo/media/doc/71639.pdf. Accessed 1 Aug 2020.
- 43. World Health Organization (WHO). Global Tuberculosis Report, 2019-World Health Organization. 2019. https://apps.who.int/iris/bitstream/handle/10665/329368/9789241565714-eng.pdf?ua=1. Accessed 1 Aug 2020.
- 44.Hoa NB, Sy DN, Nhung NV, Tiemersma EW, Borgdorff MW, Cobelens FGJ. A National survey of tuberculosis prevalence in Viet Nam. Bull World Health Organ. 2010;88:273–80. doi: 10.2471/BLT.09.067801. [DOI] [PMC free article] [PubMed] [Google Scholar]
- 45. Center of Disease Control. Vietnam Country Profile. https://www.cdc.gov/globalhivtb/where-we-work/vietnam/vietnam.html. Accessed 1 Aug 2020.
- 46.Hiatt T, Nishikiori N. Epidemiology and control of tuberculosis in the Western Pacific Region: analysis of 2012 case notification data. Western Pac Surveill Response J. 2014;5:25–34. doi: 10.5365/WPSAR.2014.5.1.013. [DOI] [PMC free article] [PubMed] [Google Scholar]
- 47.Onozaki I, Law I, Sismanidis C, Zignol M, Glaziou P, Floyd K. National tuberculosis prevalence surveys in Asia, 1990–2012: an overview of results and lessons learned. Trop Med Int Health. 2015;20:1128–45. doi: 10.1111/tmi.12534. [DOI] [PubMed] [Google Scholar]
- 48. World Health Organization (WHO). Global Tuberculosis Report, 2016-World Health Organization. 2016. https://apps.who.int/iris/bitstream/handle/10665/250441/9789241565394-eng.pdf?sequence=1&isAllowed=y. Accessed 1 Aug 2020.
Associated Data
This section collects any data citations, data availability statements, or supplementary materials included in this article.
Data Availability Statement
The TB mortality and HDI data sets are freely accessible in the GBD compare website (available at http://ghdx.healthdata.org/gbd-results-tool).