

The way that brain activity flows across brain wiring helps explain abnormal brain responses and behaviors in schizophrenia.
Abstract
Cognitive dysfunction is a core feature of many brain disorders, including schizophrenia (SZ), and has been linked to aberrant brain activations. However, it is unclear how these activation abnormalities emerge. We propose that aberrant flow of brain activity across functional connectivity (FC) pathways leads to altered activations that produce cognitive dysfunction in SZ. We tested this hypothesis using activity flow mapping, an approach that models the movement of task-related activity between brain regions as a function of FC. Using functional magnetic resonance imaging data from SZ individuals and healthy controls during a working memory task, we found that activity flow models accurately predict aberrant cognitive activations across multiple brain networks. Within the same framework, we simulated a connectivity-based clinical intervention, predicting specific treatments that normalized brain activations and behavior in patients. Our results suggest that dysfunctional task-evoked activity flow is a large-scale network mechanism contributing to cognitive dysfunction in SZ.
INTRODUCTION
Generalized cognitive impairment is one of the most pervasive and stable markers of schizophrenia (SZ) (1). Modern brain imaging techniques, such as functional magnetic resonance imaging (fMRI), have linked cognitive dysfunction in SZ to abnormal localized brain activity (2). For example, during working memory (WM) tasks, individuals with SZ tend to show differences in frontoparietal and default-mode activation compared to healthy controls (HCs) (3, 4). However, it is likely that cognitive dysfunction emerges in SZ due to abnormal interactions between brain regions, not localized activations. This is known as the “dysconnection hypothesis” (5). It is currently unclear how behavioral impairment emerges from the interaction of dysconnected FC and aberrant task-evoked activations. Here, to bridge this gap, we link these observations (dysfunctional activity and connectivity) using a recently developed framework termed activity flow mapping.
The last three decades of imaging work have firmly established SZ as a disorder of dysconnectivity (6). Functional connectivity (FC), defined as the statistical dependence between distinct brain regions, has been instrumental in testing the dysconnection hypothesis, which was originally theorized over a century ago (7). FC strength tends to be reduced in SZ, with evidence of impaired global network organization (2, 8). Moreover, the interplay between salience, frontoparietal, and default-mode networks is particularly affected in SZ (9). Current thinking suggests that one mechanism underpinning dysconnection in SZ is the abnormal N-methyl-d-aspartate receptor–mediated synaptic plasticity (10).
Despite the substantial evidence for dysconnectivity, it remains less clear how FC in SZ leads to abnormal brain activations and cognitive deficits. Inspired by connectionist computational modeling principles (11), we recently developed activity flow mapping, a modeling approach that can be extended to test how distributed sources contribute to localized brain activity (see Fig. 1) (12, 13). Within this framework, in the context of fMRI, the strength of FC describes the spread of task activations between brain regions. This approach offers complementary information to traditional fMRI analyses by explaining how a given activation emerges from distributed FC and activity. We have previously shown that activity flow is accurate at predicting held-out task activations in both simulated and empirical data from healthy young adults (12, 14, 15). Critically, applying this method to clinical data allows us to investigate how dysconnectivity and dysfunctional activity flows influence abnormal activations directly tied to deficits in cognition (16).
Fig. 1. The activity flow algorithm.

The task-evoked activation of brain region j can be predicted by summing the activity of all other brain regions (i) weighted by their connectivity with j. The critical assumption of activity flow (which is tested via comparing predicted to actual activations) is that activations are produced by distributed processes that are well characterized by FC estimates. If aberrant activations in SZ reflect distributed processing, activity flow predictions should be able to replicate group activation differences in the empirical data.
Dysfunctional activity flow could arise in a number of ways. Congruent with the dysconnection hypothesis, it may be that aberrant FC transforms relatively healthy activity in one brain region to dysfunctional activity in another (16). Alternatively, relatively healthy FC could propagate preexisting aberrant activations across brain regions. Last, it may be some mixture of the two, whereby milder “subthreshold” dysfunctional FC interacts with subthreshold aberrant activity to produce suprathreshold dysfunctional activations associated with dysfunctional cognition.
In the current study, we leveraged HC (N = 93) and SZ data (N = 36) from the University of California, Los Angeles (UCLA) Consortium for Neuropsychiatric Phenomics (CNP) LA5c Study (17). Participants completed a spatial capacity WM task (see Fig. 2), which has previously been used to isolate brain activity differences between SZ and HC (4). Using general linear modeling (GLM), we first compared task-evoked activations between HC and SZ and identified four differentially activated cortical regions. Then, using activity flow mapping, we tested whether these dysfunctional activations in SZ emerged from distributed abnormal activity flows. Last, within the activity flow framework, we simulated a hypothetical “connectivity-based intervention” to produce new testable hypotheses for improving cognitive deficits in SZ.
Fig. 2. The spatial capacity WM task (SCAP).

(A) Participants were shown a pseudo-randomly positioned array of one, three, five, or seven yellow circles. A variable length delay screen was then shown, followed by a single green target circle. Participants were asked to indicate whether the green circle was in the same position as any of the yellow circles in the initial array. We contrasted behavior and imaging from the low (set size = 1 or 3) and the high (set size = 5 or 7) WM conditions. (B) Task accuracy on the SCAP (chance = 50%). Main effects of WM and group were both observed.
RESULTS
Behavioral differences in spatial WM
Given that we sought to characterize the brain network mechanisms underlying cognitive dysfunction in SZ, we began by testing for cognitive dysfunction in the SZ group during a spatial capacity WM task (SCAP; Fig. 2A). This task has previously been used to identify behavioral and brain activation differences between HC and SZ cohorts (4, 18). During the task, participants are shown an array of one, three, five, or seven yellow circles positioned pseudo-randomly around a fixation cross (2 s). After a variable delay period, a “target” circle appears, and participants are asked to indicate whether the target matched any of the yellow circles in the initial array. Here, we considered arrays of one or three as low WM load and arrays of five or seven as high WM load.
As expected, participants in the SZ cohort performed less accurately [MSZ = 86.3%, MHC = 73.1%, t(43.6) = 4.81, d = 1.20, P < 0.001] and slower than the HC group [MSZ = 1237 ms, MHC = 1101 ms, t(64.9) = −3.23, d = 0.63, P = 0.002]. When behavioral accuracy was compared in a two (group: SZ versus HC) by two (WM load: low versus high) mixed analysis of variance, there were significant main effects of both group [F(1,127) = 37.53, ηp2 = 0.29, P < 0.001] and WM [F(1,127) = 149.5, ηp2 = 0.54, P < 0.001) (Fig. 2B). However, there was no significant interaction between the two factors [F(1,127) = 2.9, ηp2 = 0.02, P = 0.09]. Likewise, when comparing reaction time, main effects of both group [F(1,127) = 10.16, ηp2 = 0.07, P = 0.002] and WM were significant [F(1,127) = 259.2, ηp2 = 0.67, P < 0.01]. As above, there was no significant interaction [F(1,127) = 1.23, ηp2 = 0.01, P = 0.27]. These results demonstrate that, as expected, the SZ group performed the spatial WM task worse than the HC group across both low and high WM load conditions.
Dysfunctional spatial WM activations in SZ
We next sought to identify localized dysfunctional task-evoked brain activations, which we will subsequently seek to predict via activity flow-related brain network mechanisms hypothesized to underlie cognitive dysfunction in SZ. Throughout Results, we will refer to functional brain networks delineated by Ji et al. (19) in the Glasser et al. (20) brain parcellation (see Fig. 3).
Fig. 3. Brain activity associated with the spatial capacity WM task.

(A) Group average brain activity for the contrast (high > low WM). Significant differences (PFWE < 0.05, 718 comparisons) were found in four cortical regions within the visual and cingulo-opercular network (shown in black borders). (B) Brain parcellation (718 parcels) and network affiliations (12 networks) used in the study (22). No reliable differences were found in the subcortex, therefore visualization in (A) was limited to the cortex. Subcortical results are presented in fig. S1. (C) Network level group by WM brain activation differences. A significant interaction effect was observed within the default-mode network (PFWE < 0.05, 12 comparisons). Network labels (x axis) match the colors in (B). vis1, primary visual; vis2, secondary visual; smn, somatomotor; con, cingulo-opercular; dan, dorsal attention; lan, language; fpn, frontoparietal; aud, auditory; dmn, default-mode pmm, posterior multimodal; vmm, ventral multimodal; oan, orbito-affective.
Task-evoked brain activity was estimated using a standard GLM for each task condition (see Materials and Methods). We contrasted the high WM conditions (set size = 5 and 7) and the low WM conditions (set size = 1 and 3), before conducting comparisons between the two cohorts (HC versus SZ). In response to increased WM demands, both cohorts demonstrated increased activation within dorsal attention and visual networks and deactivations within the default-mode network (Fig. 3). Four cortical regions were differentially modulated in patients relative to controls [P < 0.05, family-wise error (FWE) permutation corrected], demonstrating dysfunctional task-evoked activations. These regions of interest (ROIs) included the (i) left ventral anterior cingulate cortex (ACC; parcel 57, cingulo-opercular network), (ii) right medial superior temporal area (MST; parcel 182, higher order visual network), (iii) right posterior operculum of the sylvian fissure (PO; parcel 285, cingulo-opercular network), and (iv) the right posterior insula (PI; parcel 347, cingulo-opercular network) [shown by black borders in Fig. 3A (right); parcel borders refer to the original work by Glasser et al. (20). All four regions were deactivated for high compared to low WM load conditions, and the magnitude of this deactivation was lower for SZ. Likewise, when network-averaged activations were analyzed, the default-mode network demonstrated the same pattern of activity with significant differences between groups (Fig. 3C, PFWE < 0.05). Prior work has established reduced deactivations as a hallmark of SZ WM deficits and may indicate a lack of spontaneous cognition suppression during WM task performance (3, 21, 22).
In addition to significant activation differences between groups, the activation within each of these brain ROIs, as well as the default-mode network, correlated with overall task performance (r = −0.26 to −0.35, Pbonf < 0.05). Likewise, the average activation across these brain regions correlated with several memory and cognitive control tasks performed outside of the scanner, including measures spanning episodic memory, WM, fluid reasoning, and attention (see table S1). Together, these results demonstrate that we identified key dysfunctional cortical regions involved in dysfunctional SZ performance during spatial WM and broader cognitive demands.
FC dysconnection in SZ
SZ is considered a disorder of abnormal FC (5, 23). Hence, we tested for group differences in FC between our ROIs (identified via the task activation analyses reported in the previous section) and the rest of the brain (fig. S2). We found limited differences in FC between groups. In the left MST, we found two differences to/from regions within the right cerebellum [t(76.4) = 4.25, PFWE = 0.02] and striatum [t(72.6) = 4.01, PFWE = 0.046], such that FC was higher in SZ. We also observed lower FC in SZ between the right PI and the right ACC [t(98.3) = −4.39, PFWE = 0.01]. There were no significant FC differences concerning the left ACC and right PO (PFWE > 0.05) regions. Moreover, when averaging FC within/across networks, we found no statistical differences between groups (PFWE > 0.05).
Activity flow mapping predicts dysfunctional activations in SZ
Inspired by connectionist neural network modeling principles (11, 13), activity flow mapping tests the idea that task-evoked activity is propagated between brain regions via distributed processes captured by FC (12). Each held-out target activation is modeled as the sum of all other task activation amplitudes weighted by their FC with the target brain region (recall Fig. 1). Performed iteratively, activity flow mapping results in a set of brain activity predictions for each region, experimental condition and participant in the dataset. This approach has previously been validated in healthy individuals (12, 14).
We tested whether activity flow mapping predictions could recapitulate the network- and region-level brain activity dysfunctions identified in the empirical data (i.e., Fig. 3). Activity flow mapping was applied to every subject to predict activity in low and high WM demand conditions. Activity was then subjected to the same contrast used in the empirical data, low versus high WM demands, generating a single whole-brain activity vector for each participant. To assess activity flow predictions at the whole-brain level, for each subject, the real and predicted data were compared via correlation, mean absolute error (MAE), and the R2. Critically, the four ROIs were held out of the activity flow prediction; this ensured that accurate predictions did not rely upon simply transferring dysfunction from one dysfunctional region to another. Repeating the analysis including the four held out regions did not alter the results (see the Supplementary Materials).
Across both groups, activity flow mapping successfully predicted activity patterns across the whole brain: rHC = 0.63 [one-sample t test compared to zero, t(92) = 57.2, P < 0.001], rSZ = 0.60 [t(35) = 31.4, P < 0.001], MAEHC = 0.62, MAESZ = 0.61, R2HC = 0.40 [t(92) = 26.0, P < 0.001], and R2SZ = 0.35 [t(35) =13.6, P < 0.001] (Fig. 4A). When compared, predictions were not significantly better for either group (P > 0.15 across all measures).
Fig. 4. Predicting dysfunctional activity with activity flow mapping.

(A) Group averaged empirical (Real) and predicted (Pred) activations (high > low WM) for HC and SZ groups. Note that r and MAE statistics were conducted at the participant level and then averaged (group averages are shown visually). (B) Real (top) and predicted (bottom) activations for the four ROIs and the default-mode network. Aside from the right MST located in the visual cortex, group differences could be captured in the activity flow predicted data. *P < 0.05. As noted in the main text, the exploratory empirical analyses were family-wise error corrected for 718 comparisons, whereas the confirmatory analyses were Bonferroni corrected for four comparisons.
Next, we chose to focus on regions that had shown statistically robust group differences in the empirical data (i.e., those in Fig. 3A, PFWE-corrected < 0.05). For each of these specific regions, we performed a between groups t test on the predicted activation data. Group differences were observed in three of the four regions: left ACC: t(95.4) = 3.01, Pbonf = 0.014; right MST: t(72.5) = 1.64, Pbonf = 0.425; right PO: t(82.3) = 3.39, Pbonf = 0.004; right PI: t(88.4) = 3.45, Pbonf = 0.003 (Bonferroni-corrected for four comparisons). In addition, these predictions all mirrored the pattern of empirical data, whereby HCs were characterized by decreased WM load activity relative to SZ. The same pattern of results was found in the default-mode network: t(74.5) = 3.05, P = 0.003 (Fig. 4B).
Predicting behavioral dysfunction
In addition to group differences in brain activity, we validated whether the activation predictions replicated the existing brain-behavior relationships. We first correlated individual differences in actual and predicted activity with WM task accuracy. We found that all ROIs were negatively correlated with behavior, such that greater deactivation was related to improved task accuracy (left ACC: rho = −0.29, Pbonf < 0.001; right MST: rho = −0.26, Pbonf = 0.012; right PO: rho = −0.35, Pbonf < 0.001; right PI: rho = −0.34, Pbonf < 0.001; dmn: rho = −0.29, Pbonf = 0.004; Bonferroni-corrected for five comparisons) (Fig. 5A, top). Using activity flow mapping, the magnitude and direction of these results could be replicated for most comparisons (left ACC: rho = −0.25, Pbonf = 0.023; right PO: rho = −0.27, Pbonf = 0.008; dmn: rho = −0.31, Pbonf = 0.001), but not for the right MST (rho = 0.02, P = 0.86) or PI (rho = −0.17, Pbonf = 0.25; Bonferroni-corrected for five comparisons; Fig. 5A, bottom).
Fig. 5. Relationship between activity flow predictions and individual differences in behavior.

(A) Correlations between SCAP accuracy scores (y axis) and real activity (top) or predicted brain activity (bottom) for each ROI. (B) Comparison between empirical task accuracy and behavioral predictions derived from activity flow mapping. Activity flow could replicate the behavioral dysfunction in the SZ cohort, although with a smaller effect size. *P < 0.05. As noted in the main text, the correlations were Bonferroni corrected for five comparisons.
Leveraging the existing relationship between the empirical activations and behavioral task accuracy (i.e., Fig. 5A), we fit a cross-validated support vector regression (SVR) model with activations predicting behavior and applied the model to the activity flow activations (see Materials and Methods). This process resulted in a new predicted task accuracy for each individual in the SZ cohort (Fig. 5B). Validating the accuracy of the activity flow mapping approach, the predicted SZ task accuracies remained lower than the HC data [t(76.51) = −4.24, P < 0.001]. However, these differences were smaller in magnitude compared to the empirical SZ behavioral data; the predicted task accuracy was higher than the empirical SZ task accuracy [t(70) = 2.42, P = 0.02]. In combination, these results demonstrate that the activity flow mapping approach captured meaningful variance related to the dysfunctional brain-behavior relationships observed in SZ.
Activity flow contributions to dysfunctional activity
Having established that activity flow mapping accurately predicts group-level dysfunction in brain activity, we sought to investigate how these differences arise within the model. Recall that a given activity flow estimate is the sum of individual flow terms (i’s activity × connectivity i-with-j). Activity flow terms therefore represent a potential brain-wide map capturing the regional contributions that give rise to a target activation magnitude. Thus, we investigated how these individual flow terms differed across the two groups, giving rise to dysfunctions in activity (Fig. 6).
Fig. 6. Activity flow contributions to localized dysfunctional activity.
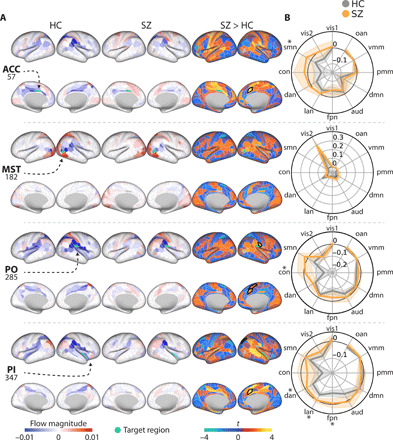
(A) Region-specific activity flow terms (i.e., region i’s activity x connectivity i-with-j) used to predict the target activation (rows) within each cohort. The sum of all terms equals the final activity flow prediction. These spatial maps represent a plausible model of how an individual activation emerges within the activity flow mapping framework. Black borders indicate PFWE < 0.05 (718 comparisons). Subcortical results are presented in fig. S3. (B) Summary polar plots indicating the summation of activity flow terms within each network. The shaded patches indicate 95% confidence intervals. *PFWE < 0.05 (12 comparisons).
The ROIs within the cingulo-opercular network (ACC, PO, and PI) tended to have a spatially similar activity flow profile when contrasting high and low WM demand (Fig. 6A). This pattern was characterized by negative activity flow from the inferior parietal lobule in HC (stemming from the negative activation observed in Fig. 3A). In addition to this common pattern, each region had a distinct pattern of activity flow contributions.
We found select differences in activity flow terms between groups when analyzed at the brain region level. The right ACC showed consistently higher activity flow terms in SZ across the three ROIs [ACC: t(61.48) = 3.87, PFWE = 0.03; PO: t(79.0) = 3.91, PFWE = 0.02; PI: t(81.1) = 3.78, PFWE = 0.03]. The same pattern of increased SZ activity flow terms was observed in the right PO regarding the right supplementary motor area [t(116.4) = 3.86, PFWE = 0.02] and neighboring PO cortex [t(69.8) = 3.78, PFWE = 0.03], as well as the right PI and the intraparietal area [t(88.3) = 4.20, PFWE = 0.007].
At the network level, for the left ACC and right PO, the groups differed in activity flow terms from the sensory-motor [t(88.5) = 2.95, PFWE = 0.025] and the cingulo-opercular network [t(86.27) = 3.84, PFWE = 0.001], respectively (Fig. 6B). In the right PI, groups differed across dorsal attention, frontoparietal, and language functional networks [t(75.5) = 2.70, PFWE = 0.034; t(83.7) = 4.10, PFWE < 0.001; and t(74.7) = 3.61, PFWE = 0.001]. All of these group differences were characterized by increased activity flow terms in the SZ compared to the HC cohorts. Overall, these results suggest dysfunctional activity flow between the source regions and sensorimotor or cognitive control networks in SZ.
As noted in the prior section, activity flow mapping did not produce accurate predictions for the right MST located in the visual cortex. As shown in Fig. 6, this was due to within-network activity flow terms dominating the predicted values. This is in line with recent evidence suggesting that activity flow mapping is less accurate in regions that are lower in the cortical hierarchy (e.g., in visual cortex) due to distributed activity influencing those regions less (24).
Simulating FC changes to normalize patient brain activity and behavior
In our final analysis, we sought to simulate a hypothetical connectivity-based hypothetical “treatment” for SZ. Brain stimulation techniques that alter FC are a potential focal treatment option for psychiatric disorders (25). Therefore, we extended the activity flow mapping framework to investigate the feasibility of changes in FC resulting in normalized dysfunctional brain activations and cognition. Results from this in silico analysis have the potential to generate testable hypotheses guiding future brain stimulation interventions.
Briefly, we used a linear regression model to fit empirical SZ activations to the average healthy activation for each ROI. The model weights were then used to derive the simulated connectivity intervention for each individual (Fig. 7A; see Materials and Methods for full details). The difference between the average empirical FC and the simulated FC is shown in Fig. 7B. Overall, our data-driven connectivity intervention demonstrated increased FC between each target region and regions within the parietal and prefrontal cortices; in conjunction with decreased sensory network (visual and motor cortices), FC would serve to normalize dysfunctional activations and behavior. The four simulated interventions were highly correlated with each other (rmean = 0.71), suggesting that a single connectivity intervention might normalize activity for all four regions. Moreover, the connectivity intervention decreased the similarity in group-averaged FC between the SZ and HC (rmean = 0.54), compared to the empirical data (rmean = 0.92). This suggests that the regression model did not simply replace the existing SZ FC weights with those more similar to healthy participants.
Fig. 7. Hypothetical connectivity intervention in SZ.

(A) A regression model was used to optimize SZ FC to best fit the HC data. The simulated FC was then used to predict activations in the activity flow framework. (B) Average data-driven FC intervention weights for each ROI in the SZ cohort. The four simulated interventions were highly correlated with each other (rmean = 0.92), despite the interventions being calculated independently for each target region. (C) The top/bottom five cortical regions requiring the largest connectivity intervention across ROIs. (D) The FC intervention was verified by applying activity flow mapping with the altered FC; SZ activation levels were normalized (purple) compared to empirical SZ activity (orange) and HC activity (gray). The interventions were calculated and tested using cross-validation, with separate subjects used for intervention calculation and testing. (E) Predicted behavior generated from simulated FC (purple) compared to the empirical task accuracy. By altering SZ FC, our model suggests that behavior would be improved. *P < 0.05.
To verify the simulated FC hypothetical treatment, we repeated the original activity flow mapping analysis to predict a new set of task-evoked activations. We compared the empirical SZ activity values to the predicted activations in SZ (Fig. 7D). For two of the four regions, the predicted activations significantly differed in the same direction as the HC empirical data; left ACC: t(70) = 2.96, Pbonf = 0.02 (corrected for four comparisons); right PI: t(70) = 3.62, Pbonf = 0.002. For the other two regions, activity was decreased but not significantly; right PO: t(70) = 2.34, Pbonf = 0.08; right MST: t(70) = 2.07, Pbonf = 0.17. Then, we applied the newly altered activations to the brain-behavior SVR model previously trained on empirical data (i.e., Fig. 5B). This resulted in a new predicted task accuracy for each individual in the SZ cohort based on their hypothetically altered activations (Fig. 7E). The predicted task accuracies showed marked improvement over the original SZ behavior [12.8% difference; t(70) = −4.76, P < 0.001]. These results demonstrate the plausibility of connectivity-based SZ treatments resulting in normalized cognitive activations and improved cognitive function in SZ.
Control analyses
fMRI data are thought to have 2 to 5 mm of spatial smoothing due to vasculature rather than neural activity (26). This smoothness could potentially bias activity flow estimates by allowing the target activity to “leak” into the source activity. This would introduce some circularity as information from the target would be used to predict the same target. To confirm that this was not the case, we repeated the analyses by excluding all parcels with any vertices within 10 mm of each target region from the set of source regions when calculating FC. Activity flow predictions replicated for the whole-brain result [rHC = 0.53, one-sample t test compared to zero, t(92) = 37.3, P < 0.001, rSZ = 0.48, t(35) = 17.8, P < 0.001] and the group differences in specific brain areas [ROI ACC; t(95.1) = 2.95, Pbonf = 0.02; ROI MST: t(75.2) = 1.33, Pbonf = 0.75; ROI PO: t(84.9) = 3.31, Pbonf = 0.005; ROI PI: t(858) = 3.25, Pbonf = 0.005; Bonferonni-corrected for four multiple comparisons].
The CNP dataset was collected at two different MRI sites. In the current analysis, there were significant differences in the ratio of data collected from the two different MRI sites (77% of data collected from site one in SZ versus 47% in HC; see Table 1). To ensure that our results were not confounded by MRI site, we repeated the analyses in the ROI within a subset of the data demonstrating no MRI site differences between groups (χ2 test, P = 0.15, 64% versus 47%). All of the current SZ subjects were included (N = 36), but 34 HC subjects were excluded (N = 59). Activity flow predictions replicated for the whole-brain results [rHC = 0.64, t(92) = 46.84, P < 0.001, rSZ = 0.60, t(35) = 31.39, P < 0.001] and the group differences in specific brain areas [ROI ACC: t(93.0) = 2.62, P = 0.04; ROI MST: t(81.9) = 0.89, P = 0.99; ROI PO: t(86.1) = 3.07, P = 0.01; ROI PI: t(90.1) = 3.01, P = 0.01].
Table 1. Demographics and basic cognitive and clinical measures.
Welch’s t tests are reported except for the “MRI site” and “sex” variables where χ2 tests were performed.
| HC (n = 93) | SZ (n = 36) | P value | |
| Age, years, and mean (SD) | 33 (8.68) | 35.5 (8.87) | 0.16 |
| Sex, n male (%) | 59 (63.44%) | 26 (72.22%) | 0.46 |
| MRI site one, n (%) | 72 (77.42%) | 17 (47.22%) | 0.002 |
| Education, years, and mean (SD) | 15.16 (1.59) | 12.78 (1.4) | <0.001 |
| Head motion, RMS, and mean (SD) | 0.06 (0.03) | 0.08 (0.03) | 0.002 |
| Cognitive measures | |||
| Matrix reasoning | 20.43 (4.36) | 15.78 (4.68) | <0.001 |
| Letter/number sequencing | 21.05 (2.89) | 17.75 (3.59) | <0.001 |
| Vocabulary | 43.48 (8.66) | 32 (8.99) | <0.001 |
| Clinical measures | |||
| Brief psychiatric rating scale, average score (SD) | |||
| Positive symptoms | 2.8 (1.14) | ||
| Negative symptoms | 1.81 (0.76) | ||
| Mania/disorganization | 1.76 (0.76) | ||
| Depression/anxiety | 2.43 (1.15) | ||
DISCUSSION
Cognitive impairment is a core feature of SZ and is related to both aberrant FC and abnormal task-evoked activity (6). In line with the “dysconnection” hypothesis (5), we proposed that aberrant network interactions (activity flows) lead to altered cognitive activations that produce dysfunctional behavior. To test this prediction, we used activity flow mapping to model the movement of task-related activity between brain regions as a function of FC. We showed that behavior-related dysfunctional activations could be accurately predicted from spatially distributed sources, suggesting that FC plays a key role in producing aberrant activity and behavior in SZ. Specifically, we observed increased activity flow between sensorimotor and cognitive control networks in SZ, which resulted in clinically relevant reduced deactivations suggestive of an inability to deactivate distracting information. Building on these results, using data-driven simulations, we found that altering regions within the parietal and prefrontal cortices provided the most optimal intervention in normalizing activity and behavioral performance in individuals with SZ.
Deficits in WM have been consistently observed in SZ (27, 28). Cognitive tasks that engage WM typically involve activation of the frontoparietal network (FPN) and deactivation of the default-mode network (DMN). Increased dissociation between these two systems is thought to be beneficial for task performance (3, 29, 30). While both HC and SZ cohorts engaged these networks, we observed significantly reduced deactivations in SZ within the DMN. Task-evoked deactivations have been interpreted as the suppression of goal-irrelevant functions supported by the DMN (e.g., mind wandering) (3, 21) and may be a critical trait marker in SZ (22).
We found the same pattern of reduced deactivation, as we observed in the DMN, within four cortical areas belonging to the cingulo-opercular network (CON) and visual network (labeled in Fig. 3A). Activation patterns in these regions correlated with performance on the spatial WM task and other, more general cognitive deficits (e.g., in reasoning and attention). These empirical observations add to a growing literature implicating CON dysfunction in SZ (8), which may represent the breakdown in perception-action cycles often observed in SZ (31).
To test the idea that aberrant task-evoked activations emerge from distributed FC, we used activity flow mapping, which is a recently developed method based on neural network simulations (12, 13). This approach models a given activation as the FC-weighted sum of all other brain regions’ activity. Activity flow mapping complements traditional methods that estimate where group differences emerge by attempting to model how these activation differences emerge from FC interactions. As in previous work with empirical fMRI data from HCs (12, 14) and patients with Alzheimer’s disease (16), we found that this approach was broadly accurate at predicting task-evoked activity across the whole brain at the individual-subject level (correlation between real and prediction values = 0.60). Confirming our hypothesis, group differences in activation within the ROIs were recapitulated by activity flow predictions, suggesting that distributed activity flows over FC play an important role in shaping abnormal task-evoked activation magnitudes in SZ.
Relatively small differences in FC between groups were observed (i.e., only 3 of 2868 possible connections with the abnormally activated regions survived multiple comparison correction). This would suggest that dysconnection is unlikely to fully explain the aberrant activations. On the other hand, given that all regions with significantly altered activations were held out of each activity flow modeling analysis, normal FC spreading dysfunctional activity between brain regions is not likely either. Rather, it is likely that both subthreshold dysfunctional FC and activity interact to produce dysfunction activation. Another prominent possibility is that activity flow processes, which are weighted sums of distributed activations, pool a large number of subthreshold aberrant activations (possibly over healthy FC) to produce significant aberrant activations. While large-scale FC dysconnectivity is well characterized in SZ (6, 8), these results highlight the likely contribution of abnormal local (within-region) processing as well (32). The high accuracy of most of the activity flow predictions suggests that even if diffuse local (within-region) processing is the fundamental cause of SZ dysfunction (e.g., from subtle glutamate receptor malfunctions), that dysfunction is spread and likely pooled via activity flow processes to create significant dysfunctional localized activations.
For each aberrant brain region we examined, the sources of activity flow contributions differed. This result supports the idea that a brain region’s function (or in this case, dysfunction) is determined by its unique connectivity profile (33, 34). The dysfunctional reduced deactivations observed in SZ were associated with increased activity flow from sensorimotor and cognitive control networks, when compared to HC. However, in the ROI located within the visual cortex (ROI 182), activity flow mapping performed poorly. This is potentially due to the high degree of local processing in that specific brain region, which would not be captured by the assumption of distributed processing within the activity flow framework (24).
Brain stimulation techniques that alter FC are being increasingly seen as a potential focal treatment option for psychiatric disorders (25). To gain insight into FC-based treatment in SZ, we simulated a hypothetical connectivity-based intervention. Our simulation suggested that increased FC between the dysfunctional ROIs and select brain regions in the prefrontal and parietal cortices FPN led to predictions of significantly improved brain activity and behavior. The simulated FC interventions were numerically small, supporting the idea that subtle (though perhaps widespread) changes in FC can have a large impact on behavior (35, 36) and clinical status (37). Critically, the FC generated by the in silico intervention was less similar to HC than the empirical data, suggesting that simply normalizing the FC was not effective at transforming unhealthy activations. Instead, this would suggest that future FC interventions should aim to correct both FC dysfunction and existing abnormal local activity.
Existing attempts to use brain stimulation as a therapeutic intervention in SZ have largely focused on stimulating dorsolateral prefrontal cortex with mixed outcomes (38, 39). The evidence for prefrontal cortex (PFC) stimulation sites in SZ is supported by its abnormal activation during cognitive control (4, 40), its disrupted connectivity profile (41, 42), and neurotransmitter regulation (43). Our data-driven simulation complements these observations by corroborating the role of PFC in SZ dysfunction and providing new hypotheses to test regarding particular parietal and temporal lobe regions (see Fig. 7). A key avenue for future research will be incorporating data-driven brain models into personalized stimulation treatments (25).
We deliberately investigated SZ in a case control design for two reasons. First, the spatial WM task used here has previously demonstrated clinically relevant group differences in brain activity (4). Second, SZ research has identified abnormal connectivity as a key factor in producing abnormal brain activity and behavior (5, 7). However, it is becoming increasingly recognized that psychiatric disorder categories may not carve nature at its joints, resulting in high heterogeneity within disorders, and overlap between disorders (44). This is exemplified by recent studies that have demonstrated commonalities in connectivity disruptions across multiple disorders (45). Pertinent to the current study, cognitive deficits are also common in many other psychiatric disorders (46). This suggests that the current results may not be specific to SZ per se but may reflect general effects observable across multiple disorders. Another consideration is the effect of medication on brain activity in SZ (47). The current cohort was medicated, and, although highly similar dysfunctional brain activations during WM tasks have been demonstrated in unmedicated cohorts (48), it will be valuable to investigate the effects of medications on activity flow estimates. These analyses will likely provide information to link drug-induced FC changes to normalized brain activations and behavior. Likewise, as more data become available, it will be important for future studies to replicate the effects uncovered in the current analyses.
Activity flow predictions replicated critical empirical effects, such as group status and correlations with behavior; however, the prediction magnitudes at the single-subject level (r = 0.60) underperformed compared to previous work (12). We believe that this is likely due to the data quality in the current dataset, compared to the gold-standard Human Connectome Project, which was used in previous work. Maximizing the amount of data used in the FC estimation has been shown to improve performance (14). An argument could be made that poorer brain mapping results are unavoidable in clinical cohorts, but we found similar prediction accuracies in both HCs and patients. Potential discrepancies between the two groups may have been avoided by our stringent head motion removal and participant exclusion procedures (see Materials and Methods). Aside from data quality, improvements could also be made to the activity flow mapping approach. The current iteration of activity flow is a linear model, and adding more complexity will likely produce better predictions of empirical data (13). For example, models of early visual cortex are more accurate when incorporating nonlinearities (49). Considering the MST ROI, a visual cortex brain region that the current linear activity flow predicted poorly, it is possible that adding nonlinear terms to this problem would result in improvements in model performance. Moreover, we examined differences in activation defined by an arbitrary statistical threshold (PFWE < 0.05; Fig. 3); an interesting extension of the activity flow framework will include the interpretation of subthreshold activation predictions.
In conclusion, by linking FC and brain activity in a single methodological approach, we have demonstrated that clinically relevant activations and behavior in SZ are related to (and plausibly caused by) dysfunctional flow of activity across FC networks. The current results also generate new hypotheses regarding brain stimulation sites for the treatment of cognitive deficits in SZ. Future work should aim to extend the activity flow mapping framework across multiple psychiatric disorders with the aim of developing clinically useful personalized brain models.
MATERIALS AND METHODS
Participants
The data used in this study were obtained from the UCLA CNP LA5c Study via the OpenNeuro database (accession number: ds000030) (17, 50). The CNP contains multimodal brain imaging and behavioral data from healthy adults (n = 130) and those with attention deficit hyperactivity disorder (n = 43), bipolar (n = 49), or SZ (n = 50) diagnoses. All participants were right-handed. Diagnoses were based on the Diagnostic and Statistical Manual of Mental Disorders, Fourth Edition-Text Revision (DSM-IV), per the Structured Clinical Interview for DSM-IV (SCID-I). Full details regarding the original participant recruitment, exclusions, and study procedures can be found in the corresponding data paper (17). Participants gave written informed consent following procedures approved by the Institutional Review Boards at UCLA and the Los Angeles County Department of Mental Health. Data from the CNP have previously been used to predict SZ status (51, 52), as well as characterize psychiatric illness across disorders (53, 54).
For the purposes of the current study, we leveraged an age- and sex-matched subset of the HC (n = 93) and SZ (n = 36, exclusions due to missing data and head motion, clarified in subsequent sections) cohorts (see Table 1 for basic demographics). Most of the participants (n = 27) in the SZ cohort had an SZ diagnosis (DSM-IV-TR), and the remaining were diagnosed with schizoaffective disorder (n = 9). Almost all patients at the time of testing were medicated (n = 32; see table S2).
The spatial capacity WM task
In the current study, we focused on the SCAP task, which has previously been used to identify behavioral and brain activation differences between HC and SZ cohorts (4, 18). During the SCAP, participants are shown an array of one, three, five, or seven yellow circles positioned pseudo-randomly around a fixation cross (2 s). A variable length delay screen is then shown (1.5, 3, or 4.5 s), followed by a single green target circle (3-s fixed response). Participants were asked to indicate whether the green circle was in the same position as any of the yellow circles in the initial array. On half the trials, the green and yellow circles were aligned (true-positive), with the other half being true-negative. In total, 48 trials were completed (12 for each array set size and 4 for each delay length). Before completing the SCAP in the scanner, participants underwent a supervised instruction and training period.
In the current study, we contrasted brain and behavioral data from the one and three sized arrays (low WM, 24 trials) versus the five and seven sized arrays (high WM, 24 trials) while ignoring the delay factor. The behavioral data from the SCAP was analyzed by contrasting accuracy and mean reaction time between the high and low WM conditions. The total accuracy (score of 48) was also used to correlate brain and behavioral variables. A single HC subject was excluded due to poor performance on the task (accuracy = 31%, z = −5.32).
Data acquisition and preprocessing
The CNP dataset (17) was acquired on one of two 3T Siemens Trio scanners at either the Ahmanson-Lovelace Brain Mapping Center (Siemens version Syngo MR B15) or the Staglin Center for Cognitive Neuroscience at UCLA (Siemens version Syngo MR B17). Functional MRI data were collected using a T2*-weighted echo-planar imaging sequence [slice thickness = 4 mm, 34 slices, time repetition (TR) = 2 s, echo time (TE) = 30 ms, flip angle = 90°, matrix = 64 × 64, and field of view (FOV) = 192 mm (oblique slice orientation)]. Functional data acquisition included a resting-state scan and seven task paradigms. Structural Magnetization Prepared Rapid Acquisition Gradient Echo (MPRAGE) scans were used for image preprocessing (TR = 1.9 s, TE = 2.26 ms, FOV = 250 mm, matrix = 256 × 256, sagittal plane, slice thickness = 1 mm, 176 slices). Data collection was split across two separate days, the order of which was counterbalanced across participants. Before further analysis, several participants were excluded on the basis of poor quality or missing data, as identified by Gorgolewski et al. (50). Complete details for the CNP data collection and task paradigms can be found elsewhere (17).
Functional and anatomical data underwent a standard volumetric preprocessing pipeline using fMRIprep (55, version 1.1.8), a nipype-based tool (56). Following fMRIprep, the data were further processed using Ciftify (57). Ciftify facilitates the analysis of legacy datasets (such as the CNP, with no T2-weighted structural images) to adopt aspects of the “gold standard” Human Connectome Project approach (20). Ultimately, this allows the analyses to be conducted within “grayordinate” space, incorporating both surface vertices and subcortical voxels, the advantages of which have been outlined in prior research (20, 57, 58). See Supplementary Text for full details of the fMRIprep and Ciftify pipelines. The grayordinate data were then downsampled into the Cole-Anticevic Brain-wide network partition (CAB-NP), a recent whole-brain cortical and subcortical atlas comprised 718 brain regions across the cortex (n = 360) and subcortex (n = 358) (19).
After downsampling, additional standard preprocessing steps were performed on the parcellated resting-state and task-state fMRI data. For the resting-state data, the first four TRs were removed. All data were subjected to demeaning, detrending, and nuisance regression. The nuisance regression pipeline was based on the empirical tests performed by Ciric et al. (59). Specifically, six primary motion parameters were removed, along with their derivatives and the quadratics of all regressors (24 motion regressors in total). Physiological noise was modeled on the basis of white matter and ventricle signals using aCompCor (60) within fMRIprep. Five component signals were used, as well as their derivatives and the quadratics of all physiological noise regressors (20 physiological noise regressors in total).
In addition, for the resting-state data, we used relative root mean square (RMS) displacement to identify high movement frames in the data (>0.25 mm,). For each of these data points, an additional “spike” regressor was added. We also excluded participants with generally high motion; any participants with more than 20% of their data in any given functional run above the high motion cutoff (relative RMS > 0.25) were excluded from the analyses (HC = 6; SZ = 12). The nuisance regression pipeline was completed immediately before FC estimation for the resting-state data. For the task-based analyses, the regressors were incorporated into the task design matrix.
Task activation estimation
For the SCAP task, activations were estimated using a standard GLM. For each trial, a single boxcar function was used from the onset of the encoding period to the end of the response period (6.5 to 9.5 s depending on delay condition). For each condition (12; 4 WM × 3 delay), this was convolved with the canonical SPM hemodynamic response function and entered into the GLM, as well as the nuisance regressors. The result was a region (718) by condition (12) matrix of regression coefficients representing activation amplitudes for each participant. For most of the analyses, these activations were averaged across WM load and subtracted from one another (high to low). For the main analysis, we performed a between groups t test (SZ > HC) on this contrast, corrected for multiple comparisons (see the “Statistical analyses” section). We also performed this analysis at the level of networks by averaging and contrasting values within the 12 predefined functional networks in the CAB-NP atlas (19). Regions and networks that demonstrated a significant group effect were correlated with behavioral data.
FC estimation
Task-general FC was estimated using both resting-state and data from three remaining tasks performed in the scanner (balloon analog risk, stop signal, and task switching). This decision was motivated by the relatively few time points within the resting-state data relative to the number of regions within the brain parcellation (152 time points versus 718 regions), as well as the potential for task-state FC to be a better predictor of individual differences and activity flow estimates (14). For the task data, we used finite impulse response (FIR) modeling (nine parameters, equivalent to 18 s) to remove the mean task-evoked activation response for each condition. FIR has recently been shown to reduce both false-positive and false-negative rates in the context of task FC estimates (61). The nuisance regressors were also added to the GLM. The residuals for each task were concatenated with the resting-state data into a single time series, which were used to calculate FC.
Principal components regression was used to estimate FC. Previous work has determined that multiple regression approaches tend to perform better than Pearson correlation within the activity flow mapping framework by removing indirect connections (12). We opted for principal components analysis (PCA) regression (as opposed to multiple regression) due to the similar number of overall time points to observations in the current study (811 versus 718), which we have used successfully before in datasets with similar properties (12, 15, 16). In this analysis, rather than using every other time series as a predictor for a given brain region (as in multiple regression), a PCA is conducted to limit the number of predictors in the regression model. The resulting b values are then projected into the original brain region space (from principal component space) to achieve Nregion − 1 β coefficients (717), which are used as FC edge weights for a given region. The principal components were calculated independently for each to-be-predicted region. When performed across regions, a region × region (718 × 718) FC matrix was computed for each participant. We chose to use the top 100 components in the PCA regression; however, we completed control analyses to ensure that this did not significantly affect the activity flow mapping results (see fig. S5).
For each ROI identified in the GLM, we performed a between groups t test (SZ > HC) comparing FC values between the ROI and all other brain regions, corrected for multiple comparisons (see the “Statistical analyses” section). We also performed this analysis at the level of networks by averaging and contrasting values within the 12 predefined functional networks in the CAB-NP atlas (19).
Activity flow mapping
Activity flow mapping was developed as a method to quantify the relationship between FC and task-evoked activations (12). Inspired by connectionist principles (11, 13), activity flow mapping posits that task-evoked activity is propagated between brain regions via FC. Hence, in any given task state, a target activation is modeled as the sum of all other source activations during the same task, after each activation is multiplied by connectivity between the target and each source.
Equation 1. The activity flow algorithm
| (1) |
where P is the predicted mean activation for region j in a given task, Ai is the actual mean activation for region i in a given task (a β value estimated using a GLM), i indexes all brain regions (vector V) with the exception of region j, and Fij is the FC estimate between region i and region j. As well as holding out the target region (j) from each prediction, any brain region that demonstrated a significant group (SZ versus HC) task activation effect was also held out. This was to ensure that accurate predictions did not rely upon simply transferring dysfunction from one dysfunctional region to another; rather, they had to arise from distributed sources. The algorithm results in a matrix with predicted activations across all nodes and task conditions.
Given a set of predictions that match the original activity data in shape (e.g., region × condition × participant), standard assessments of prediction accuracy, such as those used in machine learning, were used. Here, we assessed prediction accuracy for each participant using correlation (Pearson r), MAE, and the R2. Accuracy values were averaged across conditions and participants before being reported in text. Code to conduct activity flow mapping and the subsequent statistics is publicly available via the Brain Activity Flow (“Actflow”) Toolbox (https://colelab.github.io/ActflowToolbox/).
In addition to the standard assessments of accuracy at the participant level noted above, we also tested whether the predicted data could replicate the group-level activity differences observed in the empirical data. To do so, we repeated the high versus low WM contrast and group-level t tests in the ROIs (five t tests in total). As in the empirical data, the same regions/networks were correlated with behavior to test whether activity flow predictions preserved behaviorally relevant patterns of activity.
Probing activity flow predictions
In the current study, we wanted to investigate how dysfunctional activations in SZ arise from distributed activity and connectivity. Assuming activity flow mapping produces accurate predictions, the magnitude of the activity flow terms (i.e., AiFij in Eq. 1) represents a plausible model of information/activity-level flow between a given source region and the target region. Group differences in activity flow terms therefore represent dysfunction that is either transferred from a source region (or network) to the target activation or dysfunction that arises in the target region due to a connectivity-based transformation from source to target. To quantify this, for each dysfunctional region (identified in the GLM), we compared each activity flow term in a between groups t test, corrected for multiple comparisons. We also performed this analysis at the level of networks by summing and contrasting values within the 12 predefined functional networks in the CAB-NP atlas (19).
Simulating a hypothetical connectivity intervention
Considering that we have a model of how a dysfunctional localized activation emerges in SZ, an interesting question is raised: What would need to change in the SZ data to normalize dysfunctional activity and behavior? In line with the dysconnection hypothesis (5), we sought to develop a simulated FC “intervention” to answer this question. Briefly, we used a regression model to fit patient activations to healthy activation levels in the ROI identified by the GLM. The resulting β weights were interpreted as “simulated FC.” We then tested the simulated FC by using activity flow mapping to produce new, altered activity predictions. In the final step, we used the altered activations to generate predictions of SCAP task accuracy, which were compared to the original empirical data (see fig. S6).
Hypothetical FC model fitting
Using PyTorch (62), we implemented a linear regression model with gradient descent. Gradient descent was used (rather than standard linear regression) so that the regression weights (β) could be initialized as the empirical SZ FC, therefore preserving properties of the empirical data. A separate model was performed for each ROI. For each regression model, the predictors (X) were the individual empirical activations from the SZ cohort, and the response variable (y) was the average HC value for the same brain region. No intercept was included in the model. We used standard model hyperparameters; the optimizer was stochastic gradient descent, the loss function was mean standard error loss, and the learning rate was set to 1 × 10⁻³. The algorithm was repeated 200 times.
A fourfold cross-validation scheme was used (75% of participants used for training and 25% for testing). Within each training set, the regression weights were contrasted with the empirical SZ FC to derive a difference score, the magnitude of the FC intervention. This change in FC was then applied to the empirical SZ FC in the held-out test set to create the hypothetically altered FC. The result was a set of altered FC weights for each ROI and participant that yielded the optimal normalization of their activations.
Effect of connectivity intervention on activations and task accuracy
As an alternative to reporting the cross-validated model fit, the altered FC was verified by quantifying the extent to which predictions of brain activity and behavior in SZ became more similar to HC. Thus, in each test set, the altered FC and empirical activations were subjected to the activity flow mapping framework (described in the previous section) to produce altered activations for the SZ cohort. These values were statistically compared to the SZ empirical data to test whether the existing group effect had been normalized. Showing such an effect would be nontrivial, given that the intervention model was trained on data from independent participants (using cross-validation).
To relate the normalized activations to behavior, we used an SVR model using default parameters in scikit-learn (63) (kernel = rbf, gamma = scale, epsilon = 0.01). For the SVR model, the predictors (X) were the empirical activations from participants in the four ROIs, and the response variable (y) was the total accuracy on the SCAP task (only using data from the training set). This model was then applied to the altered activations in the test SZ cohort produced by the hypothetical connectivity intervention, resulting in a behavioral prediction for each SZ participant. The predicted behavior was then statistically compared to the empirical behavior in the SZ cohort.
Statistical analyses
Because of the differences in group sizes, Welch’s t test was used for group comparisons. Likewise, because of the nonnormal distribution of behavioral variables, correlations were conducted using Spearman’s rank correlation. Where noted, we used the MaxT permutation approach (10,000 permutations) to perform FWE multiple comparison correction.
Acknowledgments
The content is solely the responsibility of the authors and does not necessarily represent the official views of any of the funding agencies. We acknowledge the Office of Advanced Research Computing (OARC) at Rutgers, The State University of New Jersey for providing access to the Amarel cluster and associated research computing resources that have contributed to the results reported here. Funding: We acknowledge support by the U.S. NIH under awards R01AG055556 (M.W.C.), R01MH109520 (M.W.C.), R01MH112189 (A.A.), and R01MH108590 (A.A.). G.R. was supported by the Slovenian Research Agency grants J7-8275, J3-9264, J7-6829, P3-0338, P5-0110, and J7-5553. B.P.K. was supported by a National Institute of Mental Health Mentored Career Development Award (K01MH108783). L.J.H. was supported by an Australian Government National Health and Medical Research Council Emerging Leader 1 Investigator Grant (APP1194070). Author contributions: L.J.H., R.D.M., and M.W.C. conceptualized the study. L.J.H. conducted the analyses and wrote the first draft of the manuscript. L.J.H., R.D.M., B.P.K., G.R., A.A., and M.W.C. edited the manuscript. Competing interests: L.J.H., R.D.M., M.W.C., and B.P.K. declare that they have no competing interests. G.R. and A.A. are shareholders in RBNC Therapeutics (previously Blackthorn Therapeutics). A.A. is listed as co-author on the following pending patents: A. Anticevic, J. D. Murray, and J. L. Ji: “Systems and Methods for Neuro-Behavioral Relationships in Dimensional Geometric Embedding (N-BRIDGE),” US20210005306A1, filed by Yale University on 13 March 2019; and J. D. Murray, A. Anticevic, and W.J. Martin: “Methods and systems for computer-generated predictive application of neuroimaging and gene expression mapping data,” US20190355439A, filed by Blackthorn Therapeutics Inc. on 2 October 2018. G.R. consults for RBNC Therapeutics, and A.A. is a member of the Technology Advisory Board and consultant to RBNC Therapeutics. The authors declare that they have no other competing interests. Data and materials availability: All data needed to evaluate the conclusions in the paper are present in the paper and/or the Supplementary Materials. The data used in this manuscript were obtained from the OpenNeuro database (https://openneuro.org/datasets/ds000030/). All code related to analyses in this study are available at https://github.com/ColeLab/ClinicalActFlow_release/. Additional data related to this paper may be requested from the authors.
SUPPLEMENTARY MATERIALS
Supplementary material for this article is available at http://advances.sciencemag.org/cgi/content/full/7/29/eabf2513/DC1
REFERENCES AND NOTES
- 1.Kahn R. S., Keefe R. S., Schizophrenia is a cognitive illness: Time for a change in focus. JAMA Psychiat. 70, 1107–1112 (2013). [DOI] [PubMed] [Google Scholar]
- 2.Pettersson-Yeo W., Allen P., Benetti S., McGuire P., Mechelli A., Dysconnectivity in schizophrenia: Where are we now? Neurosci. Biobehav. Rev. 35, 1110–1124 (2011). [DOI] [PubMed] [Google Scholar]
- 3.Anticevic A., Cole M. W., Murray J. D., Corlett P. R., Wang X.-J., Krystal J. H., The role of default network deactivation in cognition and disease. Trends Cogn. Sci. 16, 584–592 (2012). [DOI] [PMC free article] [PubMed] [Google Scholar]
- 4.Cannon T. D., Glahn D. C., Kim J., Van Erp T. G. M., Karlsgodt K., Cohen M. S., Nuechterlein K. H., Bava S., Shirinyan D., Dorsolateral prefrontal cortex activity during maintenance and manipulation of information in working memory in patients with schizophrenia. Arch. Gen. Psychiatry 62, 1071–1080 (2005). [DOI] [PubMed] [Google Scholar]
- 5.Friston K. J., Brown H. R., Siemerkus J., Stephan K. E., The dysconnection hypothesis (2016). Schizophr. Res. 176, 83–94 (2016). [DOI] [PMC free article] [PubMed] [Google Scholar]
- 6.van den Heuvel M. P., Fornito A., Brain networks in schizophrenia. Neuropsychol. Rev. 24, 32–48 (2014). [DOI] [PubMed] [Google Scholar]
- 7.E. Kraepelin, Dementia Praecox and Paraphrenia (Livingstone, 1919). [Google Scholar]
- 8.Dong D., Wang Y., Chang X., Luo C., Yao D., Dysfunction of large-scale brain networks in schizophrenia: A meta-analysis of resting-state functional connectivity. Schizophr. Bull. 44, 168–181 (2018). [DOI] [PMC free article] [PubMed] [Google Scholar]
- 9.Supekar K., Cai W., Krishnadas R., Palaniyappan L., Menon V., Dysregulated brain dynamics in a triple-network saliency model of schizophrenia and its relation to psychosis. Biol. Psychiatry 85, 60–69 (2019). [DOI] [PubMed] [Google Scholar]
- 10.Stephan K. E., Baldeweg T., Friston K. J., Synaptic plasticity and dysconnection in schizophrenia. Biol. Psychiatry 59, 929–939 (2006). [DOI] [PubMed] [Google Scholar]
- 11.Rumelhart D. E., Hinton G. E., McClelland J. L., A general framework for parallel distributed processing. Parallel Distrib. Process. Explorations Microstruct. Cognition 1, 26 (1986). [Google Scholar]
- 12.Cole M. W., Ito T., Bassett D. S., Schultz D. H., Activity flow over resting-state networks shapes cognitive task activations. Nat. Neurosci. 19, 1718–1726 (2016). [DOI] [PMC free article] [PubMed] [Google Scholar]
- 13.Ito T., Hearne L., Mill R., Cocuzza C., Cole M. W., Discovering the computational relevance of brain network organization. Trends Cogn. Sci. 24, 25–38 (2020). [DOI] [PMC free article] [PubMed] [Google Scholar]
- 14.Cole M. W., Ito T., Cocuzza C., Sanchez-Romero R., The functional relevance of task-state functional connectivity. J. Neurosci. 41, 2684–2702 (2021). [DOI] [PMC free article] [PubMed] [Google Scholar]
- 15.Ito T., Kulkarni K. R., Schultz D. H., Mill R. D., Chen R. H., Solomyak L. I., Cole M. W., Cognitive task information is transferred between brain regions via resting-state network topology. Nat. Commun. 8, 1027 (2017). [DOI] [PMC free article] [PubMed] [Google Scholar]
- 16.Mill R. D., Gordon B. A., Balota D. A., Cole M. W., Predicting dysfunctional age-related task activations from resting-state network alterations. Neuroimage 221, 117167 (2020). [DOI] [PMC free article] [PubMed] [Google Scholar]
- 17.Poldrack R. A., Congdon E., Triplett W., Gorgolewski K. J., Karlsgodt K. H., Mumford J. A., Sabb F. W., Freimer N. B., London E. D., Cannon T. D., Bilder R. M., A phenome-wide examination of neural and cognitive function. Sci. Data 3, 160110 (2016). [DOI] [PMC free article] [PubMed] [Google Scholar]
- 18.Glahn D. C., Therman S., Manninen M., Huttunen M., Kaprio J., Lönnqvist J., Cannon T. D., Spatial working memory as an endophenotype for schizophrenia. Biol. Psychiatry 53, 624–626 (2003). [DOI] [PubMed] [Google Scholar]
- 19.Ji J. L., Spronk M., Kulkarni K., Repovš G., Anticevic A., Cole M. W., Mapping the human brain’s cortical-subcortical functional network organization. Neuroimage 185, 35–57 (2019). [DOI] [PMC free article] [PubMed] [Google Scholar]
- 20.Glasser M. F., Smith S. M., Marcus D. S., Andersson J. L. R., Auerbach E. J., Behrens T. E. J., Coalson T. S., Harms M. P., Jenkinson M., Moeller S., Robinson E. C., Sotiropoulos S. N., Xu J., Yacoub E., Ugurbil K., Van Essen D. C., The Human Connectome Project’s neuroimaging approach. Nat. Neurosci. 19, 1175–1187 (2016). [DOI] [PMC free article] [PubMed] [Google Scholar]
- 21.Anticevic A., Repovs G., Barch D. M., Working memory encoding and maintenance deficits in schizophrenia: Neural Evidence for activation and deactivation abnormalities. Schizophr. Bull. 39, 168–178 (2013). [DOI] [PMC free article] [PubMed] [Google Scholar]
- 22.Landin-Romero R., McKenna P., Salgado-Pineda P., Sarró S., Aguirre C., Sarri C., Compte A., Bosque C., Blanch J., Salvador R., Pomarol-Clotet E., Failure of deactivation in the default mode network: A trait marker for schizophrenia? Psychol. Med. 45, 1315–1325 (2015). [DOI] [PubMed] [Google Scholar]
- 23.Weinberger D. R., A connectionist approach to the prefrontal cortex. J. Neuropsychiatry Clin. Neurosci. 5, 241–253 (1993). [DOI] [PubMed] [Google Scholar]
- 24.Ito T., Hearne L. J., Cole M. W., A cortical hierarchy of localized and distributed processes revealed via dissociation of task activations, connectivity changes, and intrinsic timescales. Neuroimage 221, 117141 (2020). [DOI] [PMC free article] [PubMed] [Google Scholar]
- 25.Cocchi L., Zalesky A., Personalized transcranial magnetic stimulation in psychiatry. Biol. Psych. Cognitive Neurosci. Neuroimaging 3, 731–741 (2018). [DOI] [PubMed] [Google Scholar]
- 26.Logothetis N. K., Wandell B. A., Interpreting the BOLD signal. Annu. Rev. Physiol. 66, 735–769 (2004). [DOI] [PubMed] [Google Scholar]
- 27.Heinrichs R. W., The primacy of cognition in schizophrenia. Am. Psych. 60, 229–242 (2005). [DOI] [PubMed] [Google Scholar]
- 28.Schaefer J., Giangrande E., Weinberger D. R., Dickinson D., The global cognitive impairment in schizophrenia: Consistent over decades and around the world. Schizophr. Res. 150, 42–50 (2013). [DOI] [PMC free article] [PubMed] [Google Scholar]
- 29.Fox M. D., Snyder A. Z., Vincent J. L., Corbetta M., Essen D. C. V., Raichle M. E., The human brain is intrinsically organized into dynamic, anticorrelated functional networks. Proc. Natl. Acad. Sci. U.S.A. 102, 9673–9678 (2005). [DOI] [PMC free article] [PubMed] [Google Scholar]
- 30.Hearne L., Cocchi L., Zalesky A., Mattingley J. B., Interactions between default mode and control networks as a function of increasing cognitive reasoning complexity: Brain dynamics and relational complexity. Hum. Brain Mapp. 36, 2719–2731 (2015). [DOI] [PMC free article] [PubMed] [Google Scholar]
- 31.Palaniyappan L., Liddle P. F., Does the salience network play a cardinal role in psychosis? An emerging hypothesis of insular dysfunction. J. Psychiatry Neurosci. 37, 17–27 (2012). [DOI] [PMC free article] [PubMed] [Google Scholar]
- 32.Shaw A. D., Knight L., Freeman T. C. A., Williams G. M., Moran R. J., Friston K. J., Walters J. T. R., Singh K. D., Oscillatory, computational, and behavioral evidence for impaired GABAergic inhibition in schizophrenia. Schizophr. Bull. 46, 345–353 (2020). [DOI] [PMC free article] [PubMed] [Google Scholar]
- 33.Mars R. B., Passingham R. E., Jbabdi S., Connectivity fingerprints: From areal descriptions to abstract spaces. Trends Cogn. Sci. 22, 1026–1037 (2018). [DOI] [PMC free article] [PubMed] [Google Scholar]
- 34.Passingham R. E., Stephan K. E., Kötter R., The anatomical basis of functional localization in the cortex. Nat. Rev. Neurosci. 3, 606–616 (2002). [DOI] [PubMed] [Google Scholar]
- 35.Cole M. W., Bassett D. S., Power J. D., Braver T. S., Petersen S. E., Intrinsic and task-evoked network architectures of the human brain. Neuron 83, 238–251 (2014). [DOI] [PMC free article] [PubMed] [Google Scholar]
- 36.Krienen F. M., Yeo B. T., Buckner R. L., Reconfigurable task-dependent functional coupling modes cluster around a core functional architecture. Philos. Trans. R. Soc. B Biol. Sci. 369, 20130526 (2014). [DOI] [PMC free article] [PubMed] [Google Scholar]
- 37.Spronk M., Kulkarni K., Ji J. L., Keane B., Anticevic A., Cole M. W., A whole-brain and cross-diagnostic perspective on functional brain network dysfunction. Cereb Cortex 31, 547–561 (2018). [DOI] [PMC free article] [PubMed] [Google Scholar]
- 38.Kumar N., Vishnubhatla S., Wadhawan A. N., Minhas S., Gupta P., A randomized, double blind, sham-controlled trial of repetitive transcranial magnetic stimulation (rTMS) in the treatment of negative symptoms in schizophrenia. Brain Stimul. 13, 840–849 (2020). [DOI] [PubMed] [Google Scholar]
- 39.Lett T. A., Voineskos A. N., Kennedy J. L., Levine B., Daskalakis Z. J., Treating working memory deficits in schizophrenia: A review of the neurobiology. Biol. Psychiatry 75, 361–370 (2014). [DOI] [PubMed] [Google Scholar]
- 40.Callicott J. H., Mattay V. S., Verchinski B. A., Marenco S., Egan M. F., Weinberger D. R., Complexity of prefrontal cortical dysfunction in schizophrenia: More than up or down. Am. J. Psychiatry. 160, 2209–2215 (2003). [DOI] [PubMed] [Google Scholar]
- 41.Fornito A., Yoon J., Zalesky A., Bullmore E. T., Carter C. S., General and specific functional connectivity disturbances in first-episode schizophrenia during cognitive control performance. Biol. Psychiatry 70, 64–72 (2011). [DOI] [PMC free article] [PubMed] [Google Scholar]
- 42.Meyer-Lindenberg A., Poline J.-B., Kohn P. D., Holt J. L., Egan M. F., Weinberger D. R., Berman K. F., Evidence for abnormal cortical functional connectivity during working memory in schizophrenia. Am. J. Psychiatry. 158, 1809–1817 (2001). [DOI] [PubMed] [Google Scholar]
- 43.Lewis D. A., Moghaddam B., Cognitive dysfunction in schizophrenia: Convergence of γ-Aminobutyric acid and glutamate alterations. Arch. Neurol. 63, 1372–1376 (2006). [DOI] [PubMed] [Google Scholar]
- 44.Insel T., Cuthbert B., Garvey M., Heinssen R., Pine D. S., Quinn K., Sanislow C., Wang P., Research Domain Criteria (RDoC): Toward a new classification framework for research on mental disorders. Am. J. Psychiatry. 167, 748–751 (2010). [DOI] [PubMed] [Google Scholar]
- 45.Sha Z., Wager T. D., Mechelli A., He Y., Common dysfunction of large-scale neurocognitive networks across psychiatric disorders. Biol. Psychiatry 85, 379–388 (2019). [DOI] [PubMed] [Google Scholar]
- 46.Diamond A., Executive functions. Annu. Rev. Psychol. 64, 135–168 (2013). [DOI] [PMC free article] [PubMed] [Google Scholar]
- 47.Nejad A. B., Ebdrup B. H., Glenthøj B. Y., Siebner H. R., Brain connectivity studies in schizophrenia: Unravelling the effects of antipsychotics. Curr. Neuropharmacol. 10, 219–230 (2012). [DOI] [PMC free article] [PubMed] [Google Scholar]
- 48.Nejad A. B., Ebdrup B. H., Siebner H. R., Rasmussen H., Aggernæs B., Glenthøj B. Y., Baaré W. F. C., Impaired temporoparietal deactivation with working memory load in antipsychotic-naïve patients with first-episode schizophrenia. World J. Biol. Psychiatry 12, 271–281 (2011). [DOI] [PubMed] [Google Scholar]
- 49.Kay K. N., Winawer J., Mezer A., Wandell B. A., Compressive spatial summation in human visual cortex. J. Neurophysiol. 110, 481–494 (2013). [DOI] [PMC free article] [PubMed] [Google Scholar]
- 50.Gorgolewski K. J., Durnez J., Poldrack R. A., Preprocessed consortium for neuropsychiatric phenomics dataset. F1000Res. 6, 1262 (2017). [DOI] [PMC free article] [PubMed] [Google Scholar]
- 51.Li A., Zalesky A., Yue W., Howes O., Yan H., Liu Y., Fan L., Whitaker K. J., Xu K., Rao G., Li J., Liu S., Wang M., Sun Y., Song M., Li P., Chen J., Chen Y., Wang H., Liu W., Li Z., Yang Y., Guo H., Wan P., Lv L., Lu L., Yan J., Song Y., Wang H., Zhang H., Wu H., Ning Y., Du Y., Cheng Y., Xu J., Xu X., Zhang D., Wang X., Jiang T., Liu B., A neuroimaging biomarker for striatal dysfunction in schizophrenia. Nat. Med. 26, 558–565 (2020). [DOI] [PubMed] [Google Scholar]
- 52.Zeng L.-L., Wang H., Hu P., Yang B., Pu W., Shen H., Chen X., Liu Z., Yin H., Tan Q., Wang K., Hu D., Multi-site diagnostic classification of schizophrenia using discriminant deep learning with functional connectivity MRI. EBioMedicine 30, 74–85 (2018). [DOI] [PMC free article] [PubMed] [Google Scholar]
- 53.Barron D. S., Gao S., Dadashkarimi J., Greene A. S., Spann M. N., Noble S., Lake E. M. R., Krystal J. H., Constable R. T., Scheinost D., Transdiagnostic, connectome-based prediction of memory constructs across psychiatric disorders. Cerebral Cortex 31, 2523–2533 (2021). [DOI] [PMC free article] [PubMed] [Google Scholar]
- 54.Kebets V., Holmes A. J., Orban C., Tang S., Li J., Sun N., Kong R., Poldrack R. A., Yeo B. T. T., Somatosensory-motor dysconnectivity spans multiple transdiagnostic dimensions of psychopathology. Biol. Psychiatry 86, 779–791 (2019). [DOI] [PubMed] [Google Scholar]
- 55.Esteban O., Markiewicz C. J., Blair R. W., Moodie C. A., Isik A. I., Erramuzpe A., Kent J. D., Goncalves M., DuPre E., Snyder M., Oya H., Ghosh S. S., Wright J., Durnez J., Poldrack R. A., Gorgolewski K. J., fMRIPrep: A robust preprocessing pipeline for functional MRI. Nat. Methods 16, 111–116 (2019). [DOI] [PMC free article] [PubMed] [Google Scholar]
- 56.Gorgolewski K., Burns C. D., Madison C., Clark D., Halchenko Y. O., Waskom M. L., Ghosh S. S., Nipype: A flexible, lightweight and extensible neuroimaging data processing framework in python. Front. Neuroinform. 5, 13 (2011). [DOI] [PMC free article] [PubMed] [Google Scholar]
- 57.Dickie E. W., Anticevic A., Smith D. E., Coalson T. S., Manogaran M., Calarco N., Viviano J. D., Glasser M. F., Van Essen D. C., Voineskos A. N., Ciftify: A framework for surface-based analysis of legacy MR acquisitions. Neuroimage 197, 818–826 (2019). [DOI] [PMC free article] [PubMed] [Google Scholar]
- 58.Van Essen D. C., Cortical cartography and Caret software. Neuroimage 62, 757–764 (2012). [DOI] [PMC free article] [PubMed] [Google Scholar]
- 59.Ciric R., Wolf D. H., Power J. D., Roalf D. R., Baum G. L., Ruparel K., Shinohara R. T., Elliott M. A., Eickhoff S. B., Davatzikos C., Gur R. C., Gur R. E., Bassett D. S., Satterthwaite T. D., Benchmarking of participant-level confound regression strategies for the control of motion artifact in studies of functional connectivity. Neuroimage 154, 174–187 (2017). [DOI] [PMC free article] [PubMed] [Google Scholar]
- 60.Behzadi Y., Restom K., Liau J., Liu T. T., A component based noise correction method (CompCor) for BOLD and perfusion based fMRI. Neuroimage 37, 90–101 (2007). [DOI] [PMC free article] [PubMed] [Google Scholar]
- 61.Cole M. W., Ito T., Schultz D., Mill R., Chen R., Cocuzza C., Task activations produce spurious but systematic inflation of task functional connectivity estimates. Neuroimage 189, 1–18 (2019). [DOI] [PMC free article] [PubMed] [Google Scholar]
- 62.A. Paszke, S. Gross, S. Chintala, G. Chanan, E. Yang, Z. DeVito, Z. Lin, A. Desmaison, L. Antiga, A. Lerer, Automatic Differentiation in Pytorch (NIPS 2017 Workshop Autodiff, 2017). [Google Scholar]
- 63.Pedregosa F., Varoquaux G., Gramfort A., Michel V., Thirion B., Grisel O., Blondel M., Prettenhofer P., Weiss R., Dubourg V., Scikit-learn: Machine learning in Python. J. Mach. Learn. Res. 12, 2825–2830 (2011). [Google Scholar]
- 64.K. J. Gorgolewski, O. Esteban, D. G. Ellis, M. P. Notter, E. Ziegler, H. Johnson, C. Hamalainen, B. Yvernault, C. Burns, A. Manhães-Savio, D. Jarecka, C. J. Markiewicz, T. Salo, D. Clark, M. Waskom, J. Wong, M. Modat, B. E. Dewey, M. G. Clark, M. Dayan, F. Loney, C. Madison, A. Gramfort, A. Keshavan, S. Berleant, B. Pinsard, M. Goncalves, D. Clark, B. Cipollini, G. Varoquaux, D. Wassermann, A. Rokem, Y. O. Halchenko, J. Forbes, B. Moloney, I. B. Malone, M. Hanke, D. Mordom, C. Buchanan, W. M. Pauli, J. M. Huntenburg, C. Horea, Y. Schwartz, R. Tungaraza, S. Iqbal, J. Kleesiek, S. Sikka, C. Frohlich, J. Kent, M. Perez-Guevara, A. Watanabe, D. Welch, C. Cumba, D. Ginsburg, A. Eshaghi, E. Kastman, S. Bougacha, R. Blair, B. Acland, A. Gillman, A. Schaefer, B. N. Nichols, S. Giavasis, D. Erickson, C. Correa, A. Ghayoor, R. Küttner, C. Haselgrove, D. Zhou, R. C. Craddock, D. Haehn, L. Lampe, J. Millman, J. Lai, M. Renfro, S. Liu, J. Stadler, T. Glatard, A. E. Kahn, X.-Z. Kong, W. Triplett, A. Park, C. McDermottroe, M. Hallquist, R. Poldrack, L. N. Perkins, M. Noel, S. Gerhard, J. Salvatore, F. Mertz, W. Broderick, S. Inati, O. Hinds, M. Brett, J. Durnez, A. Tambini, S. Rothmei, S. K. Andberg, G. Cooper, A. Marina, A. Mattfeld, S. Urchs, P. Sharp, K. Matsubara, D. Geisler, B. Cheung, A. Floren, T. Nickson, N. Pannetier, A. Weinstein, M. Dubois, J. Arias, C. Tarbert, K. Schlamp, K. Jordan, F. Liem, V. Saase, R. Harms, R. Khanuja, K. Podranski, G. Flandin, D. Papadopoulos Orfanos, I. Schwabacher, D. McNamee, M. Falkiewicz, J. Pellman, J. Linkersdörfer, J. Varada, F. Pérez-García, A. Davison, D. Shachnev, S. Ghosh, Nipype: A Flexible, Lightweight and Extensible Neuroimaging Data Processing Framework in Python. 0.13.1 (Zenodo, 2017); https://zenodo.org/record/581704.
- 65.Tustison N. J., Avants B. B., Cook P. A., Zheng Y., Egan A., Yushkevich P. A., Gee J. C., N4ITK: Improved N3 bias correction. IEEE Trans. Med. Imaging 29, 1310–1320 (2010). [DOI] [PMC free article] [PubMed] [Google Scholar]
- 66.Dale A. M., Fischl B., Sereno M. I., Cortical surface-based analysis. I. Segmentation and surface reconstruction. Neuroimage 9, 179–194 (1999). [DOI] [PubMed] [Google Scholar]
- 67.Klein A., Ghosh S. S., Bao F. S., Giard J., Häme Y., Stavsky E., Lee N., Rossa B., Reuter M., Chaibub Neto E., Keshavan A., Mindboggling morphometry of human brains. PLOS Comput. Biol. 13, e1005350 (2017). [DOI] [PMC free article] [PubMed] [Google Scholar]
- 68.Avants B. B., Epstein C. L., Grossman M., Gee J. C., Symmetric diffeomorphic image registration with cross-correlation: Evaluating automated labeling of elderly and neurodegenerative brain. Med. Image Anal. 12, 26–41 (2008). [DOI] [PMC free article] [PubMed] [Google Scholar]
- 69.Zhang Y., Brady M., Smith S., Segmentation of brain MR images through a hidden Markov random field model and the expectation-maximization algorithm. IEEE Trans. Med. Imaging 20, 45–57 (2001). [DOI] [PubMed] [Google Scholar]
- 70.Esteban O., Ciric R., Finc K., Blair R. W., Markiewicz C. J., Moodie C. A., Kent J. D., Goncalves M., DuPre E., Gomez D. E. P., Ye Z., Salo T., Valabregue R., Amlien I. K., Liem F., Jacoby N., Stojić H., Cieslak M., Urchs S., Halchenko Y. O., Ghosh S. S., De La Vega A., Yarkoni T., Wright J., Thompson W. H., Poldrack R. A., Gorgolewski K. J., Analysis of task-based functional MRI data preprocessed with fMRIPrep. Nat. Protoc. 15, 2186–2202 (2020). [DOI] [PMC free article] [PubMed] [Google Scholar]
- 71.J. M. Huntenburg, Evaluating nonlinear coregistration of BOLD EPI and T1w images, thesis (2014). [Google Scholar]
- 72.Wang S., Peterson D. J., Gatenby J. C., Li W., Grabowski T. J., Madhyastha T. M., Evaluation of field Map and nonlinear registration methods for correction of susceptibility artifacts in diffusion MRI. Front. Neuroinform. 11, 17 (2017). [DOI] [PMC free article] [PubMed] [Google Scholar]
- 73.Treiber J. M., White N. S., Steed T. C., Bartsch H., Holland D., Farid N., McDonald C. R., Carter B. S., Dale A. M., Chen C. C., Characterization and correction of geometric distortions in 814 diffusion weighted images. PLOS ONE 11, e0152472 (2016). [DOI] [PMC free article] [PubMed] [Google Scholar]
- 74.Thompson W. H., Nair R., Oya H., Esteban O., Shine J. M., Petkov C. I., Poldrack R. A., Howard M., Adolphs R., A data resource from concurrent intracranial stimulation and functional MRI of the human brain. Sci. Data 7, 258 (2020). [DOI] [PMC free article] [PubMed] [Google Scholar]
- 75.Greve D. N., Fischl B., Accurate and robust brain image alignment using boundary-based registration. Neuroimage 48, 63–72 (2009). [DOI] [PMC free article] [PubMed] [Google Scholar]
- 76.Jenkinson M., Bannister P., Brady M., Smith S., Improved optimization for the robust and accurate linear registration and motion correction of brain images. Neuroimage 17, 825–841 (2002). [DOI] [PubMed] [Google Scholar]
- 77.Cox R. W., AFNI: Software for analysis and visualization of functional magnetic resonance neuroimages. Comput. Biomed. Res. 29, 162–173 (1996). [DOI] [PubMed] [Google Scholar]
- 78.Botvinik-Nezer R., Iwanir R., Holzmeister F., Huber J., Johannesson M., Kirchler M., Dreber A., Camerer C. F., Poldrack R. A., Schonberg T., fMRI data of mixed gambles from the Neuroimaging Analysis Replication and Prediction Study. Sci. Data 6, 106 (2019). [DOI] [PMC free article] [PubMed] [Google Scholar]
- 79.Abraham A., Pedregosa F., Eickenberg M., Gervais P., Mueller A., Kossaifi J., Gramfort A., Thirion B., Varoquaux G., Machine learning for neuroimaging with scikit-learn. Front. Neuroinform. 8, 14 (2014). [DOI] [PMC free article] [PubMed] [Google Scholar]
Associated Data
This section collects any data citations, data availability statements, or supplementary materials included in this article.
Supplementary Materials
Supplementary material for this article is available at http://advances.sciencemag.org/cgi/content/full/7/29/eabf2513/DC1