Abstract
Two groups of amphetamine-like drugs with psychostimulant properties that were first developed during the course of scientific studies and later emerged as new psychoactive substances (NPS) are based on the (2-aminopropyl)indole (API) and (2-aminopropyl)benzofuran (APB) structural scaffolds. However, sulfur-based analogs with a benzo[b]thiophene structure (resulting in (2-aminopropyl)benzo[b]thiophene (APBT) derivatives) have received little attention. In the present investigation, all six racemic APBT positional isomers were synthesized in an effort to understand their structure-activity relationships relative to API- and APB-based drugs. One lesson learned from the NPS phenomenon is that one cannot exclude the appearance of such substances on the market. Therefore, an in-depth analytical characterization was performed, including various single- and tandem mass spectrometry (MS) and ionization platforms coupled to gas chromatography (GC) and liquid chromatography (LC), nuclear magnetic resonance spectroscopy (NMR), and solid phase and GC condensed phase infrared spectroscopy (GC-sIR). Various derivatizations have also been explored; it was found that all six APBT isomers could be differentiated during GC analysis after derivatization with heptfluorobutyric anhydride and ethyl chloroformate (or heptfluorobutyric anhydride and acetic anhydride) under non-routine conditions. Discriminating analytical features can also be derived from NMR, GC-EI/CI- single- and tandem mass spectrometry, LC (pentafluorophenyl stationary phase), and various infrared spectroscopy approaches (including GC-sIR). Availability of detailed analytical data obtained from these novel APBT-type stimulants may be useful to researchers and scientists in cases where forensic and clinical investigations are warranted.
Keywords: New psychoactive substances, psychostimulants, API, APB, forensic, isomers
1. Introduction
The search for new analogs of amphetamine and tryptamine has evolved over several decades. Recently, various amphetamine and tryptamine analogs have also been synthesized and sold online and became known as new psychoactive substances (NPS).1,2 Although many NPS are based on the classical amphetamine scaffold (AMPH, group I), derivatives of (2-aminopropyl)indole (API, IT, group II) and (2-aminopropyl)benzofuran (APB, group III) have also appeared (Figure 1A). 5-(2-Aminopropyl)indole (5-IT) and its positional isomer 6-IT (Figure 1A), which act as reversible inhibitors of monoamine oxidase A (MAO-A) and induce the transporter-mediated release of dopamine (DA), norepinephrine (NE), and serotonin (5-HT), are among the most prominent API-based NPS.3–7 The 3-position regioisomer α-methyltryptamine (AMT, 3-API, 3-IT, Figure 1A) has a similar pharmacological profile.8 AMT and 5-IT have been associated with intoxication cases and can produce severe adverse effects including death in some instances.9–16
Figure 1.
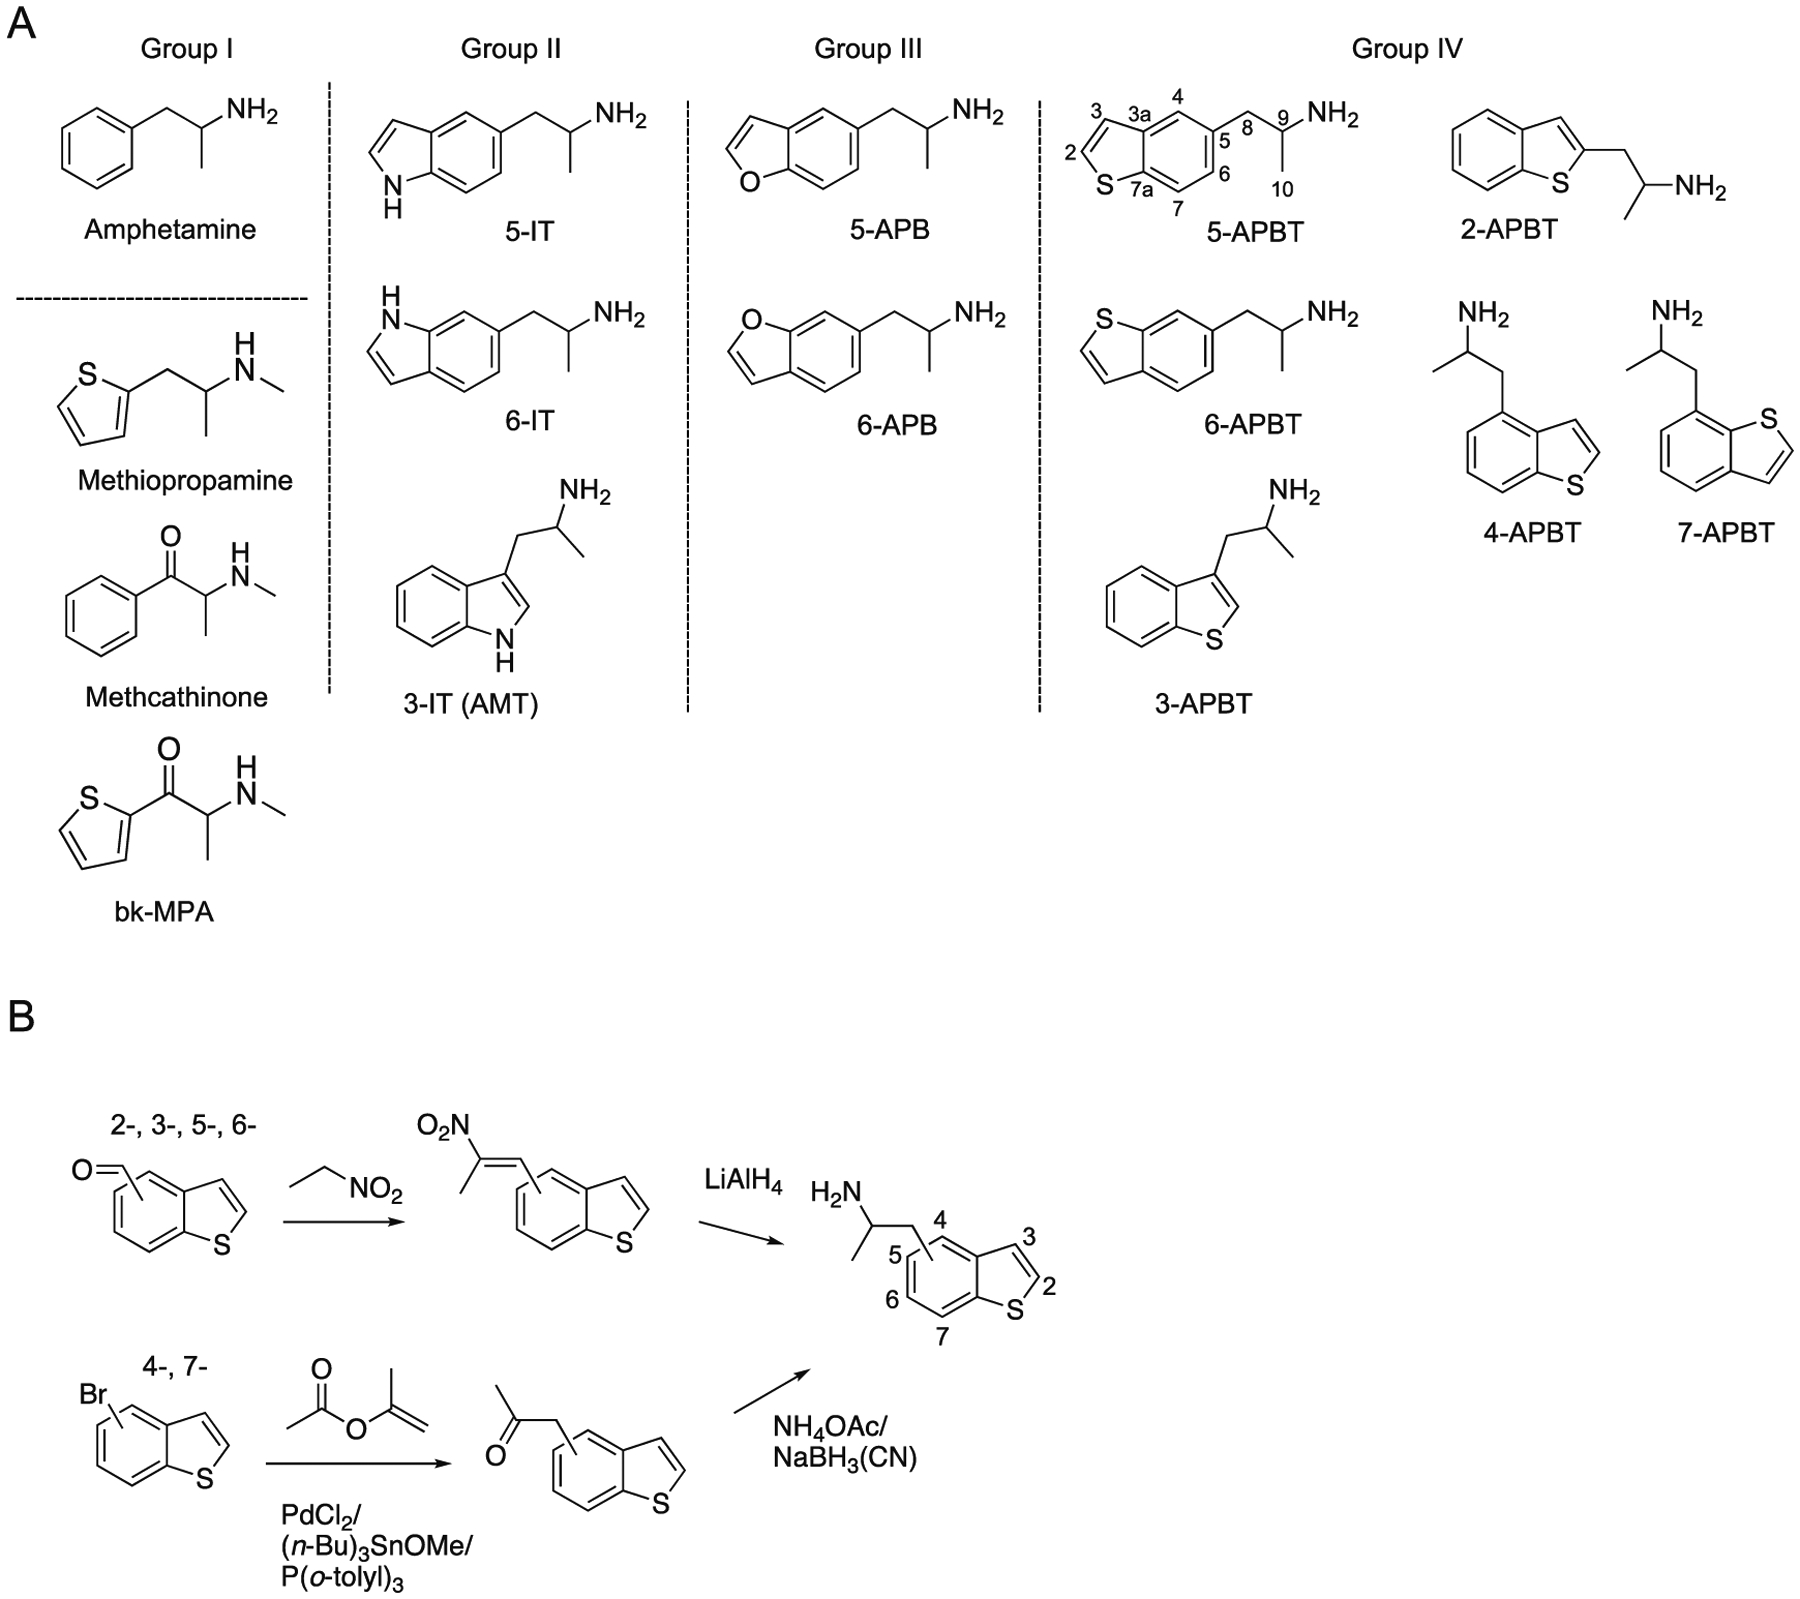
A. Chemical structures of the classic psychostimulant amphetamine with methiopropamine reflecting the bioisosteric counterpart of methamphetamine. The corresponding sulfur analog of methcathinone gives rise to bk-methiopropamine (group I). Examples of three 5-(2-aminopropyl)indoles (AMT, 5-IT and 6-IT, group II) and two (2-aminopropyl)benzofuran isomers 5-APB and 6-APB (group III) that also became prominent new psychoactive substances in recent years. Group IV. Six novel benzo[b]thiophene analogs being subject of the present investigation. B. Generalized synthesis scheme used for the preparation of all six APBT isomers.
Isosteric substitution of an oxygen atom for the NH in the API scaffold gives rise to compounds with a benzofuran backbone, which are commonly referred to as the APB series (Figure 1A). Although the 5- and 6-position regioisomers 5-APB and 6-APB (Figure 1A) were originally developed as selective 5-HT2C receptor agonists,17 they have attracted more attention due to their appearance as NPS. In Europe, the detection of 5-APB was first reported in 2010,18 followed by 6-APB in 2011.19 Since then, a number of pharmacological studies have shown that 5-APB and 5-APB act as nonselective monoamine releasers and activate 5-HT2 receptor subtypes.20–25 5-APB increases locomotor activity in mice and produces full substitution in rats trained to discriminate 3,4-methylenedioxymethamphetamine (MDMA) from vehicle.26 In addition, 5-APB produces partial substitution in rats trained to discriminate methamphetamine, cocaine, and the serotonergic hallucinogen 2,5-dimethoxy-4-methylamphetamine (DOM). According to various case reports, abuse of 5-APB or 6-APB, either alone or in combination with other drugs, can result in severe toxicity and fatalities.11,27–32
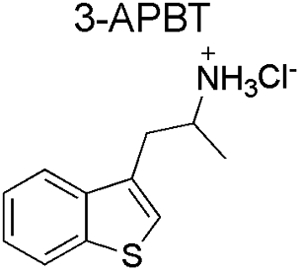
In contrast to the ABT series, sulfur-based (2-aminopropyl)benzo[b]thiophene (APBT) analogs containing a benzo[b]thiophene ring structure (group IV, Figure 1A) have received relatively little attention. According to a patent issued to Smith Kline & French Laboratories (SKF) in 1960, APBT isomers (including 2- and 3-APBT) produce various central nervous system effects and are useful as “ataractics, psychic energizers and analgetics”.33 3-APBT (SKF 6678, Figure 1A), the sulfur analog of AMT, reportedly exhibits some activity as an MAO-A inhibitor (IC50 = 16.2 μM) in rat brain mitochondrial preparations but has no effect on MAO-B.34 Studies in rats have shown that 3-APBT acts as an anorectic agent37 and has considerably lower analeptic potency than AMT (measured by reversal of phenobarbital sedation).35 The preparation of (S)-3-APBT was described in 2001.38 Examples also exist in the literature where 2-APBT and 3-APBT were prepared as intermediates for other investigations.39–42
Within the NPS context, bioisosteric replacements using sulfur have been encountered previously, with replacement of a phenyl ring with thiophene being a common approach that often leaves pharmacological activity unchanged.43 N-Methyl-1-(thiophen-2-yl)propan-2-amine (methiopropamine, 2-MPA, Figure 1A), an analog of methamphetamine, is an example of this type of replacement. In Europe, detection of 2-MPA was first reported to the European Monitoring Centre for Drugs and Drug Addiction (EMCDDA) in 2011,19 and analytical profiles were subsequently published.44–47 The amphetamine analog 1-(thiophen-2-yl)propan-2-amine (thiopropamine, 2-THAP) was subsequently detected in 2012;48 proton nuclear magnetic resonance spectroscopy data are available in the public domain.49 Similarly, 2-(methylamino)-1-(thiophen-2-yl)propan-1-one (thiothinone, bk-MPA, Figure 1A) is the bioisosteric counterpart of the psychostimulant methcathinone. Detection of bk-MPA in Europe was reported to the EMCDDA in 2013;50 analytical data from seized material have also been reported.51
Although information about the syntheses and characterization of API and APB regioisomers (including chromatographic separations) has been reported in the literature,52–54 the same information is not available for APBT isomers. Even though the APBT isomers presented in this investigation were prepared to close the information gap regarding their structure-activity relationships relative to API- and APB-based drugs, one lesson learned from the NPS phenomenon is that one cannot exclude the appearance of such substances on the market. For this reason, this investigation included in-depth analytical characterization of all six racemic APBT isomers (Figure 1A) using various EI/CI single- and tandem mass spectrometry (MS) platforms, gas- and liquid chromatography (GC and LC), nuclear magnetic resonance (NMR) spectroscopy, and GC condensed phase infrared (GC-sIR) analysis. A variety of derivatization methods used for chromatographic investigations have also been included. The results of pharmacological investigations conducted with these APBT isomers will be reported elsewhere.
2. Experimental
2.1. Materials
All chemicals used for analysis and derivatizations were obtained from Merck (Arklow, Ireland), Merck (Dorset, UK) or Fluorochem Ltd (Hadfield, UK). Benzo[b]thiophene-6-carboxaldehyde was from Cyclic Chemical Company (Ontario, Canada).
2.2. Instrumentation
2.2.1. Gas chromatography mass spectrometry
Gas chromatography method 1
For electron ionization mass spectrometry (EI-MS and EI-MS/MS), a Finnigan TSQ 8000 Evo triple stage quadrupole mass spectrometer coupled to a gas chromatograph (Trace GC 1310, Thermo Electron, Dreieich, Germany) and for chemical ionization MS (CI-MS, and CI-MS/MS) a Finnigan TSQ 7000 triple stage quadrupole mass spectrometer coupled to a gas chromatograph (Trace GC Ultra, Thermo Electron, Dreieich, Germany) was used. A Triplus RSH (Thermo Scientific for TSQ 8000 Evo) and a CTC CombiPAL (CTC Analytics, Zwingen, Switzerland for TSQ 7000) autosampler was employed for sample introduction. Mass spectra were recorded at 70 eV electron ionization energy. The ion source temperature was set at 175°C and the emission current was 50 μA (TSQ 8000 Evo) and 400 μA (TSQ 7000). For recording of EI-MS the scan time was 1 s spanning a scan range between m/z 29–600 and samples were injected in splitless mode. For CI, the reagent gas was methane and the source pressure was 1.5 mTorr (0.2 Pa). The scan time was 0.5 s and the scan range was m/z 50–600 and samples were injected in splitless mode.
In the EI- and CI-MS/MS product ion mode, the scan range under all other identical conditions described above started at m/z 10 and ended about 10 mass units above the ion that was examined. The collision gas was argon. The collision energy was approximately 20 eV and the collision gas pressure was approximately 1.5 mTorr (0.2 Pa). The exact target-thickness was set using n-butylbenzene in EI-MS mode and adjusting intensity ratios m/z 92/91 to 0.2 and m/z 65/91 to 0.02 by variation of collision energy and collision gas pressure. This method ensured reproducibility of the product ion mass spectra and the use of a product ion mass spectra library for the identification of the structures of the product ions.55
Separation was achieved using a fused silica capillary DB-1 column (30 m × 0.25 mm, film thickness 0.25 μm). The temperature program consisted of an initial temperature of 80°C, held for 2 min, followed by a ramp to 280°C at 15°C/min. The final temperature was held for 20 min. The injector temperature was 280°C (TSQ 8000) and 220°C (TSQ 7000), respectively. The transfer line temperature was set at 280°C and the carrier gas was helium in constant flow mode at a flow rate of 1.2 mL/min. Approximately 2 mg oft he hydrochlorides were dissolved in 2 mL of deionized water, alkalized with a few drops of 5% (w/v) NaOH solution and extracted with 2 mL diethyl ether. For analysis, 1 μL of the extract was injected into the GC-MS system. Retention indices are given as Kovats indices calculated from measurement of an n-alkane mixture analyzed with the above mentioned temperature program.
Gas chromatography method 2
Samples were analyzed on an Agilent 6890N gas chromatograph coupled to a 5975 inert MSD. A Restek Rxi®−5Sil MS column (30 m × 0.25 mm × 0.25 μm; Thames Restek, High Wycombe, UK) was used in split mode (1:1) with helium carrier gas at a constant flow of 0.8 mL/min. The injection port and transfer line temperatures were set at 250°C and 280°C respectively. The initial oven temperature was 50°C, held for 1 min, ramped at 4°C/min to 250°C, held at 250°C for 1 min, ramped at 20°C/min to 280°C and finally held at 280°C for 1.5 min (runtime 55 min). The ionization energy was set at 70 eV, the quadrupole at 150°C, the ion source at 230°C and the mass range was set at m/z 40–500.
2.2.2. Gas chromatography condensed phase infrared analysis
Samples were also analyzed using a GC condensed phase IR system (GC-sIR) that consisted of an Agilent GC 7890B (Waldbronn, Germany) with probe sampler Agilent G4567A and a DiscovIR-GC™ (Spectra Analysis, Marlborough, MA, USA). The column eluent was cryogenically accumulated on a spirally rotating ZnSe disk cooled by liquid nitrogen. IR spectra were recorded through the IR-transparent ZnSe disk using a nitrogen-cooled MCT detector. GC parameters: injection in splitless mode with the injection port temperature set at 240°C and a DB-1 fused silica capillary column (30 m × 0.32 mm i.d., 0.25 μm film thickness). The carrier gas was helium with a flow rate of 2.5 mL/min and the oven temperature program was as follows: 80°C for 2 min, ramped to 300°C at 20°C/min, and held at for 22 min. The transfer line was heated at 280°C. Infrared conditions: oven temperature, restrictor temperature, disc temperature, and Dewar cap temperatures were 280°C, 280°C, −40°C, and 35°C, respectively. The vacuum was 0.2 mTorr, disc speed 3 mm/s, spiral separation was 1 mm, wavelength resolution 4 cm−1 and IR range 650–4000 cm−1. Acquisition time was 0.6 s/file with 64 scans/spectrum. Same samples as for mass spectrometric measurements were used. Data were processed using GRAMS/AI Ver. 9.1 (Grams Spectroscopy Software Suite, Thermo Fisher Scientific, Dreieich, Germany) followed by implementation of the OMNIC Software, Ver. 7.4.127 (Thermo Electron Corporation, Dreieich, Germany).
2.2.3. High mass accuracy electrospray ionization mass spectrometry
Quadrupole time-of-flight mass spectra were recorded using an Agilent 6530 QTOF equipped with an Agilent Jet Stream electrospray ionization source and controlled by Agilent MassHunter Acquisition software. The following conditions were used: positive ionization mode, mass range m/z 100–1100, collision gas (CID) nitrogen, drying gas (N2) 320°C at 8 L/min, sheat gas 350°C at 11 L/min, nebulizer 35 psi, capillary 3000 V, fragmentor 150 V, nozzle 500 V, skimmer 65 V, collision energy levels between 5.0 and 10.0 V. Accurate mass measurements were obtained through reference correction using protonated purine (m/z 121.0509) and protonated HP-921 (m/z 922.0098). Data processing was performed using Agilent Masshunter Qualitative software.
Separations were performed using a Kinetex C8 column (2.1 × 100 mm, 1.7 μm (Phenomenex, Aschaffenburg, Germany). Aqueous mobile phase A was water (10 mM ammonium formate, 0.1% formic acid) and mobile phase B consisted of methanol. A gradient elution profile was chosen: 10% B held for 1.5 min, then to 50% B in 7.0 min, followed by an increase to 95% B within 9 min. Flushing and reconditioning was completed by the 11 min mark. The flow rate was 0.275 mL/min, column temperature was 45°C, and injection volume was 1 μL.
2.2.4. Liquid chromatography electrospray ionization single quadrupole mass spectrometry
LC-MS was performed on an Agilent 1100 LC system coupled to a Hewlett Packard/Agilent 1100 MSD (Santa Clara, CA, USA). The following conditions were used: capillary voltage 3500 V, drying gas (N2) 12 L/min at 350°C and nebulizer (N2) pressure 50 psig. The mass spectrometer was tuned according to the manufacturer’s instructions using ESI Tuning Mix G2421A (Agilent Technologies). Separations were performed using a Kinetex F5 column (2.6 μm, 100 Å; 100 × 2.1 mm) (Phenomenex, Macclesfield, Cheshire SK10 2BN, UK).
Conditions for separation of underivatized APBT isomers
Mobile phase A consisted of acetonitrile (containing 0.1% formic acid) and mobile phase B consisted of water (containing 0.1% formic acid). Elution commenced at 6% A (0–2 min) followed by a linear gradient up to 30% A at 30 min followed by a linear gradient down to 6% A at 31 min which was held at 6% A for 9 min (run-time 40 min). The flow rate was 300 μL/min and 1 μL was injected at a concentration of 0.20 μg/mL. The mass spectrometer was run in ESI mode (positive; SIM, m/z 192, [M+H]+, with a fragmentor voltage of 50 V for in-source CID).
Conditions for separation of methanesulfonamide derivatives of APBT isomers
The mobile phase composition was identical to the one described above. Elution commenced at 5% A (0–1 min) followed by a linear gradient up to 60% A at 25 min. This was kept at 60% A for 3 min followed by a linear gradient down to 5% A at 30 min and held at 5% A for 5 min (run-time 35 min). The flow rate was 300 μL/min and 1 μL was injected. The mass spectrometer was run in ESI mode (positive; SIM, m/z 292, [M+Na]+ with a fragmentor voltage of 50 V for in-source CID).
2.2.5. Nuclear magnetic resonance (NMR) spectroscopy
Samples were prepared in deuterated dimethyl sulfoxide (DMSO-d6) and 1H (600 MHz) and 13C DEPTQ (150 MHz) spectra were recorded on a Bruker AVANCE III 600 MHz NMR spectrometer. Spectra were referenced to residual solvent and assignments were supported by 1D and 2D experiments.
2.2.6. Infrared spectroscopy
The spectrometer used was a Nicolet 380 FT-IR with Smart Golden Gate Diamond ATR. The wavelength resolution was set to 4 cm−1. The IR spectra were collected in a range of 650–4000 cm−1 with 32 scans per spectrum. Solid phase IR spectra were recorded from the salts directly (hydrochlorides). The IR data were processed using OMNIC Software, Ver. 7.4.127 (Thermo Electron Corporation). IR spectra of the free bases were recorded as neat film after the following sample preparation procedure: For generation of the free bases, a few milligram of the hydrochloride salts were dissolved in deionized water, alkalized with a few drops of aqueous NaOH solution (5% w/w) and extracted with diethyl ether. The organic phase was concentrated to approximately 100 μL by a gentle airflow, aspired with a glass pipette and transferred directly to the ATR crystal yielding a film of the free base after final evaporation of diethyl ether.
2.3. Derivatizations for analysis by gas chromatography method 2
2.3.1. Acetamido (AC) derivatives
Acetonitrile (200 μL), acetic anhydride (50 μL) and triethylamine (50 μL) were added to the sample (20 μg of isomer as HCl salt, obtained by evaporating 20 μL of a 1 mg/mL solution in MeOH to dryness). The mixture was heated at 90°C for 15 min, allowed to cool to room temperature and then blown to dryness with nitrogen at 30°C. The residue was dissolved in dichloromethane (500 μL) and washed with saturated sodium hydrogen carbonate solution (500 μL). A portion of the lower layer (200 μL) was transferred to a clean tube and blown to dryness with nitrogen at 30°C. The residue was dissolved in acetonitrile (500 μL) and centrifuged at 5,000 rpm for 3 min. The supernatant was used for GC-EI-MS analysis.
2.3.2. Heptfluorobutyryl (HFB) derivatives
Sample solutions (10 μL of each isomer, separately and combined; 1 mg HCl salt/mL MeOH) were blown to dryness at 30°C with nitrogen. Acetonitrile (50 μL) and heptfluorobutyric anhydride (50 μL) were added and the capped bottles were heated at 90°C for 20 min. The samples were allowed to cool to room temperature and then blown to dryness at 30°C with nitrogen. The residues were reconstituted in acetonitrile (150 μL) for analysis by GC-MS.
2.3.3. Ethoxycarbonyl (EC) derivatives
Saturated aqueous sodium carbonate (500 μL), followed by ethyl chloroformate (50 μL), was added to sample solutions (20 μL of each isomer, separately and combined; 1 mg HCl salt/mL MeOH). The tubes were capped and rolled for 10 min at room temperature. The samples were extracted with ethyl acetate (500 μL) and the extract was analyzed by GC-MS.
2.3.4. Methanesulfonamide (MSA) derivatives
Dichloromethane (500 μL), methanesulfonyl chloride (20 μL) and triethylamine (40 μL) were added to the sample (20 μg of isomer as HCl salt, obtained by evaporating 20 μL of a 1 mg/mL solution in MeOH to dryness). The mixture was allowed to stand at room temperature for 30 min, washed with water (500 μL) followed by saturated sodium hydrogen carbonate solution (500 μL) and a portion of the lower layer (200 μL) was transferred to a clean tube. This was evaporated to dryness with nitrogen at 30°C, and the residue was dissolved in acetonitrile (200 μL) and centrifuged at 5,000 rpm for 3 min. The supernatant was used for GC-MS analysis. An aliquot (10 μL) of the supernatant was diluted with acetonitrile/water (1/1, containing 0.1% formic acid; 990 μL) for LC-ESI-MS analysis.
3. Results and discussion
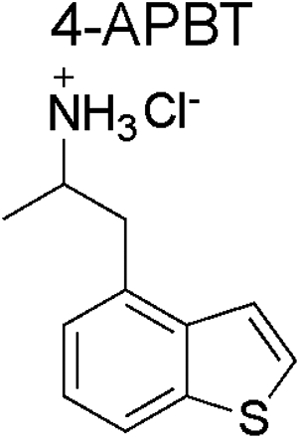
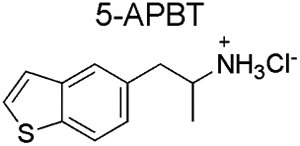
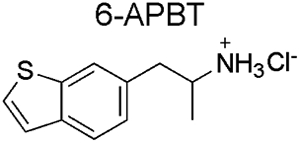
All six racemic APBT isomers (2-, 3-, 5-, and 6-APBT56; 4- and 7-APBT17,57) were prepared according to established procedures (specific details are being withheld in accordance with the policies of the law enforcement institutions that employ some of the authors) (Figure 1B). The 2-, 3-, 5- and 6- isomers were synthesized by the reaction of the corresponding positional aldehyde with nitroethane (Henry reaction/dehydration) to afford nitrostyrene intermediates (Figure 1B). These were then reduced with lithium aluminium hydride to give the required primary amines. Due to the availability of starting materials, the 4- and 7-APBT isomers were prepared by reaction of the corresponding bromobenzo[b]thiophene (palladium catalyzed aromatic acetonylation) with isopropenyl acetate in the presence of tributyltin methoxide, which forms acetonyltributyltin in situ, to afford ketone intermediates (Figure 1B).57 The ketones were converted to the desired 4- and 7-APBT by established methods using ammonium acetate and sodium cyanoborohydride (Figure 1B). The melting points recorded from the HCl salts were as follows: 2-APBT (215–217°C), 3-APBT (209–211°C, lit. 212–214°C58; 207–208°C35; 189–191°C34), 5-APBT (202–204°C), 6-APBT (188–190°C), and 7-APBT (206–208°C). Whether some of the discrepancies in melting points suggested the potential involvement of polymorphism could not be determined.
The Henry reaction and/or implementation of reductive amination procedures involving ketone precursors have been described for some of the APBT isomers40–42 though other approaches have also been employed.39,58 The Henry reaction involving the use of ring-substituted benzaldehyde precursors is a standard method that gives access to many phenethylamine and amphetamine-based substances56 including API isomers.52 On the other hand, the procedure employed in this investigation for the preparation of 4- and 7-APBT involving brominated benzo[b]thiophenes was also shown to provide a convenient method for the preparation of APB-based NPS53 which should therefore be applicable to other amphetamine-type substances as well.
3.1. Mass spectral features
3.1.1. Electron ionization single stage mass spectrometry
The electron ionization (EI) mass spectra for the underivatized isomers displayed weak molecular ions and the iminium ion (m/z 44) as the base peak typically observed for propan-2-amine-type side chains. All mass spectra were too similar to reflect differentiating fragments. Two examples are shown in Figure 2A that represent isomers with side chain substituents located on the thiophene (2-APBT) and benzene (4-APBT) portion of the molecule. Ions reflecting the benzo[b]thiophene nucleus included m/z 147 and m/z 148. In the oxygen-containing benzofuran (APB) series, the corresponding benzofuran-derived fragments were detected at m/z 131 and m/z 13253,54 whereas indole-based API drugs showed the equivalent ions at m/z 130 and m/z 131 fragments, respectively.8,52
Figure 2.
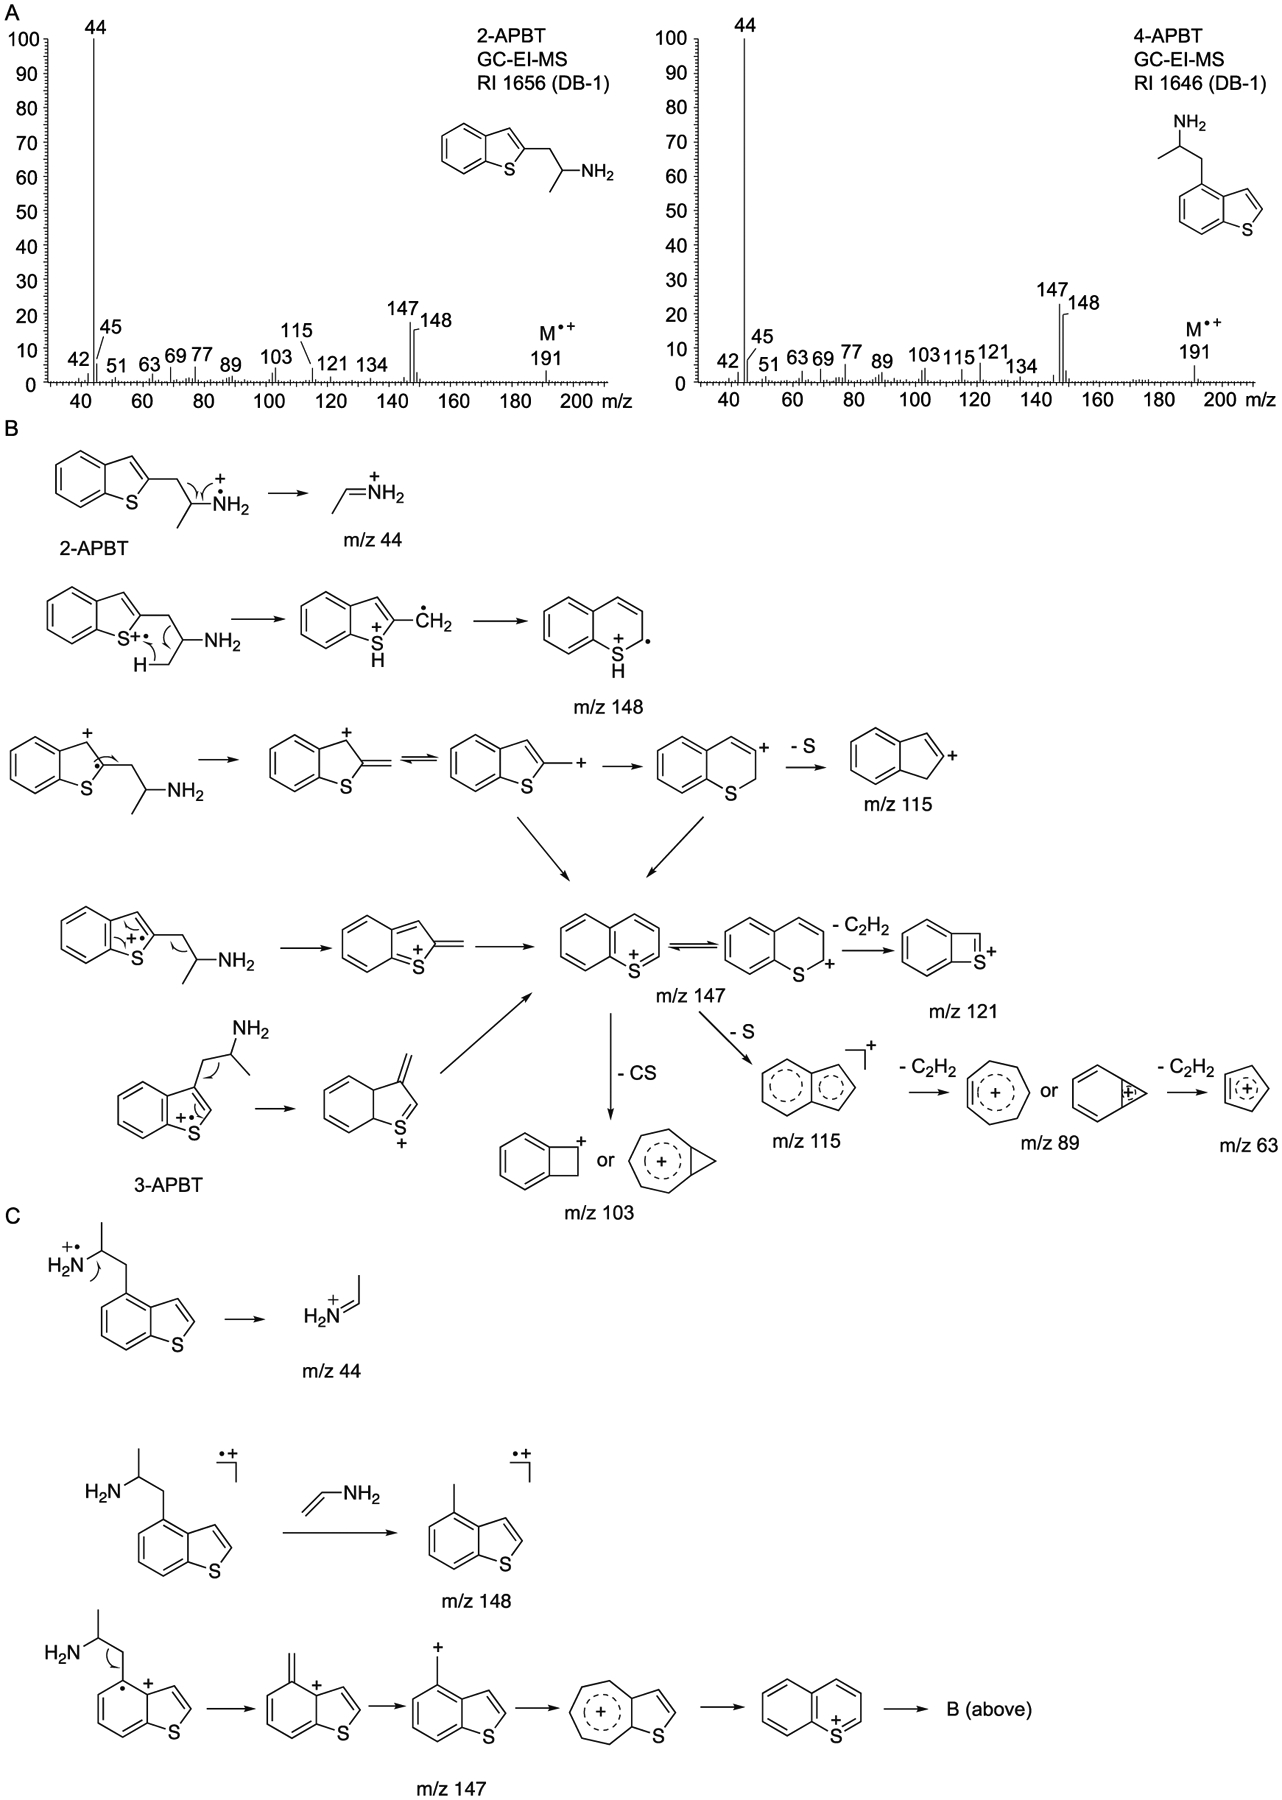
A. Representative electron ionization (EI) mass spectra of two APBT isomers (2-APBT and 4-APBT). B and C. Proposed fragmentation pathways. Mass spectra of all APBT isomers are shown as Supporting Information.
As suggested in Figure 2B, m/z 148 might have originated from the molecular ion with the sulfur atom representing the loss of an electron during ionization followed by ring expansion similar to what has been suggested to occur with 2-ethylbenzo[b]thiophene.59 Fragment ion m/z 148 might have also resulted from a loss of vinylamine (Figure 2C). The m/z 147 ion might have reflected the benzothiopyrilium species consistent with 2- and 3-methylbenzo[b]thiophene followed by formations of ions at m/z 121 (loss of C2H2), m/z 115 and m/z 103.60 In the EI mass spectra of the NPS N-methyl-1-(thiophen-2-yl)propan-2-amine (methiopropamine, MPA) and its 3-thienyl isomer, the equivalent ion was detected at m/z 97, possibly reflecting the presence of the thiopyrilium ion.45 An ion at m/z 45 (possibly representing HC≡S+) was also detected in the APBT-series reported here but also in the EI mass spectra of 2- and 3-MPA45 and other benzo[b]thiophenes.60 The individual EI mass spectra recorded for all APBT isomers have been supplied as Supporting Information. Alternative proposals for the formations of m/z 147 and m/z 97 have also been included in the Supporting Information section.
When investigating the mass spectral features of the positional isomers 4-APB, 5-APB, 6-APB, and 7-APB under EI conditions, it was reported that the m/z 131/132 ratio might be useful for differentiating purposes where 6-APB showed the most intense m/z fragment relative to m/z 131 compared to the remaining isomers.54 When inspecting the EI mass spectra of all APBT isomers (Supporting Information), it was noticed that 3-APBT seemed to be the only isomer that showed the m/z 148 ion with higher abundance than the m/z 147 fragment. In that respect, 2-, 4-, and 5-APBT showed comparable ratios whereas analysis of 6- and 7-APBT resulted in almost identical fragment ratios even though they could be differentiated (m/z 148 > m/z 147: 6-APBT; m/z 147 > m/z 148: 7-APBT).
3.1.2. Electron ionization tandem mass spectrometry
In order to explore spectral features potentially useful for differentiation within EI-based analysis, various tandem mass spectrometry experiments have been conducted. GC-EI-triple quadrupole (QqQ)-MS/MS experiments using the m/z 121 and m/z 148 species as precursor ions resulted in identical mass spectra (not shown) but collision-induced dissociation (CID) experiments using the m/z 147 ion indicated that the 2- and 3-APBT isomers could be differentiated from the 4-, 5-, 6- and 7-APBT isomers in terms of the differences in the m/z 115 to m/z 121 ratios. In the former cases, the m/z 115 abundance was lower than m/z 121 whereas the m/z 121 ion was significantly larger than the m/z 115 species in the latter. In addition, 4-, 5-, 6- and 7-APBT also revealed the presence of the m/z 97 ion that was not detected in the EI tandem mass spectra of 2- and 3-APBT. Representative mass spectra comparing 3- and 6-APBT are shown in Figure 3 and all EI-MS/MS data have been added as Supporting Information together with suggested fragmentation pathways.
Figure 3.

Representative electron ionization tandem mass spectra of two APBT isomers (3-APBT and 6-APBT) using m/z 147 as the precursor ion. Mass spectra of all APBT isomers are shown as Supporting Information.
3.1.3. Chemical ionization single stage mass spectrometry
Analysis of all six APBT isomers by chemical ionization (CI) mass spectrometry confirmed the protonated molecule at m/z 192 and adducts associated with methane being used as the CI reagent gas ([M+29]+ (m/z 220) and [M+41]+ (m/z 232)). The loss of ammonia that led to detection of m/z 175 was the base peak in almost all mass spectra with the only exception being 2-APBT where the relative abundance was in the 60% region (Figure 4). Even though the use of QqQ instrumentation was restricted to single stage mass analysis in the first instance, some mass spectral differences could be observed due to variations in product ion formations under CI conditions. For example, 2-APBT was the only isomer that produced a base peak at m/z 149 (loss of 43 u from [M+H]+) and 6-APBT appeared to be the only other compound that yielded the m/z 149 of moderate abundance around the 25% level (Figure 4). The loss of 43 u from the protonated molecule might have reflected a loss of etheneamine (vinylamine). Both 2-APBT and 3-APBT were the only analytes that showed a detection of an ion at m/z 72 in any meaningful abundance although a very low intensity signal for this was also noted in the spectrum of 7-APBT. The CI mass spectrum of 3-APBT appeared to be the only representative displaying the m/z 148 ion with a relative abundance higher than those detected at m/z 147 and m/z 149, thus, potentially being useful as a differentiating marker. Though 2-, 3-, and 6-APBT displayed distinct ion formations that facilitated their distinct identification based on CI-MS alone, 4-, 5-, and 7-APBT on the other hand seemed comparable without significant differentiating features (Figure 4). However, gas chromatography (GC) analysis of underivatized analytes under the same conditions (GC method 1, see below) showed that 4-, 5-, and 7-APBT could be separated chromatographically. Proposed fragmentation pathways related to CI-MS analysis have been added as Supporting Information.
Figure 4.
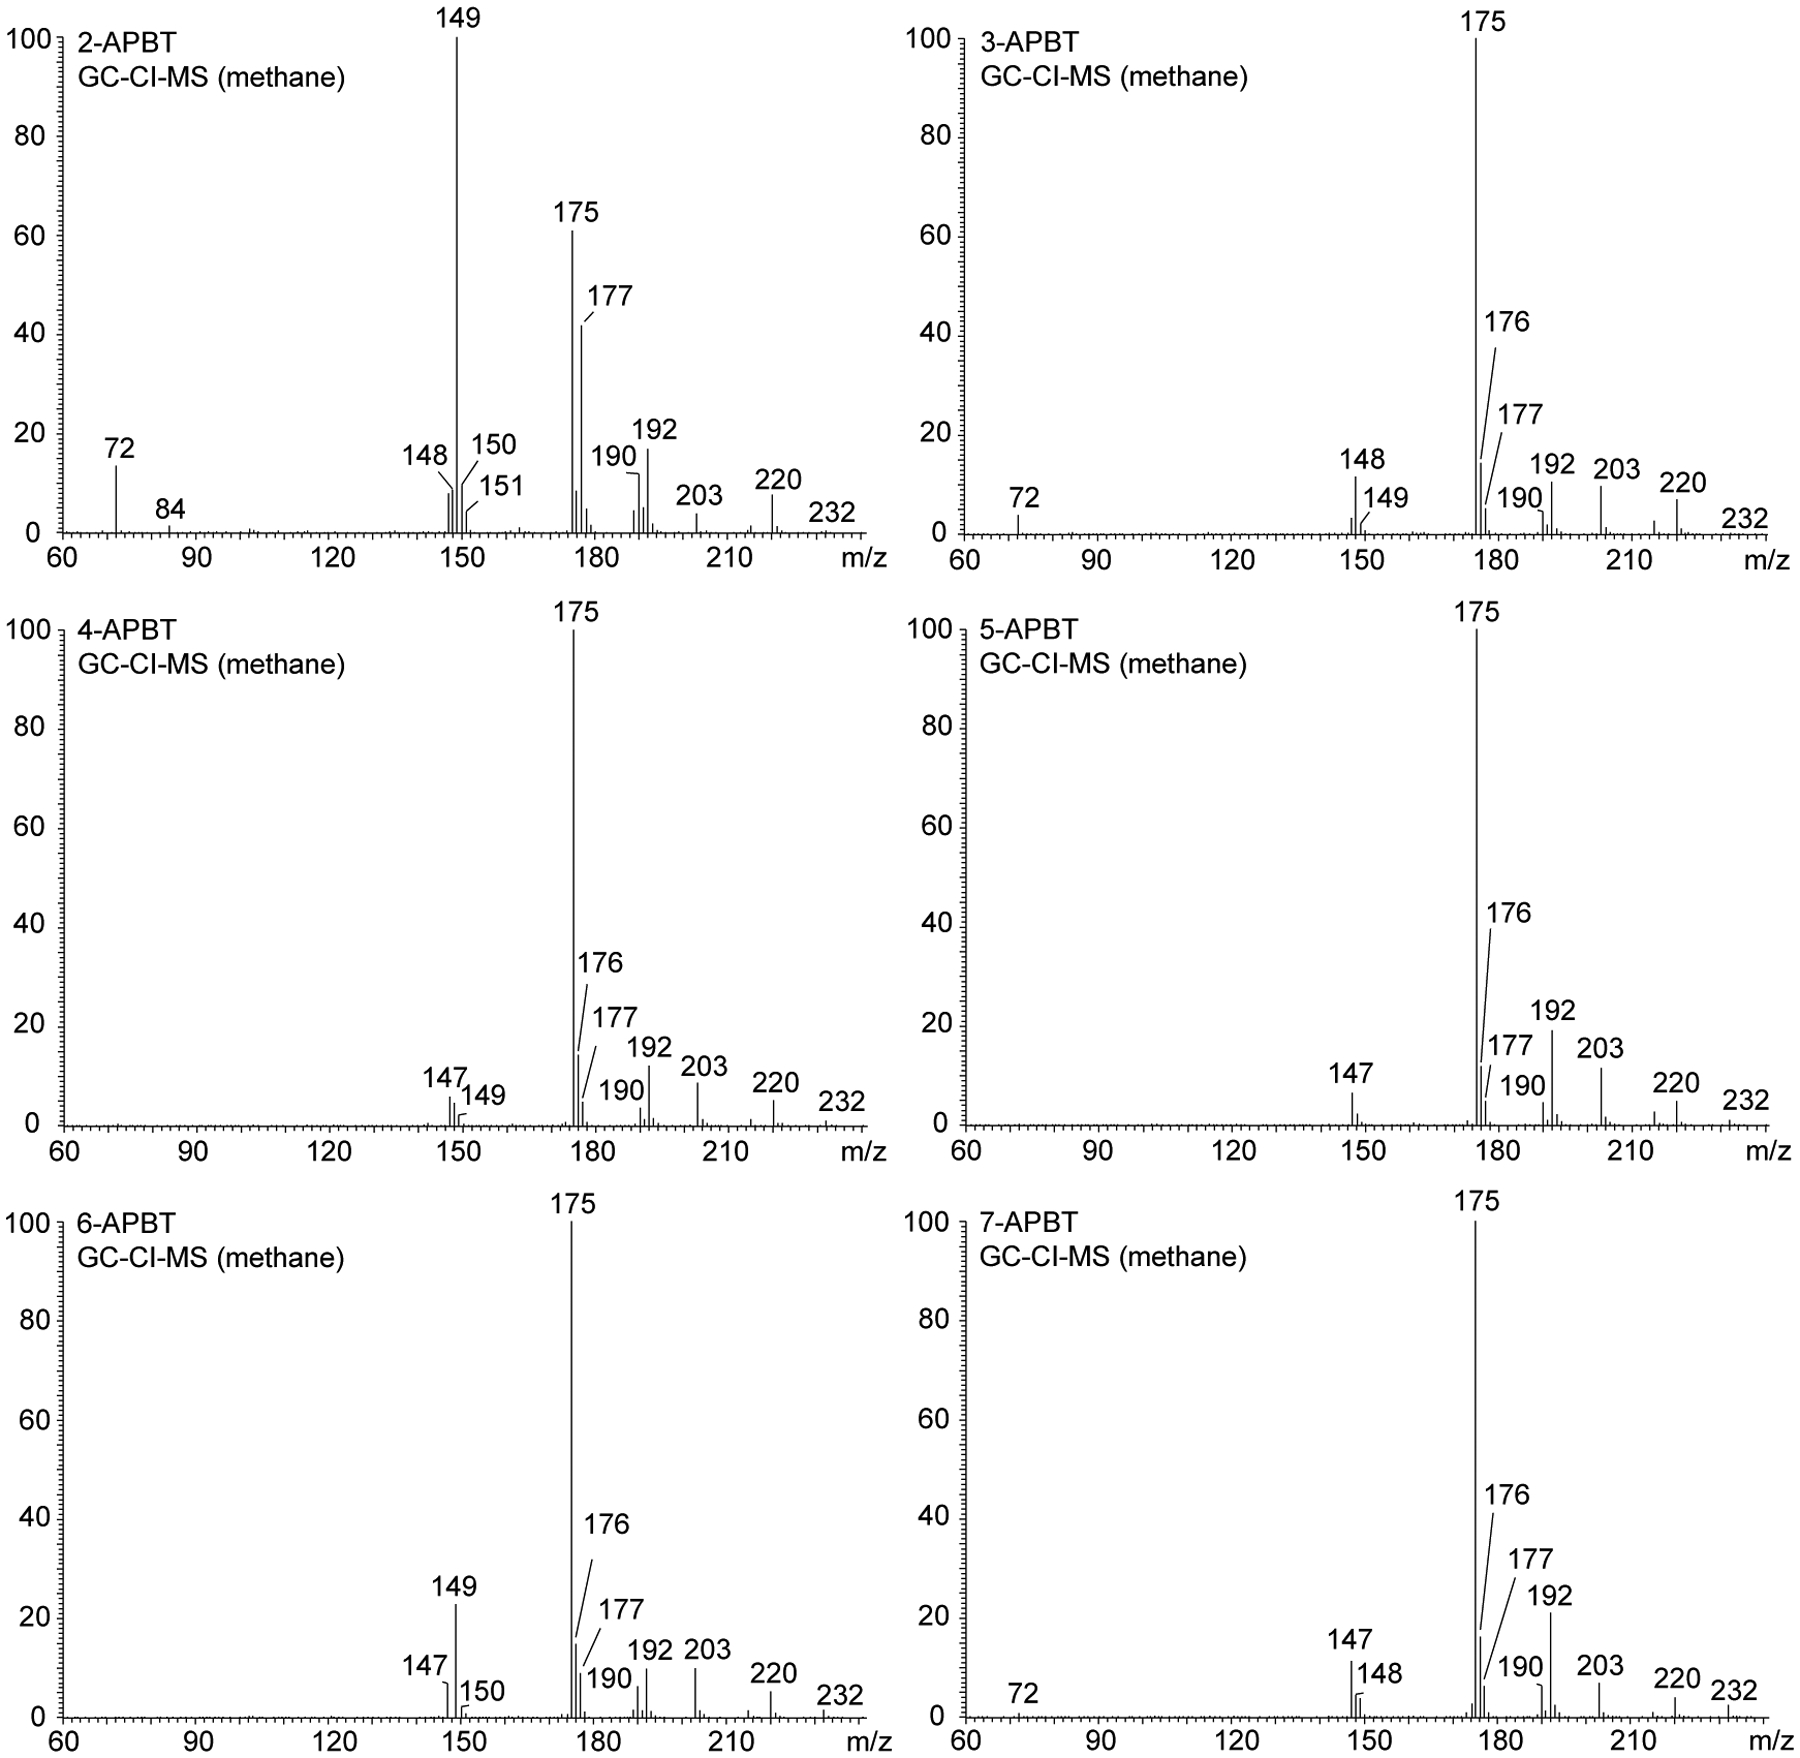
Chemical ionization mass spectra of all APBT isomers using methane as the reagent gas: [M+H]+ m/z 192, [M+29]+ m/z 220, [M+41]+ m/z 232.
3.1.4. Chemical ionization tandem mass spectrometry
Implementation of GC-CI-QqQ-MS/MS experiments were employed to explore whether there was further potential for identifying distinct differences, as this was based on previous experiences where implementation of GC-CI-MS and CI-MS/MS analysis proved helpful for such purposes.61–63 Tandem mass spectrometry experiments using the m/z 148 ion did not reveal any differentiating spectra (not shown) but several other tandem experiments provided some more information even though a complete differentiation between all isomers on tandem mass spectral grounds alone was not always feasible.
For example, when the m/z 149 ion was subjected to CI-MS/MS, the spectrum of 3-APBT was the only example that showed a base peak at m/z 148 compared to m/z 105 that was the most abundant ion in most of the other cases (Figure 5A with two illustrative spectra). All tandem mass spectra are shown as Supporting Information where it can also be seen that 5-APBT appeared to be the only representative showing a fragment at m/z 123 with significant abundance (proposed fragmentation pathways included). When subjecting the m/z 175 ion to CI-MS/MS experiments both 2- and 3-APBT could be differentiated from 4-, 5-, 6, and 7-APBT based on higher abundance values for m/z 134, 142 and 160 relative to the base peak at m/z 147 (Supporting Information). In the latter cases, these particular three ions showed significantly lower abundance. A representative comparison between 3-APBT and 4-APBT is shown in Figure 5B. Proposed fragmentation pathways have been included as Supporting Information. Finally, tandem mass spectral recordings using the 177 as the precursor ion revealed notable differences between the isomers. Even though m/z 149 was the base peak in five out of six cases (Supporting Information for all spectra), 2-APBT and 7-APBT were the only analytes that gave rise to predominant m/z 148/149 pairs with the latter showing m/z 148 to be the base peak. The former showed a prominent m/z 134 that was negligible in the mass spectrum of 7-APBT. 3-APBT showed prominent m/z 136 and m/z 162 (Figure 5C). 4-APBT and 5-APBT showed very similar spectra even though the m/z 148 ion showed larger abundance in case of 4-APBT. 6-APBT could be differentiated by the detection of prominent m/z 137 and m/z 160. Proposed fragmentation pathways have been included as Supporting Information.
Figure 5.
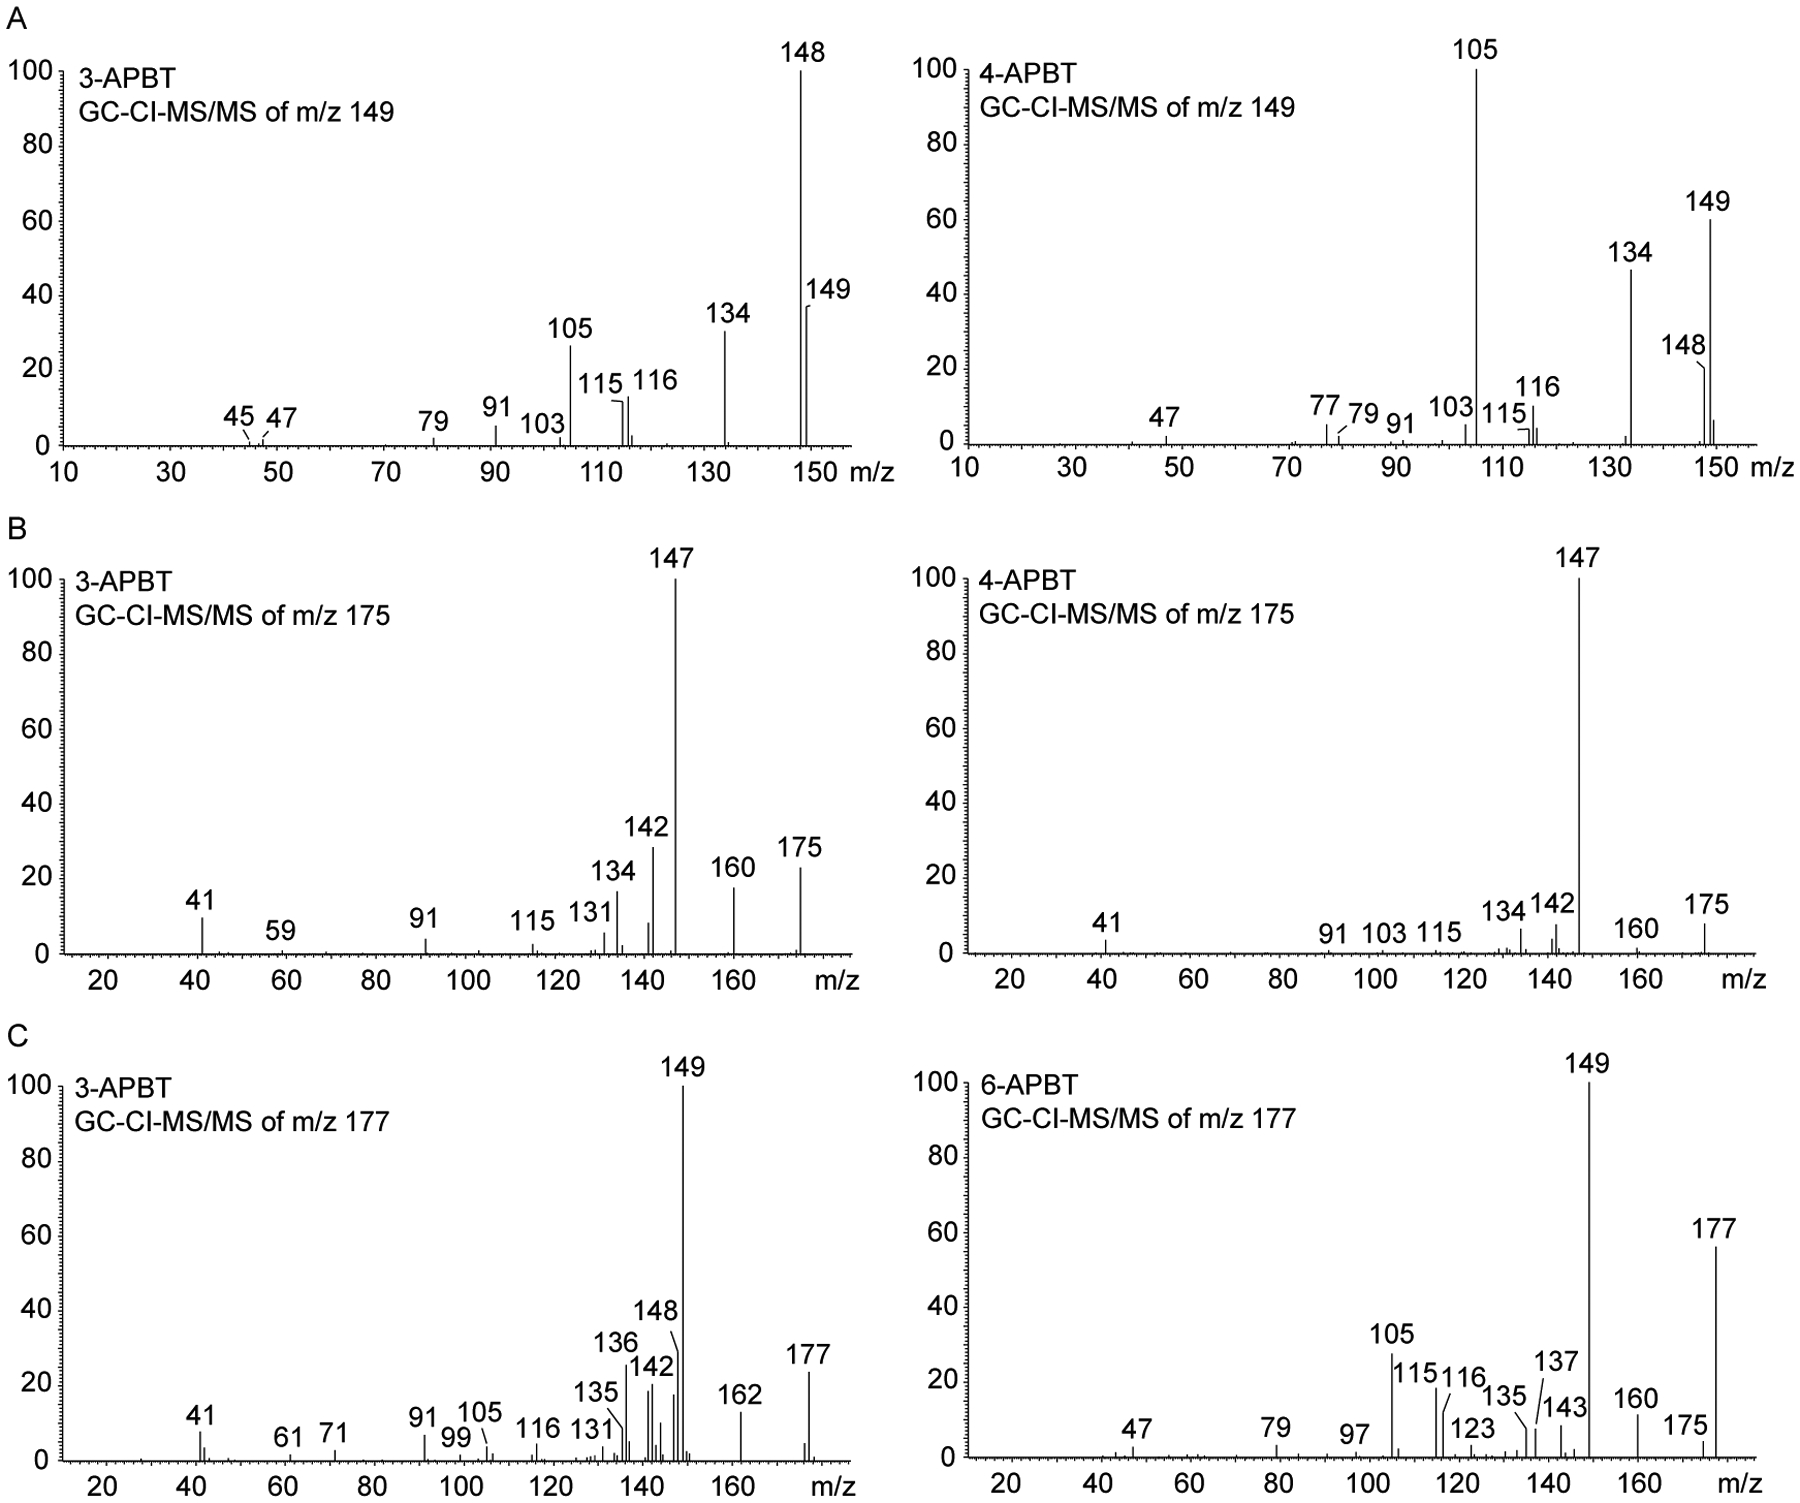
Representative chemical ionization tandem mass spectra of two APBT isomers. A. Use of m/z 149 as the precursor ion (3-APBT and 4-APBT). B. Use of m/z 175 as the precursor ion (3-APBT and 4-APBT). C. Use of m/z 177 as the precursor ion (3-APBT and 6-APBT). Mass spectra of all APBT isomers are shown as Supporting Information.
3.1.5. Electrospray ionization tandem mass spectrometry
Two representative electrospray ionization (ESI) QTOF tandem mass spectra (2-APBT and 3-APBT) are shown in Figure 6A (spectra of all six isomers supplied as Supporting Information). One of the ions present in all spectra included m/z 175 (loss of ammonia) and a second noticeable ion occurred at m/z 147 that might have been formed by various pathways (Figure 6B). A distinguishable and unambiguous feature was observed in the spectrum of 2-APBT that contained an ion at m/z 149 not detectable in the other spectra (Figure 6), possibly representing a loss of vinylamine which has also been reported to occur with the indole counterpart 2-API (2-IT).52 Interestingly, both 2-APBT and 3-APBT showed predominant iminium ions at m/z 44 which did not appear to have been formed to any significant extent in the mass spectra of the remaining isomers, thus, adding differentiating information. Single quadrupole ESI mass spectra formed by in-source CID have also been recorded and added as Supporting Information.
Figure 6.
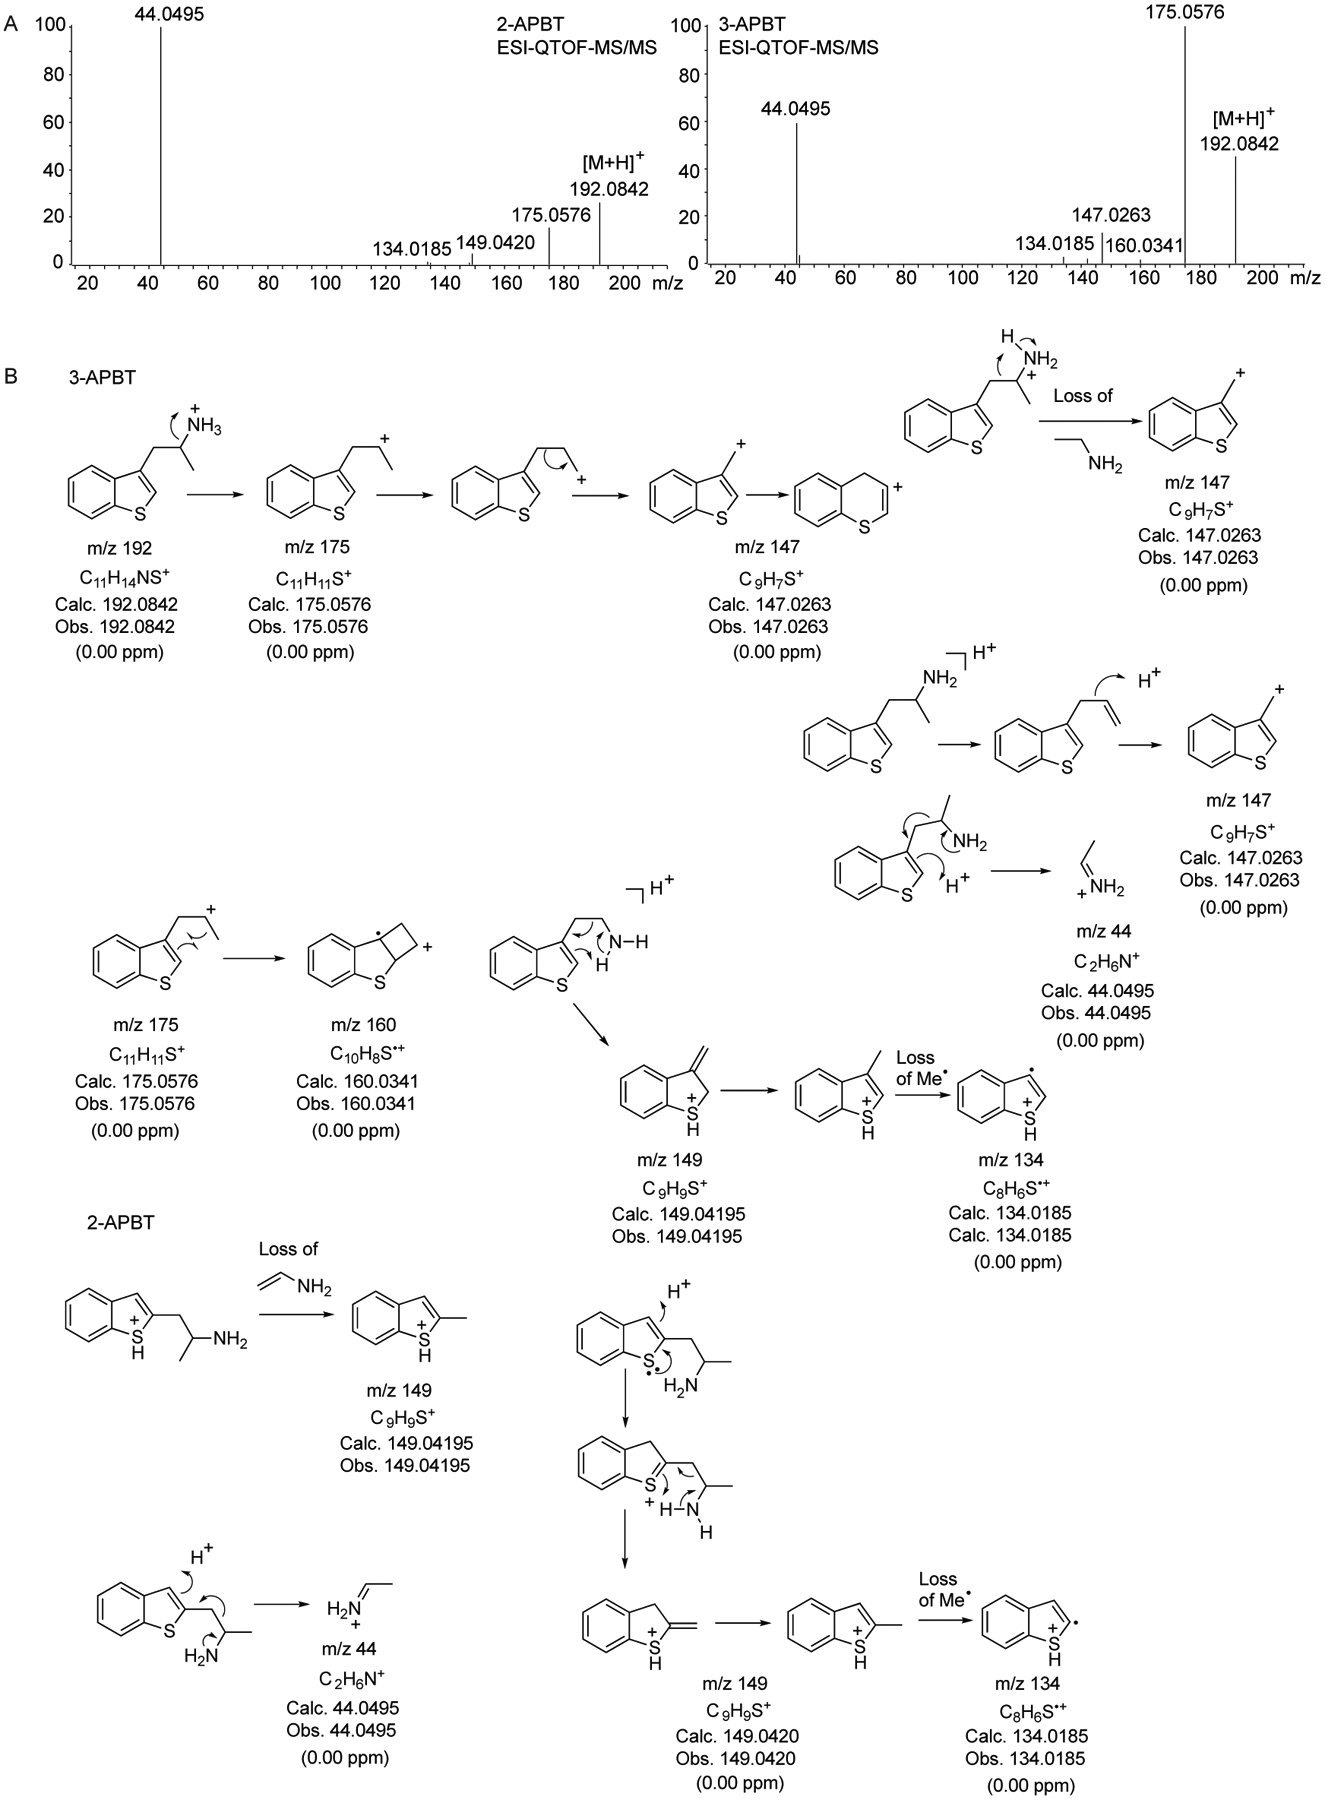
A. High-resolution QTOF-ESI tandem mass spectra of 2-APBT and 3-APBT. B. Proposed fragmentation pathways. Mass spectra of all APBT isomers and proposed fragmentation pathways are shown as Supporting Information.
3.2. Chromatographic features
A comparison of retention indices recorded from the implementation of GC (QqQ-MS(/MS)) method 1 under standard conditions revealed that all six positional APBT isomers could not be fully separated as observed with the following retention parameters: 2-APBT (RI = 1656; tR = 11.11 min), 3-APBT (RI = 1652; tR = 11.08 min), 4-APBT (RI = 1646; tR = 11.06 min), 5-APBT (RI = 1674; tR = 11.21 min), 6-APBT (RI = 1666; tR = 11.19 min). Under these conditions, 7-APBT (RI = 1626; tR = 10.89 min) could be distinguished more clearly.
The implementation of GC method 2 using a slower temperature ramp was explored to study the effect on separation of the underivatized isomers. As summarized in Figure 7, even though 2- and 7-APBT could be differentiated, 3-APBT/4-APBT and 5-APBT/6-APBT could not be sufficiently separated which was reminiscent of previous observations where underivatized 5-APB and 6-APB were observed to co-elute under GC-MS conditions.53,54 Further experiments involving derivatization reactions were carried out to produce acetamido (AC), heptafluorobutyryl (HFB), ethoxycarbonyl (EC), and methanesulfonamide (MSA) derivatives followed by analysis using GC-MS method 2. It was found that the HFB derivatization separated 2-, 3-, 4-, and 7-APBT but not 5- and 6-APBT. AC and EC derivatization separated 2-, 5-, 6-, and 7-APBT but not 3- and 4-APBT (Figure 7), which suggested that a combined use of two derivatization methods would allow for the discrimination of all six isomers. EI mass spectra using derivatized 6-APBT are also shown on Figure 7 and it was noticed that no major mass spectral differences existed between each isomer undergoing the various derivatizations (not shown), thus, rendering the various examples shown in Figure 7 representative for all other isomers. Proposed identities of key fragments and suggested fragmentation pathways are included as Supporting Information. Interestingly, with the ethoxycarbonyl derivatives, a difference in the m/z 121/115 ratio was noticed which was thought to be potentially useful for the purpose of discrimination, for example when used in an extracted ion chromatogram format. The ratio was higher for the 4-, 5-, 6-, and 7-APBT isomers compared with the 2- and 3-APBT derivatives (Supporting Information).
Figure 7.
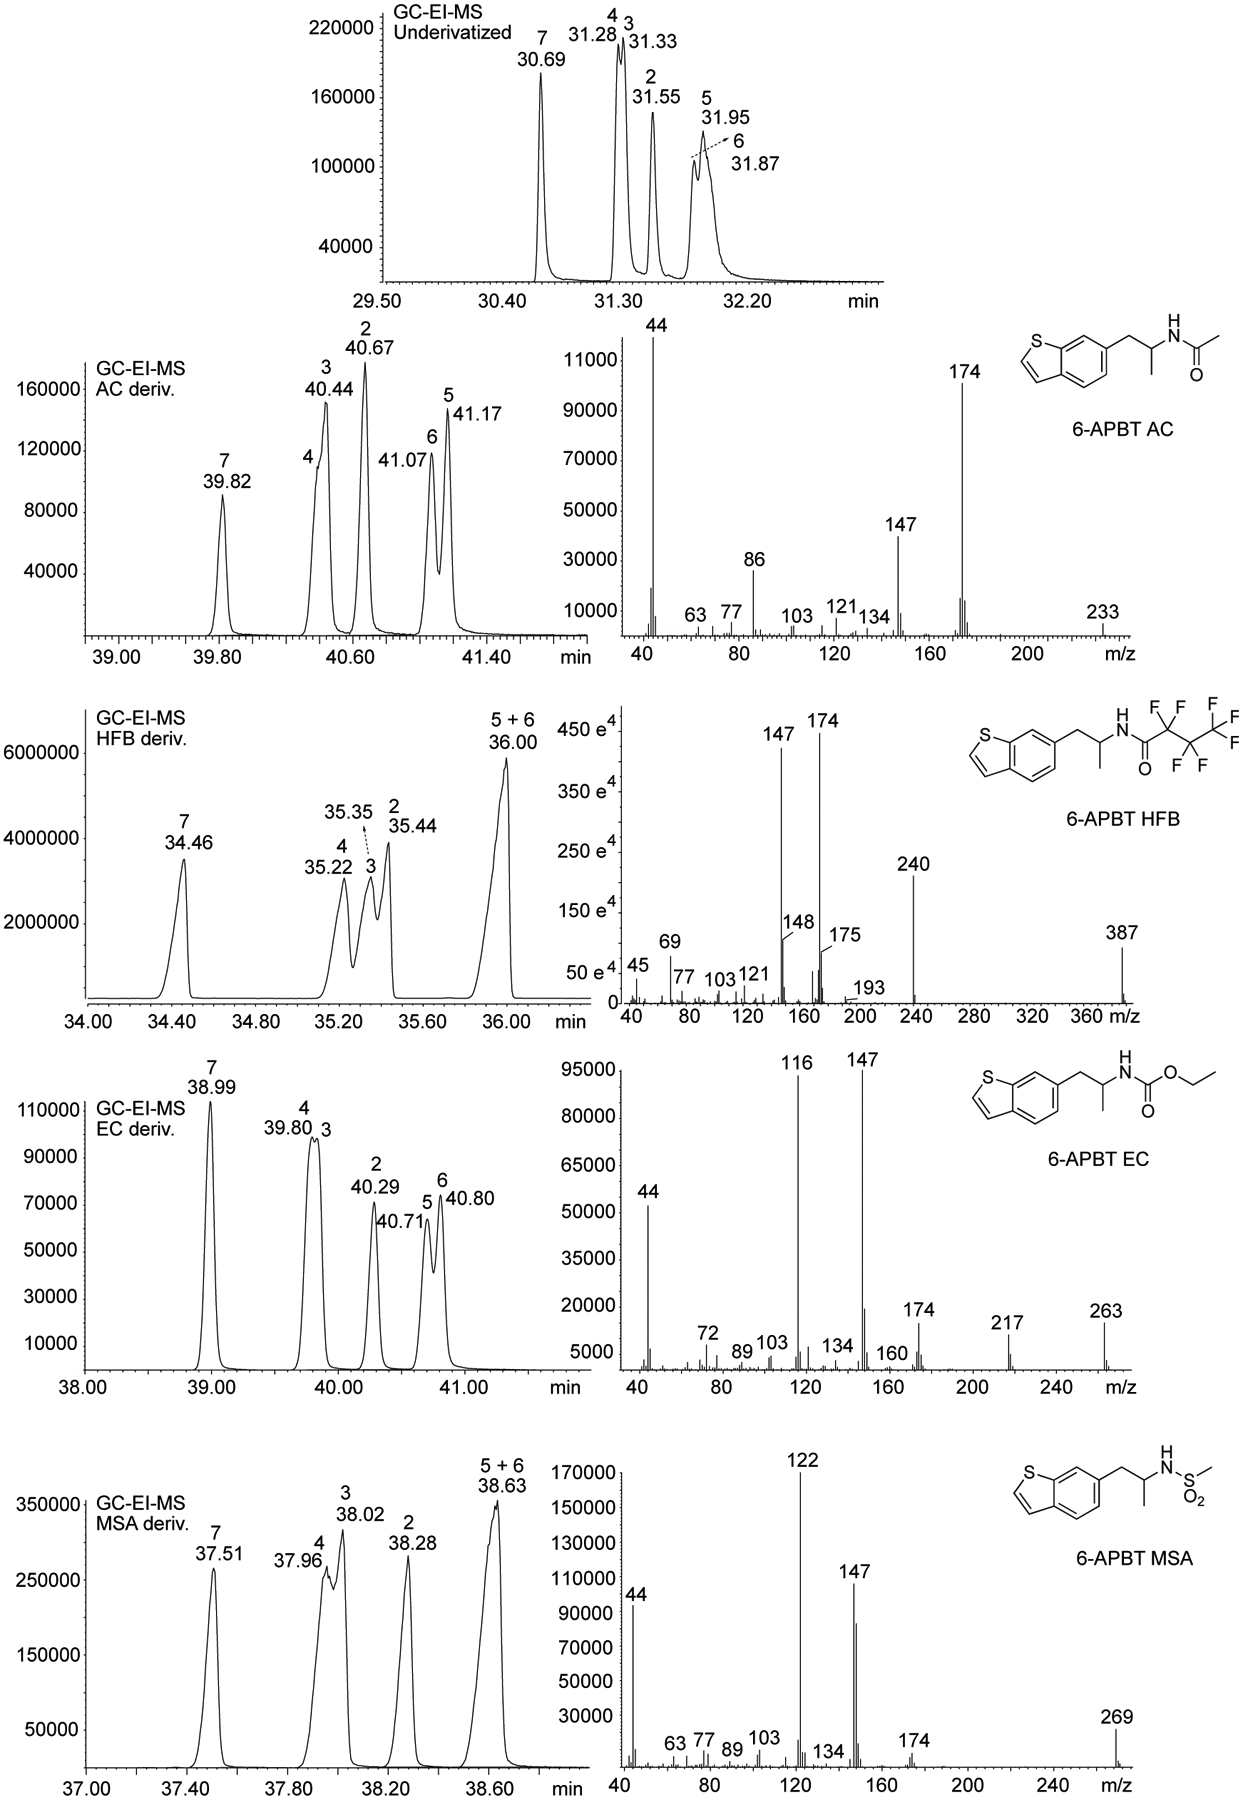
Left panel. Gas chromatography analysis method 2 following derivatizations with acetic anhydride (acetamido, AC), heptfluorobutyric anhydride (heptafluorobutyryl, HFB), ethyl chloroformate (ethoxycarbonyl, EC), and methanesulfonyl chloride (methanesulfonamide, MSA). Right panel. Representative EI mass spectra of derivatized analytes. Mass spectra for all isomers across all derivatizations methods were identical (not shown).
Under HPLC conditions, the use of a pentafluorophenyl stationary phase led to separations between 2-, 3-, 6-, and 7-APBT but not 4- and 5-APBT when analyzed underivatized and as methanesulfonamide derivatives (Figure 8). Derivatizations with AC and HFB did not lead to any improvements (data not shown). Previous work on positional isomers of the API-type also showed a favorable separation with a pentafluorophenyl column where N-methyltryptamine, 3-, 4-, 5-, and 6-API (but not 2- and 7-API) could be differentiated52 which was particularly useful since 3-API (AMT) and 5-API (5-IT) were seen to be among the more common isomers of this series in circulation on the drug market at that time. Employing the LC-ESI-QTOF-MS method resulted in satisfactory separation of underivatized analytes apart from 3- and 4-APBT (Figure 8).
Figure 8.
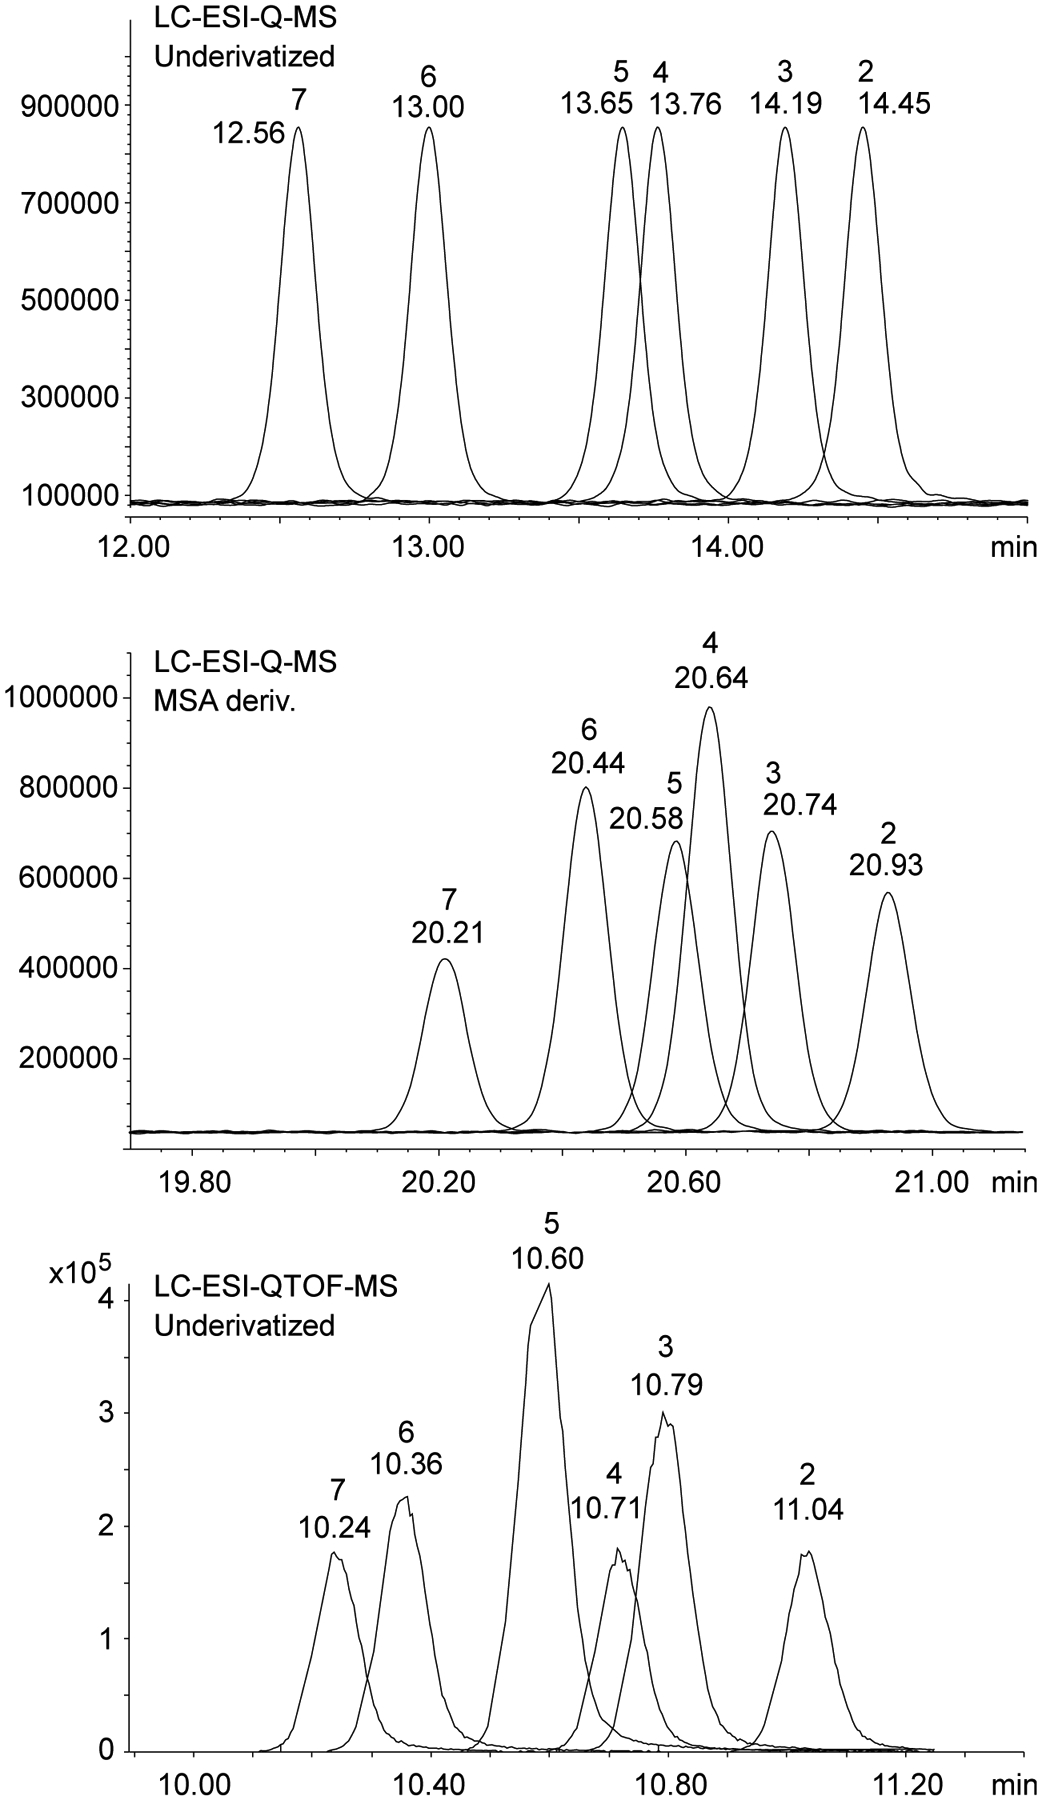
Top. HPLC-MS analysis of underivatized APBT isomers. Middle. HPLC-MS analysis of methanesulfonamide (MSA) derivatives. Bottom. HPLC-QTOF-MS analysis of underivatized APBT isomers.
3.3. Spectroscopic features
Spectral data obtained from nuclear magnetic resonance spectroscopy (NMR) are summarized in Table 1 with all 1D and 2D spectra being provided as Supporting Information. Analysis by 1H NMR spectroscopy was also evaluated for the purpose of isomer differentiation and it was found that the distribution of resonances representing the benzo[b]thiophene nucleus (aromatic region in the NMR spectra) was distinctive and therefore considered useful should the need for forensic investigation arise (Figure 9). The protonated primary amine function (HCl salt) integrating to three protons was visible as broad singlet and resonated between 8.08 ppm (2-APBT HCl) and 8.32 ppm (7-APBT HCl) (Table 1). Each proton of the prochiral methylene group (H-8) in the side chain was observed as a distinct doublet of doublets due to geminal coupling and coupling to the α-CH group (H-9) that was classified as a multiplet. The methyl group (H-10) attached to the α-carbon was visible as a doublet. In the cases of 5-, 6-, and 7-APBT, two-dimensional analysis by HSQC (Supporting Information) revealed that the methylene carbon (C-8) coalesced with the DMSO solvent peak (~40 ppm), whereas in cases of 2-, 3-, and 4-APBT it resonated at 35.42, 33.40, and 38.72 ppm, respectively, and therefore clearly visible.
Table 1.
NMR data recorded for all six APBT isomers in CDCl3 (600/150 MHz).
| Isomer | 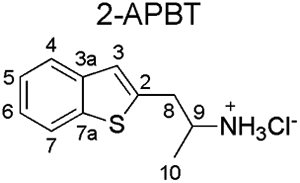 |
 |
 |
 |
 |
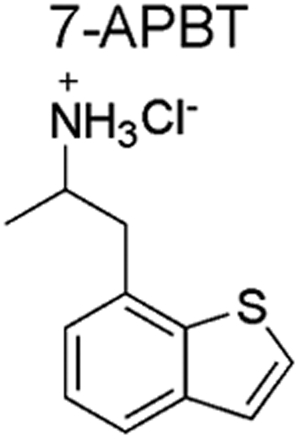 |
||||||
|---|---|---|---|---|---|---|---|---|---|---|---|---|
| Position | 1H | 13C | 1H | 13C | 1H | 13C | 1H | 13C | 1H | 13C | 1H | 13C |
| 2 | – | 140.00 | 7.62 (s, 1H) | 125.43 | 7.83 (d, J = 5.5 Hz, 1H) | 128.03 | 7.77 (d, J = 5.4 Hz, 1H) | 128.34 | 7.73 (d, J = 5.4 Hz, 1H) | 127.56 | 7.77 (d, J = 5.4 Hz, 1H) | 127.43 |
| 3 | 7.31 (s, 1H) | 124.03 | – | 131.64 | 7.76 (dd, J = 5.5, 0.6 Hz, 1H) | 122.68 | 7.44 (dd, J = 5.4, 0.6 Hz, 1H) | 124.27 | 7.44 (d, J = 5.4 Hz, 1H) | 124.19 | 7.49 (d, J = 5.4 Hz, 1H) | 125.25 |
| 3a | – | 140.18 | – | 139.00 | – | 139.33 | – | 140.30 | – | 138.78 | – | 140.41 |
| 4 | 7.80 (d, J = 7.6 Hz, 1H) | 123.69 | 7.97 (d, J = 7.6 Hz, 1H) | 122.34 | – | 132.25 | 7.76 (d, J = 1.1 Hz, 1H) | 124.62 | 7.85 (d, J = 8.1 Hz, 1H) | 124.13 | 7.80 (d, J = 7.5 Hz, 1H) | 123.04 |
| 5 | 7.39–7.35 (m, 1H) | 124.92 | 7.46–7.43 (m, 1H) | 124.67 | 7.25 (d, J = 6.9 Hz, 1H) | 125.97 | – | 133.38 | 7.28 (dd, J = 8.1, 1.3 Hz, 1H) | 126.35 | 7.37 (t, J = 7.6 Hz, 1H) | 125.31 |
| 6 | 7.35–7.32 (m, 1H) | 124.60 | 7.42–7.39 (m, 1H) | 124.90 | 7.35–7.32 (m, 1H) | 124.81 | 7.27 (dd, J = 8.2, 1.6 Hz, 1H) | 126.22 | – | 133.52 | 7.26 (d, J = 7.2 Hz, 1H) | 125.30 |
| 7 | 7.93 (d, J = 7.9 Hz, 1H) | 122.79 | 8.01 (d, J = 7.8 Hz, 1H) | 123.50 | 7.93 (d, J = 8.1 Hz) | 121.94 | 7.97 (d, J = 8.2 Hz, 1H) | 123.18 | 7.89 (s, 1H) | 123.42 | – | 131.35 |
| 7a | – | 139.54 | – | 140.27 | – | 140.14 | – | 138.14 | – | 139.95 | – | 139.94 |
| 3.09 (dd, J = 14.6, 8.3 Hz, 1H) | 3.01 (dd, J = 14.1, 9.1 Hz, 1H) | 3.01 (dd, J = 13.1, 9.4 Hz, 1H) | 2.82 (dd, J = 13.4, 8.8 Hz, 1H) | 2.83 (dd, J = 13.4, 8.8 Hz, 1H) | 2.95 (dd, J = 13.7, 9.8 Hz, 1H) | |||||||
| 9 | 3.54–3.48 (m,1H) | 48.21 | 3.53–3.47 (m, 1H) | 46.93 | 3.47–3.40 (m, 1H) | 48.00 | 3.50–3.42 (m, 1H) | 48.68 | 3.50–3.44 (m, 1H) | 48.60 | 3.66–3.56 (m, 1H) | 46.92 |
| 10 | 1.24 (d, J = 6.5 Hz, 3H) | 18.33 | 1.20 (d, J = 6.5 Hz, 3H) | 18.45 | 1.14 (d, J = 6.5 Hz, 1H) | 18.13 | 1.16 (d, J = 6.5 Hz, 1H) | 18.12 | 1.16 (d, J = 6.5 Hz, 1H) | 18.15 | 1.13 (d, J = 6.5 Hz, 1H) | 18.41 |
| +NH3 | 8.08 (brs, 3H) | – | 8.28 (brs, 3H) | – | 8.31 (brs, 3H) | – | 8.19 (brs, 3H) | – | 8.22 (brs, 3H) | – | 8.32 (brs, 3H) | – |
Figure 9.
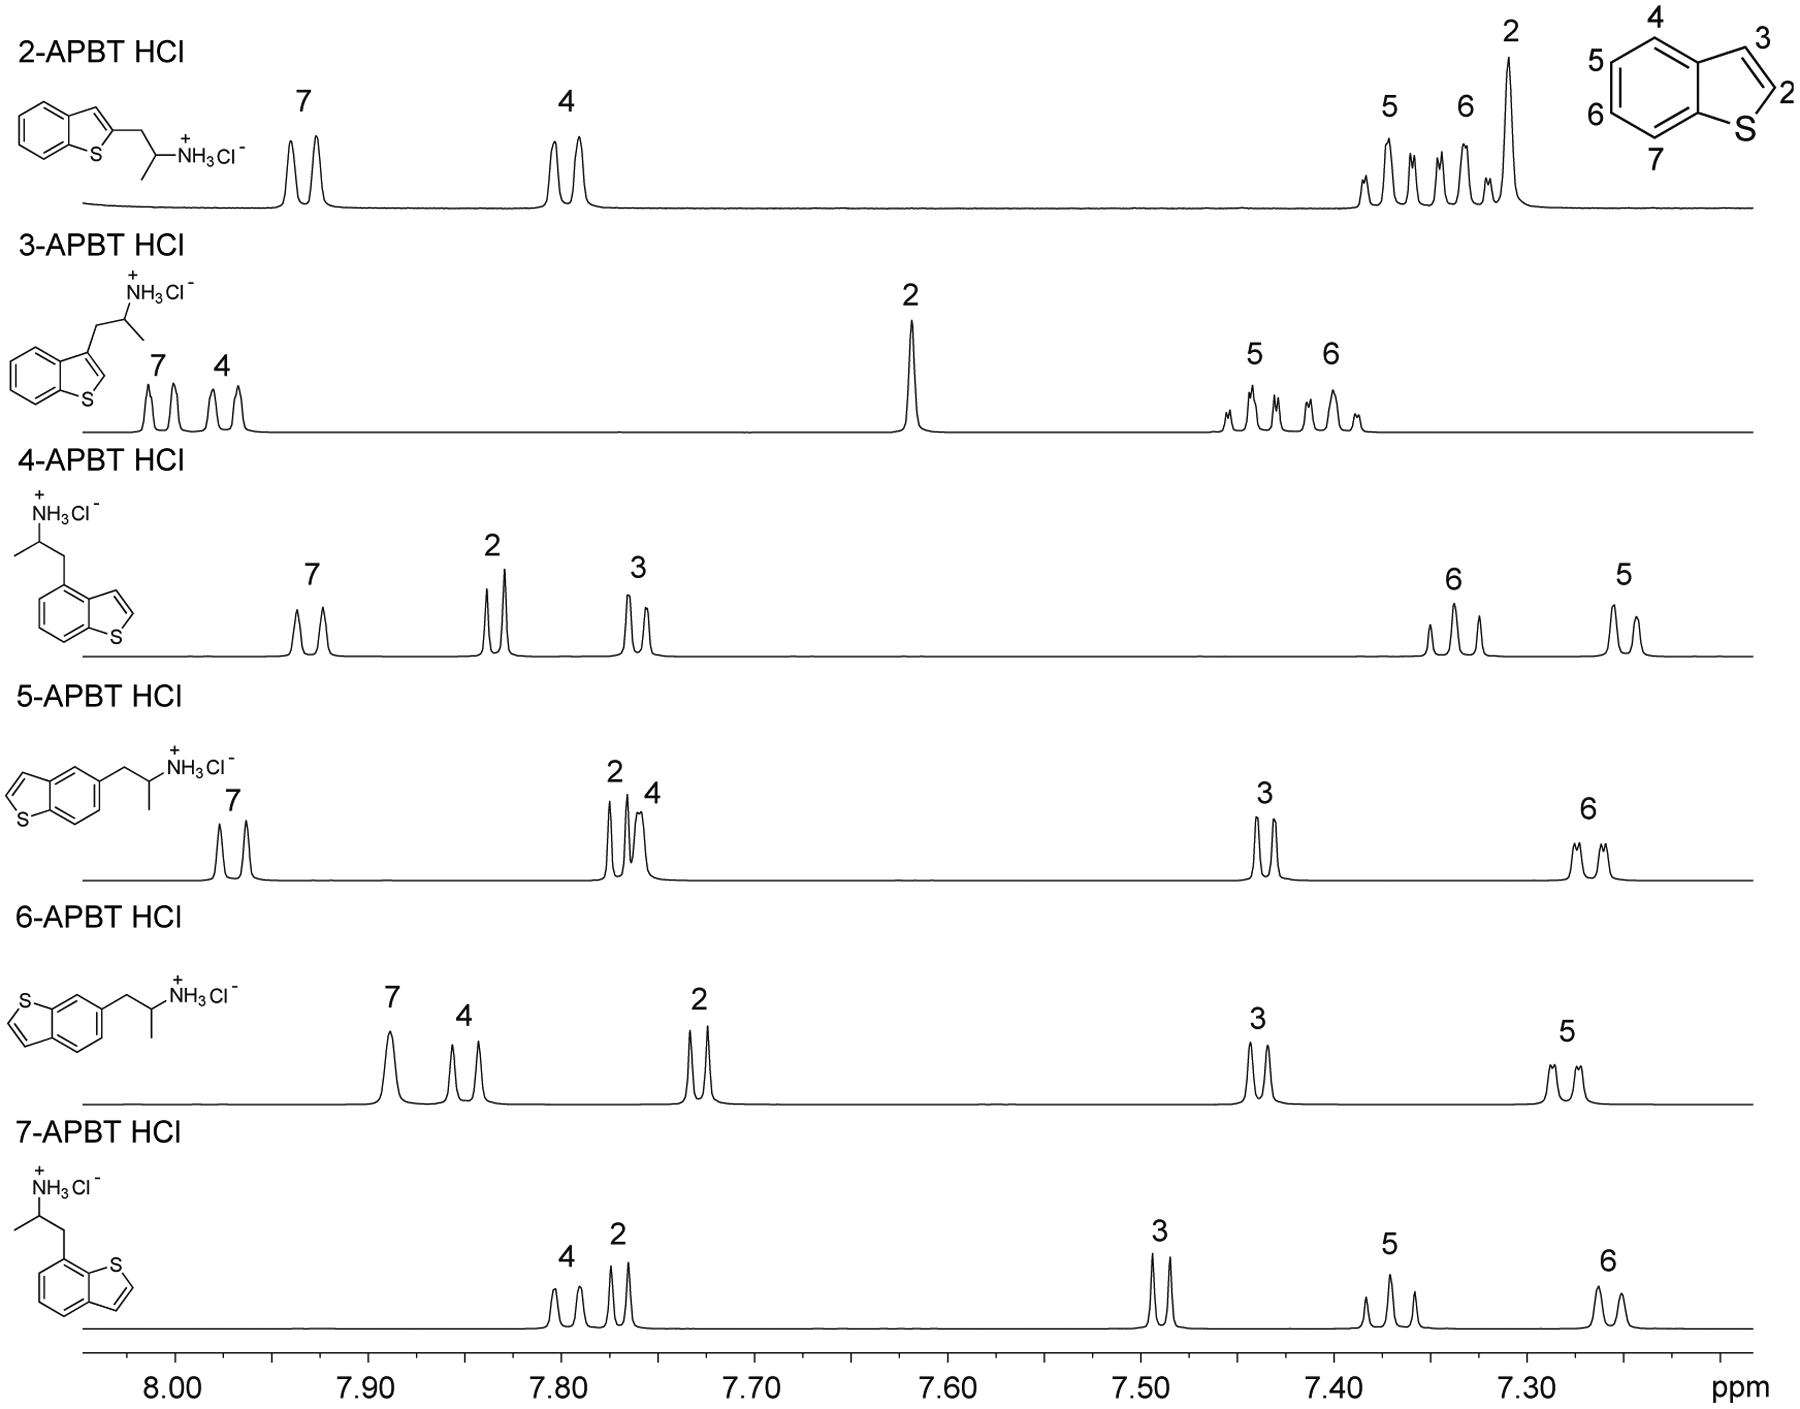
1H NMR spectroscopy results (aromatic region) of all six APBT isomers.
All infrared spectra (ATR of HCl salts and base plus GC condensed phase IR) have been provided as Supporting Information. Even though analysis by GC-MS confirmed that electron ionization mass spectra were identical as expected (see above), the implementation of GC-sIR on the other hand proved helpful in obtaining differentiating information in the condensed phase IR spectra. Figure 10 shows partial spectra recorded under GC-sIR conditions and it was observable that the spectra could be differentiated with notable differences in the 700–800 and 1400–1500 cm−1 region. Differences in the clusters of bands possibly representing aromatic C-C stretches and in/out-of-plane bends were also observed as summarized in the Supporting Information and it seemed possible that there might have been the detection of C-S stretches64 within he C-H out-of-plane region and a C-N stretch in the in-plane region. In addition, a closer inspection of the aromatic overtone bands (~1700–2000 cm−1)65 revealed the identification of spectral similarities between 2- and 3-APBT (four adjacent hydrogens on benzene ring), 4- and 7-APBT (four adjacent hydrogens on benzene ring), and 5- and 6-APBT (two adjacent hydrogens and one isolated hydrogen on benzene ring). A direct spectral comparison in the 650–1650 cm−1 region however also facilitated differentiating features as shown in the Supporting Information section.
Figure 10.
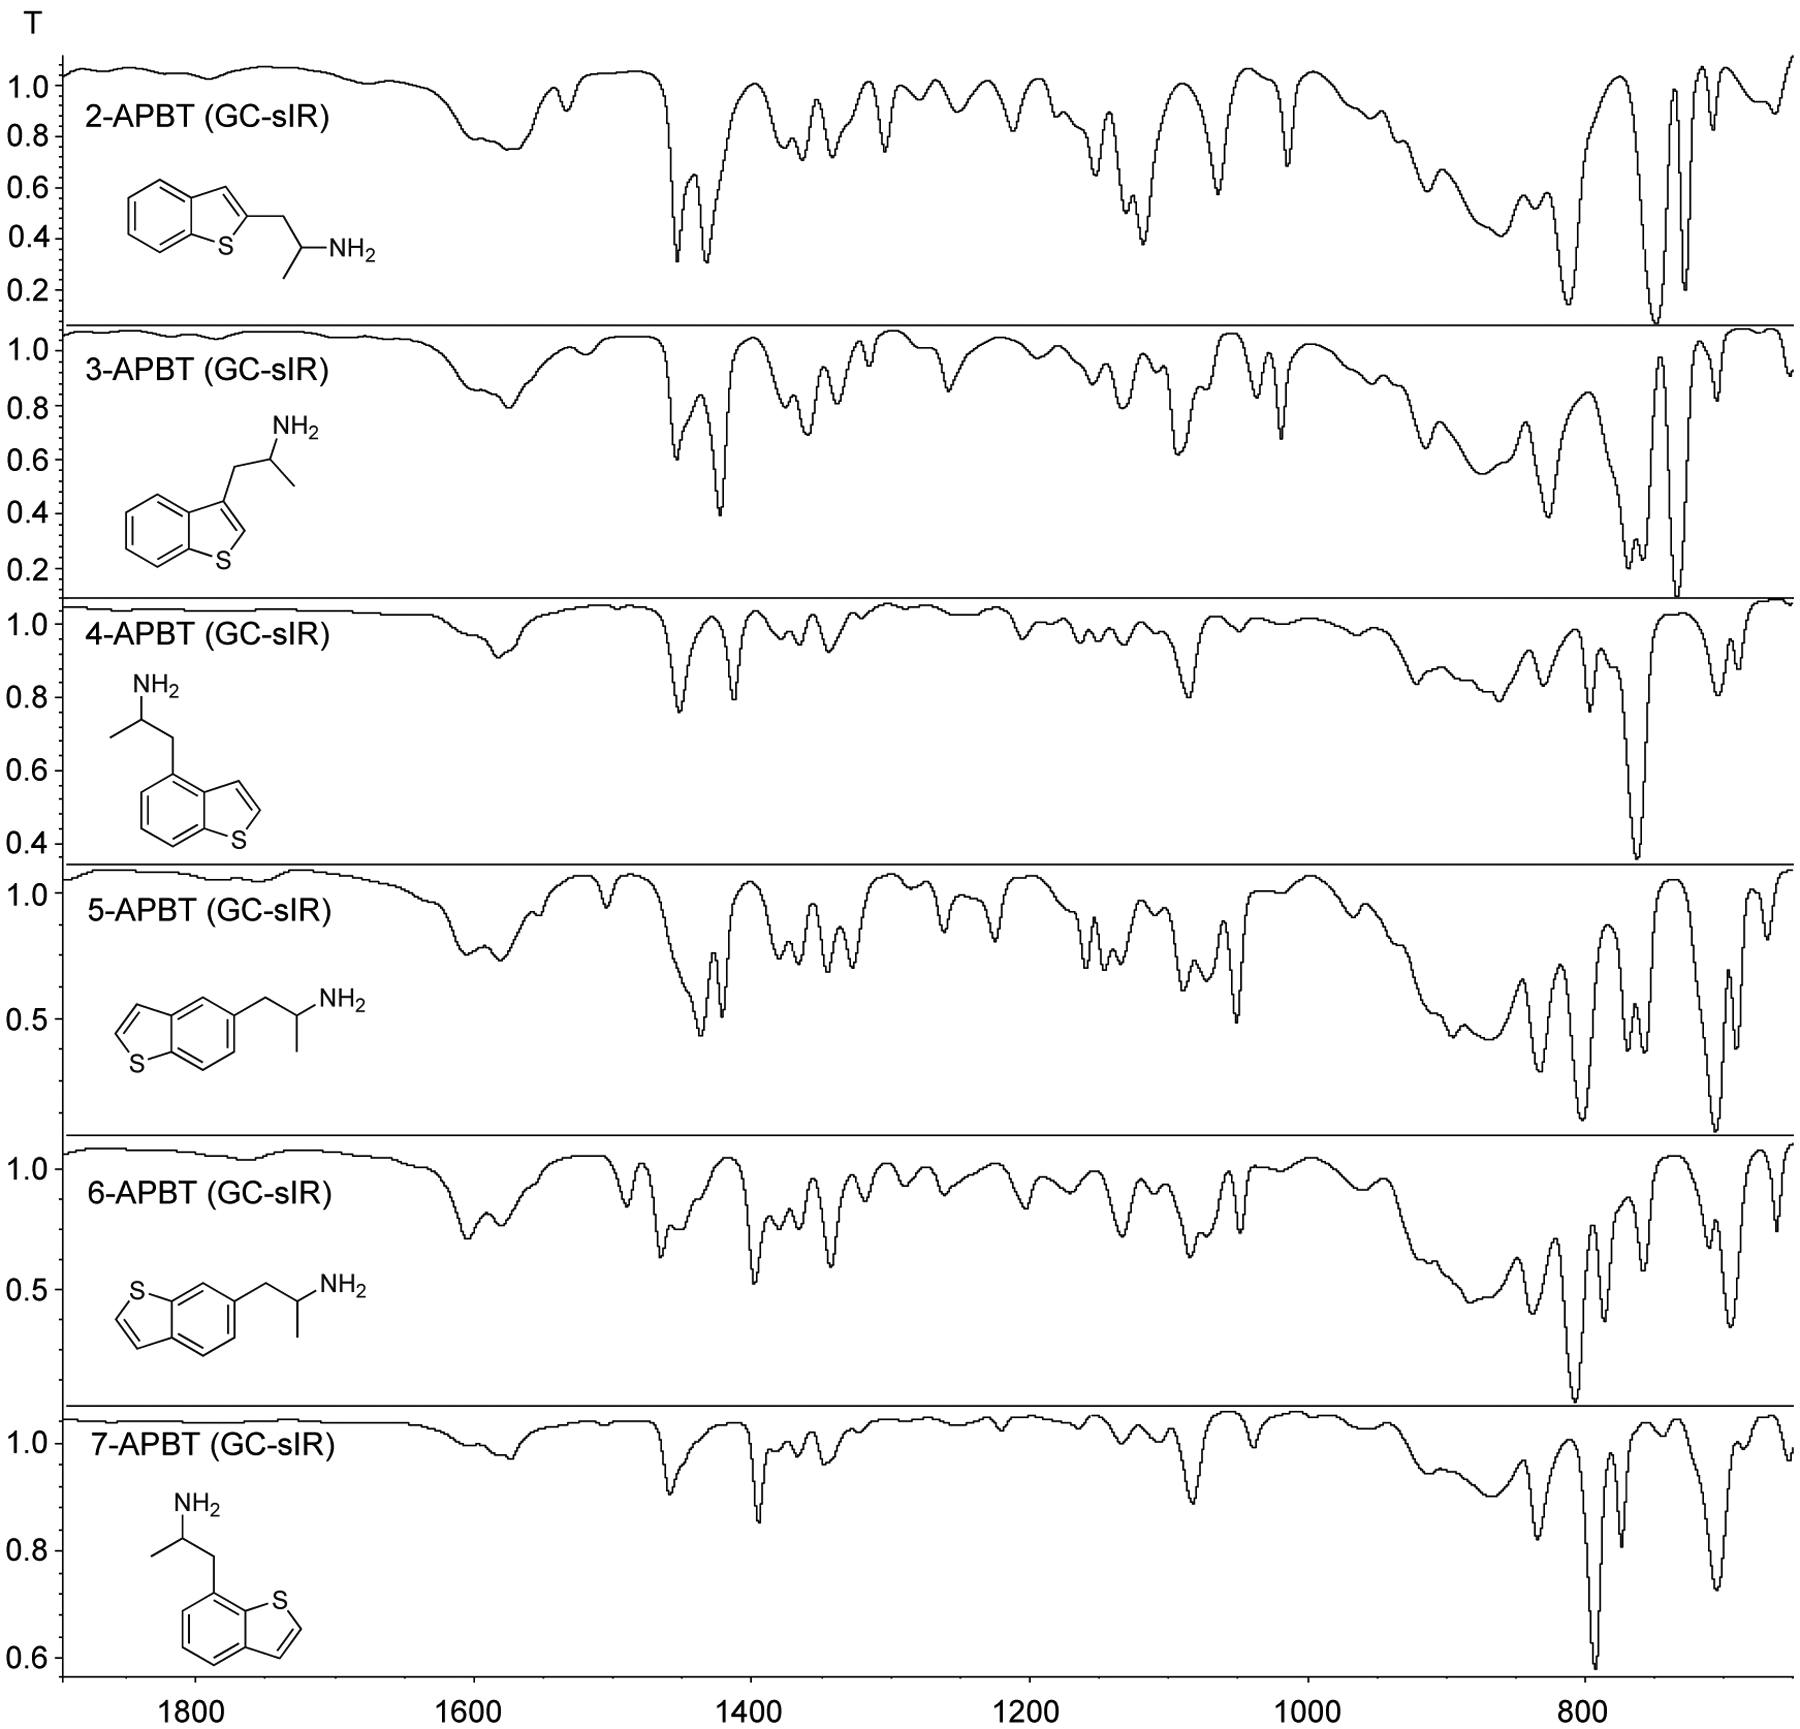
Partial GC condensed phase IR spectra of all six APBT isomers. Full spectra have been supplied as Supporting Information.
4. Conclusion
The results of in-depth analytical characterizations of six novel (2-aminopropyl)benzo[b]thiophene (APBT)-based psychostimulants were reported in a proactive effort to support research with these substances. From a forensic and clinical perspective, the ability to differentiate between the isomers of APBT can be an analytical challenge, especially if standard reference material is unavailable. From a gas chromatographic viewpoint, the combined conversion into heptafluorobutyryl and ethoxycarbonyl (or heptafluorobutyryl and acetamido) derivatives proved particularly useful for their differentiation. 1H NMR spectroscopic investigations also aided the exploration of differences, principally by comparison of resonances in the aromatic regions. Even though it was not possible to separate all of the underivatized APBT isomers by GC analysis alone, the combination with electron ionization tandem mass spectrometry (MS) and chemical ionization (CI) single- and tandem MS also added distinctive information about isomers involved. For example, implementation of GC-CI-MS/MS analysis using the m/z 177 ion as the precursor gave distinctive mass spectra that allowed for such differentiations to occur. Finally, analysis of all isomers by various infrared (IR) measurements, including GC condensed phase IR also resulted in the recording of distinctive spectra. Currently, there does not appear to be any indication that these particular drugs have emerged as new NPS but one lesson learned from the new drug phenomenon is that a proactive approach is needed to inform the work of forensic and clinical investigators.
Supplementary Material
Acknowledgements
The authors are grateful to the Erasmus Student Exchange Program for the support of L.C.
References
- 1.Baumann MH, Glennon RA, Wiley JL, eds. Neuropharmacology of New Psychoactive Substances (NPS). The Science Behind the Headlines. Cham, Switzerland: Springer International Publishing; 2017. Current Topics in Behavioral Neurosciences; No. 32. [Google Scholar]
- 2.Maurer HH, Brandt SD, eds. New Psychoactive Substances. Pharmacology, Clinical, Forensic and Analytical Toxicology. Cham, Switzerland: Springer Nature Switzerland AG; 2019. Handbook of Experimental Pharmacology; No. 252. [Google Scholar]
- 3.Herraiz T, Brandt SD. 5-(2-Aminopropyl)indole (5-IT): a psychoactive substance used for recreational purposes is an inhibitor of human monoamine oxidase (MAO). Drug Test Anal. 2014;6(7–8):607–613. [DOI] [PubMed] [Google Scholar]
- 4.Marusich JA, Antonazzo KR, Blough BE, et al. The new psychoactive substances 5-(2-aminopropyl)indole (5-IT) and 6-(2-aminopropyl)indole (6-IT) interact with monoamine transporters in brain tissue. Neuropharmacology. 2016;101:68–75. [DOI] [PMC free article] [PubMed] [Google Scholar]
- 5.Wagmann L, Brandt SD, Kavanagh PV, Maurer HH, Meyer MR. In vitro monoamine oxidase inhibition potential of alpha-methyltryptamine analog new psychoactive substances for assessing possible toxic risks. Toxicol Lett. 2017;272:84–93. [DOI] [PubMed] [Google Scholar]
- 6.Luethi D, Kolaczynska KE, Docci L, Krahenbuhl S, Hoener MC, Liechti ME. Pharmacological profile of mephedrone analogs and related new psychoactive substances. Neuropharmacology. 2018;134(Pt A):4–12. [DOI] [PubMed] [Google Scholar]
- 7.Botanas CJ, Yoon SS, de la Pena JB, et al. A new synthetic drug 5-(2-aminopropyl)indole (5-IT) induces rewarding effects and increases dopamine D1 receptor and dopamine transporter mRNA levels. Behav Brain Res. 2018;341:122–128. [DOI] [PubMed] [Google Scholar]
- 8.Elliott SP, Brandt SD, Freeman S, Archer RP. AMT (3-(2-aminopropyl)indole) and 5-IT (5-(2-aminopropyl)indole): an analytical challenge and implications for forensic analysis. Drug Test Anal. 2013;5(3):196–202. [DOI] [PubMed] [Google Scholar]
- 9.Boland DM, Andollo W, Hime GW, Hearn WL. Fatality due to acute α-methyltryptamine intoxication. J Anal Toxicol. 2005;29(5):394–397. [DOI] [PubMed] [Google Scholar]
- 10.Kamour A, James D, Spears R, et al. Patterns of presentation and clinical toxicity after reported use of alpha methyltryptamine in the United Kingdom. A report from the UK National Poisons Information Service. Clin Toxicol. 2014;52(3):192–197. [DOI] [PubMed] [Google Scholar]
- 11.Elliott S, Evans J. A 3-year review of new psychoactive substances in casework. Forensic Sci Int. 2014;243:55–60. [DOI] [PubMed] [Google Scholar]
- 12.Chretien B, Bourgine J, Hamel Senecal L, et al. Severe serotonin syndrome in an autistic new psychoactive substance user after consumption of pills containing methoxphenidine and α-methyltryptamine. J Clin Psychopharmacol. 2018;38(1):94–96. [DOI] [PubMed] [Google Scholar]
- 13.Kronstrand R, Roman M, Dahlgren M, Thelander G, Wikström M, Druid H. A cluster of deaths involving 5-(2-aminopropyl)indole (5-IT). J Anal Toxicol. 2013;37(8):542–546. [DOI] [PubMed] [Google Scholar]
- 14.Seetohul LN, Pounder DJ. Four fatalities involving 5-IT. J Anal Toxicol. 2013;37(7):447–451. [DOI] [PubMed] [Google Scholar]
- 15.Bäckberg M, Beck O, Hultén P, Rosengren-Holmberg J, Helander A. Intoxications of the new psychoactive substance 5-(2-aminopropyl)indole (5-IT): a case series from the Swedish STRIDA project. Clin Toxicol. 2014;52(6):6618–6624. [DOI] [PubMed] [Google Scholar]
- 16.European Monitoring Centre for Drugs and Drug Addiction (EMCDDA). 5-(2-Aminopropyl)indole (5-IT). Report on the risk assessment of 5-(2-aminopropyl)indole in the framework of the Council Decision on new psychoactive substances. Lisbon. Available at: http://www.emcdda.europa.eu/attachements.cfm/att_222688_EN_TDAK13002ENN-1_.pdf. [Accessed 15 February 2020]. 2014. [Google Scholar]
- 17.Briner K, Burkhart JP, Burkholder TP, et al. Aminoalkylbenzofurans as serotonin (5-HT(2C)) agonists. Eli Lilly and Company, Indianapolis, IN, USA. WO2000044737A1. 2000. [Google Scholar]
- 18.European Monitoring Centre for Drugs and Drug Addiction (EMCDDA). EMCDDA-Europol 2010 Annual Report on the implementation of Council Decision 2005/387/JHA. Lisbon. 2011. Available at: http://www.emcdda.europa.eu/system/files/publications/644/EMCDDA-Europol_Annual_Report_2010A_281336.pdf [15 February 2020]. [Google Scholar]
- 19.European Monitoring Centre for Drugs and Drug Addiction (EMCDDA). EMCDDA-Europol 2011 Annual Report on the implementation of Council Decision 2005/387/JHA. Lisbon, Portugal. 2012. Available at: http://www.emcdda.europa.eu/system/files/publications/689/EMCDDA-Europol_Annual_Report_2011_2012_final_335568.pdf [23 April 2020]. [Google Scholar]
- 20.Iversen L, Gibbons S, Treble R, Setola V, Huang X-P, Roth BL. Neurochemical profiles of some novel psychoactive substances. Eur J Pharmacol. 2013;700(1–3):147–151. [DOI] [PMC free article] [PubMed] [Google Scholar]
- 21.Dawson P, Opacka-Juffry J, Moffatt JD, et al. The effects of benzofury (5-APB) on the dopamine transporter and 5-HT2-dependent vasoconstriction in the rat. Prog Neuro Psychopharmacol Biol Psychiatry. 2014;48:57–63. [DOI] [PubMed] [Google Scholar]
- 22.Rickli A, Kopf S, Hoener MC, Liechti ME. Pharmacological profile of novel psychoactive benzofurans. Br J Pharmacol. 2015;172(13):3412–3425. [DOI] [PMC free article] [PubMed] [Google Scholar]
- 23.Shimshoni JA, Winkler I, Golan E, Nutt D. Neurochemical binding profiles of novel indole and benzofuran MDMA analogues. Naunyn Schmiedebergs Arch Pharmacol. 2017;390(1):15–24. [DOI] [PubMed] [Google Scholar]
- 24.Zwartsen A, Verboven AHA, van Kleef R, Wijnolts FMJ, Westerink RHS, Hondebrink L. Measuring inhibition of monoamine reuptake transporters by new psychoactive substances (NPS) in real-time using a high-throughput, fluorescence-based assay. Toxicol In Vitro. 2017;45(Pt 1):60–71. [DOI] [PubMed] [Google Scholar]
- 25.Hondebrink L, Zwartsen A, Westerink RHS. Effect fingerprinting of new psychoactive substances (NPS): what can we learn from in vitro data? Pharmacol Ther. 2018;182:193–224. [DOI] [PubMed] [Google Scholar]
- 26.Dolan SB, Forster MJ, Gatch MB. Discriminative stimulus and locomotor effects of para-substituted and benzofuran analogs of amphetamine. Drug Alcohol Depend. 2017;180:39–45. [DOI] [PMC free article] [PubMed] [Google Scholar]
- 27.Chan WL, Wood DM, Hudson S, Dargan PI. Acute psychosis associated with recreational use of benzofuran 6-(2-aminopropyl)benzofuran (6-APB) and cannabis. J Med Toxicol. 2013;9(3):278–281. [DOI] [PMC free article] [PubMed] [Google Scholar]
- 28.McIntyre IM, Gary RD, Trochta A, Stolberg S, Stabley R. Acute 5-(2-aminopropyl)benzofuran (5-APB) intoxication and fatality: a case report with postmortem concentrations. J Anal Toxicol. 2015;39(2):156–159. [DOI] [PubMed] [Google Scholar]
- 29.Adamowicz P, Zuba D, Byrska B. Fatal intoxication with 3-methyl-N-methylcathinone (3-MMC) and 5-(2-aminopropyl)benzofuran (5-APB). Forensic Sci Int. 2014;245:126–132. [DOI] [PubMed] [Google Scholar]
- 30.Barceló B, Gomila I, Rotolo MC, et al. Intoxication caused by new psychostimulants: analytical methods to disclose acute and chronic use of benzofurans and ethylphenidate. Int J Legal Med. 2017;131(6):1543–1553. [DOI] [PubMed] [Google Scholar]
- 31.Labutin AV, Temerdashev AZ. Identification of (2-aminopropyl)benzofuran and its metabolites in human urine. J Anal Chem. 2017;72(7):770–776. [Google Scholar]
- 32.Krpo M, Luytkis HC, Haneborg AM, Hoiseth G. A fatal blood concentration of 5-APB. Forensic Sci Int. 2018;291:e1–e3. [DOI] [PubMed] [Google Scholar]
- 33.Kline Smith and Laboratories French. Improvements in or relating to β-aminoalkylthiananaphthene and β-aminoalkylbenzofuran derivatives. Smith Kline and French Laboratories, Philadelphia, USA. GB855115A. 1960. [Google Scholar]
- 34.Vallejos G, Fierro A, Rezende MC, Sepulveda-Boza S, Reyes-Parada M. Heteroarylisopropylamines as MAO inhibitors. Bioorg Med Chem. 2005;13(14):4450–4457. [DOI] [PubMed] [Google Scholar]
- 35.Campaigne E, Neiss ES, Pfeiffer CC, Beck RA. Benzo[b]thiophen derivatives. XII. Synthesis of some 3-benzo[b]thienylalkylamines and comparison of their central nervous system activity with tryptamine isosteres. J Med Chem. 1968;11(5):1049–1054. [DOI] [PubMed] [Google Scholar]
- 36.Winter JC, Gessner PK, Godse DD. Synthesis of some 3-indenealkylamines. Comparison of the biological activity of 3-indenealkylamines and 3-benzo[b]thiophenealkylamines with their tryptamine isosteres. J Med Chem. 1967;10(5):856–858. [DOI] [PubMed] [Google Scholar]
- 37.Poos GI. Anorexigenic Agents. Ann Rep Med Chem. Vol 2. New York: Academic Press; 1967:44–47. [Google Scholar]
- 38.Nenajdenko VG, Karpov AS, Balenkova ES. A new convenient approach to chiral β-aryl(heteroaryl)alkylamines. Tetrahedron: Asymmetry. 2001;12(18):2517–2527. [Google Scholar]
- 39.Edgerton WH. β-Thianaphthenylalkylhydrazines. Smith, Kline & French Laboratories. Philadelphia, USA. US2916495. 1959. [Google Scholar]
- 40.Gregor VE, Liu Y, Anikin A, et al. Preparation of imidazo[4,5-f]isoindole derivatives as tyrosine kinase inhibitors. ChemBridge Corporation, San Diego, USA. WO2009117097A1. 2009. [Google Scholar]
- 41.Goodacre SC, Labadie S, Li J, et al. Preparation of heteroaryl estrogen receptor modulators for treatment of cancer. F. Hoffmann-La Roche AG, Basel, Switzerland; Genentech, Inc., San Fancisco, USA. WO2017216279A1. 2017. [Google Scholar]
- 42.Yu S, Yang F, Chen L, et al. Piperidine derivative and preparation method and pharmaceutical use thereof. Jiangsu Hengrui Medicine Co. Ltd, Jiangsu, China; Shanghai Hengrui Pharmaceutical Co. Ltd., Shanghai, China. EP3312184A1. 2018. [Google Scholar]
- 43.Blicke FF, Burckhalter JH. α-Thienylaminoalkanes. J Am Chem Soc. 1942;64(3):477–480. [Google Scholar]
- 44.Casale J, Hays PA. Methiopropamine: an analytical profile. Microgram J. 2011;8(2):53–57. [Google Scholar]
- 45.Angelov D, O’Brien J, Kavanagh P. The syntheses of 1-(2-thienyl)-2-(methylamino) propane (methiopropamine) and its 3-thienyl isomer for use as reference standards. Drug Test Anal. 2013;5(3):145–149. [DOI] [PubMed] [Google Scholar]
- 46.Bouso ED, Gardner EA, O’Brien JE, Talbot B, Kavanagh PV. Characterization of the pyrolysis products of methiopropamine. Drug Test Anal. 2014;6(7–8):676–683. [DOI] [PubMed] [Google Scholar]
- 47.Chapman SJ. Novel psychoactive spectra: NMR of (mostly) novel psychoactive substances. Blotter 3(2). #Methiopropamine. 2018. Available at: 10.16889/isomerdesign-6 [23 April 2020]. [DOI] [Google Scholar]
- 48.European Monitoring Centre for Drugs and Drug Addiction (EMCDDA). EMCDDA-Europol 2012 Annual Report on the implementation of Council Decision 2005/387/JHA. Lisbon, Portugal. 2013. Available at: http://www.emcdda.europa.eu/system/files/publications/734/EMCDDA-Europol_2012_Annual_Report_final_439477.pdf [23 April 2020]. [Google Scholar]
- 49.Chapman SJ. Novel psychoactive spectra: NMR of (mostly) novel psychoactive substances. Blotter 3(2). #Thiopropamine. 2018. Available at: 10.16889/isomerdesign-6 [23 April 2020]. [DOI] [Google Scholar]
- 50.European Monitoring Centre for Drugs and Drug Addiction (EMCDDA). EMCDDA-Europol 2013 Annual Report on the implementation of Council Decision 2005/387/JHA. Lisbon, Portugal. 2014. Available at: http://www.emcdda.europa.eu/system/files/publications/814/TDAN14001ENN_475519.pdf [23 April 2020]. [Google Scholar]
- 51.Gambaro V, Casagni E, Dell’Acqua L, et al. Identification and characterization of a new designer drug thiothinone in seized products. Forensic Toxicol. 2016;34(1):174–178. [Google Scholar]
- 52.Scott KR, Power JD, McDermott SD, et al. Identification of (2-aminopropyl)indole positional isomers in forensic samples. Drug Test Anal. 2014;6(7–8):598–606. [DOI] [PubMed] [Google Scholar]
- 53.Stanczuk A, Morris N, Gardner EA, Kavanagh P. Identification of (2-aminopropyl)benzofuran (APB) phenyl ring positional isomers in Internet purchased products. Drug Test Anal. 2013;5(4):270–276. [DOI] [PubMed] [Google Scholar]
- 54.Casale JF, Hays PA. The characterization of 6-(2-aminopropyl)benzofuran and differentiation from its 4-, 5-, and 7-positional analogues. Microgram J. 2012;9(2):61–74. [Google Scholar]
- 55.Dawson PH, Sun W-F. A round robin on the reproducibility of standard operating conditions for the acquisition of library MS/MS spectra using triple quadrupoles. Int J Mass Spectrom Ion Processes. 1984;55(2):155–170. [Google Scholar]
- 56.Shulgin A, Shulgin A. PIHKAL: A Chemical Love Story. Berkeley, USA: Transform Press; 1991. [Google Scholar]
- 57.Kosugi M, Suzuki M, Hagiwara I, Goto K, Saitoh K, Migita T. A new palladium catalyzed aromatic acetonylation by acetonyltributyltin. Chem Lett. 1982;11(6):939–940. [Google Scholar]
- 58.D’Alo F, Masserini A, Bonacina F. N-Alchil-alcanolamine della serie tionaftenica. Boll Chim Farm. 1964;103(10):709–726. [PubMed] [Google Scholar]
- 59.Beynon JH, Saunders RA, Williams AE. The Mass Spectra of Organic Molecules. Amsterdam: Elsevier Publishing Company; 1968. [Google Scholar]
- 60.Porter QN. Mass-spectrometric studies. I. Benzo[b]thiophen, some alkyl and aryl derivatives, and the 1,1-dioxide and 2,3-dihydro-1,1-dioxide. Aust J Chem. 1967;20(1):103–116. [Google Scholar]
- 61.Dybek M, Wallach J, Kavanagh PV, et al. Syntheses and analytical characterizations of the research chemical 1-[1-(2-fluorophenyl)-2-phenylethyl]pyrrolidine (fluorolintane) and five of its isomers. Drug Test Anal. 2019;11(8):1144–1161. [DOI] [PubMed] [Google Scholar]
- 62.Westphal F, Rösner P, Junge T. Differentiation of regioisomeric ring-substituted fluorophenethylamines with product ion spectrometry. Forensic Sci Int. 2010;194(1–3):53–59. [DOI] [PubMed] [Google Scholar]
- 63.Westphal F, Junge T. Ring positional differentiation of isomeric N-alkylated fluorocathinones by gas chromatography/tandem mass spectrometry. Forensic Sci Int. 2012;223(1–3):97–105. [DOI] [PubMed] [Google Scholar]
- 64.Coelho RR, Hovell I, Rajagopal K. Elucidation of the functional sulphur chemical structure in asphaltenes using first principles and deconvolution of mid-infrared vibrational spectra. Fuel Process Technol. 2012;97:85–92. [Google Scholar]
- 65.McDonald FR, Cook GL. Infrared vibrations of benzene rings in condensed thiophenes. Washington, USA: United States Deptartment of the Interior, Bureau of Mines Report of Investigations 6911; 1967. [Google Scholar]
Associated Data
This section collects any data citations, data availability statements, or supplementary materials included in this article.


